Phenotypic and biochemical profile changes in calendula...
14
©FUNPEC-RP www.funpecrp.com.br Genetics and Molecular Research 15 (2): gmr.15028071 Phenotypic and biochemical profile changes in calendula (Calendula officinalis L.) plants treated with two chemical mutagenesis Y.I. El-Nashar 1,2 and A.A. Asrar 1 1 Plant Production Department, College of Food & Agricultural Sciences, King Saud University, Saudi Arabia 2 Ornamental Plants and Landscape Gardening Research Department, Horticultural Research Institute, Agricultural Research Center, Giza, Egypt Corresponding author: Y.I. El-Nashar E-mail: [email protected] Genet. Mol. Res. 15 (2): gmr.15028071 Received November 17, 2015 Accepted January 18, 2016 Published May 6, 2016 DOI http://dx.doi.org/10.4238/gmr.15028071 ABSTRACT. Chemical mutagenesis is an efficient tool used in mutation- breeding programs to improve the vital characters of the floricultural crops. This study aimed to estimate the effects of different concentrations of two chemical mutagens; sodium azide (SA) and diethyl sulfate (DES). The vegetative growth and flowering characteristics in two generations (M 1 and M 2 ) of calendula plants were investigated. Seeds were treated with five different concentrations of SA and DES (at the same rates) of 1000, 2000, 3000, 4000, and 5000 ppm, in addition to a control treatment of 0 ppm. Results showed that lower concentrations of SA mutagen had significant effects on seed germination percentage, plant height, leaf area, plant fresh weight, flowering date, inflorescence diameter, and gas-exchange measurements in plants of both generations. Calendula plants tended to flower earlier under low mutagen concentrations (1000 ppm), whereas higher concentrations delayed flowering significantly. Positive results on seed germination, plant height, number of branches, plant fresh weight, and leaf area were observed in the M 2 -generation at
Transcript of Phenotypic and biochemical profile changes in calendula...
©FUNPEC-RP www.funpecrp.com.brGenetics and Molecular Research 15 (2): gmr.15028071
Phenotypic and biochemical profile changes in calendula (Calendula officinalis L.) plants treated with two chemical mutagenesis
Y.I. El-Nashar1,2 and A.A. Asrar1
1Plant Production Department, College of Food & Agricultural Sciences, King Saud University, Saudi Arabia2Ornamental Plants and Landscape Gardening Research Department, Horticultural Research Institute, Agricultural Research Center, Giza, Egypt
Corresponding author: Y.I. El-NasharE-mail: [email protected]
Genet. Mol. Res. 15 (2): gmr.15028071Received November 17, 2015Accepted January 18, 2016Published May 6, 2016DOI http://dx.doi.org/10.4238/gmr.15028071
ABSTRACT. Chemical mutagenesis is an efficient tool used in mutation-breeding programs to improve the vital characters of the floricultural crops. This study aimed to estimate the effects of different concentrations of two chemical mutagens; sodium azide (SA) and diethyl sulfate (DES). The vegetative growth and flowering characteristics in two generations (M1 and M2) of calendula plants were investigated. Seeds were treated with five different concentrations of SA and DES (at the same rates) of 1000, 2000, 3000, 4000, and 5000 ppm, in addition to a control treatment of 0 ppm. Results showed that lower concentrations of SA mutagen had significant effects on seed germination percentage, plant height, leaf area, plant fresh weight, flowering date, inflorescence diameter, and gas-exchange measurements in plants of both generations. Calendula plants tended to flower earlier under low mutagen concentrations (1000 ppm), whereas higher concentrations delayed flowering significantly. Positive results on seed germination, plant height, number of branches, plant fresh weight, and leaf area were observed in the M2-generation at
2Y.I. El-Nashar and A.A. Asrar
©FUNPEC-RP www.funpecrp.com.brGenetics and Molecular Research 15 (2): gmr.15028071
lower concentrations of SA (1000 ppm), as well as at 4000 ppm DES on number of leaves and inflorescences. The highest total soluble protein was detected at the concentrations of 1000 ppm SA and 2000 ppm DES. DES showed higher average of acid phosphatase activity than SA. Results indicated that lower concentrations of SA and DES mutagens had positive effects on seed germination percentage, plant height, leaf area, plant fresh weight, flowering date, inflorescence diameter, and gas-exchange measurements. Thus, lower mutagen concentrations could be recommended for better floral and physio-chemical performance.
Key words: Diethyl sulfate; Enzyme activity; Gas-exchange; Mutation; Sodium azide
INTRODUCTION
Calendula officinalis L. is an annual herb belonging to the family Asteraceae, native to the Mediterranean region. It is cultivated for ornamental and medicinal purposes in Europe and Americas. In the last decade, there were more than 2543 mutant cultivars derived from 175 plant species including ornamentals, cereals, oilseeds, pulses, vegetables, fruits, and fibers released in 50 countries worldwide (Chopra, 2005). Chemical mutagenesis is a simple approach used to create mutation in economically valuable plants, for improvement of their agronomic parameters. In any mutation-breeding program, selection of an effective and efficient mutagen is essential to produce a high frequency of desirable mutations (Roychowdhury and Tah, 2011).
Many chemical mutagens have been employed to obtain useful mutants in various crop species (Singh and Singh, 2001). Several studies have emphasized that artificial induction of mutations by sodium azide (SA) and diethyl sulfate (DES) provides a tool to overcome the limitations in variability in floricultural plants, especially carnations. These chemicals induce growth abnormalities, due to their effects on cell death and suppression of mitosis (Mensah and Obadoni, 2007; Roychowdhury and Tah, 2011). SA and DES are responsible for creating point DNA mutations that induce genetic variability. Thus, they are considered important tools to enhance agronomic traits in several economic plant species (Tah, 2006). The role of mutation breeding in increasing the genetic variability for desired agronomic traits in various plant species has been demonstrated in a number of studies (e.g., Mostafa, 2011; Roychowdhury et al., 2012).
The mutagen dose is a prime consideration in any mutagenesis program. Generally, higher concentrations of the mutagen lead to greater biological damage in the form of reduced seed germination, seedling injury, pollen sterility, and reduced survival at maturity, which could be considered an indication of the mutagenic effects (Gaul, 1964). To reduce the negative effects on plant parameters, more knowledge about the influence of exposure time and mutagen concentrations are required (Khan et al., 2009).
It is important to induce genetic variability by means of mutagens such as SA and DES in plant mutation programs (Hussein et al., 1974; Abd El-Maksoud and El-Mahrouk, 1992; El-Nashar, 2006). For comparative studies of crops and their wild relatives in plant germplasm collections, a complementary approach using isozymes could be more appropriate to generate accurate estimations of genetic diversity and relationships comparing to alternative methods.
This study was carried out to investigate the dose effect of SA and DES mutagens on
3Chemical mutagenic effects on calendula
©FUNPEC-RP www.funpecrp.com.brGenetics and Molecular Research 15 (2): gmr.15028071
vegetative growth, flowering, yield parameters, and gas-exchange across the two generations (M1 and M2) of C. officinalis L. The mutagen effects on induction of total soluble protein, enzymatic activities of acid phosphatase, and catalase were also assessed.
MATERIAL AND METHODS
This study was carried out at the Department of Plant Production, College of Food and Agricultural Sciences, King Saud University, for two seasons (2012/2013 and 2013/2014) under greenhouse conditions.
Plant materials
Calendula seeds (C. officinalis L. cv. calypso yellow) provided by Sakata’s Reliable Seeds (Morgan Hill, CA, USA), were treated with six different concentrations (0, 1000, 2000, 3000, 4000, and 5000 ppm) of SA and DES. The M1-generation was run in the first season on November 7, 2012, whereas the M2-generation was done in the second season on October 1, 2013. Plants were planted in 15-cm pots, one plant per pot. Twenty percent of the M1-plants, which survived in each treatment, were selected and selfed, in order to obtain the M2 seeds according to Sinhamahapatra and Rakshit (1990).
Experimental design
The experimental procedure used was a split plot design, with three replicates for each of the M1- and M2-generations (Steel and Torrie, 1980). In the first season, each replicate contained 12 treatments [the two chemical mutagens (SA and DES) applied at six different concentrations each]. The main plots were devoted to the two chemical mutagens and the sub-plots included the concentrations. Fifty seeds were used for each treatment in each replicate; the total number of seeds used in the experiment was 1800 seeds/season.
Experimental data
The percentage of seed germination was recorded after 6 weeks from sowing. The calendula plants were grown until flower maturity when the plants were harvested. At the harvesting stage, the plant height and flower diameter were measured. The number of leaves per plant was counted, and leaf area was measured using a leaf area meter (LI-COR, Lincoln, NE, USA). The number of branches and flowers per plant were also calculated. The flowering date (days from sowing) in each treatment was determined, and the fresh shoot and dry weights were recorded. The shoot dry weight was determined by drying the shoots in an oven at 70°C for 48 h until the weight was constant. These data were collected for both M1- and M2-generations in two successive experimental seasons.
Physiological parameters
The net leaf photosynthetic rate, stomatal conductance, transpiration rate, and intercellular CO2 concentration were determined between 8:00 to 9:30 am at the harvesting stage from fully expanded third top leaf. This was done using a portable open flow gas-

4Y.I. El-Nashar and A.A. Asrar
©FUNPEC-RP www.funpecrp.com.brGenetics and Molecular Research 15 (2): gmr.15028071
exchange system LI-6400 (LI-COR) at a light-saturating intensity on a sunny day when the photosynthetically active radiation was 640 µmol·m-2·s-1, the air temperature was 29°C, and the relative humidity was 26% on a fully expanded top leaf of the main axis of the plant. The recorded measurements were average of four readings per plot.
Eight-week-old seedlings were used to extract chlorophyll (Chl). About 0.025 to 0.035 g of leaflets were used to extract Chl using N,N-dimethylformamide (DMF) by grinding the leaflets with 2 mL DMF solvent using in a mortar with a pestle. The homogenate was centrifuged at 2500 rpm in a bench centrifuge for 10 min. The pellet was then extracted and combined with 1 mL solvent in a homogenizer and the pooled supernatants were adjusted to a final volume of 8 mL. The spectrum was recorded between 750 and 600 nm and the main red absorption peak was automatically determined by the Amersham Pharmacia Biotech, Ultrospec 2000, UV/visible spectrophotometer (Cambridge, England). Chl a, b, and total Chl (a + b) concentrations in µM were then calculated using the equations as described by Porra et al. (1989):
Note that A646.8 and A663.8 refer to absorbance at 663.8 and 646.8 nm wavelengths, respectively. The unit of the pigment concentration is nanomoles per milliliter.
Total soluble protein content
The total protein content was determined following Lowry et al. (1951). Calendula seedlings (0.5 mg) were ground in 25 mL Tris-HCl buffer, pH 7.6. The mixture was centrifuged at 9000 g under freezing for 5 min at 4ºC. The supernatant was then transferred to a new vial and kept under a frozen temperature of -20ºC until further analysis. The total soluble protein concentrations were then determined using a spectrophotometry (750 nm).
Enzymatic activities
Acid phosphatase enzyme activity was assayed in the crude extract of 2-week-old calendula seedlings as reported by dos Prazeres et al. (2004). Catalase activity was determined as previously described (Cakmak et al., 1993). Briefly, the reaction solution (3 mL) for the catalase enzyme was comprised of 50 mM phosphate buffer, pH 7.0, 15 mM H2O2, and 50 µL enzyme extracts. The reaction was initiated by adding H2O2 to the reaction solution. The catalase activity was determined by tracing the decomposition of H2O2 and measuring the absorbance decrease at 240 nm for 1 min. The catalase activity was expressed as amount of enzyme that breaks down 1 µmol H2O2·
-1mg·min-1 under the assayed described conditions.
Chl a + b = 19.43 A663.8 - 8.05 A646.8 (Equation 3)
Chl b = 22.90 A663.8 - 5.38 A646.8 (Equation 2)
Chl a = 13.43 A663.8 - 3.47 A646.8 (Equation 1)
5Chemical mutagenic effects on calendula
©FUNPEC-RP www.funpecrp.com.brGenetics and Molecular Research 15 (2): gmr.15028071
RESULTS
Seed germination
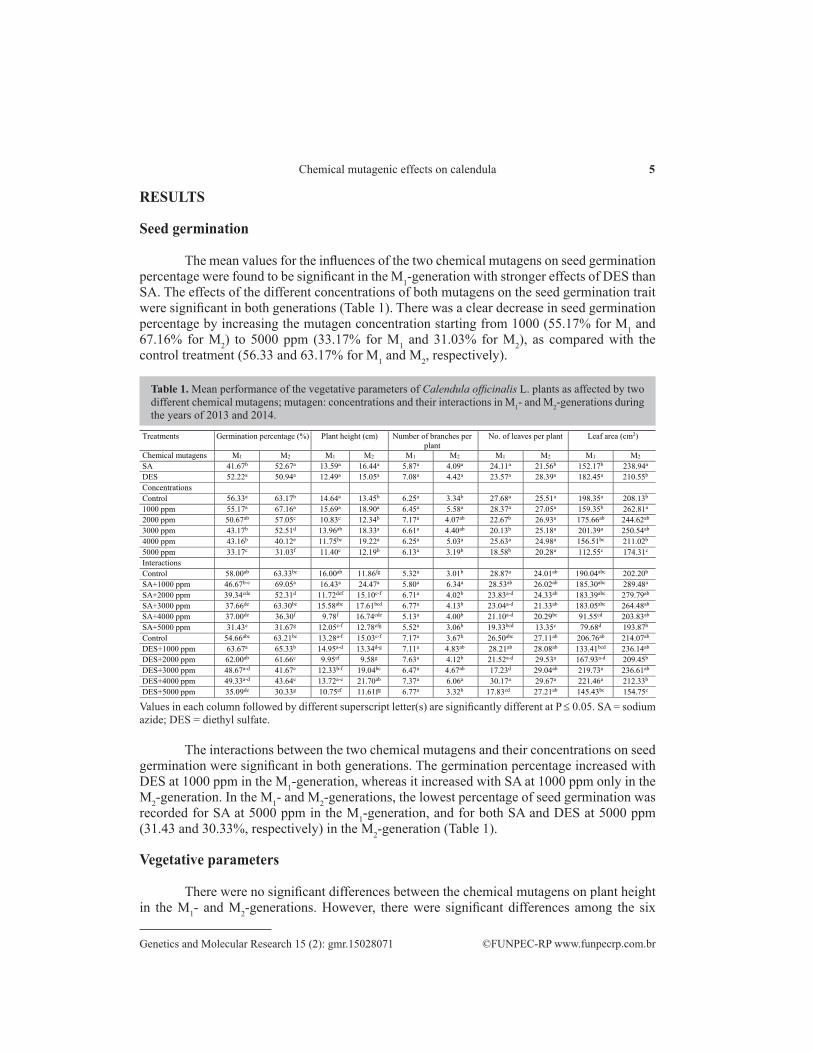
The mean values for the influences of the two chemical mutagens on seed germination percentage were found to be significant in the M1-generation with stronger effects of DES than SA. The effects of the different concentrations of both mutagens on the seed germination trait were significant in both generations (Table 1). There was a clear decrease in seed germination percentage by increasing the mutagen concentration starting from 1000 (55.17% for M1 and 67.16% for M2) to 5000 ppm (33.17% for M1 and 31.03% for M2), as compared with the control treatment (56.33 and 63.17% for M1 and M2, respectively).
Values in each column followed by different superscript letter(s) are significantly different at P ≤ 0.05. SA = sodium azide; DES = diethyl sulfate.
Table 1. Mean performance of the vegetative parameters of Calendula officinalis L. plants as affected by two different chemical mutagens; mutagen: concentrations and their interactions in M1- and M2-generations during the years of 2013 and 2014.
Leaf area (cm2) No. of leaves per plant Number of branches per plant
Plant height (cm) Germination percentage (%) Treatments
M2 M1 M2 M1 M2 M1 M2 M1 M2 M1 Chemical mutagens 238.94a 152.17b 21.56b 24.11a 4.09a 5.87a 16.44a 13.59a 52.67a 41.67b SA 210.55b 182.45a 28.39a 23.57a 4.42a 7.08a 15.05a 12.49a 50.94a 52.22a DES
Concentrations 208.13b 198.35a 25.51a 27.68a 3.34b 6.25a 13.45b 14.64a 63.17b 56.33a Control 262.81a 159.35b 27.05a 28.37a 5.58a 6.45a 18.90a 15.69a 67.16a 55.17a 1000 ppm 244.62ab 175.66ab 26.93a 22.67b 4.07ab 7.17a 12.34b 10.83c 57.05c 50.67ab 2000 ppm 250.54ab 201.39a 25.18a 20.13b 4.40ab 6.61a 18.33a 13.96ab 52.51d 43.17b 3000 ppm 211.02b 156.51bc 24.98a 25.63a 5.03a 6.25a 19.22a 11.75bc 40.12e 43.16b 4000 ppm 174.31c 112.55c 20.28a 18.58b 3.19b 6.13a 12.19b 11.40c 31.03f 33.17c 5000 ppm
Interactions 202.20b 190.04abc 24.01ab 28.87a 3.01b 5.32a 11.86fg 16.00ab 63.33bc 58.00ab Control 289.48a 185.30abc 26.02ab 28.53ab 6.34a 5.80a 24.47a 16.43a 69.05a 46.67b-e SA+1000 ppm 279.79ab 183.39abc 24.33ab 23.83a-d 4.02b 6.71a 15.10c-f 11.72def 52.31d 39.34cde SA+2000 ppm 264.48ab 183.05abc 21.33ab 23.04a-d 4.13b 6.77a 17.61bcd 15.58abc 63.30bc 37.66de SA+3000 ppm 203.83ab 91.55cd 20.29bc 21.10a-d 4.00b 5.13a 16.74cde 9.78f 36.30f 37.00de SA+4000 ppm 193.87b 79.68d 13.35c 19.33bcd 3.06b 5.52a 12.78efg 12.05c-f 31.67g 31.43e SA+5000 ppm 214.07ab 206.76ab 27.11ab 26.50abc 3.67b 7.17a 15.03c-f 13.28a-f 63.21bc 54.66abc Control 236.14ab 133.41bcd 28.08ab 28.21ab 4.83ab 7.11a 13.34d-g 14.95a-d 65.33b 63.67a DES+1000 ppm 209.45b 167.93a-d 29.53a 21.52a-d 4.12b 7.63a 9.58g 9.95ef 61.66c 62.00ab DES+2000 ppm 236.61ab 219.73a 29.04ab 17.23d 4.67ab 6.47a 19.04bc 12.33b-f 41.67e 48.67a-d DES+3000 ppm 212.33b 221.46a 29.67a 30.17a 6.06a 7.37a 21.70ab 13.72a-e 43.64e 49.33a-d DES+4000 ppm 154.75c 145.43bc 27.21ab 17.83cd 3.32b 6.77a 11.61fg 10.75ef 30.33g 35.09de DES+5000 ppm
The interactions between the two chemical mutagens and their concentrations on seed germination were significant in both generations. The germination percentage increased with DES at 1000 ppm in the M1-generation, whereas it increased with SA at 1000 ppm only in the M2-generation. In the M1- and M2-generations, the lowest percentage of seed germination was recorded for SA at 5000 ppm in the M1-generation, and for both SA and DES at 5000 ppm (31.43 and 30.33%, respectively) in the M2-generation (Table 1).
Vegetative parameters
There were no significant differences between the chemical mutagens on plant height in the M1- and M2-generations. However, there were significant differences among the six
6Y.I. El-Nashar and A.A. Asrar
©FUNPEC-RP www.funpecrp.com.brGenetics and Molecular Research 15 (2): gmr.15028071
concentrations, as well as among the interactions between the two chemical mutagens and their concentrations in both generations (Table 1). The treatments with concentrations of 2000 and 5000 ppm had the smallest average plant height (10.83 cm for M1 and 12.19 cm for M2), whereas the greatest plant heights were detected at the concentrations of 1000 ppm (15.69 cm for M1) and 4000 ppm (19.22 cm for M2). The maximum average plant height was produced under SA at 1000 ppm treatment (16.43 and 24.47 cm for the M1- and M2-generations, respectively). The minimum average plant height was observed under SA at 4000 ppm (9.78 cm for M1) and under DES at 2000 ppm (9.58 cm for M2).
The mean values for the chemical mutagens, mutagen concentrations, and their interactions had no significant effects on branch number in the M1-generation; but the mutagen concentration and their interaction effects were significant for branch number in the M2-generation (Table 1). The greatest number of branches per plant was observed at 1000 ppm for SA (6.34 for M2), while the smallest number was recorded for the SA control (3.01 for M2).
The mean number of leaves per plant was not significantly affected by the mutagen in the M1-generation, while this effect was significant in the M2-generation. The different concentrations had significant effects on this trait only in the M1-generation where the highest number of leaves per plant (28.37) was detected at 1000 ppm and the lowest number of leaves (18.58) was recorded at 5000 ppm (Table 1). The interactions between the mutagens and mutagen concentration showed no significant effects, neither in the M1- nor in the M2-generation. In both generations, there was a trend towards a reduction in the number of leaves per plant as mutagen concentration increased; especially, in comparison with the highest concentration (5000 ppm) of SA in the M2-generation. The highest number of leaves was found with DES at 4000 ppm (30.17 and 29.67) in the M1- and M2-generations.
The chemical mutagens, mutagen concentration, and the interactions between the two factors had significant effects on leaf area of plants in both generations. The highest mutagen concentration of 5000 ppm generated the lowest leaf area (112.55 and 174.31 cm2 in the M1- and M2-generations, respectively). The largest leaf area was detected at concentrations of 3000 ppm (201.39 cm2) for the M1-generation and at 1000 ppm (262.81 cm2) for the M2-generation. Regarding the interaction effect, the smallest leaf areas were detected at 5000 ppm for the SA treatment (79.68 cm2) in the M1-generation and at 5000 ppm DES (154.75 cm2) in the M2-generation. On the other hand, the largest leaf areas were found at the concentrations of 4000 ppm DES (221.46 cm2) and 1000 ppm SA (289.48 cm2) for the M1- and M2-generations, respectively.
The mean values of the chemical mutagens, mutagen concentration, and their interactions did not show any significant differences in plant fresh weight during the M1-generation, whereas some differences were detected in the M2-generation (Table 2). The effects of the highest mutagen concentration (5000 ppm) on plant fresh weight (10.64 g), seemed to be significantly more harmful in the M1-generation, comparing with the control (15.48 g). The plant fresh weight was higher in SA than in DES. There was a reduction trend in plant fresh weight as chemical concentrations increased from 1000 to 5000 ppm. The greatest plant fresh weight was observed at 1000 ppm (16.79 g for M2).
Regarding the interaction effect in the M2-generation, the highest plant fresh weight was recorded at 1000 ppm SA (21.98 g), whereas the lowest plant fresh weight (7.37 g) was detected at the highest concentration of 5000 ppm DES.
In the M1-generation plants, only the chemical mutagen used had significant effects on plant dry weight. In contrast, mutagen concentration and its interaction with the chemical mutagen had no significant effects on plant dry weight (Table 2).
7Chemical mutagenic effects on calendula
©FUNPEC-RP www.funpecrp.com.brGenetics and Molecular Research 15 (2): gmr.15028071
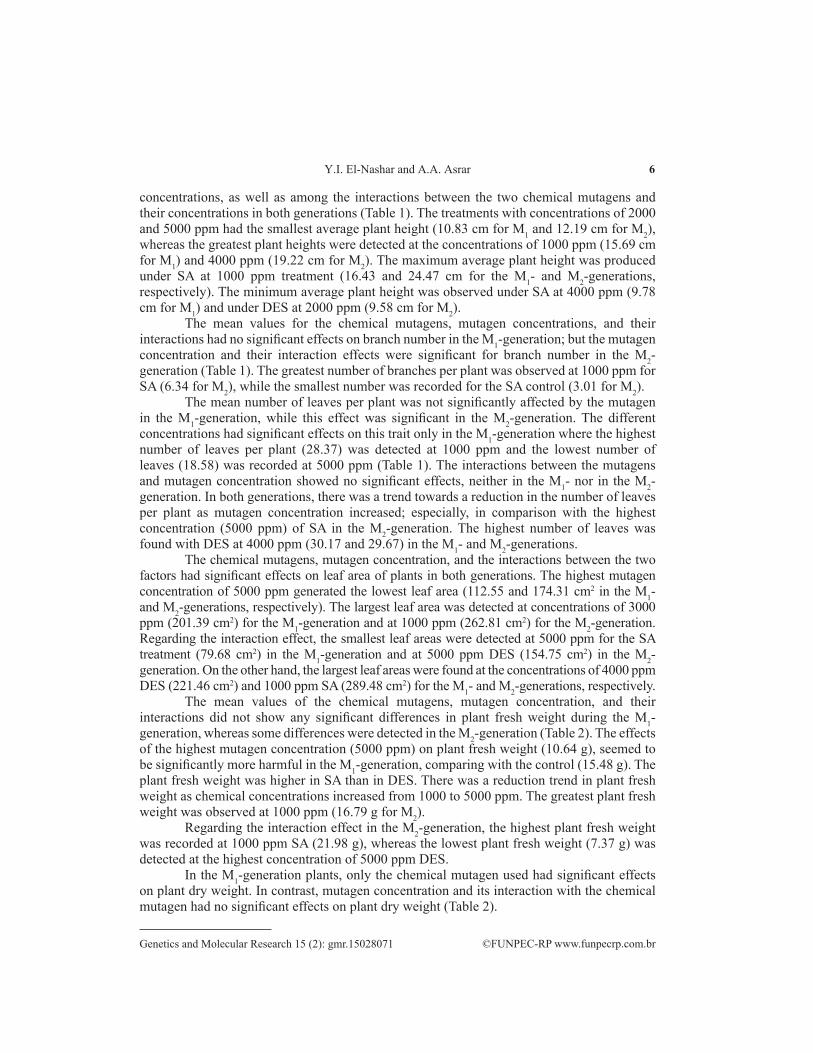
Values in each column followed by different superscript letter(s) are significantly different at P ≤ 0.05. SA = sodium azide; DES = diethyl sulfate.
Table 2. Mean performance of the flower parameters of Calendula officinalis L. plants as affected by two different chemical mutagens: mutagen concentrations and their interactions in M1- and M2-generations during the years of 2013 and 2014.
Inflorescence diameter (cm)
Number of inflorescences per plant
Flowering Date (day)
Plant dry weight (g)
Plant fresh weight (g)
Treatments
M2 M1 M2 M1 M2 M1 M2 M1 M2 M1 Chemical mutagens 3.96b 3.75a 6.89b 8.42a 184.88a 141.87a 3.82a 2.65b 16.50a 12.93a SA 4.45a 3.21a 7.78a 9.41a 178.53b 136.93b 3.37a 3.52a 12.28b 12.78a DES
Concentrations 3.93cd 3.58ab 5.85d 8.75a 177.17c 138.42bc 3.39a 3.31a 13.73c 15.48a Control 4.13c 3.45b 7.70bc 8.90a 170.52d 135.57c 3.61a 3.11a 16.79a 12.93ab 1000 ppm 3.78cd 3.88a 6.33d 9.58a 185.17ab 138.33cb 3.44a 2.89a 16.21a 12.27ab 2000 ppm 5.10a 3.50ab 8.31ab 8.65a 182.84bc 140.70b 3.96a 3.37a 15.84ab 13.50ab 3000 ppm 4.63b 3.25b 8.48a 9.28a 181.89b 138.49b 3.75a 3.19a 14.57bc 12.32ab 4000 ppm 3.66d 3.23b 7.35c 9.12a 192.68a 144.90a 3.42a 2.64a 9.53d 10.64b 5000 ppm
Interactions 3.69c 3.74a-d 4.66f 7.57a 176.33de 138.93bc 3.68a 3.44a 16.69bc 17.47a Control 4.14c 4.12a 7.36bc 8.77a 173.05e 136.20cd 4.61a 2.94a 21.98a 15.04a SA+1000 ppm 3.79c 3.88abc 6.02de 9.23a 184.11bcd 139.17bc 3.91a 2.53a 17.34b 13.11a SA+2000 ppm 4.16c 3.72a-d 7.31bc 8.93a 191.01ab 144.71a 3.95a 2.66a 14.91c 14.29a SA+3000 ppm 4.97b 3.75a-d 6.67cd 8.10a 190.68ab 145.37a 3.86a 2.13a 16.41bc 9.31a SA+4000 ppm 3.02d 3.32cde 9.30a 9.47a 194.33a 146.87a 2.91a 2.21a 11.69de 8.40a SA+5000 ppm 4.16c 3.41b-e 7.05bcd 9.93a 178.00cde 137.90c 3.09a 3.19a 10.77e 13.52a Control 4.12c 3.03e 8.04b 9.03a 168.03e 134.93cd 2.61a 3.27a 11.61de 10.83a DES+1000 ppm 3.77c 4.03ab 6.65cd 9.93a 186.33abc 137.51c 2.97a 3.24a 15.07c 11.42a DES+2000 ppm 6.04a 2.89e 9.32a 8.37a 174.67de 136.72c 3.98a 4.09a 16.15bc 12.72a DES+3000 ppm 4.29c 2.75e 10.29a 10.47a 173.11e 131.60d 3.65a 4.27a 12.72d 15.33a DES+4000 ppm 4.30c 3.13de 5.39ef 8.77a 191.04ab 142.93ab 3.93a 3.06a 7.37f 12.88a DES+5000 ppm
Flower yield components
Data in Table 2 indicated that the chemical mutagen, mutagen concentration, and their interactions had significant effects on flowering date in both the M1- and M2-generations. The DES mutagen resulted in an earlier flowering date for M1- and M2-generations, compared with SA. The earliest flowering dates were detected at 1000 ppm (135.57 days) for the M1- and (170.52 days) M2-generations, whereas the latest date was attained at 5000 ppm (144.90 and 192.68 days in the M1- and M2-generations, respectively). The interaction effect with SA at 5000 ppm delayed the flowering date of both M1- and M2-generation calendula plants (146.87 and 194.33 days) comparing to other treatments.
The number of inflorescences per plant was not affected by either SA or DES; especially in the M1-generation (Table 2). However, the two chemical mutagens, mutagen concentration, and their interactions revealed significant influences in the M2-generation. DES had a superior effect on the number of inflorescences, comparing to SA. A higher mutagen concentration of 4000 ppm appeared to result in a higher number of inflorescences (8.48), followed by 3000 ppm (8.31), and compared to the control (5.85) or other treatments. The effects of the DES mutagen at the higher concentration of 4000 ppm gave the highest value of inflorescence number per plant (10.29) as compared to the control ones (4.66) or other treatments.
The data in Table 2 illustrate that the differences between the two chemical mutagens, mutagen concentration, and their interactions during both the M1- and M2- generations were significantly compared with the control treatment.
In the M1- and M2-generations, the lowest mean inflorescence diameters were
8Y.I. El-Nashar and A.A. Asrar
©FUNPEC-RP www.funpecrp.com.brGenetics and Molecular Research 15 (2): gmr.15028071
observed at the concentration of 5000 ppm (3.23 and 3.66 cm), while the highest diameters were detected at 2000 ppm (3.88 cm) for the M1-generation and at 3000 ppm (5.10 cm) for the M2-generation. Data revealed that the interaction effect of SA at 1000 ppm and DES at 3000 ppm generated the highest inflorescence diameter values (4.12 and 6.04 cm), compared to all other treatments in the M1- and M2-generations (Table 2).
Gas-exchange measurements
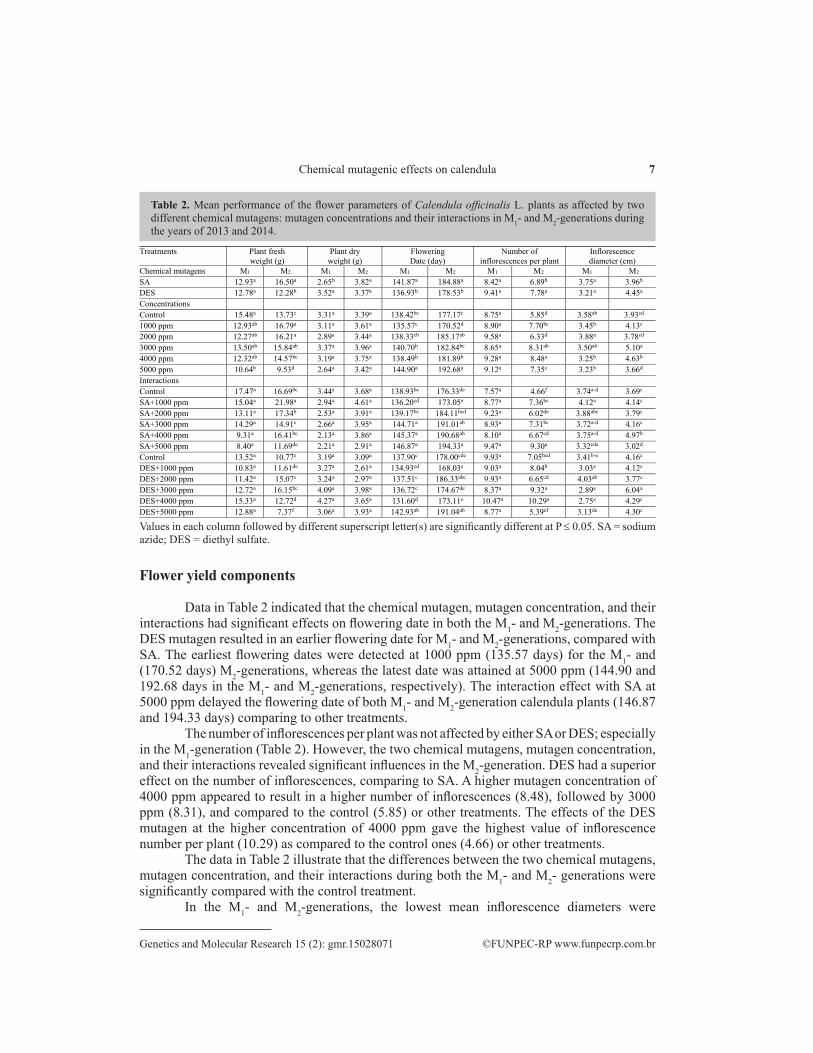
The data shown in Figure 1A-D illustrate that there were significant differences between the two chemical mutagens and their concentrations, compared with the control treatment in both generations. With the exception of stomatal conductance at 5000 ppm DES, net photosynthetic rate, stomatal conductance, and transpiration rate all increased in the presence of DES at all concentrations, compared with SA. The intercellular CO2 concentration with SA was relatively more effective than with DES. In the M2-generation, an increase in all measurements was observed. Regarding the intercellular CO2 concentration, SA exposure resulted in a greater sensitivity to higher concentrations of mutagens. The intercellular CO2 concentration was higher in the SA than in the DES treatment. There was a trend towards an increase in intercellular CO2 concentration with increasing the chemical concentrations from 1000 to 5000 ppm.
Figure 1. Net photosynthetic rate (A), stomatal conductance (B), transpiration rate (C), and intercellular CO2 (D) following exposure to two chemical mutagens (SA and DES) on calendula plants. The mutagens were applied at control, 1000, 2000, 3000, 4000, and 5000 ppm, during two generations (M1 and M2).

9Chemical mutagenic effects on calendula
©FUNPEC-RP www.funpecrp.com.brGenetics and Molecular Research 15 (2): gmr.15028071
Leaf chlorophyll contents
The mean values of leaf Chl contents are presented in Figure 2A and B. There were significant effects in the M1-generation with respect to the chemical mutagen, mutagen concentration, and their interactions. However, in the M2-generation, there were no significant differences. The concentration of 5000 ppm in the M1-generation significantly reduced the total Chl content (2.05 µM), as compared with all other treatments. In the present study, the total Chl content in plants treated with DES increased at higher concentrations, whereas SA-treated plants had higher total Chl at the lower concentrations.
Figure 2. Chlorophyll (Chl) a, b, and total Chl concentrations in calendula plants following exposure to two chemical mutagens (SA and DES) at different concentrations over two generations, M1 (A) and M2 (B).
Total soluble protein content
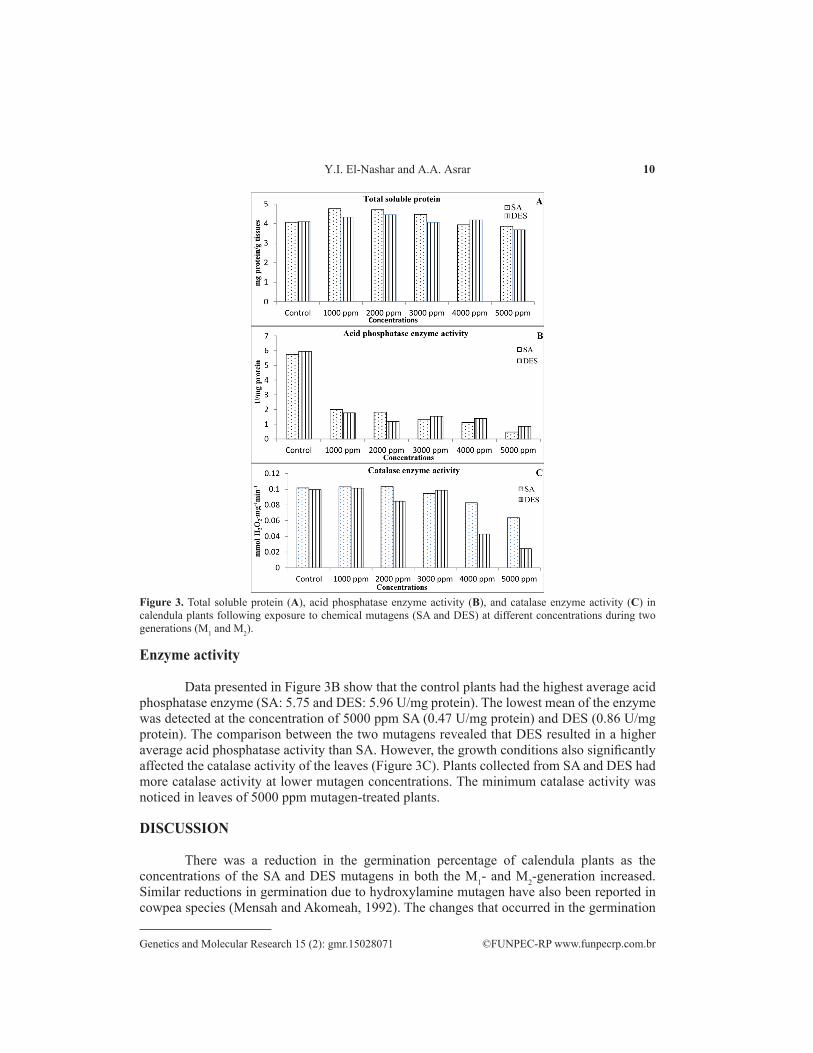
Figure 3A shows that the lowest total soluble protein was found in calendula plants that had been treated with 5000 ppm SA and DES treatments (3.86 and 3.67 mg protein/g tissue, respectively), whereas the highest total soluble protein was detected at the concentrations of 1000 ppm SA (4.76 mg protein/g tissues) and 2000 ppm DES (4.45 mg protein/g tissues). In the comparison between the two mutagens, data indicated that SA had the highest average total soluble protein content, except for at 4000 ppm DES.
10Y.I. El-Nashar and A.A. Asrar
©FUNPEC-RP www.funpecrp.com.brGenetics and Molecular Research 15 (2): gmr.15028071
Figure 3. Total soluble protein (A), acid phosphatase enzyme activity (B), and catalase enzyme activity (C) in calendula plants following exposure to chemical mutagens (SA and DES) at different concentrations during two generations (M1 and M2).
Enzyme activity
Data presented in Figure 3B show that the control plants had the highest average acid phosphatase enzyme (SA: 5.75 and DES: 5.96 U/mg protein). The lowest mean of the enzyme was detected at the concentration of 5000 ppm SA (0.47 U/mg protein) and DES (0.86 U/mg protein). The comparison between the two mutagens revealed that DES resulted in a higher average acid phosphatase activity than SA. However, the growth conditions also significantly affected the catalase activity of the leaves (Figure 3C). Plants collected from SA and DES had more catalase activity at lower mutagen concentrations. The minimum catalase activity was noticed in leaves of 5000 ppm mutagen-treated plants.
DISCUSSION
There was a reduction in the germination percentage of calendula plants as the concentrations of the SA and DES mutagens in both the M1- and M2-generation increased. Similar reductions in germination due to hydroxylamine mutagen have also been reported in cowpea species (Mensah and Akomeah, 1992). The changes that occurred in the germination

11Chemical mutagenic effects on calendula
©FUNPEC-RP www.funpecrp.com.brGenetics and Molecular Research 15 (2): gmr.15028071
percentage in seeds of M1- and M2- generations could be due to the environmental effects; such as, seed moisture contents as well as the mutagen chemical concentrations (Abd El-Maksoud and El-Mahrouk, 1992). These results are consistent with those found by Badr et al. (2000) and El-Nashar (2006) whose results indicated that mutagen stimulation affected the germination of Tagetes and Amaranthus seeds as a result of low concentrations of mutagenic chemicals. The stimulating effects of low and intermediate concentrations of SA and DES on seed germination may be due to enzymatic activation and awakening of meristematic cell division. Disturbance in the formation of enzymes involving in the germination process, particularly at higher doses, could be considered one of the physiological effects caused by SA and DES, which leads to a decreased germination percentage in calendula plants.
Plant height increased with the lower mutagen concentrations. This has also been observed in other floricultural species, such as Salvia splendens (Hussein et al., 1974), Euonymus japonicus (El-Torky, 1992), and Amaranthus (El-Nashar, 2006). The stimulatory effects of the lower concentrations on plant height also agreed with the findings of Abd El-Maksoud and El-Mahrouk (1992) on Asparagus densiflorus. These results might be attributed to the physiological damages caused by SA and DES and their hydrolysis products.
Clear significant effects on the number of branches and leaves per plant were also recorded. These results are in accordance with the findings of Hussein et al. (1974) on Salvia splendens and El-Nashar (2006) on Amaranthus. The physiological effects of SA, DES and their hydrolysis products could also be the reason for increasing the number of branches and leaves in each plant.
The proportional increases and decreases in the fresh and dry weights, respectively, with increasing SA and DES concentrations reported in this study, were similar to those findings of Abd El-Maksoud and El-Mahrouk (1992) on Asparagus densiflorus. The difference in responses at various doses could be attributed to the environmental factors, such as temperatures and/or nutrition that prevailed during the growth period of the plants.
Regarding flowering date, the two manners of responses to mutagens have been reported. Plants may be triggered to flower earlier, as reported by Hussein et al. (1974) who found that ethyl methanesulfonate concentrations resulted in a significant responses towards earliness of flowering in Salvia splendens, maize (Afsar-Awan et al., 1980; Lysikov et al., 1987), and winter Swede rape (Adamska et al., 1995). The alternative response is pushing plants towards a later flowering date as was reported by El-Nashar (2006) who found that DES concentrations caused a slight delay in flowering of Amaranthus and Mahna et al. (1990) showed similar results in Vinga aconitifolia. The variable responses observed in the present study could be due to the environmental variations between the two seasons. It is known that low and intermediate concentrations of mutagens generally stimulate cell growth, increase growth rate, and produce earlier flowering in specific cases as reported by Hussein et al. (1974) and Adamska et al. (1995). On the other hand, elevated concentrations seemed to inhibit the cell growth, decrease growth rate, and delay the flowering date, as reported by Neagu (1970), Khan et al. (1994), Badr et al. (2000), and El-Nashar (2006).
The inflorescence diameters found in the present study were in contrast with those reported by Mahna and Singh (1975) on Physalis ixocarpa plant and on Amaranthus by El-Nashar (2006). The environmental and physiological conditions at the middle of the flowering period can affect the inflorescence quality. When the growth reached its maximum, the photoperiod was longer. Therefore, the diameters of the inflorescences and leaf area increased as a result of light intensity and higher temperatures.
12Y.I. El-Nashar and A.A. Asrar
©FUNPEC-RP www.funpecrp.com.brGenetics and Molecular Research 15 (2): gmr.15028071
Kumar et al. (1994) showed that net photosynthetic rate, transpiration rate, and dry mass production were closely related processes. Both photosynthetic and transpiration rate are regulated by the stomatal activity (Nguyen et al., 1997), and both have been found to be highly correlated in cassava plants (Mahon et al., 1977). Decreases in net photosynthetic rate closely follow decreases in transpiration rate, since stomatal closure controls both processes (Ike, 1982). This indicates that the low transpiration rate of calendula plants was reduced in the M1-generation, as a result of decreasing photosynthesis. The stomatal conductance found in the present study was in full agreement with that of Lahai and Ekanayake (2010) who reported that stomatal apertures of the high-yielding cultivars with intermediate rate of transpiration were open wide enough to allow high photosynthesis, but restricted enough to prevent excessive loss of water from leaves, resulting in a high leaf yield.
Soaking seeds in SA and DES treatments produced mutations with reduced chlorophyll content that were more pronounced in the M1-generation. This was in accordance with the findings of Cneng and Gao (1988). There might be two reasons for this; the first one is that the post-SA soaking may cause diffusion of SA molecules from cells to the extra-cellular fluid, or an inactivation of SA by cellular fluids, resulting in a reduction of the “active” concentration. The second reason could be that repairing of the SA-inducing lesions may take place during the post-SA soaking period.
The changes in soluble protein patterns were obvious at all experimental conditions used in this study. It must be emphasized that reduction in protein could be as a result of the direct physical effects of the chemical mutations on molecules, and protein increases may reflect the repression of gene expression as suggested by Gorinstein et al. (2001) and del Carmen Ramírez-Medeles et al. (2003) on Amaranthus species.
A drastic decrease in the acid phosphatase enzyme activity was detected. The results can be attributed to the cellular response to mutagens as reported by dos Prazeres et al. (2004). Vaidyanathan et al. (2003) mentioned that catalase enzyme is used to decrease oxidants like H2O2. In the present study, more catalase activity was observed under the low mutagen concentrations. A contrasting response in catalase activity to different chemical mutagen stresses has been shown in previous studies. Wildeman and Nazar (1982) found no correlation between activation levels in various plant species, their protein contents, and catalase activities.
CONCLUSION
Chemical mutagenesis is an efficient tool used in mutation-breeding programs to improve the vital characters of the floricultural crops. This study was aimed to estimate the effect of different concentrations of two chemical mutagens; sodium azide and diethyl sulfate. Lower concentrations of mutagens were found to be beneficial for seed germination percentage, plant height, leaf area, fresh plant weight, flowering date, inflorescence diameter, and gas-exchange of calendula plants, in both generations. The chemical mutagens and mutagen concentrations had significant effects on total soluble proteins, acid phosphatase, and catalase activity fractions of the calendula leaves.
Conflicts of interest
The authors declare no conflict of interest.
13Chemical mutagenic effects on calendula
©FUNPEC-RP www.funpecrp.com.brGenetics and Molecular Research 15 (2): gmr.15028071
ACKNOWLEDGMENTS
The authors would like to extend their sincere appreciations to the Deanship of Scientific Research, King Saud University, Saudi Arabia, for funding this studing through the Research Group Project #RGP-270.
REFERENCES
Abd El-Maksoud B and El-Mahrouk EM (1992). Effect of ethyl methane sulfonate on the growth and interior quality of Asparagus densiflorus (Kunth) Jessop C.V. “SPRENGERI. Egypt. J. Appl. Sci. 7: 116-132.
Adamska E, Jezowski S, Olejniczak J and Rybinski W (1995). Effect of chemical mutagens on induced variation in winter Swede rape. Rośliny Oleiste XVI: 57-62.
Afsar-Awan M, Konzac CF, Rutger JN and Nilan RA (1980). Mutagenic effects of sodium azide in rice. Crop Sci. 20: 663-668.
Badr M, El-Torky MG, El-Shennawy O and El-Nashar Y (2000). Effect of chemical mutagens on Tagetes erecta. J. Agr. Sci. Mansoura Univ. 25: 5241-5256.
Cakmak I, Strbac D and Marschner H (1993). Activities of hydrogen peroxide-scavenging enzymes in germinating wheat seeds. J. Exp. Bot. 44: 127-132. http://dx.doi.org/10.1093/jxb/44.1.127
Chopra VL (2005). Mutagenesis Investigating the process and processing the outcome for crop improvement. Curr. Sci. 89: 353-359.
Cneng XY and Gao MW (1988). Biological and genetic effects of combined treatments of sodium azide, gamma rays and EMS in barley. Environ. Exp. Bot. 28: 281-288. http://dx.doi.org/10.1016/0098-8472(88)90051-2
del Carmen Ramírez-Medeles M, Aguilar MB, Miguel RN, Bolaños-García VMB, et al. (2003). Amino acid sequence, biochemical characterization, and comparative modeling of a nonspecific lipid transfer protein from Amaranthus hypochondriacus. Arch. Biochem. Biophys. 415: 24-33. http://dx.doi.org/10.1016/S0003-9861(03)00201-7
dos Prazeres JN, Ferreira CV and Aoyama H (2004). Acid phosphatase activities during the germination of Glycine max seeds. Plant Physiol. Biochem. 42: 15-20. http://dx.doi.org/10.1016/j.plaphy.2003.10.009
El-Nashar Y (2006). Effect of chemical mutagens (sodium azide and diethyl sulphate) on growth, flowering and induced variability in Amaranthus caudatus L. and A. hypochondriacus L. Doctoral thesis, Faculty of Agriculture Alexandria University.
El-Torky MG (1992). Effect of EMS (ethylmethan sulphonate) on variegation type and some other horticultural traits in Euonymus japonicus, Linn. Alex. Agric. Res. 37: 249-260.
Gaul H (1964). Mutation in plant breeding. Radiat. Bot. 4: 155-232. http://dx.doi.org/10.1016/S0033-7560(64)80069-7Gorinstein S, Delgado-Licon E, Pawelzik E, Permady HH, et al. (2001). Characterization of soluble amaranth and soybean
proteins based on fluorescence, hydrophobicity, electrophoresis, amino Acid analysis, circular dichroism, and differential scanning calorimetry measurements. J. Agric. Food Chem. 49: 5595-5601. http://dx.doi.org/10.1021/jf010627g
Hussein HAS, Sallam SH, Kamel HA and Labib T (1974). The mutagenic effects of EMS on Salvia splendens. Egypt. J. Genet. Cytol. 3: 193-203.
Ike IF (1982). Effect of water deficits on transpiration, photosynthesis and leaf conductance in cassava. Physiol. Plant. 55: 411-414. http://dx.doi.org/10.1111/j.1399-3054.1982.tb04520.x
Khan S, Siddiqui BA and Nadeem M (1994). Variation in quantitative characters of mungbean after seed treatment with dES. Adv. Plant Sci. 7: 41-45.
Khan S, Al-Qurainy F and Anwar F (2009). Sodium azide: A chemical mutagen for enhancement of agronomic traits of crop plants. Environ. We Int. J. Sci. Tech. 4: 1-21.
Kumar A, Singh DP and Singh P (1994). Influence of water stress on photosynthesis, transpiration, water-use efficiency and yield of Brassica juncea L. Field Crops Res. 37: 95-101. http://dx.doi.org/10.1016/0378-4290(94)90037-X
Lahai MT and Ekanayake IJ (2010). Transpiration rate and leaf water potential as indices for cassava yield in inland valley ecology. J. Agric. Sci. Technol.; JAST 4: 34-44.
Lowry OH, Rosebrough NJ, Farr AL and Randall RJ (1951). Protein measurement with the Folin phenol reagent. J. Biol. Chem. 193: 265-275.
Lysikov VN, Mordvinova VG and Stoilov M (1987). Effect of ecological conditions on genotypic variation in maize mutants under the influence of chemical mutagens. Plant Bree. Gen 58: 88-91.
Mahna SK and Singh D (1975). Induced floral mutation in Physalis ixocarpa Brot. Curr. Sci. 44: 21-22.
14Y.I. El-Nashar and A.A. Asrar
©FUNPEC-RP www.funpecrp.com.brGenetics and Molecular Research 15 (2): gmr.15028071
Mahna SK, Bhargva A and Mohan L (1990). Alkaline azide mutagenic in cowpea. FAO/IAEA Div. Nucl. Tech. Food Agr. Vienna 32: 6-7.
Mahon JD, Lowe SB and Hunt LA (1977). Variation in rate of photosynthetic CO2 uptake in cassava and selected species of Manihot. Photosynthetica 11: 131-138.
Mensah JK and Akomeah PA (1992). Mutagenic effect of hydroxylamine and streptomycin on the growth and yield of cowpea Vigna unguiculata (L.) Walp. Legume Res. 15: 39-44.
Mensah JK and Obadoni O (2007). Effects of sodium azide on yield parameters of groundnut (Arachis hypogea L.). Afr. J. Biotechnol. 6: 20-25.
Mostafa GG (2011). Effect of sodium azide on the growth and variability induction in Helianthus annuus L. Int. J. Plant Breed. Genet. 5: 76-85. http://dx.doi.org/10.3923/ijpbg.2011.76.85
Neagu M (1970). Contributions on the mutagenic effect of diethyl sulphate on sunflower (Helianthus annuus L.). Lucrari Stiintifice, Institutul Agronomic Timisoara. Agronomie 13: 537-548.
Nguyen HT, Babu RC and Blum A (1997). Breeding for drought resistance in rice: Physiology and molecular genetics considerations. Crop Sci. Soc. Am. 37: 1426-1434. http://dx.doi.org/10.2135/cropsci1997.0011183X003700050002x
Porra RJ, Thompson WA and Kriedemann PE (1989). Determination of accurate extinction coefficients and simultaneous equations for assaying chlorophylls a and b extracted with four different solvents: verification of the concentration of chlorophyll standards by atomic absorption spectroscopy. Biochim. Biophys. Acta 975: 384-394. http://dx.doi.org/10.1016/S0005-2728(89)80347-0
Roychowdhury R and Tah J (2011). Chemical mutagenic action on seed germination and related agro-metrical traits in M1 Dianthus generation. Curr. Bot. 2: 19-23.
Roychowdhury R, Datta S, Gupta P and Tah J (2012). Analysis of genetic parameters on mutant populations of Mungbean (Vigna radiata L.) after ethyl methane sulphonate treatment. Not. Sci. Biol. 4: 137-143.
Singh J and Singh S (2001). Induced mutations in basmati rice (Oryza sativa L.). Diamond Jub. Symp, New Delhi, 212.Sinhamahapatra SP and Rakshit SC (1990). Response to selection for plant height in X-ray treated population of jute
(Corchorus caspularis L.) cv. JRC 212. Euphytica 51: 95-99.Steel RGD and Torrie JH (1980). Principles and procedures of statistics: A biometrical approach. 2nd edn. McGraw-Hill,
New York.Tah PR (2006). Induced macromutation in mungbean. Intl. J. Bot. 2: 219-228. http://dx.doi.org/10.3923/ijb.2006.219.228Vaidyanathan H, Sivakumar P, Chakrabarsty R and Thomas G (2003). Scavenging of reactive oxygen species in NaCl-
stressed rice (Oryza sativa L.)-differential response in salt-tolerant and sensitive varieties. Plant Sci. 165: 1411-1418. http://dx.doi.org/10.1016/j.plantsci.2003.08.005
Wildeman AG and Nazar RN (1982). Significance of plant metabolism in the mutagenicity and toxicity of pesticides. Can. J. Genet. Cytol. 24: 437-449. http://dx.doi.org/10.1139/g82-046