Phenotypes of stop codon and splice site rhodopsin mutations ...
14
Phenotypes of Stop Codon and Splice Site Rhodopsin Mutations Causing Retinitis Pigmentosa Samuel G. Jacobson,* Colin M. Kemp,* Artur V. Cideciyan,* Jennifer P. Macke,\ Ching-Hwa Sung\, and Jeremy Nathans^ Purpose. To understand the pathophysiology of retinitis pigmentosa caused by mutations in the rhodopsin gene that lead to truncation of the protein. Methods. Heterozygotes with the glutamine-64-to-ter (Q64ter), the intron 4 splice site, and the glutamine-344-to-ter (Q344ter) mutations in the rhodopsin gene, representing families with at least three generations of affected members, were studied with clinical examinations and mea- surements of rod and cone sensitivity across the visual field, rod- and cone-isolated electroreti- nograms (ERGs), rod dark adaptation, and rhodopsin levels. Results. There was a range of severity of disease expression in each family, some heterozygotes having moderate or severe retinal degeneration and others with a mild phenotype. The mildly affected heterozygotes had normal results on ocular examination but decreased rod sensitivi- ties at most loci across the visual field, abnormalities in rod-isolated ERG a- and b-waves, and reduced rhodopsin levels. Rod dark adaptation followed an approximately normal time course of recovery in patients with the Q64ter mutation. Patients with the splice site or Q344ter mutations both had prolonged recovery of sensitivity, but the time course was different in the two genotypes. Conclusions. There is allele specificity for the pattern of retinal dysfunction in the Q64ter, intron 4 splice site, and Q344ter rhodopsin mutations. The pattern of dysfunction in all three mutations suggests the mutant opsins interfere with normal rod cell function, and there is subsequent rod and cone cell death. Invest Ophthalmol Vis Sci. 1994;35:2521-2534. XVetinitis pigmentosa (RP) is a genetically heteroge- neous group of retinal degenerations, some of which are caused by mutations in the gene encoding rhodop- sin. 1 Most of the rhodopsin gene mutations responsi- ble for RP are point mutations or small deletions, and all but one cause autosomal dominant RP (adRP) (for example, refs. 2-6). The exception is a stop codon mutation, glutamic acid-249-to-ter (E249ter), recently reported as a putative null allele that causes autosomal From the *Department of Ophthalmology, University of Miami School of Medicine, Batcom Palmer Eye Institute, Miami, Florida, and the ^Departments of Molecular Biology and (ienetics, mid Neuroscience, Howard Hughes Medical Institute, Johns Hopkins University School of Medicine, Baltimore, Maryland. Supported in part by Public Health Service research grant EY05627 (SGJ); the National Retinitis Pigmentosa Foundation, Inc., Baltimore, Maryland; The Chatlos Foundation, Inc., Longwood, Florida; and the Howard Hughes Medical Institute, Belhesda, Maryland. Dr. Jacobson is a Research to Prevent Blindness Dolly Green Scholar. Submitted for publication October I, 1993; revised November 5, 1993; accepted November 12, 1993. Proprietary interest category: N. Reprint requests: Dr. Samuel G. Jacobson, Bascom Palmer Eye Institute, 1638 N.W. 10th Avenue, Miami, FL 33136. recessive RP (arRP). Heterozygotes with the E249ter rhodopsin mutation had normal clinical examinations but mild rod photoreceptor-mediated functional dis- turbances. 7 This finding of null alleles carried in single dose in apparently unaffected individuals 7 prompted the hypothesis that the rod photoreceptor can remain healthy with only half the normal level of wild-type rhodopsin, whereas it cannot in the presence of ab- normal rhodopsin due, for example, to a missense mu- tation. 8 A recent search for rhodopsin mutations in 282 patients with RP 6 revealed two families, one with pa- tients heterozygous for a stop codon mutation, gluta- mine-64-to-ter (Q64ter), and another with patients heterozygous for the intron 4 splice site mutation guanosine 43!<;> -to-thymidine, a mutation described pre- viously in a possible carrier of arRP. 7 These potential null alleles, however, were found in families with RP that had at least three generations of affected members, 6 indicating that these alleles are not innocu- liivcsiigativc Ophthalmology & Visual Science, April 1994. Vol. 35, No. 5 Copyright-© Association for Research in Vision and Ophthalmology 2521 Downloaded From: http://iovs.arvojournals.org/pdfaccess.ashx?url=/data/journals/iovs/933178/ on 03/31/2018
Transcript of Phenotypes of stop codon and splice site rhodopsin mutations ...
Phenotypes of Stop Codon and Splice Site RhodopsinMutations Causing Retinitis Pigmentosa
Samuel G. Jacobson,* Colin M. Kemp,* Artur V. Cideciyan,* Jennifer P. Macke,\Ching-Hwa Sung\, and Jeremy Nathans^
Purpose. To understand the pathophysiology of retinitis pigmentosa caused by mutations inthe rhodopsin gene that lead to truncation of the protein.
Methods. Heterozygotes with the glutamine-64-to-ter (Q64ter), the intron 4 splice site, and theglutamine-344-to-ter (Q344ter) mutations in the rhodopsin gene, representing families with atleast three generations of affected members, were studied with clinical examinations and mea-surements of rod and cone sensitivity across the visual field, rod- and cone-isolated electroreti-nograms (ERGs), rod dark adaptation, and rhodopsin levels.
Results. There was a range of severity of disease expression in each family, some heterozygoteshaving moderate or severe retinal degeneration and others with a mild phenotype. The mildlyaffected heterozygotes had normal results on ocular examination but decreased rod sensitivi-ties at most loci across the visual field, abnormalities in rod-isolated ERG a- and b-waves, andreduced rhodopsin levels. Rod dark adaptation followed an approximately normal time courseof recovery in patients with the Q64ter mutation. Patients with the splice site or Q344termutations both had prolonged recovery of sensitivity, but the time course was different in thetwo genotypes.
Conclusions. There is allele specificity for the pattern of retinal dysfunction in the Q64ter,intron 4 splice site, and Q344ter rhodopsin mutations. The pattern of dysfunction in all threemutations suggests the mutant opsins interfere with normal rod cell function, and there issubsequent rod and cone cell death. Invest Ophthalmol Vis Sci. 1994;35:2521-2534.
XVetinitis pigmentosa (RP) is a genetically heteroge-neous group of retinal degenerations, some of whichare caused by mutations in the gene encoding rhodop-sin.1 Most of the rhodopsin gene mutations responsi-ble for RP are point mutations or small deletions, andall but one cause autosomal dominant RP (adRP) (forexample, refs. 2-6). The exception is a stop codonmutation, glutamic acid-249-to-ter (E249ter), recentlyreported as a putative null allele that causes autosomal
From the *Department of Ophthalmology, University of Miami School of Medicine,Batcom Palmer Eye Institute, Miami, Florida, and the ̂ Departments of MolecularBiology and (ienetics, mid Neuroscience, Howard Hughes Medical Institute, JohnsHopkins University School of Medicine, Baltimore, Maryland.Supported in part by Public Health Service research grant EY05627 (SGJ); theNational Retinitis Pigmentosa Foundation, Inc., Baltimore, Maryland; The ChatlosFoundation, Inc., Longwood, Florida; and the Howard Hughes Medical Institute,Belhesda, Maryland. Dr. Jacobson is a Research to Prevent Blindness Dolly GreenScholar.Submitted for publication October I, 1993; revised November 5, 1993; acceptedNovember 12, 1993.Proprietary interest category: N.Reprint requests: Dr. Samuel G. Jacobson, Bascom Palmer Eye Institute, 1638N.W. 10th Avenue, Miami, FL 33136.
recessive RP (arRP). Heterozygotes with the E249terrhodopsin mutation had normal clinical examinationsbut mild rod photoreceptor-mediated functional dis-turbances.7 This finding of null alleles carried in singledose in apparently unaffected individuals7 promptedthe hypothesis that the rod photoreceptor can remainhealthy with only half the normal level of wild-typerhodopsin, whereas it cannot in the presence of ab-normal rhodopsin due, for example, to a missense mu-tation.8
A recent search for rhodopsin mutations in 282patients with RP6 revealed two families, one with pa-tients heterozygous for a stop codon mutation, gluta-mine-64-to-ter (Q64ter), and another with patientsheterozygous for the intron 4 splice site mutationguanosine43!<;>-to-thymidine, a mutation described pre-viously in a possible carrier of arRP.7 These potentialnull alleles, however, were found in families with RPthat had at least three generations of affectedmembers,6 indicating that these alleles are not innocu-
liivcsiigativc Ophthalmology & Visual Science, April 1994. Vol. 35, No. 5Copyright-© Association for Research in Vision and Ophthalmology 2521
Downloaded From: http://iovs.arvojournals.org/pdfaccess.ashx?url=/data/journals/iovs/933178/ on 03/31/2018

2522 Investigative Ophthalmology 8c Visual Science, April 1994, Vol. 35, No. 5
ous in single dose and that these heterozygotes haveadRP.
To understand more about the pathophysiologyof rhodopsin gene mutations in RP that could lead totruncation of the protein, we studied the functionalphenotypes of patients with the Q64ter mutation andthe intron 4 splice site mutation. We also comparedthe patterns of disease expression in these mutationswith the pattern in heterozygotes with a mild pheno-type who carry another rhodopsin stop codon muta-tion, glutamine-344-to-ter (Q344ter), reported previ-ously.2910
MATERIALS AND METHODS
Subjects
The 19 patients in this study were from three families.Thirteen of 14 patients from the family with theQ64ter mutation (all but patient 3, Table 1), the threepatients from the family with the intron 4 splice sitemutation, and both patients with the Q344ter muta-tion had previously participated in molecular geneticsinvestigations that determined that they were heterozy-gotes with these mutations.2 6 All patients underwent
ocular examination, and most patients had Goldmannkinetic perimetry, dark- and light-adapted staticthreshold perimetry, and full-field ERGs using a clini-cal protocol. The patients with relatively mild diseasealso had dark adaptometry, measurements of rod-iso-lated ERG a- and b-waves, and fundus reflectometry.Informed consent was obtained from the patients andfrom normal subjects involved in the study after thenature of the procedures had been explained fully.The research procedures were in accordance with in-stitutional guidelines and with the Declaration of Hel-sinki.
Visual Function Tests
Static threshold perimetry in the dark- and light-adapted states was performed using techniques previ-ously described.1112 For dark-adapted perimetry, 75loci (12° grid) in the visual field were tested with 650nm and 500 nm stimuli (target size V). Photoreceptormediation at each locus was determined from the sensi-tivity differences between the two stimulus colors, androd sensitivity losses were calculated based on 500 nmtest results in comparison to normal mean values. Forlight-adapted (10 cd-rrT2 white background) perime-
TABLE l. Clinical Characteristics of the Patients
PatientNo.
Q64ter1234567§7"89
101 1121314
Intron 4 splice site151617
GenerationNo.
IVIVIIIIIIIIIIIIIIIII1111II11II
IIIIII
Age (yr)/Sex
1 1/MJ3/F24/M32/F34/M35/F30/F37/F43/F64/M65/F71/M73/F75/F76/M
21/F46/M76/F
Visual Acuity*
RE
20/2520/4020/2020/4020/3020/3020/2020/5020/4020/302/200
20/6020/60
LP7/200U
20/2020/50**HM
LE
20/3020/3020/2020/4020/3020/3020/2020/10020/3020/50
LP20/10020/60
LP2/200
20/2020/20NLPH
Kinetic Visual
Field ExtentfX(V-4e/I-4e)
41/3537/598/2842/2192/7215/294/7591/4386/<I55/<lU/U
<I/U<l/<]
u31/U#
94/9495/60
U
FundusAppearance^
PRPRPRPRNPRPRPRPRPRPRPRPRPRPR
NNPR
N = no abnormalities; PR = pigmentary retinopathy; HM = hand motions vision; NLP = no light perception; LP = light perception; U =immeasurable.* Best corrected visual acuity.t Similar in the two eyes, unless specified.X Expressed as a percent of normal mean; 2 SD below normal equals 90% for V-4e and 88% for I-4e.19
§ Visit in 1985.11 Visit in 1992.11 Glaucoma.# Nonglaucomatous eye.** Strabismic amblyopia.
Downloaded From: http://iovs.arvojournals.org/pdfaccess.ashx?url=/data/journals/iovs/933178/ on 03/31/2018

Stop Codon Rhodopsin Mutations and RP 2523
try, the same 75 loci were tested with a 600 nm target.Cone sensitivity losses at each locus were determinedby comparison with normal mean values.
Dark adaptometry was tested with 500 nm and650 nm stimuli (target size V) at 12° in the inferiorvisual field. Baseline dark-adapted thresholds were de-termined after at least 3 hours of dark adaptation on aday before exposure to any bright lights. A yellowbleaching light (wavelengths > 520 nm) was deliveredwith Maxwellian optics using a fundus camera (CarlZeiss, Wetzlar, Germany); the 30° diameter field wascentered on the test locus. For each patient, the recov-ery of sensitivity was measured after retinal exposuresof 7.8, 6.9, and 6.3 log scot-td • s. These exposures areexpected to bleach about 99, 50 and 15% of the rho-dopsin originally present, respectively. Further detailsof the method have been reported.13
The time courses of dark adaptation in the pa-tients were analyzed using a model shown to providean accurate description of the kinetics of recovery ofsensitivity in normals after adapting lights that bleachfrom as little as 1% to greater than 99% of the rhodop-sin originally present.1415 Lamb's scheme postulatesthat the control of rod sensitivity results from the per-sistent presence of small amounts of R* (the activatedform of photolyzed rhodopsin) after extinction of theadapting light. Lamb proposed that the R* is pro-duced from relatively long-lived rhodopsin photoprod-ucts Sj, via reverse reactions. The model thus consistsof three sequential first-order reactions, each of whichis weakly reversible and one of which saturates (i.e.,becomes zero-order) after intense light adaptation:
S2 ^==± Sk21 k32
Rhodopsinlight
where interconvers ion of S2 and S3 is ra te limited, witha half-saturat ing value for S2 of S2sal. T h e model doesnot identify the individual p h o t o p r o d u c t s , which inprinciple could include one or more forms of phos-phorylated opsin and/or opsin to which arrestin isbound. Though it does not have a comprehensivefoundation of specified molecular reactions involvingthe rhodopsin molecule, it provides a relatively simplebasis for describing quantitatively the kinetic abnor-malities observed in several forms of RP, with an accu-racy and level of detail that is unattainable using con-ventional mathematical schemes proposed for roddark adaptation in the intact eye (for example, refs. 16and 17). In particular, it enables various time domains(each associated with the relative abundance of one ofthe species Sls S2, or S3) during dark adaptation to beidentified. As a result, the extent to which each ofthese is affected in patients with rhodopsin mutations
can be individually assessed. Solutions of the set offirst-order differential equations describing the modelwere obtained by numerical integration using theRunga-Kutta method,18 and for each subject valuesfor the parameters were obtained by minimizing theerrors of the fits to the rod recovery data for all threebleaches.
Full-field ERGs were performed using bipolarBurian-Allen contact lens electrodes and a computer-based system previously described.19'20 Suprathresh-old stimuli were used to elicit a rod ERG (blue flash of—0.1 log scot-td *s, dark-adapted); a mixed cone androd ERG (white flash of 5.4 cd • s • m~2, dark-adapted);and a cone flicker ERG (29 Hz white light flashes of0.64 cd'S«m~2, on a white background of 6.9cd • m~2). ERGs were also elicited in the dark-adaptedstate to different intensities of blue (Wratten 47B; Ko-dak, Rochester, NY) light flashes over a 3 log unitrange (up to 1.8 log scot-td • s). Waveforms were mea-sured conventionally as follows: b-wave amplitudefrom baseline or the a-wave trough (when present) tothe major positive peak; implicit time from stimulusonset to the major peak of the response; and for thecone flicker ERG, amplitude from negative to positivepeak and timing to the positive peak. The Naka-Rush-ton equation [V = Vmax*In/(In + Kn)] was fitted to themeasured b-wave amplitudes from the intensity seriesto blue light flashes. In the equation, V is rod b-waveamplitude; Vmax, the amplitude at response saturation;I, the stimulus intensity; K, the intensity at half Vm;ix;and n, the exponent responsible for the slope of thefunction.
Rod-isolated ERGs to high-intensity stimuli wereperformed using unipolar Burian-Allen contact lenselectrodes and recording and analysis methods previ-ously published.21 In brief, pairs of scotopicallymatched waveforms to blue (Wratten 47A) and red(Wratten 26) flashes were digitally subtracted to give acone ERG, that was then subtracted from the responseto a photopically matched blue flash (double subtrac-tion technique22). Responses to a range of intensitiesfrom 2 log scot-td • s to 4.5 log scot-td • s in 0.3 log unitsteps were recorded.
The photoreceptor generated component of therod-isolated ERG, PHI23 or P324, was estimated by fit-ting a mathematical model to the leading edge of thea-waves in the intensity series. The model consisted ofa family of delayed Gaussian functions of time andstimulus intensity25"28:
t) = Rr - e x p [ - - - I - < 7 - ( t - t d ) 20)
where Rniax is the maximum response amplitude in nV;I, the energy of a brief flash in scot-td • s; a, the sensitiv-ity in scot-td"1 • s~3; t, the time after flash onset in sec-
Downloaded From: http://iovs.arvojournals.org/pdfaccess.ashx?url=/data/journals/iovs/933178/ on 03/31/2018

2524 Investigative Ophthalmology 8c Visual Science, April 1994, Vol. 35, No. 5
onds; and td, a brief time delay in seconds that approx-imates the initial stages of the transduction cascade aswell as delays due to the recording apparatus. The sen-sitivity parameter a is equal to the product of k ,̂ whichis the number of isomerizations produced per rod perscot-td • s of retinal illuminance, and A, which is theamplification constant in s"2. The amplification con-stant A is the product of the rate of activated phospho-diesterase production per isomerized rhodopsin mole-cule, the rate of cGMP hydrolysis per activated phos-phodiesterase, and the Hill coefficient governing thefraction of open channels.25"27 The value of k̂ , is esti-mated to be approximately 5 in normal subjects.25
Parameters of the P3 model (Rmax, o, and td) weredetermined in two steps. First, the waveforms wereedited to make the pre-stimulus baselines coincide andwere cut at the time when the b-wave intrudes. Next,the edited waveforms were used to find automatically(Matlab 4.0, The Math Works, Natick, MA) the twoparameter values (a and td) that minimize the squarederror between the model and the ensemble of wave-forms. The parameter Rmax was set equal to the largestnegative amplitude in the series. To permit indepen-dent comparisons of Rnuix and a in patients and normalsubjects, the response amplitude predicted by the P3model was plotted against stimulus intensity for a fixedtime.2'' For a fixed time after the time delay (t — td = T),the photoreceptor response shown in equation 1reaches half-maximum response at the intensity
Q344ter
Q64ter
2•ln(2)50% (2)
On a graph of response amplitude versus log stimulusenergy, a change in Rmax would correspond to a verti-cal scaling and a change in a would correspond to ahorizontal shift.
Imaging fundus reflectometry was performedwith instrumentation and methods already de-scribed.30" Rhodopsin losses in the patients were de-termined by comparison of their double difference val-ues (at 520 nm) with those from normal subjects atmatched retinal locations. To study the relationshipbetween the rhodopsin levels and rod-mediated sensi-tivity, dark-adapted static perimetric measurementswith the 500 nm stimulus were made at 25 loci withinthe retinal region tested with fundus reflectom-e t r y 10..3
RESULTS
The schematic drawing of the rhodopsin molecule inFigure 1 shows the sites of the Q64ter, intron 4 splicesite, and Q344ter mutations. The Q64ter mutationwould encode a truncated protein missing six of the
G-T,bp4335
FIGURE l. Schematic drawing of the rhodopsin molecule.Amino acids are shown as circles. The sites of the mutationscarried by the patients in this study are indicated.
seven transmembrane domains, including the site ofattachment of 11-cis retinal.6 The substitution in thedonor splice site of intron 4 could lead to an abnormalcarboxy terminal region of the molecule. The Q344termutation encodes a protein missing the last five aminoacids.20
Table 1 shows some clinical characteristics of thepatients in this study. In the family with the Q64termutation, 12 of the 14 heterozygotes examined haveophthalmoscopic features of RP with attenuated reti-nal vessels, pigmentary retinopathy, and a waxy paleappearance to the optic nerve head. P5 has a normalophthalmoscopic examination, and his sister, P7, hascystoid macular edema and only a few pigmentarychanges in the peripheral retina. Visual acuities andkinetic visual fields range from normal or nearly nor-mal to moderately or severely abnormal.
In the family with the intron 4 splice site mutation,PI5 and PI6 have normal-appearing fundi, but PI7has ophthalmoscopic evidence of an advanced stage ofRP in both eyes. Visual acuities ranged from normal(PI5 in both eyes; PI6 in his non-amblyopic eye) toseverely abnormal (PI 7 in her eye without glaucoma).Kinetic fields were normal in PI5, slightly subnormalin PI6, and reduced to a small central island in PI7.Records obtained from previous examinations of PI 7indicated that Goldmann kinetic perimetry (V-4e tar-get) 15 years earlier showed a central island and a tem-poral peripheral island separated by a nearly completeannular midperipheral scotoma; another field 5 yearsearlier showed only a small central island of vision.
In our previous description of the phenotype of afamily with RP caused by the Q344ter mutation, wenoted that three siblings carrying the mutation hadnormal ocular examinations, normal visual acuitiesand kinetic fields, and abnormal rod function but nor-mal cone function (patients 1 to 3 in ref. 10). In thepresent study, two of the patients, designated as PI8
Downloaded From: http://iovs.arvojournals.org/pdfaccess.ashx?url=/data/journals/iovs/933178/ on 03/31/2018

Stop Codon Rhodopsin Mutations and RP 2525
and PI9 (representing patients 2 and 3, respectively,in ref. 10), were reexamined with further visual func-tion tests to permit comparison with results obtainedfrom the patients with mild phenotype from the fami-lies with Q64ter and splice site mutations.
Figure 2 shows results of kinetic and static perime-try in three family members with the Q64ter mutation,representing different degrees of disease expression.P5 has a normal extent of visual field with kinetic pe-rimetry using the V-4e target but a slightly reducedextent with the I-4e target (Table 1). There is rod sensi-tivity loss (mean loss, 11.3 dB; SD 2.2 dB) across mostof the visual field. P4 has a kinetic visual field withreduced extent in the periphery with both target sizes(Table 1); rod sensitivity losses are far greater (mean ofthe 46 loci with measurable function, 32.9 dB; SD 9.2dB) than in P5. The kinetic field of P2, the daughter ofP4, using the V-4e target has a central island separatedfrom an island in the temporal peripheral field by an
incomplete annular midperipheral scotoma; with theI-4e target, the field is limited to only a central island.Rod sensitivity is measurable only centrally and in thetemporal periphery and is reduced by between 2 and 3log units at these loci (mean of the 22 loci with measur-able function, 30 dB; SD 11.2 dB). Mean cone sensitiv-ity losses across the visual field for P5 were 0 dB (SD2.1 dB); mean of loci with measurable function for P4were 9.1 dB (SD 3.8 dB; n = 30 loci) and for P2 were6.0 dB (SD 5.9 dB; n = 15 loci).
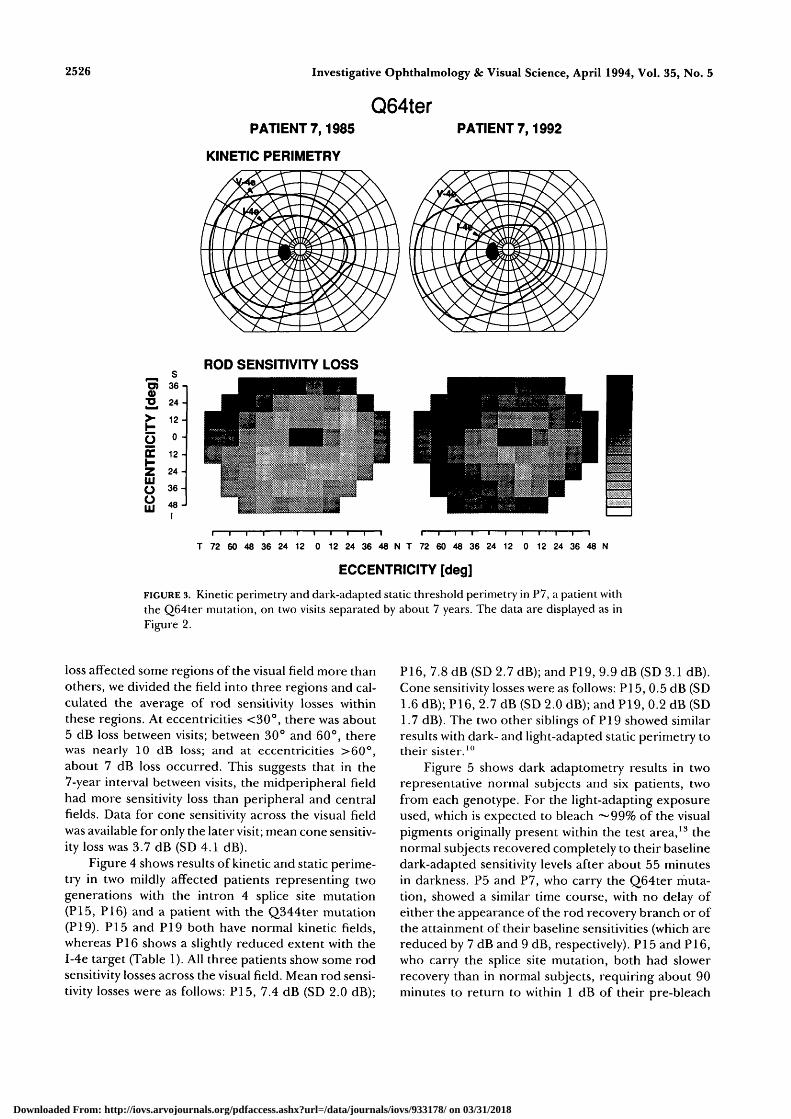
Figure 3 shows perimetric results in P7, the sisterof P5, on two visits separated by about 7 years. In1985, the patient had a normal extent of kinetic fieldwith the V-4e target but a slightly reduced extent withthe I-4e target (Table 1). Rod sensitivity loss at thistime was 10.0 dB (SD 4.8 dB). In 1992, the kinetic fieldto the I-4e is more reduced in extent (Table 1), and rodsensitivity loss had increased (mean 17.6 dB; SD 5.8dB). To determine if this progression of rod sensitivity
Q64terPATIENT 5
KINETIC PERIMETRY
PATIENT 4 PATIENT 2
ROD SENSITIVITY LOSS
0)
2,
£zUJooUJ
3 6 -
2 4 -
12 -
0 -
1 2 -
24 -
3 6 -
4 8 -
N 48 36 24 12 0 12 24 36 48 60 72 T N 48 36 24 12 0 12 24 36 48 60 72 T N 48 36 24 12 0 12 24 36 48 60 72 T
ECCENTRICITY [deg]
FIGURE 2. Kinetic perimetry (upper) and dark-adapted static threshold perimetry (lower) inthree patients with the Q64ter mutation. V (target area 64 mm2) and I (target area 0.25 mm2)targets at intensity 4-e (318 cd • m~2) were used for kinetic perimetry. Results of static perime-try are displayed as gray scales of rod sensitivity losses. Gray scales have 16 levels representing0 to 35 dB (1 dB equals 0.1 log units) sensitivity loss. White is 0 to 2 dB loss, and black isgreater than 35 dB loss. Physiological blind spot is shown as a black square at 12° in thetemporal field.
Downloaded From: http://iovs.arvojournals.org/pdfaccess.ashx?url=/data/journals/iovs/933178/ on 03/31/2018
2526
0)
3̂>oEzUJooUJ
36-
24-
12-
0 -
12 -
24 -
3 6 -
48 -
Investigative Ophthalmology & Visual Science, April 1994, Vol. 35, No. 5
Q64terPATIENT 7,1985 PATIENT 7,1992
KINETIC PERIMETRY
ROD SENSITIVITY LOSS
T 72 60 48 36 24 12 0 12 24 36 48 N T 72 60 48 36 24 12 0 12 24 36 48 N
ECCENTRICITY [deg]
FIGURE 3. Kinetic perinietry and dark-adapted static threshold perimetry in P7, a patient withthe Q64ter mutation, on two visits separated by about 7 years. The data are displayed as inFigure 2.
loss affected some regions of the visual field more thanothers, we divided the field into three regions and cal-culated the average of rod sensitivity losses withinthese regions. At eccentricities <30°, there was about5 dB loss between visits; between 30° and 60°, therewas nearly 10 dB loss; and at eccentricities >60°,about 7 dB loss occurred. This suggests that in the7-year interval between visits, the midperipheral fieldhad more sensitivity loss than peripheral and centralfields. Data for cone sensitivity across the visual fieldwas available for only the later visit; mean cone sensitiv-ity loss was 3.7 dB (SD 4.1 dB).
Figure 4 shows results of kinetic and static perime-try in two mildly affected patients representing twogenerations with the intron 4 splice site mutation(PI5, PI6) and a patient with the Q344ter mutation(PI9). PI5 and PI9 both have normal kinetic fields,whereas PI6 shows a slightly reduced extent with theI-4e target (Table 1). All three patients show some rodsensitivity losses across the visual field. Mean rod sensi-tivity losses were as follows: PI5, 7.4 dB (SD 2.0 dB);
P16, 7.8 dB (SD 2.7 dB); and P19, 9.9 dB (SD 3.1 dB).Cone sensitivity losses were as follows: PI 5, 0.5 dB (SD1.6 dB); P16, 2.7 dB (SD 2.0 dB); and P19, 0.2 dB (SD1.7 dB). The two other siblings of PI 9 showed similarresults with dark- and light-adapted static perimetry totheir sister.10
Figure 5 shows dark adaptometry results in tworepresentative normal subjects and six patients, twofrom each genotype. For the light-adapting exposureused, which is expected to bleach ~99% of the visualpigments originally present within the test area,13 thenormal subjects recovered completely to their baselinedark-adapted sensitivity levels after about 55 minutesin darkness. P5 and P7, who carry the Q64ter muta-tion, showed a similar time course, with no delay ofeither the appearance of the rod recovery branch or ofthe attainment of their baseline sensitivities (which arereduced by 7 dB and 9 dB, respectively). PI 5 and PI6,who carry the splice site mutation, both had slowerrecovery than in normal subjects, requiring about 90minutes to return to within 1 dB of their pre-bleach
Downloaded From: http://iovs.arvojournals.org/pdfaccess.ashx?url=/data/journals/iovs/933178/ on 03/31/2018

Stop Codon Rhodopsin Mutations and RP 2527
3̂>-HOch-ZUJooUJ
s36 -
24 -
12 -
0 -
12 -
24 -
3 6 -
48 -
SPLICE SITEPATIENT 15 PATIENT 16
Q344terPATIENT 19
KINETIC PERIMETRY
ROD SENSITIVITY LOSS
r1 .•
N 48 36 24 12 0 12 24 36 48 60 72 T T 72 60 48 36 24 12 0 12 24 36 48 N T 72 60 48 36 24 12 0 12 24 36 48 N
ECCENTRICITY [deg]
FIGURE 4. Kinetic perimetry and dark-adapted static threshold perimetry in two patients whocarry the intron 4 splice site mutation (PI 5, PI6) and a patient with the Q344ter mutation(PI 9). The data are displayed as in Figures 2 and 3.
sensitivity levels. Recovery of rod sensitivity in the twopatients with the Q344ter mutation is also prolongedand, in each case, takes more than 2 hours to return towithin 1 dB of the pre-bleach level.
The curves fitted to the time course of recovery ofrod function in the patients and the normal subjectsare derived from the scheme proposed by Lamb.14'32
The kinetic parameters used to fit each set of data areshown in Table 2. When there were only small differ-ences between the kinetics of the recovery curves forpatients with the same mutation, a single set of parame-ters was used to generate the curve that describesthem. In the case of the patients with the splice sitemutation, curves were fitted to the data of PI5 andPI6 individually; with one exception (k2i), all abnor-malities were similar in the two patients. Althoughsome of the parameters in the data from the patientswith the Q344ter mutation are similar to those in thedata from patients with the splice site mutation, thereare substantial quantitative differences between thesets associated with the two genotypes.
Electroretinography using a clinical protocolshowed that rod ERGs, mixed cone and rod ERGs, and
cone flicker ERGs were abnormal to varying degreesin the seven members of the family with the Q64termutation who were tested. Patients 4, 6, 8, 12, and 14had no detectable responses to any of the stimuli. P5and P7 had rod b-waves with reduced amplitude andnormal implicit times. Cone flicker amplitude was nor-mal, but timing was delayed in these patients. Serialdata on P7 showed further reduction in rod b-waveamplitude and greater prolongation of cone flickertiming between visits, separated by 7 years. In the fam-ily with the splice site mutation, ERGs in PI5 and PI6showed reduced rod b-wave amplitudes and normal orslightly delayed timing; cone ERGs were normal.ERGs in PI7 were not detectable on an examination15 years earlier. Results with these stimuli in the pa-tients with the Q344ter mutation have been pub-lished.10 They showed mainly rod amplitude abnormal-ities.
Figure 6A shows the first 15 ms of the rod-isolatedresponses in a normal subject and in three patients,each representing a different genotype. These patientshad the mildest disease expression among those exam-ined in their family. The P3 model has been fitted to
Downloaded From: http://iovs.arvojournals.org/pdfaccess.ashx?url=/data/journals/iovs/933178/ on 03/31/2018

2528 Investigative Ophthalmology & Visual Science, April 1994, Vol. 35, No. 5
10
20
30
40
CD K n
> 1 0
U)Z 20LJJCO
30
40
50
60
I NORMAL
°°S5o o"S&S»n) oo
Q OUil)lM>0«>-00
* , SPLICE SITE
v < • * • • • • • • •»
Q64ter
I v, Q344ter
PB 0 20 40 601 2h
PB 0
TIME
20 40 601
mm3h
FIGURE 5. Dark adaptometry results after bleaching of 99% rhodopsin at 12° in the inferiorfield in two normal subjects (upper left); P5 (unfilled squares) and P7 (filled squares) with theQ64ter mutation (upper right); PI5 (unfilled circles) and PI6 (filled circles) with the splicesite mutation (lower left); and PI8 (unfilled triangles) and PI9 (filled triangles) with theQ344ter mutation (lower right). Each panel also includes curves illustrating the fit of a modelfor kinetic analysis of rod dark adaptation to the data from the normal subjects and eachgenotype, using the parameters given in Table 2. PB, pre-bleach or baseline dark-adaptedsensitivity level. Note the compressed time-scale used for times greater than 1 hour after thebleach.
the responses from an intensity series. P5, represent-ing the family with Q64ter mutation, and PI8, repre-senting the family with the Q344ter mutation, havelower maximum amplitude than the normal subject,whereas PI5, with the splice site mutation, has a re-sponse with amplitude closer to that of the normal.
Table 3 lists the P3 model parameters (Rmax, a, td) forsix patients, two from each family, and, for compari-son, the mean and standard deviation for a group ofnormal subjects. Rmax of five of the six patients (exceptPI5) fell outside the range of the normal subjects; aand td were within the normal range for all six patients.
TABLE 2. Parameters* Describing the Kinetics of Rod Dark Adaptometry
PatientNo.
Q64ter57
Intron 4 splice site1516
/~\O A A *. —„
^;o44ter1819
Normal
*»t
0.050.05
0.040.04
0.040.040.045
0.000250.0006
0.00220.004
0.000550.000850.00075
"•23
0.01250.012
0.0090.0085
0.0060.0060.0125
k32
0.000350.0004
0.0000080.000009
0.000050.000030.00005
k34
0.002750.00275
0.00110.0011
0.000750.000750.00275
l32sat+
0.140.14
0.420.42
0.330.330.13
* Parameters were obtained using the model proposed by Lamb14, k10 was treated as invariant from normal in all cases.f ky values are in units of s"1.X S25at is the half saturating concentration of S2-
Downloaded From: http://iovs.arvojournals.org/pdfaccess.ashx?url=/data/journals/iovs/933178/ on 03/31/2018

Stop Codon Rhodopsin Mutations and RP
^ -300
LLJQ -400
J 0Q.2** -100
NORMAL
SPLICE SITE
15 0 5
TIME [ms]
B i 500
t; 400<
§ 200
I 100
2.5 3 3L5 4 4.5"" STIMULUS ENERGY [log scot Id s]
FIGURE 6. (A) Rod-isolated a-waves to different stimulus in-tensities in a normal subject and patients with the Q64ter(P5), the splice site (PI5), and the Q344ter (PI8) rhodopsinmutations. The smooth curves are a family of delayed Gauss-ian functions fitted to the leading edges of a-waves in theintensity series. The stimulus energies were O = 4.5, • =4.2, V = 3.9, T = 3.6, • - 3.3, • = 3.0, A - 2.7, • = 2.4, 0= 2.1 log scot-td • s. (B) Graph of P3 model amplitude at thefixed time of 5 ms after time delay versus log stimulus en-ergy. Solid lines represent the six patients whose data are inTable 3, and the dashed line represents the mean normal.Vertical lines correspond to the intensity producing halfmaximum response, I50%. Error bar on vertical axis is themean normal Rmax — 2 SD; bar on horizontal axis is meannormal I50% ± 2 SD.
The relationship between Rniax and a is shown in Fig-ure 6B, which plots the P3 model amplitude at a fixedtime versus the log stimulus energy for six patients,two from each genotype. The vertical lines denote theI5()% values for the patients.
In Figure 7 are graphs of rod ERG b-wave ampli-tudes at different intensities of blue light flashes in thedark-adapted state in six patients, two representativesof each genotype, compared to normal subjects. Bothpatients with the Q64ter mutation show a reducedVnKlx and an abnormal K. The serial data in P7 arenotable in that they provide some information aboutthe natural history of rod ERG change in the Q64ter
2529
mutation; disease progression in this mutation ap-pears to lead to more reduction of Vniax and a furthershift in K. The patients with the splice site mutationhad abnormal Vniax and K. One of the two patients withthe Q344ter mutation also followed this pattern,whereas another fell just within the normal limits (out-side the ± 1 SD range but inside the ± 2 SD range) forboth Vmax and K. The parameters derived from thefitting of the Naka-Rushton equation to the rod ERGintensity series are given in Table 3. It is of interestthat the ratio of b-wave Vmax to a-wave Rniax is about 1.0or greater for patients with Q64ter and Q344ter mu-tations and for normal subjects. In the splice site mu-tation patients, however, the ratio of these parametersis about 0.5, and there were negative waveforms to allhigh-intensity stimuli. This suggests there is dysfunc-tion not only at the rod outer segment but also at orproximal to the photoreceptor terminal region, suchas has been recently demonstrated in patients with RPof unknown genotype.21
Imaging fundus reflectometry was performed onP5 and P7 from the family with the Q64ter mutationand on PI 5 and PI6 from the family with the splice sitemutation. Figure 8 shows the relation between rho-dopsin levels and psychophysically measured rod sensi-tivity losses in the four patients. In P5 and P7, mea-sured pigment densities were considerably reducedfrom normal by a relatively constant amount. In PI5and PI6, there was greater variation of densitieswithin the measurement area. For all patients, the datapoints lie close to the line illustrating the predictedrelationship for rod sensitivity losses caused by de-creased light absorption as rhodopsin levels diminish.A similar pattern of results was found in patients withthe Q344ter mutation.10
DISCUSSION
The ocular examination results in the patients hetero-zygous for the Q64ter, intron 4 splice site, andQ344ter mutations in the rhodopsin gene showed thatthere was a range of severity of disease expression ineach genotype. Some heterozygotes from each familyhad pigmentary retinopathy with reduced visual acuityand diminished visual field extent, whereas others hada normal ophthalmoscopic appearance with normalacuity and full kinetic fields. Rod-specific visual func-tion test results indicated that even the patients whowere apparently unaffected clinically had abnormalrod-mediated function.
Dark-adapted perimetry has shown specific pat-terns of rod sensitivity loss, such as diffuse or altitu-dinal patterns, in previous studies of adRP patientswith rhodopsin mutations.10'13 Regional retinal differ-ences in disease severity were not discernible from theavailable data in the families with splice site and
Downloaded From: http://iovs.arvojournals.org/pdfaccess.ashx?url=/data/journals/iovs/933178/ on 03/31/2018

2530 Investigative Ophthalmology & Visual Science, April 1994, Vol. 35, No. 5
TABLE 3. Rod Isolated ERG Results
PatientNo.
Q64ter5
n7§Intron 4 splice site
1516
Q344ter1819
NormalsMean ± SD11
Rmax
(*V)
168NA
99
373313
224154
433 ± 46
0"
(scot-td~' -s~3)
32.2NA18.8
43.533.5
20.928.6
30.5 ± 7.3
A-wave*
h(msec)
3.3NA3.0
3.43.5
3.23.5
3.3 ± 0.2
Vmax
166195133
176151
289211
418 ±74
logK(log scot-td -
0.17-0.29
0.17
0.05-0.27
-0.40-0.29
-0.59 ± 0.
B-wave-f
s) n
0.840.960.75
0.641.16
0.750.96
16 0.88 ±0.13
NA = not available.* Parameters of the P3 model fit to the rod-isolated a-wave intensity series.f Parameters of the Naka-Rushton curve fit to rod-isolated b-vvave intensity series.+ Visit in 1985.§ Visit in 1992." n = 8 for a-wave; n = 57 for b-wave.
Q344ter mutations. Serial measurements in one pa-tient with the Q64ter mutation suggested vulnerabilityof the midperiphery with disease progression, and thisis consistent with the findings in more affectedmembers of this family who had midperipheral scoto-mas and retained central and peripheral patches ofrod function. A comparison of patients with the mild-est phenotypes in the three genotypes indicates that,on average, patients with the Q64ter mutation had thegreatest degree of rod sensitivity loss and lowest levelsof measurable rhodopsin, whereas those with theQ344ter mutation were intermediate, and splice sitemutation patients had the least sensitivity loss andsome of the higher levels of rhodopsin measured. Therod sensitivity losses in all patients were consistentwith decreased probability of light absorption fromthe reduced levels of rhodopsin, as has been found inother rhodopsin mutations.1013 Thus, when darkadapted, these patients did not appear to have sub-stantial quantities of photolyzed pigment productsacting as a source of equivalent light in the photore-ceptors, as has been proposed to occur in some formsof RP.33
Rod ERG a-wave and b-wave analyses have beenapplied to patients with RP of unknown geno-type 21.24.27,29.34-36 but the present study is the first touse this approach to interpret the waveforms from pa-tients with rhodopsin mutations. The a-wave analysisin our patients showed that the maximum receptorresponse (Rmax) was reduced compared to the normal
mean result, and a-wave sensitivity (a) fell within ournormal limits. The rod b-wave results showed varyingamounts of reduction of Vmax and abnormalities in K.This ensemble of ERG findings is consistent with cer-tain hypothesized underlying disease mechanisms, butnot with others. For example, a disease process affect-ing the sensitivity of all rods across the retina in thesame way, such as a decreased number of rhodopsinmolecules in otherwise normal rods,7'8 would not ex-plain the reduced a-wave and b-wave maximum re-sponses and normal a-wave sensitivity.24'29'37 A retinawith well-functioning rods interspersed with nonfunc-tional receptors could lead to ERG findings such as weobserved in our patients.2429'37 It is also possible thatthe disease mechanism is more complex, and partiallyfunctional receptors may be contributing subnormallyto the full-field response.29'37
Rod dark adaptation has been found to be abnor-mal in many different mutations of the rhodopsingene that cause adRP, and kinetic analyses of the re-sults have shown there can be specific abnormalities inthe different genotypes.38 Analyses of rod dark adapta-tion data in the present study indicate there are verydifferent mechanisms of dysfunction in the three geno-types. The approximately normal time course of roddark adaptation in patients with the Q64ter mutationsuggests that this function is essentially mediated bywild-type protein. However, the analysis indicates thatat least one of the parameters, k32, is abnormal, and bysimilar amounts in both P5 and P7 (Table 2). The in-
Downloaded From: http://iovs.arvojournals.org/pdfaccess.ashx?url=/data/journals/iovs/933178/ on 03/31/2018

Stop Codon Rhodopsin Mutations and RP 2531
400
300
200
LU 100Q
Q_
LU
^ 400
Q64ter
'85i '92
cb
o • SPLICE SITEA • Q344ter
300
200
100
°-2 -1 I I 0T 1STIMULUS ENERGY [log scot td s]
FIGURE 7. ERG b-wave amplitude as a function of stimulusenergy for normal subjects and the patients. {Top) Resultsfrom P5 (unfilled squares) and two visits for P7 (filledsquares), both of whom have the Q64ter mutation. (Bottom)Results from PI 5 (unfilled circles) and PI 6 (filled circles)with the splice site mutation, and PI 8 (unfilled triangles) andPI 9 (filled triangles) with the Q344ter mutation. Solidcurves are the fits of the Naka-Rushton function to the pa-tient data; arrows with symbols denote K for the patients.Dashed curve is a mean normal function; error bar on verti-cal axis is mean normal V,nax — 2 SD; bar on horizontal axis ismean normal K ± 2 SD.
crease in k32, which is not seen in the splice site andQ344ter mutations, suggests the possibility of somefactor that interferes with the control of rod sensitiv-ity, at least during the later stages of recovery.39
In patients with the intron 4 splice site mutation,unlike the Q64ter mutation, there is prolonged recov-ery of sensitivity, which is reflected by the low valuesfound in the kinetic analysis (Table 2) for k34, the pa-rameter that characterizes the last stage in the recov-ery of sensitivity (and is loosely identifiable with theregeneration of photo-activatable rhodopsin). Valueswere also abnormal for the other parameters asso-ciated primarily with the later stages of recovery. The
functional abnormalities (on the basis of this model)may thus be associated with relatively slow reactions,such as the binding of arrestin to bleached rhodopsin,and the reduction and removal of the aU-trans retinalfrom the binding site. It has been suggested that thephotoproducts involved in these reactions may play arole in setting the sensitivity of the rod.34'40"42 Therates of interconversions of one or more of them maydepend on the integrity of the carboxy terminal regionof rhodopsin.45 In the splice site mutation, this regionof the molecule is likely to be abnormal. Interestingly,both in patients with this mutation and in those withthe Q344ter mutation, the value of S2s;ll, the half-sat-urating concentration of S2, is found to be about twiceas large as normal, implying that the factor within theouter segment that limits the rate of this reaction afterintense bleaching1432 is present in abnormally highamounts relative to those of the expressed rhodopsin.
Rod dark adaptometry in patients with theQ344ter mutation also showed a prolonged recoveryof sensitivity, but this differed quantitatively from theabnormality in the splice site mutation. As expectedfrom the extended period required for complete sensi-tivity recovery after a 99% bleach (Fig. 4), the kinetic
40 F
100 80 60 40 20
% RHODOPSINFIGURE 8. Relationship between rod sensitivity loss and rho-dopsin levels in P5 and P7, who carry the Q64ter mutation,and PI 5 and PI6, who carry the splice site mutation. Datafrom P5 and P7 are mean values for the central 10 X 10°rectangle of the measurement area; data points for PI 5 andPI6 are individual values from within the measurementarea. The solid line describes the expected relationship ifrod sensitivity loss was caused solely by the decreased proba-bility of light absorption resulting from reduced levels ofrhodopsin. Symbols as in Figure 7.
Downloaded From: http://iovs.arvojournals.org/pdfaccess.ashx?url=/data/journals/iovs/933178/ on 03/31/2018

2532 Investigative Ophthalmology & Visual Science, April 1994, Vol. 35, No. 5
analysis yielded values for k23 and k34 that were lowerthan those for patients with the splice site mutation(Table 2). The prolonged desensitization of the rodafter bleaching may relate to defective reactions in thevisual cycle of this mutant opsin because of the alteredcarboxy terminus of the molecule.43'44
The relationship between the results of noninva-sive tests of visual function and the underlying photo-receptor pathophysiology is complex, but our findingsin the mildly affected patients permit some specula-tion about the disease mechanisms in these three geno-types. The Q64ter mutation, in theory, would be afunctional null mutation. The measurable rhodopsinby fundus reflectometry and the rod-mediated func-tion detected by psychophysics and electroretinogra-phy in these patients indicate that some rhodopsin(presumably only wild-type) has been synthesized,transported to the outer segment, and inserted intothe disk membrane, and phototransduction does oc-cur. A simple quantal catch model based on 50% of therhodopsin molecules in each rod, which was used toexplain the test results in other putative null muta-tions,7 does not explain fully the results of the mostmildly affected patients with the Q64ter mutation. Ofcourse, even these patients may already be at a laterstage of this progressive retinal degeneration, whichcould have started with a 50% reduction in the numberof rhodopsin molecules per rod. The unexpected find-ing of an abnormality in dark adaptation suggests thatsome factor, such as partial expression of the mutantprotein or some aspect of the degenerative process ofthe disease, may be interfering with recovery of sensi-tivity of the wild-type protein after light activation.
The intron 4 splice site mutation was also hypoth-esized to be a null allele based on examination of oneheterozygote with this genotype whose clinical pheno-type and rod function abnormalities were similar tothose of heterozygotes with the E249ter mutation.7
The finding of as much as 75% of normal rhodopsinlevels in some retinal regions by fundus reflectometryand the abnormality in rod dark adaptation would notbe expected from rods with only half the normalamount of wild-type rhodopsin. We speculate thatboth wild-type and mutant opsins are synthesized,transported to the outer segment, and inserted intothe disk membrane and that, at very early stages of thedisease, rod outer segment length and rhodopsin con-centration may be normal. The abnormal carboxy ter-minal region of the mutant rhodopsin moleculeswould lead to the abnormal kinetics of recovery ofsensitivity after light activation.
The patients with the Q344ter mutation had roddark adaptation results that lead to the speculationthat this mutant opsin, like the splice site mutant, issynthesized and transported to the outer segment,
where it causes a specific abnormality in the kinetics ofrecovery of rod sensitivity after light activation due tothe truncation at the carboxy terminal region. Lend-ing support to our hypothesis that this mutant opsinmay reach the rod outer segment are the results of aninvestigation of the biochemical phenotype of theQ344ter mutant rhodopsin in vitro showing that thismutant was synthesized, regenerated with 11-cis reti-nal, and transported to the plasma membrane.9
The steps leading from the different types of roddysfunction in the Q64ter, splice site, and Q344termutations to rod cell death are unknown. Further pro-gress in the elucidation of the exact mechanisms ofdysfunction and cell death of rod photoreceptors re-sulting from mutations in the rhodopsin gene will re-quire the use of a number of different approaches,such as studies of the mutant opsins in vitro,9'4546 oftransgenic animals,47"50 and of donor retinas from pa-tients with known genotypes.51
An important issue concerning the genetic coun-seling of patients with rhodopsin gene mutationsarises from the findings in this study. With this report,there are now five rhodopsin mutations in which someheterozygotes have been described as having a normalophthalmoscopic appearance and relatively mild reti-nal functional abnormalities: Q344ter,10 P23H,13
E249ter,7 intron 4 splice site (ref. 7 and presentstudy), and Q64ter (present study). Four of these fiverhodopsin mutations have been associated with adRP;the exception is the E249ter mutation, in which het-erozygotes were considered carriers of arRP.7 Until welearn more about the basis for variation in disease ex-pression in RP, caution dictates that all clinically unaf-fected heterozygotes with rhodopsin gene mutationsshould be counseled as if they have adRP. Even if notdestined for severe visual loss themselves, they shouldbe told of the 50-50 chance of having children whocould express a more severe form of the disease; and,considering the family with the E249ter mutation,7
they should be made aware of the chances of produc-ing a homozygote with a consanguineous marriage.Increasing recognition of the wide spectrum of diseaseexpression in different genotypes of retinal degenera-tion makes the determination of the basis of this varia-tion a topic of clinical and scientific importancewarranting further study.52'53
Key Words
null mutation, retinitis pigmentosa, rhodopsin, rod photore-ceptor, stop codon
Acknowledgments
The authors thank Mrs. D. Slaughter, Ms. K. Stewart, andMrs. B. Koernig for coordinating this study; Dr. X. Sun and
Downloaded From: http://iovs.arvojournals.org/pdfaccess.ashx?url=/data/journals/iovs/933178/ on 03/31/2018
Stop Codon Rhodopsin Mutations and RP 2533
Mr. D. Azevedo for help with data acquisition; and Mr. B.Eisner for assistance with data analysis. Dr. D. Hood kindlyprovided Matlab scripts used for automated fitting of thea-wave model.
References
1. Humphries P, Farrar GJ, Kenna P. Autosomal domi-nant retinitis pigmentosa: Molecular, genetic and clin-ical aspects. In: Osborne N, Chader G, eds. Progress inRetinal Research. Oxford: Pergamon Press; 1993:231-245.
2. Sung C-H, Davenport CM, Hennessey JC, et al. Rho-dopsin mutations in autosomal dominant retinitis pig-mentosa. Proc Natl Acad Sci USA. 1991; 188:6481-6488.
3. Dryja TP, Hahn LB, Cowley GS, McGee TL, BersonEL. Mutation spectrum of the rhodopsin gene amongpatients with autosomal dominant retinitis pigmen-tosa. Proc Natl Acad Sci USA. 1991; 88:9370-9374.
4. Sheffield VC, Fishman GA, Beck JS, Kimura AE,Stone EM. Identification of novel rhodopsin muta-tions associated with retinitis pigmentosa by GC-clamped denaturating gradient gel electrophoresis.Am J Hum G<??i<?n 991; 49:699-706.
5. Inglehearn CF, Keen TJ, Bashir R, et al. A completedscreen for mutations of the rhodopsin gene in a panelof patients with autosomal dominant retinitis pigmen-tosa. Hum Mol Genet. 1993; 1:41-45.
6. Macke JP, Davenport CM, Jacobson SG, et al. Identifi-cation of novel rhodopsin mutations responsible forretinitis pigmentosa: Implications for the structureand function of rhodopsin. Am J Hum Genet.1993;53:80-89.
7. Rosenfeld PJ, Cowley GS, McGee TL, Sandberg MA,Berson EL, Dryja TP. A null mutation in the rhodop-sin gene causes rod photoreceptor dysfunction andautosomal recessive retinitis pigmentosa. NatureGenet. 1992; 1:209-213.
8. Mclnnes RR, Bascom RA. Retinal genetics: A nullify-ing effect for rhodopsin. Nature Genet. 1992; 1:155-157.
9. Sung C-H, Schneider BG, Agarwal N, PapermasterDS, Nathans J. Functional heterogeneity of mutantrhodopsins responsible for autosomal dominant retini-tis pigmentosa. Proc Natl Acad Sci USA. 1991;88:8840-8844.
10. Jacobson SG, Kemp CM, Sung C-H, Nathans J. Reti-nal function and rhodopsin levels in autosomal domi-nant retinitis pigmentosa with rhodopsin mutations.Am J Ophthalmol. 1991; 112:256-271.
11. Jacobson SG, Voigt WJ, Parel J-M, et al. Automatedlight- and dark-adapted perimetry for evaluating reti-nitis pigmentosa. Ophthalmology. 1986; 93:1604-1611.
12. Jacobson SG, Apathy PP, Parel J-M. Rod and coneperimetry: Computerized testing and analysis. In:Heckenlively J, Arden GB, eds. Principles and Practiceof Clinical Vision Testing. St Louis: Mosby-Year Book;1991:475-482.
13. Kemp CM, Jacobson SG, Roman AJ, Sung C-H, Na-thans J. Abnormal rod dark adaptation in autosomaldominant retinitis pigmentosa with pro-23-his rho-dopsin mutation. Am f Ophthalmol. 1992; 113:165-174.
14. Lamb TD. The involvement of rod photoreceptors indark adaptation. Vision Res. 1981; 21:1773-1782.
15. Kemp CM, Jacobson SG, Cideciyan AV, Sung CH,Nathans J. Kinetic analysis of abnormal rod dark adap-tation in autosomal dominant retinitis pigmentosawith rhodopsin mutations. ARVO Abstacts. Invest Oph-thalmol Vis Sci. 1992;33:1397.
16. DowlingJE. Chemistry of visual adaptation in the rat.Nature. 1960; 188:114-118.
17. Rushton WAH. The Ferrier lecture 1962: Visual adap-tation. Proc R Soc Lond (B). 1965; 162:20-46.
18. Press WH, Flannery BP, Teukolsky SA, VetterlingWT. Numerical Recipes. London: Cambridge Univer-sity Press; 1986.
19. Jacobson SG, Yagasaki K, Feuer WJ, Roman AJ. Inter-ocular asymmetry of visual function in heterozygotesof X-linked retinitis pigmentosa. Exp Eye Res.1989;48:679-691.
20. Jacobson SG, Roman AJ, Cideciyan AV, Robey MG,IwataT, Inana G. X-linked retinitis pigmentosa: Func-tional phenotype of an RP2 genotype. Invest Ophthal-mol Vis Sci. 1992;33:3481-3492.
21. Cideciyan AV, Jacobson SG. Negative electroretino-grams in retinitis pigmentosa. Invest Ophthalmol VisSci. 1993;34:3253-3263.
22. Sandberg MA, Miller S, Berson EL. Rod electroretino-grams in an elevated cyclic guanosine monophos-phate-type human retinal degeneration. Invest Ophthal-mol Vis Sci. 1990;31:2283-2287.
23. Granit R. The components of the retinal action poten-tial in mammals and their relation to the discharge inthe optic nerve. / Physiol. 1933; 77:207-239.
24. Hood DC, Birch DG. A computational model of theamplitude and implicit time of the b-wave of the hu-man ERG. Vis Neurosci. 1992;8:107-126.
25. Lamb TD, Pugh EN. A quantitative account of theactivation steps involved in phototransduction in am-phibian photoreceptors. / Physiol. 1992; 449:749-758.
26. Pugh EN, Lamb TD. Amplification and kinetics of theactivation steps in phototransduction. Biochim BiophysActa. 1993;1141:111-149.
27. Breton ME, Schueller AW, LambTD, Pugh EN. Analy-sis of ERG a-wave amplification and kinetics in termsof the G-protein cascade of phototransduction. InvestOphthalmol Vis Sci. 1994;35:295-310.
28. Hood DC, Birch DG. Light adaptation of human rodreceptors: The leading edge of the human a-wave andmodels of rod receptor activity. Vision Res. 1993;33:1605-1618.
29. Hood DC, Shady S, Birch DG. Heterogeneity in reti-nal disease and the computational model of the hu-man-rod response./ Opt Soc Am. 1993; 10:1624-1630.
30. Faulkner DJ, Kemp CM. Human rhodopsin measure-
Downloaded From: http://iovs.arvojournals.org/pdfaccess.ashx?url=/data/journals/iovs/933178/ on 03/31/2018

2534 Investigative Ophthalmology 8c Visual Science, April 1994, Vol. 35, No. 5
ments using a TV-based imaging fundus reflectom-eter. Vision Res. 1984;24:221-231.
31. Kemp CM, Faulkner DJ, Jacobson SG. The distribu-tion and kinetics of the visual pigments in the cat ret-ina. Invest Ophthalmol Vis Sci. 1988; 29:1056-1065.
32. Lamb TD. Dark adaptation: A re-examination. In:Hess RF, Sharpe LT, Nordby K, eds. Night Vision.Cambridge: Cambridge University Press. 1990:177-222.
33. Fain GL, Lisman JE. Photoreceptor degeneration invitamin A deprivation and retinitis pigmentosa. ExpEye Res. 1993; 57:335-340.
34. Massof RW, Wu L, Finkelstein D, Peny C, Starr SJ,Johnson MA. Properties of electroretinographic in-tensity-response function in retinitis pigmentosa. DocOphthalmol. 1984; 57:279-296.
35. Arden GB, Carter RM, Hogg CR, et al. Rod and coneactivity in patients with autosomal dominantly in-herited retinitis pigmentosa: Comparisons betweenpsychophysical and electrophysiologic measurements.Br] Ophthalmol. 1983;67:405-418.
36. Birch DG, Fish GE. Rod ERGs in retinitis pigmentosaand cone-rod degeneration. Invest Ophthalmol Vis Sci.1987;28:140-150.
37. Hood DC, Shady S, Birch DG. Interpretation of Naka-Rushton parameters from patients with ADRP andCRD. In: Technical Digest on Non-Invasive Assessment ofthe Visual System. Washington, DC: Optical Society ofAmerica; 1993:1-4.
38. Kemp CM, Jacobson SG, Cideciyan AV, Wu S. Kineticanalyses of rod dark adaptation in normals and in au-tosomal dominant retinitis pigmentosa with rhodop-sin mutations. ARVO Abstracts. Invest Ophthalmol VisSci. 1993; 34:1074.
39. Fain GL, Cornwall MC. Light and dark adaptation invertebrate photoreceptors. In: Shapley R, Lam DK,eds. Contrast Sensitivity: From Receptors to Clinic. Cam-bridge, MA: MIT Press; 1993:3-32.
40. Corson DW, Cornwall MC, MacNichol EF, et al. Sen-sitization of bleached photoreceptors by 11-cis-lockedanalogues of retinal. Proc Natl Acad Sci USA.1990;87:6823-6827.
41. Cornwall MC, Fain G. Bleaching of rhodopsin in iso-lated rods causes a sustained activation of PDE andcyclase which is reversed by pigment regeneration.ARVO Abstracts. Invest Ophthalmol Vis Sci. 1992; 33:1103.
42. Hofmann FP, Pulvermiiller, Buczylko J, Van HooserP, Palczewski K. The role of arrestin and retinoids inthe regeneration pathway of rhodopsin. J Biol Chem.1992;267:15701-15706.
43. Hargrave PA, McDowell JH. Rhodopsin and photo-transduction: A model for G protein-linked receptors.FASEBJ. 1992;6:2323-2331.
44. Dolph PJ, Ranganathan R, Colley NJ, Hardy RW, So-colich M, Zuker CS. Arrestin function in inactivationof G protein-coupled receptor rhodopsin in vivo.Science. 1993; 260:1910-1916.
45. Khorana HG. Rhodopsin, photoreceptor of the rodcell. J Biol Chem. 1992;267:l-4.
46. Min KC, Zvyaga TA, Cypess AM, Sakmar TP. Charac-terization of mutant rhodopsins responsible for auto-somal dominant retinitis pigmentosa: Mutations onthe cytoplasmic surface affect transducin activation./Biol Chem. 1993;268:9400-9404.
47. Olsson JE, Gorden JW, Pawlyk BS, et al. Transgenicmice with a rhodopsin mutation (Pro-23-His): Amouse model of autosomal dominant retinitis pigmen-tosa. Neuron. 1992;9:815-830.
48. Naash MI, HollyfieldJG, Al-Ubaidi MR, Baehr W. Sim-ulation of human autosomal dominant retinitis pig-mentosa in transgenic mice expressing a mutated mu-rine opsin gene. Proc Natl Acad Sci USA. 1993; 90:5499-5503.
49. Huang P, Gaitan A, Hao Y, Peters RM, Wong F. Cel-lular interactions implicated in the mechanism of pho-toreceptor degeneration in transgenic mice express-ing a mutant rhodopsin gene. Proc Natl Acad Sci USA.1993;90:8484-8488.
50. Chang G-Q, Hao Y, Wong F. Apoptosis: Final com-mon pathway of photoreceptor death in rd, rds andrhodopin mutant mice. Neuron. 1993; 11:595-605.
51. Li Z-Y, Jacobson SG, Milam AH. Autosomal dominantretinitis pigmentosa caused by the threonine-17-methi-onine rhodopsin mutation: Retinal histopathologyand immunocytochemistry. Exp Eye Res. In press.
52. Humphries P. Hereditary retinopathies: Insights intoa complex genetic aetiology. Br J Ophthalmol.1993;77:469-470.
53. Moore AT, Fitzke F, Jay M, et al. Autosomal dominantretinitis pigmentosa with apparent incomplete pene-trance: A clinical, electrophysiological, psychophysicaland molecular genetic study. Br J Ophthalmol.1993;77:473-479.
Downloaded From: http://iovs.arvojournals.org/pdfaccess.ashx?url=/data/journals/iovs/933178/ on 03/31/2018