PHENOMENA OF PNEUMATIC TIRE HYDROPLANING Langley … · 2017-04-15 · PHENOMENA OF PNEUMATIC TIRE...
56
NASA t.f-t | Z t--- Z TECHNICAL NOTE NASA TN D-2056 PHENOMENA OF PNEUMATIC TIRE HYDROPLANING by Walter B. Horne and Robert C. Dreher Langley Research Center Langley Station, Hampton, Va° NATIONAL AERONAUTICSAND SPACEADMINISTRATION • WASHINGTON, D. C. • NOVEMBER 1963 https://ntrs.nasa.gov/search.jsp?R=19640000612 2020-05-12T11:21:33+00:00Z
Transcript of PHENOMENA OF PNEUMATIC TIRE HYDROPLANING Langley … · 2017-04-15 · PHENOMENA OF PNEUMATIC TIRE...

NASA
t.f-t
|
Z
t---
Z
TECHNICAL NOTE NASA TN D-2056
PHENOMENA OF PNEUMATIC
TIRE HYDROPLANING
by Walter B. Horne and Robert C. Dreher
Langley Research Center
Langley Station, Hampton, Va°
NATIONAL AERONAUTICSAND SPACEADMINISTRATION • WASHINGTON, D. C. • NOVEMBER 1963
https://ntrs.nasa.gov/search.jsp?R=19640000612 2020-05-12T11:21:33+00:00Z


TECHNICAL NOTE D-2056
PHENOMENA OF PNEUMATIC TIRE HYDROPLANING
By Walter B. Horne and Robert C. Dreher
Langley Research Center
Langley Station, Hampton, Va.
NATIONAL AERONAUTICS AND SPACE ADMINISTRATION


PHENOMENA OF PNEUMATIC TIRE HYDROPLANING
By Walter B. Home and Robert C. Dreher
SUMMARY
Recent research on pneumatic tire hydroplaning has been collected and sum-
marized with the aim of describing what is presently known about the phenomena
of tire hydroplaning. A physical description of tire hydroplaning is given along
with formulae for estimating the ground speed at which it occurs. Eight manifes-
tations of tire hydroplaning which have been experimentally observed are pre-
sented and discussed. These manifestations are: detachment of tire footprint,
hydrodynamic ground pressure, spin-down of wheel, suppression of tire bow wave,
scouring action of escaping fluid in tire-ground footprint region, peaking of
fluid displacement drag, loss in braking traction, and loss of tire directional
stability. The vehicle_ pavement, tire, and fluid parameters of importance to
tire hydroplaning are listed and described. Finally, the hazards of tire hydro-
planing to ground and air-vehicle-ground performance are listed, and procedures
are given to minimize these effects.
INTRODUCTION
When runway or road surfaces become flooded or puddled with either slush or
water, both aircraft and ground vehicles such as automobiles can at some critical
ground speed encounter the phenomenon of tire hydroplaning. The effects of hydro-
planing can be serious to these vehicles since tires under hydroplaning conditions
become detached from the pavement surface and the ability of tires to develop
braking or cornering traction for stopping or guiding vehicle motion is almost
completely lost. Tire hydroplaning was first noticed and demonstrated experimen-
tally about 1957 during a tire treadmill study. (See ref. i.) This investiga-
tion had been prompted by the low values of tire-to-surface friction found during
wheel spin-up in landings of a large airplane on a wet runway (ref. 2) and by a
rash of military aircraft overrun landing accidents on wet runways. In this tire
treadmill study a small pneumatic tire riding under free rolling (unbraked) con-
ditions on a water covered belt was observed to spin-down to a complete stop at
a critical belt (ground) velocity. Later studies by the National Aeronautics and
Space Administration on full-scale tires (refs. 3 to 9) along with actual opera-
tional experience gained from aircraft take-offs and landings performed on very
wet runways have further substantiated the fact that hydroplaning can create a
very serious slipperiness problem to most pneumatic-tired vehicles.
More recent hydroplaning research performed by the National Aeronautics and
Space Administration and the Federal Aviation Agency (refs. i0 to 17) in this

country and by the Royal Aircraft Establishment (refs. 18 to 24) and others inEngland has enabled the phenomenonof tire hydroplaning to be more completelyunderstood. The purpose of this paper is to synthesize this work and previouswork with the aim of giving a physical description of tire hydroplaning alongwith definitions of the vehicle, pavementwetness, and tire conditions underwhich it can occur. Also included is a section that illustrates the various man-ifestations of hydroplaning in terms of vehicle or tire performance that havebeen uncovered to date. Finally, the hazards of tire hydroplaning to vehicleground performance are listed and procedures are given to minimize these effects.
SYMBOLS
A,B
AG
CL,S
DS
dS
Fv
FV,G
FV,S
g
I
M
P
footprint regions
gross tire contact area, sq in.
hydrodynamic lift coefficient
drag force due to tire rolling at peripheral speed less than ground
speed, _F¥, G
tire free rolling resistance, lb
drag due to fluid displacement, lb
fluid depth, in.
vertical load on tire due to airplane or vehicle mass,
Ib
portion of FV supported by the runway (footprint region A in
fig. 3), lb
vertical hydrodynamic pressure force (footprint region B in
fig. 5), ib
acceleration due to gravity, 32 ft/sec 2
tire and wheel moment of inertia, slug-ft 2
vehicle mass, slugs
average ground hydrodynamic pressure, lb/sq in.
tire inflation pressure, lb/sq in.
FV, G + FV, S,

R
r
sI
VC
vG
Vp
VS
x e
8
P
I_av
laeff
P-max
skid
highway curve radius, ft
unloaded tire radius, ft
slip ratio
posted speed limit on highway curves_ international statute miles
per hour
ground speed, knots
tire hydroplaning velocity, knots (airplanes), international statute
miles per hour (highway vehicles)
vehicle sllde-out speed on highway curves, international statute miles
per hour
vertical load center-of-pressure displacementj ft
wheel angular acceleration, radians/sec 2
vertical tire deflection, ft
fluid mass density, slugs/cu ft
wheel angular velocity, radians/sec
instantaneous tire-to-surface friction coefficient
average friction coefficient between sllp ratios of O.10 and 0.90
effective friction coefficient (average _ developed by aircraft as
modified by pilot braking or antl-skid system)
maxlmumfriction coefficient
skidding friction coefficient (friction coefficient at sllp ratio
of I)
PHYSICAL DESCRIPTION OF TIRE HYDROPLANING
Consider the case of an unbraked pneumatic tire rolling on a fluid covered
runway as in an airplane take-off. As the moving tire contacts and displaces the
stationary runway fluid 3 the resulting change in momentum of the fluid creates
hydrodynamic pressures that react on the runway and tire surfaces. In line with
hydrodynamic theory, the resulting hydrodynamic pressure force, acting on the tire
as ground speed increases, tends to build up as the square of the ground speed,

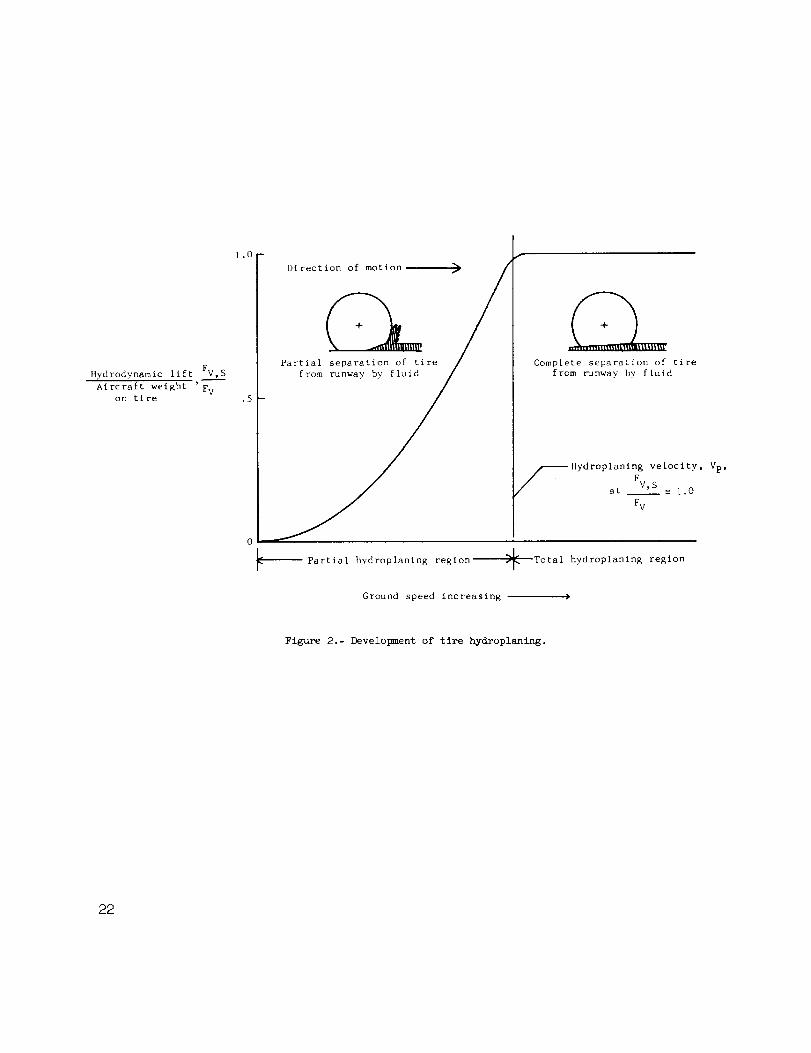
as shownin figure I, for the fluid drag componentof this pressure force. Thisresult allows construction of the model of tire behavior under partial and totalhydroplaning conditions shownin figure 2.
As ground speed increases, fluid inertia effects would tend to retard fluidescape in the tire-ground contact region and the fluid wedge formed would tend todetach the tire from the ground. At somehigh ground speed the hydrodynamic liftdeveloped under the tire equals the partial weight of the vehicle acting on thetire and any further increase in ground speed beyond this critical speedmustforce the tire to lift completely off the runway surface. The critical groundspeed at which FV,S = FV is termed the tire hydroplaning speed Vp. The tireis termed to be partially hydroplaning at ground speedsbelow Vp and totallyhydroplaning at ground speeds in excess of the tire hydroplaning speed Vp.
DERIVATIONOFTIRE HYDROPLANINGSPEED
The following derivation of tire hydroplaning speed is based on earlier der-ivations given in references l0 and 11. The net torques or moments acting on an
unbraked wheel must, at any time, equal the inertia torque Is acting on the
wheel. (See fig. 3.) Including hydrodynamic effects, the angular acceleration
can be expressed approximately as
= FvCxc) - [D R + DS + (F V - FV_S)_(r - 5) (1)
I
When the vertical component of the hydrodynamic pressure force FV, S equals the
vertical ground force FV, the tire-ground frictional moment (FV - FV,S)_(r - 5)
reduces to zero, and since at this point the tire is entirely supported by the
fluid on the runway, total tire hydroplaning must exist. To predict the ground
velocity VG at which this phenomenon will occur, it is assumed in line with
hydrodynamic theory that the lift component of the hydrodynamic pressure
force FV, S is proportional to the tire-ground contact area AG, fluid den-
sity p, and to the square of the ground speed VG. If other possible variables
such as the effects of tire tread design, fluid viscosity, and runway surface
texture are ignored, and the fluid depth on the runway is assumed to be greater
than tire tread groove depth, the following approximate expression for tire
hydroplaning speed Vp may be obtained:
1Fv = Fv,s = CL,s %VP2 (2)
Rearranging terms leads to the following equation which may be used to find
Vp in knots when AG is expressed in square inches:

Vp = 0.592(_ CL-_pj288-_I/2 (3)
Recent research in the Langley landing loads track involving bogie and nose-gear
studies (refs. 12 and 13) indicates that equation (3) may be simplified to
Vp = 9_, knots (4)
Vp = iO.35_, statute mph (5)
where the tire inflation pressure p is expressed in pounds per square inch.
This simplification is based on three main assumptions: (i) The term Fv/A G
(average tire-ground bearing pressure) in equation (3) may be approximated by the
tire inflation pressure p, (2) Runway fluids which can collect in depths large
enough to produce tire hydorplaning have densities approaching that of water_ and
(3) The hydrodynamic lift coefficient CL, S developed by tires on a fluid covered
surface is approximately 0.7. (See ref. ii.)
It should be pointed out thatthe hydroplaning speeds obtained from equa-
tions (3) and (4) are valid for smooth and closed pattern tread tires which do
not allow escape paths for water, and for rib tread tires on fluid covered run-
ways where the fluid depth exceeds the groove depths in the tread of these tires.
Little quantitative data are yet available on the hydroplaning speeds for rib
tread tires on fluid covered runways where the fluid depth is less than the groove
depth of the tread.
Correlation of hydroplaning speed, as determined by means of equation (4),
with available experimental data is shown in figure 4. Note that the calculated
hydroplaning speeds of equation (4) are in reasonable agreement with the experi-
mental hydroplaning speeds obtained for a variety of tire sizes having a vertical
load range from 925 to 22,000 pounds and an inflation pressure range from 24
to 150 pounds per square inch.
EXPERIMENTAL OBSERVATIONS OF TIRE HYDROPLANING
Since tire hydroplaning was first demonstrated experimentally during the
NACA tire treadmill tests of 1957, the following eight manifestations of hydro-
planing in terms of tire or vehicle performance have been observed and are
described in this section of the paper: detachment of tire footprint, hydro-
dynamic ground pressure, spin-down of wheel, suppression of tire bow wave,
scouring action of escaping fluid in tire-ground footprint region, peaking of
fluid displacement drag, loss in braking traction, and loss of tire directional

stability. Most of these manifestations are clearly shownin a documentary film.(See ref. 17.)
Detachmentof Tire Footprint
In the explanation of tire hydroplaning given earlier in this paper, it wasassumedthat as ground speed increased, a wedgeof fluid progressively penetratesthe tire-ground contact region and a hydrodynamic pressure is developed betweenthe tire and the ground, the resulting hydrodynamic lift tending to detach thetire footprint from the runway surface. This effect is actually illustrated inphotographs in figures 5 and 6 for aircraft and automobile tires, respectively.these photographs were obtained during a recent hydroplaning study madeat theNASALangley landing loads track. (See ref. 13.)
It is of interest to note that the portion of the footprint under the side_alls of the automobile tire (photograph (c) of fig. 6) is the last portion ofthe footprint to becomedetached as ground speed increases. This result indi-cates that higher tire-ground bearing pressures exist under the tire side wallsthan in other locations of the automobile tire footprint. The aircraft tirewhich was more circular in cross section and stiffer than the automobile tire didnot showthis sidewall effect (fig. 5) but a similar effect (fig. 7) appearspresent in the photograph of the small tire footprint obtained from reference 18.It is apparent from the photographs of figures 5 and 6 that as ground speedincreases, the '_early dry" contact patch developed between the rolling tire andthe ground is progressively reduced and then entirely eliminated whentotal hydro-planing is achieved.
HydrodynamicGround Pressure
Tire hydroplaning speed, in an earlier section of this paper, was defined asthe ground speed required for the hydrodynamic lift acting on the tire to equalthe weight of the vehicle being supported by the tire or FV,S = FV. Stated inanother way, the tire hydroplaning speed is the ground speed required for theaverage hydrodynamic pressure acting in the tire footprint region to equal theaverage tire-ground bearing pressure or, in approximation, to equal the tireinflation pressure p. It has not been possible up to this time to measurethehydrodynamic pressure acting on the wetted surface of the tire, but successfulmeasurementsof hydrodynamic pressure acting on the ground surface under the tirehave recently been madeat the Langley landing loads track. These measurementsof hydrodynamic ground pressure were accomplished with the aid of a recordingflush-dlaphragm-type pressure gage installed just below the surface of the runwayat the center llne of the tire path. Typical hydrodynamic pressure signaturesobtained during tire passage over the fluid covered pressure gage are showninfigure 8. Several interesting points are suggested by the data shownin thisfigure: (1) The ground hydrodynamic pressure develops ahead of the initial tire-ground contact point due to action of the tire bow wave, (2) The peak ground hydro-dynamic pressure is considerably in excess of the tire inflation pressure for the85-knot ground speed pressure signature, and (3) Apparently negligible hydro-dynamic ground pressures are developed at the rear of the tire-ground footprint

at the higher ground speeds. The first and third points mentioned combine toproduce a larger forward shift of center of pressure and consequently a largerwheel spin-down momentfor the 85-knot pressure signature than that shownfor the30-knot ground speed signature. The exact reason for the lack of hydrodynamicground pressure observed at the rear of the tire footprint is not yet knownbutprobably can be explained on the basis that tire inertia prevents the internalinflation pressure from restoring the tire to its undeflected radius in the rearof the footprint. The secondpoint made_that the ground hydrodynamic pressurecan exceed the tire inflation pressure_ must indicate local inward buckling ordeformation of the tire whenever this high hydrodynamic pressure condition occursin the tire-ground contact region. Someevidence of these deformations is shownby the photographs of the automobile tire footprint at a ground speed of 32 knotsin figure 6 and the model tire footprint of figure 7-
The hydrodynamic ground pressure signatures obtained on a tandemwheellanding gear at 30 and 85 knots ground speed on a runway covered with water0.5 inch deep are shownin figure 9- It is of interest to note that tire spin-down (a manifestation of tire hydroplaning) did not occur on the front wheel ofthis landing gear until the average hydrodynamic ground pressure (51 poundspersquare inch) slightly exceededthe tire inflation pressure (50 pounds per squareinch). (See lower left pressure signature in this figure.)
Also to be noticed in this figure are the lower average hydrodynamic groundpressures that developed on the rear wheel as comparedwith the pressures devel-oped on the front wheel of this tandem wheel landing gear. These lower pressuresare believed to be the result of the path clearing action of the front tandemwheel which reduces the depth of fluid on the runway encountered by the reartandemwheel.
Spin-Downof Unbraked Wheel
Perhaps the most striking manifestation of tire hydroplaning is the nowwellsubstantiated condition in which free rolling (unbraked) wheels slow downor stopcompletely on wet runways as shownin figure i0. Unbraked-wheel spin-down arisesfrom two hydrodynamic lift effects which combine to produce a total wheel spin-downmomentin excess of the wheel spln-up momentdue to all tire drag sources.First, as ground speed increases, the hydrodynamic lift progressively detachesthe tire footprint from the pavement surface (figs. 5 and 6) and makesthe tire-ground frictional spin-up moment(FV - FV,S)_(r - 6) in equation (i) tend towardzero values. Secondlyj the center of pressure of the hydrodynamic pressure andresulting lift developed between the tire footprint and ground surface shiftsincreasingly forward of the axle as the ground speed increases (see fig. 8) andproduces the wheel spin-down moment FvXc• At somehigh forward speednear thetotal hydroplaning speed of the tire, this wheel spin-down momentovercomesthewheel spin-up momentfrom all the drag sources and wheel spin-down commences.
Available wheel spin-down data such as are shownin figures ii and 12 indi-cate that wheel spin-down can commenceon tires at ground speeds considerablylower than the total hydroplaning speed Vp. For example, the data in
7

figure 12(b) indicate that on tandem wheels the front-wheel spin-down begins at
70 percent of the hydroplaning speed Vp. This figure shows that large reductionsin tire-ground frictional moment can occur under partial hydroplaning conditions.
The fact that the rear wheels of the tandem landing gear did not spin down
in figures ll and 12 is further corroboration of the data shown in figure 9 and
indicates that the path clearing action of front-mounted wheels on single and
dual-tandem wheel landing gears tends to remove sufficient fluid from the paths
of rear-mounted wheels of such landing gears to prevent hydroplaning or wheel
spin-down to occur on the rear wheels.
Suppression of Tire Bow Wave
Photographs and motion pictures (see refs. i0, 13, and i_) taken of aircraft
tires under partial and total hydroplaning conditions indicate that a large bow
wave forms in front of the tire for all ground speeds below the hydroplaning
speed Vp (partial hydroplaning region of fig. 2). As the ground speed increases,
the angle of the bow wave with respect to the runway tends to reduce progressively
until at some high ground speed in the total hydroplaning region of figure 2, the
bow wave disappears completely. This effect is shown in figures 13, 14, and 15.
The similarity between tire bow spray patterns and bow spray patterns devel-
oped on hydroplane-type boat hulls at partial and total hydroplaning speeds is
striking. It is also important to note that this is one manifestation of hydro-
planing that can be witnessed in the field. If during high-speed operations in
deep water or on slush covered runways such as in landing or take-off, no bow
waves are observed to be forming ahead of the aircraft tires, there is a good
probability that the aircraft and tires are undergoing total hydroplaning.
Scouring Action of Escaping Fluid in Tire-Ground Footprint Region
When wheels are locked during hlgh-speed braking on dry pavement surfaces,
large amounts of molten tread rubber are deposited by the tires on the pavement.
This is not true under total hydroplaning conditions when the tire is completely
detached from the pavement surface by the runway fluid. Instead of this effect,
the escaping fluid under the action of high hydrodynamic pressures developed in
the tlre-ground contact region tends to clean the runway surface in the tire path
with the result that white streaks instead of black streaks are formed by the
tires on the pavement surface. This result was noted in the braking study of
reference ll and has also been observed during full-scale aircraft landings on
flooded runways. It should be pointed out that this scouring action may also
develop when smooth tires are braked on wet smooth pavement surfaces at ground
speeds below the tire hydroplaning speed because of viscous effects which also
produce high hydrodynamic pressures in the tire-ground contact region.
8

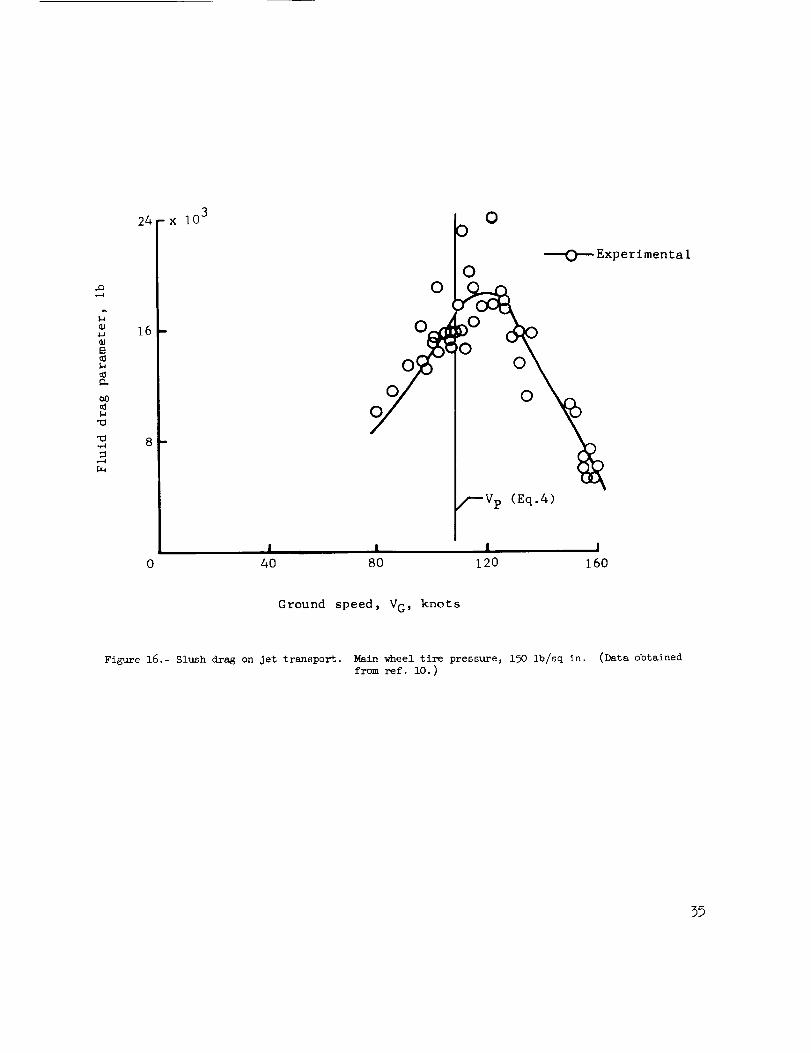
Peaking of Fluid Displacement Drag
It was shown experimentally in references i0 and 15 that fluid displacement
drag reaches a maximum at a ground speed near the tire hydroplaning speed
(fig. 16). Recent data obtained at the Langley landing loads track (fig. 17(a))
illustrate this effect more clearly. Shown in this figure is the effect of tire
inflation pressure on both fluid drag magnitude and peak location with ground
speed. It can be seen from these data that increasing the ground speed above
the critical hydroplaning speed results in appreciable reductions in fluid drag.
This result is attributed to the tires lifting off the runway surface at the
higher ground speeds and consequently displacing less runway fluid from the tire
paths. The drag at speeds above Vp may be slightly in error because of the
normalizing processes used.
Loss in Braking Traction
When rib tread tires are braked on most wet but not flooded pavement sur-
faces, the wet-runway friction coefficients obtained are usually considerably
reduced in magnitude from the dry-runway values experienced but an appreciable
amount of braking traction is still retained for this wet condition even at the
highest vehicle ground speeds as shown in figure 18. On the other hand, when
deep puddles form on the wet pavement surface, an intermittent additional loss in
braking traction occurs because of hydroplaning of the tires in the puddles when-
ever the vehicle ground speed exceeds the tire hydroplaning speed as shown in
figure 19. Whenever the pavement surface is flooded with fluids such as slush or
water to depths large enough to initiate tire hydroplaning, the braking traction
loss becomes catastrophic (braking friction coefficients approach free rolling
friction coefficient) at ground speeds near or in excess of the tire hydroplaning
speed. (See fig. 20.) This result is obvious when the unbraked-tire spin-down
data under hydroplaning conditions previously discussed are considered. (See
figs. i0, ii, and 12.) It is apparent from these data that applying brakes to
wheels that have either completely or nearly stopped rotating from hydroplaning
effects cannot be expected to improve the existing tire retardation forces and
friction coefficient at all.
Loss of Directional Stability
Another significant manifestation of tire hydroplaning is a loss of direc-
tional stability, as demonstrated during the slush study conducted by the Federal
Aviation Agency with technical assistance of the National Aeronautics and Space
Administration on a four-englne jet transport. (See refs. lO, 15, and 17.)
Several test runs through the slush bed were made at speeds in excess of the pre-
dicted hydroplaning speed for the airplane (ll0 knots) in the presence of direct
cross-wlnd components that did not exceed 9 knots. The test aircraft at a ground
speed of 120 knots was observed to yaw and drift laterally on the runway while in
the slush bed. (These instances are shown in the motion pictures of ref. 17.)
These results appear to indicate that loss of tire directional stability at and
above tire hydroplaning speeds could be extremely serious to some aircraft when
take-offs and landings are conducted in the presence of high cross winds.
9

PARAMETERS OF SIGNIFICANCE TO HYDROPLANING
Fluid Parameters
Depth of fluid.- Results thus far indicate that tires will not hydroplane
below certain minimum fluid depths on the pavement surface. Because of the large
effects of other parameters such as tire tread design and runway surface texture,
this minimum fluid depth is difficult to define. For the comparatively smooth
belt surface and smooth tread tires used in references 1 and 9, hydroplaning
occurred at fluid depths as low as 0.02 to 0.09 inch. In reference ll, where
full-scale aircraft tires were used on a relatively smooth concrete test track,
hydroplaning occurred on a smooth tread tire when the concrete runway was flooded
with water to the extent that the fluid depth varied between 0.1 to 0.4 inch
(average depth approximately 0.3 inch). Gray (refs. 18 and 22) used "plasticene"
strips on the runway to measure minimum water thickness between tire and ground
for a Meteor fighter under hydroplaning conditions. The results of this unique
experlment3 shown in figure 21j indicate that the minimum water depth required
for hydroplaning to occur on this aircraft for a smooth runway was 0.17 inch and
over double this value, 0.42 inch, for a grooved runway. The braking coefficients
obtained for a rib tread automobile tire in reference 5 (see fig. 22) indicate
that water depths of 0.2 to 0.3 inch are required for this tire to hydroplane on
the concrete runway used for testing. (Friction coefficients approach zero at
hydroplaning speed Vp. ) The upper limit of fluid depth for hydroplaning has not
been defined. Tire hydroplaning has occurred in tests at the Langley landing
loads track and in the tests of reference 15 in or slightly greater than 2 inches
of fluid.
Density of fluid.- Data at this time are insufficient to evaluate fluid den-
sity effects, but according to the reasoning of equation (3), the hydroplaning
speed should be an inverse function of the fluid density. For example, runway
slush having a specific gravity of 0.85 should require an 8 percent higher hydro-
planing speed than water.
Tire Parameters
Inflation pressure.- The tire inflation pressure appears to be the most
important single parameter in determining aircraft or tire hydroplaning speed.
(See eq. (4) and figs. (4) and (17).) Increasing the tire pressure increases the
tire hydroplaning speed and vlce-versa.
Tire-tread design.- Tire tread design is believed to have two effects on
hydroplaning speed. First, adequate tread designs, such as circumferential ribs,
according to references l, _, and ll, tend to require higher ground speeds for
hydroplaning than do smooth tread tires. Second 3 good tread design tends to
increase the minimum fluid depth required for a tire to hydroplane. The loss in
braking traction due to partial hydroplaning effects (partial hydroplaning region
of fig. 2) is considerably less for rib-tread tires than for smooth-tread tires
even when the fluid depth on the pavement surface is greater than the tread groove
10

depth. This effect is shownfor an aircraft tire in figure 23 and for an auto-mobile tire in figure 24.
Airplane Parameters
Landing-gear wheel arrangement.- In tandem-wheel landing-gear arrangements
(see refs. 7_ 9, i0_ Ii, 14, and 15 and figs. ii and 12), the path clearing action
of the front wheels tends to reduce the fluid depth encountered by rear tandem
wheels to values that apparently lie below the minimum fluid depth required to
support total tire hydroplaning. Consequently, the available experimental data
indicate that total hydroplaning on the rear wheels of such gear arrangements is
delayed to higher ground speeds or possibly eliminated.
Vertical load.- Increasing the weight on the aircraft or the vertical load
on the tire has only a small effect on tire hydroplaning speed. This effect is
small because the tire acts as an elastic body and changes in vertical load on
the tire produce corresponding changes in the tire-ground footprint area such
that the ratio of vertical load to footprint area Fv/A G remains constant at a
value approximating the tire inflation pressure p. Admittedly, the tire internal
volume becomes smaller (raises inflation pressure) as the vertical load is
increased on the tire, but for normal riding or landing conditions this rise in
inflation pressure is very small. For example_ increasing the vertical load on
an aircraft tire from zero vertical load to maximum static load (32-percent maxi-
mum vertical tire deflection) only increases the tire inflation pressure by 3 or
4 percent and this increase will change the hydroplaning speed from equations (4)
and (5) by 2 percent or less.
Pavement Surface Parameters
Pavement crown.- Although pavement crown has no direct effect on the hydro-
planing phenomenon, it does inhibit hydroplaning by allowing water to drain off
rapidly and prevent accumulations of water deep enough for hydroplaning to take
place except under the most adverse conditions (heavy downpours). It is not
expected that crowning the pavement would help much for a slush cover which does
not drain off as readily as water.
Surface texture.- It is believed but not well substantiated at this time
that a rough or open-textured pavement surface will require a greater fluid depth
than a smooth surface for hydroplaning to take place. For example_ "the hills
and valleys" of an open-textured pavement surface provide paths in the tire-
ground contact region for trapped water to escape and thus delay the buildup of
the hydrodynamic pressure in the tire-ground region required to produce
hydroplaning.
Pavement grooves.- It has been shown in references 18, 22, and 23 (see
fig. 21) that transverse (to vehicle motion) pavement grooves can substantially
increase the minimum water depth required for tire hydroplaning to occur. Through
suitable pavement groove designs it may be possible to prevent hydroplaning from
occurring except under the highest precipitation rates where vehicle operation
ii

would be unlikely because of other factors such as reduced visibility and highwinds. It is recognized, of course, that grooving pavement in "northern regions"might not be feasible because of an intolerable amount of pavement surface deteri-oration created by the surface water alternately freezing and thawing in the pave-ment grooves.
Pavement unevenness.- Pavement unevenness results in the formation of random
puddles on the pavement surface during times of precipitation. The probability
for puddle widths to be always greater than the vehicle wheel span is very small
indeed. Thus, the probability for skid-producing yawing moments to occur on
vehicles because of differential braking or cornering traction developed when
some of the vehicle tires hydroplane and others do not is large. For this reason,
pavements should be resurfaced when pavement unevenness due to unequal pavement
settlement effects is seen to create a large number of puddles on the pavement
during times of normal precipitation.
Additional Parameters
Surface winds.- The beneficial effect of pavement crown on water drainage
can be completely canceled if the surface wind blows up the slope of the runway
crown with sufficient speed. Thus, it can be expected that the critical pavement
water depths required to support tire hydroplaning will be attained at lower pre-
cipitation rates under these high surface wind conditions than for the precipita-
tion rates required under light wind conditions. It should be mentioned that
under hydroplaning conditions, the resistive lateral or cornering force capability
of pneumatic tires is very small and can be exceeded by the side forces produced
on vehicles by cross winds of as little as 9 knots. (See refs. 13 and 17.) The
loss in vehicle directional stability due to this effect can cause the vehicle
to yaw and drift laterally off the pavement or runway surface with potentially
grave consequences.
H_steresls.- It was reported in reference ll that the ground speed required
for tires to spin up after encountering spln-down during hydroplaning was as much
as 13 knots below the ground speed required to initiate the wheel spin-down.
This result indicates a hysteresis effect which was noticed in the investigation
of reference 1 but not reported. Because of this effect, the ground speed
required for a tire to spin down and stop under accelerating ground speed condi-
tions tends to be greater than the ground speed required to spin up the tire
(after hydroplaning) under decelerating ground speed conditions. This result
suggests that hydroplaning may be potentially more hazardous to aircraft during
landing and rejected take-offs than during take-offs because of the greater total
hydroplaning ground velocity range.
SUSCEPTIBILITY OFVEHICLESTOHYDROPLANING
Aircraft
For the purpose of determining how serious an operating problem might be
created by tire hydroplaning# a survey was made in reference 13 of _0 different
12

civil and military aircraft currently being operated in the United States and theresults are shownin figure 25. For this survey, a hydroplaning speed was calcu-lated for each of these airplanes by meansof equation (4) and this speedwascomparedwith maximumtake-off and landing speeds. The data shownin this figureindicate that essentially all aircraft considered are susceptible to total hydro-planing at somepoint in their take-off and landing velocity envelopes and thatthe nose wheels of the aircraft in the survey were somewhatmore susceptible tohydroplaning than the main wheels.
Ground Vehicles
Most automobiles in use in the United States at this time require tire infla-tion pressures ranging from about 16 to 30 pounds per square inch. Onthe otherhand, large trucks and buses in current use generally require tire inflation pres-sures considerably higher in magnitude, that is, from 50 to 90 pounds per squareinch. These two inflation pressure bands for automobiles and buses are indicatedin figure 26 along with the predicted tire hydroplaning speed of equation (5) inmiles per hour. It can be seen from this figure that automobiles can encountertotal hydroplaning at ground speeds considerably below the higher legal speedlimits, say 60 to 70 miles per hour. Contrary to this, the higher inflation pres-sures used on trucks and buses yield hydroplaning speeds that are above legalspeed limits and thus trucks and buses are not as susceptible to hydroplaning asare automobiles for normal operating speeds on highways.
HAZARDSOFTIRE HYDROPLANINGTOVEHICLEOPERATION
Loss of Braking Traction
It is obvious whenunbraked pneumatic tires stop completely under totalhydroplaning conditions that the loss in braking traction derived from wheelbrakes must be lO0 percent for there is nothing to be gained by applying brakesto an already locked or nonrotating tire. Under total hydroplaning conditions,the main retardation forces developed by tires arise from: (1) drag forcescreated by the tire displacing fluid from its path, (2) small drag forces due tofluid viscosity effects. The available data indicate that the total of theseretardation forces in terms of friction coefficient do not usually exceed 0.05for hydroplaning tires at the minimumfluid depths required to support hydro-planing (O.1 to 0.3 in.). For greater fluid depths_ such as shownfor the jettransport aircraft braking test in slush, in figure 27, the effective frictioncoefficient from the fluid displacement drag term becomeslarge, especially atthe higher ground speeds#and can partially restore the braking traction fromwheel brakes that is lost under partial and total hydroplaning conditions.
The hazard to vehicle operation that results from loss in braking tractionis increased vehicle stopping distance as shownin figures 28 and 29 for a four-engine jet transport and an automobile, respectively. It can be seen from fig-ure 28 that the wet but not puddled runway condition (no hydroplaning) resultedin increasing the dry runway aircraft stopping distance by a factor of 1.6. For
13

the runway covered with i/2-inch slush condition (hydroplaning occurred), the
stopping distance was 2.6 times the dry runway stopping distance. The calculated
stopping distance required for an automobile on dry and flooded (hydroplaning
occurs) pavements shows a trend similar to that found for the aircraft, the dry-
pavement automobile stopping distance being increased by a factor of approximately
2.0 to 2.6 when the automobile is braked on the flooded pavement surface. (See
fig. 29(b).) These automobile-stopping-distance calculations were based on the
following assumptions: vehicle weight, 3,700 pounds; aerodynamic drag coeffi-
cient, 1.0; frontal area of automobile, 2_ square feet; and the automobile devel-
ops maxlmumbraking coefficients shown in figure 29(a) (based on data obtained
from ref. 4).
A rough estimate (based on the data shown in figs. 28 and 29) of the stopping
distance required on flooded runways where hydroplaning is probable is indicated
to be for both airplanes and ground vehicles as much as 3 times the dry-runway
stopping distance. For example, pilots of aircraft having no thrust reversers or
drag chutes should make sure at least 3 times the dry-runway stopping distance
is available before a landing is attempted on flooded runways. The automobile
driver should allow at least 3 times the normal spacing between his car and the
vehicle ahead to allow for this reduced braking traction for there may be a truck
or bus ahead that is not hydroplaning and therefore not experiencing low braking
traction.
Loss of Directional Stability
Aircraft and automobile designers both depend upon the ability of a pneumatic
tire to develop cornering or side forces as a means of steering or controlling
their vehicles along pavement surfaces. When tires hydroplane and lift off the
pavement surface, this ability to steer is practically lost since fluids cannot
develop large shear forces and the tire-ground forces consequently drop to negli-
gible values. For aircraft, this loss means ineffective nose wheel steering and
differential wheel braking; for ground vehicles, the steering wheel tends to
become a useless appendage.
The main hazard to vehicle operation that results from loss in tire direc-
tlonal stability is the inability of tires to develop resistive ground forces to
overcome external forces produced on vehicles by cross winds and by centrifugal
effects due to changes in vehicle direction such as occur for aircraft during
high-speed turns onto taxiways and for automobiles on road curves.
The full-scale Jet transport slush investigation (see refs. i0 and 15)
demonstrated this loss very convincingly when it was found that cross winds as
little as 9 knots in magnitude could yaw and displace the test aircraft laterally
on the slush covered runway when the aircraft tires were hydroplaning. The abil-
ity of ground vehicles to negotiate road curves for different pavement conditions
and speeds is shown in figure 30. In the United States, the posted maximum safe
speed for negotiating road curves is based on an assumed low pavement friction
coefficient level of _ = 0.12 to 0.16. For dry pavements and for all wet pave-
ment conditions giving friction coefficients greater than 0.12 to 0.16, the
vehicle sllde-out velocity V S is greater than this posted speed limit VC and
14

the vehicle can negotiate the curve safely. It can be seen from figure 30 that
a ground vehicle (tire pressure of 25 pounds per square inch) entering a curve at
ground speeds in excess of the corresponding tire hydroplaning speed (52 miles
per hour) could not negotiate road curves at posted speed limits under pavement
conditions conducive to hydroplaning since the friction coefficient for hydro-
planing tires (_ does not exceed 0.05) produces vehicle slide-out speeds less
than the posted speed limit speeds.
Low Friction Coefficients Not Associated With Tire Hydroplaning
The large mass of data just described suggests that tire hydroplaning can be
reasonably explained in terms of fluid density effects alone and equation (4),
derived on this basis 3 is seen to give good estimates of tire hydroplaning speed
values. (See fig. 4.) Some data exist, however, that show a complete loss of
tire braking traction (one manifestation of hydroplaning) occurring at ground
speeds considerably less than the tire hydroplaning speed.
Such a loss at these lower speeds cannot be ascribed to hydroplaning from
fluid density effects since the fluid dynamic pressures developed at these lower
speeds is insufficient to lift the tire off the pavement surface. Since this
type of braking traction loss occurs only when smooth tires are used on smooth
wet pavement surfaces or when rib tread tires are used on very smooth wet pave-
ment surfaces, it probably arises from thin-film lubrication effects on the tire-
ground surfaces in which fluid viscous properties, previously ignored, tend to
predominate. Two examples of thin-film lubrication are given.
The first example is shown in figure 31 which indicates the loss in braking
traction experienced by a smooth tread aircraft tire when braked on a relatively
smooth wet concrete runway at tire pressures of 120 and 260 pounds per square
inch. It can be seen in part (a) of this figure that at ground speeds of 95 to
lO0 knots, both the p = 260 pounds per square inch curve and the p = 120 pounds
per square inch curve drop to the residual free-roll friction coefficient. This
result indicates complete loss of braking traction at this speed and is one of
the manifestations of total tire hydroplaning. When these data are plotted
against the velocity ratio VG/V P as in part (b) of this figure, it can be seen
that the curve for p = 260 pounds per square inch reaches the free-rolling
friction coefficient level (zero braking traction) at a ground speed 35 percent
less than the total hydroplaning speed required by equation (4).
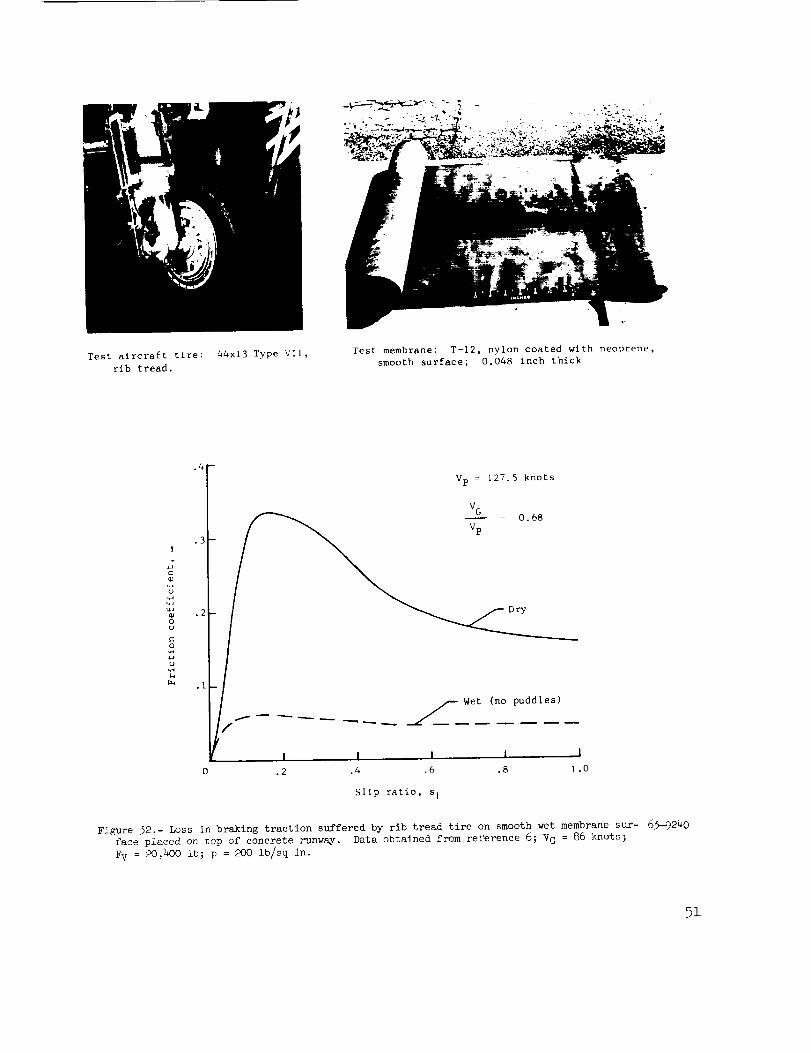
A similar result is shown in figure 32 for a rib tread aircraft tire when
braked on a very smooth wet membrane that was placed on top of the track runway.
It is of interest to note that the water depth for this test was insufficient to
form puddles on the membrane. The ground speed for this particular test was
86 knots which gives a value of velocity ratio VG/V P of 0.68 and an estimated
hydroplaning speed of 127.5 knots. Since the average friction coefficient devel-
oped for this speed is about 0.05 (approximately equal to tire free-rolllng
resistance), the loss in braking traction must be nearly complete at a ground
velocity at least 32 percent less than the hydroplaning speed predicted by
equation (4).
15

It is apparent from these data that the extreme pavement slipperiness demon-
strated for thin-film lubrication conditions is the direct result of the inability
of tires to penetrate a very thin but tenacious fluid film that coats smooth pave-
ment surfaces when wet.
As might be expected from the preceding discussion, the loss in tire-braking
traction due to thin-film lubrication can be greatly reduced by the addition of a
thin nonskid coating to the existing smooth pavement surface. This effect is
shown in figure 33 which presents frlction-coefflclent data obtained on a wet,
but not puddled with water, enameled steel aircraft landing mat before and after
being coated with a nonskid compound that the U.S. Navy uses on flight decks of
its current aircraft carriers. The fine sand-like grit particles embedded in
this compound provide thousands of sharp asperities in the surface which break
through the pavement fluid film and sharply reduce the braking traction loss due
to thin-film lubrication effects.
Fortunately 3 most runway and road pavements in use today are provided with
textured surfaces so that thin-film lubrication is probably seldom encountered
when vehicles are equipped with tires having adequate tread pattern designs.
CONCLUDING REMARKS
This report has given a physical description of pneumatic tire hydroplaning,
has demonstrated many manifestations of the phenomena of tire hydroplaning, and
has discussed the fluid, tire, and airplane parameters of importance. In con-
cluding the report various suggestions or recommendations for avoiding and mini-
mizing its hazards are made.
Avoidance of Hydroplaning Effects
As mentioned, there are two separate effects for which there is separation or
loss in adhesion between tire and wet pavement surfaces with resulting large
increases in pavement slipperlness, namely, hydroplaning (where inertia and den-
sity properties of the fluid predominate) and thin-film lubrication (where viscous
properties of the fluid predominate).
Hydroplaning requires a critical minimum fluid depth to be present on pave-
ment surfaces. This critical depth can range from approximately 0.1 to 0.4 inch
depending upon the character of tire-pavement surfaces. Smooth tread tires
operating on the smoother pavement surfaces require the least fluid depth, whereas
rib tread tires operating on open-textured and transverse-grooved pavement sur-
faces require the greatest fluid depths. When this critical fluid depth is
exceeded for any tlre-pavement surface combination, the critical ground speed
(hydroplaning speed) required for total hydroplaning to occur was found to be
almost entirely dependent upon tire inflation pressure. This result led to the
derivation of a simple relation for estimating tire hydroplaning speed which
shows good correlation with available experimental values of hydroplaning speed.
16

Two methods appear to be appropriate for avoiding this phenomenon. The first
method consists of increasing tire inflation pressure such that the vehicle's
hydroplaning speed is greater than the highest vehicle ground speed. This method
has large limitations because of probable vehicle and pavement structural design
changes such a procedure will incur. The second method, which is considered the
best practical solution, is to raise the critical minimum fluid depth for hydro-
planing to occur to a value that will not be reached during rainfall precipitation
rates under which vehicles operate. This can be done through use of a proper
pavement crown and textured surface, adequate tire tread design, and possibly by
pavement grooving. It is realized that such a method will not work as well for
slush covered pavement surfaces since slush does not drain as readily as water,
and aircraft operations should be limited for this condition if necessary.
Thin-film lubrication is not important at normal vehicle operating speeds
when rib tread tires are used on wet rough-textured pavement surfaces. It becomes
important and increases slipperiness when smooth tread tires are used on smooth
pavement surfaces or when rib tread tires are used on very smooth pavement sur-
faces. Thin-film lubrication does not require the presence of large fluid depths
on pavements. (The film thickness required is estimated to be less than
O.01 in.) The limited data available suggest that complete separation of tire
and pavement surface from this fluid property can occur at ground speeds at least
35 percent less than the speeds required for hydroplaning to occur from fluid den-
sity effects. Fortunately, thin-film-lubrication effects are easily avoided or
minimized by roughening or texturizlng the pavement surfaces and by not using
smooth tread or excessively worn patterned tread tires on air and ground vehicles.
Minimizing Hazards of Hydroplaning by Operational Means
The hazards of tire hydroplaning to vehicle operation are greatly increased
stopping distances, and potential loss of ground directional stability. In order
to minimize these hazards, it is most important for the vehicle operator to be
aware of the existence of tire hydroplaning and to understand how and when it may
occur. Such knowledge being assumed, certain procedures then suggest themselves
to minimize hazards of tire hydroplaning where conditions are such that it may be
encountered.
In the operation of aircraft when landings must be made on very wet runways,
operational techniques such as minimum "safe" touchdown speed, early runway con-
tact, and early use of spoilers, wheel brakes and reverse thrust should be
employed to decrease the aircraft landing roll. Application of reverse thrustand wheel brakes should be made with caution, however, since asymmetrical thrust
or drag on the aircraft for these slippery runway conditions will be difficult to
control. Curtailment of operations in the presence of cross winds during take-
off and landing on flooded runways which may greatly increase the possibility of
aircraft skidding under these slippery runway conditions should be considered.
The ground vehicle operator should reduce his speed appropriately below the
vehicle's hydroplaning speed on a flooded road, especially when rounding a curve
17

or driving in traffic. The use of excessively worn patterned tread tires or
smooth tread tires on air or ground vehicles on wet pavements should be avoided.
Langley Research Center,
National Aeronautics and Space Administration,
Langley Station, Hampton, Va., October 22, 1963.
18

REFERENCES
I. Harrin, Eziaslav N.: Low Tire Friction and Cornering Forces on a Wet
Surface. NACA TN 4406, 1958.
2. Hall, Albert W., Sawyer, Richard H., and McKay, James M.: Study of Ground-Reaction Forces Measured During Landing Impacts of a Large Airplane.
NACATN 4247, 1958. (Supersedes NACA RML55EI2c.)
3- Sawyer, Richard H., Batterson, Sidney A., and Harrin, Eziaslav N.: Tire-to-
Surface Friction Especially Under Wet Conditions. NASA MEMO 2-23-59L, 1959.
4. Sawyer, Richard H., and Kolnick, Joseph J.: Tire-to-Surface Friction-
Coefficient Measurements With a C-123B Airplane on Various Runway Sur-
faces. NASA TR R-20, 1959.
5. Trant, James P., Jr.: NACA Research on Friction Measurements. Proc. First
Int. Skid Prevention Conf., Pt. I, Virginia Council of Highway Invest. and
Res. (Charlottesville), Aug. 1959, PP. 297-308.
6. Batterson, Sidney A.: Braking and Landing Tests on Some New Types of Air-
plane Landing Mats and Membranes. NASA TN D-154, 1959-
7. Home, Walter B., Joyner, Upshur T., and Leland, Trafford J. W.: Studies of
the Retardation Force Developed on an Aircraft Tire Rolling in Slush or
Water. NASA TN D-552, 1960.
8. Horne, Walter B., and Joyner, Upshur T.: Some Effects of Runway Slush and
Water on the Operation of Airplanes, With Particular Reference to Jet
Transports. SAE Trans., vol. 70, 1962, pp. 99-108.
9- Harrin, Eziaslav N.: Investigation of Tandem-Wheel and Air-Jet Arrangements
for Improving Braking Friction on Wet Surfaces. NASA TN D-405, 1960.
i0. Anon.: Joint Technical Conference on Slush Drag and Braking Problems.
FAA and NASA, Dec. 1961.
ii. Horne, Walter B., and Leland, Trafford J. W.: Influence of Tire Tread
Pattern and Runway Surface Condition on Braking Friction and Rolling
Resistance of a Modern Aircraft Tire. NASA TN D-1376, 1962.
12. Horne, Walter B.: Slush and Water Drag Effects on a Bogie Landing Gear.
15th Annual Inter. Flight Safety Foundation Seminar "Notes," Otto E.
Kirchner, Sr., reporter, Airp±ane Div., The Boeing Co., 1962, pp. 99-101.
13. Horne, Walter B._ and Leland. TraffordJ. W.: Runway Slipperiness and Slush.
,our. R.A.S.3 vol. 67, no. 6333 Sept. 1963, pp. 559-57±.
19

14. Shrager, Jack J.: Vehicular Measurements of Effective Runway Friction.Final Report, Project No. 308-3X (Amendment No. 1), FAA, May 1962.
15. Sommers, Daniel E., Marcy, John F., Klueg, Eugene P., and Conley, Don W.:
Runway Slush Effects on the Takeoff of a Jet Transport. Final Report 3
Project No. 308-3 X, FAA, May 1962.
16. Joyner, Upshur T., Home, Walter B., and Leland, Trafford J. W.: Investiga-tions on the Ground Performance of Aircraft Relating to Wet Runway Braking
and Slush Drag. Presented to AGARD Flight Mechanics Panel (Paris, France),
Jan. 14-18, 1963.
17. Anon.: Hazards of Tire Hydroplaning to Aircraft Operation. NASA Langley
Research Center Film Serial No. L-775, 1963.
18. Gray, W. E.: Measurements of '_quaplaning Height" on a Meteor Aircraft,and Photos of Flow Pattern Under a Model Tyre. Tech Note No. Aero. 28553
British R.A.E., Nov. 1962.
19. Maltby, R. L., and Chinn, H. W.: Investigation of Slush Effects on Take-Off -
Progress and Plans. TOLS/4, British R.A.E., Dec. 1962.
20. Gadd 3 G. E.: A Note on the Undercarriage Aquaplaning of Aircraft Landing
on Water-Covered Runways. British A.R.C.22,793, Apr. 26, 1961.
21. Anon.: Flight Tests To Determine the Coefficient of Friction Between an
Aircraft Tyre and Various Wet Runway Surfaces - Part 6: Trials on an
Old Asphalt Runway at A. & A.E.E. 3 Boscombe Down. S & T MEMO 20/61,
Ministry of Aviation (British), Mar. 1962.
22. Gray, W. E.: Aquaplaning on Runways. Jour. R.A.S. (Tech. Notes), vol. 67,
no. 629, May 1963, pp. 302-304.
23. Willis, J. M. N.: Effects of Water and Ice on Landing. Shell Aviation News,
no. 296, 1963, pp. 16-20.
24. Anon.: Flight Tests To Determine the Coefficient of Friction Between an
Aircraft Tyre and Various Wet Runway Surfaces - Part 5: Trials on an
Asphalt Surface at Upper Heyford. S & T MEMO 2/62, Ministry of Aviation
(British), Apr. 1962.
2O

2O
16
x 10 2
0 ExperimentalCalculated (ref. 7) 0
0
0 0
0
.D
.-4
qJ
qD
12
8
0
Ooo Oo
0
4
0
! I I I I
2 0 4 0 6 0 8 0 100 120
Ground speed, VG, knots
Figure i.- Variation of fluid (slush) drag with ground speed on single wheel.
Tire pressure# 3_0 lb/sq in.
21
Hydrodynamic lift FV,___SS
Aircraft weight ' FVon tire
1.0
.5
Direction of motion
Partial separation of tire
from runway by fluid
XiComplete separation of tire
from runway by fluid
F Hydroplaning velocity,FV,S
at - l.O
F V
Vp,
Partial hydroplaning region_L_. Total hydroplaning region
Ground speed increasing
Figure 2.- Development of tire hydroplaning.
22

D S <___
DR _---- _----DB
6 urasurface
FV
Figure 3.- Unbraked rolling tire undergoing spin-down on fluid covered runway.
23

o
>
o
200
160
120
80
4O
Calculated Vp _ /(Eq.(4))
A/ Load
per
tire,
Tire [b
__ O 32 × 8.8 (VII) 9,400
44 x 13.0 (VII) 22,000
17.00 - 20 (III) I0,000(49" X 17")
A 39 x 13 (VII) 17,3OOO-- ]2.50 - 16
5,6OO(38" × 12.5")
925_x 6.70-15
I I I I l l I I I
20 30 40 60 80 i00 200 300 400
Tire pressure, p, Ib/ in 2
Vehicle
Aircraft
Aircraft
C - 123
Aircraft
880 Jet
Transport
Fou r-wheel
bogie
Automobile
Figure 4.- Experimental and calculated tire-hydroplaning velocities. (Data obtained
from ref. 13.)
e4

Direction of motion
(a) V G = 28 knots. (b) V G = 56 knots.
(c) V G = 71 knots. (d) V G = 88 knots.
Figure 5-- Photographs of 20 x 4.4 aircraft tire on glass runway at Langley landing loads
track under partial and total hydroplaning conditions. Vertical load, 500 ib; tire
pressure, 30 ib/sq in.; water depth, 0.5 inch.
6_9235
25

(a) Static footprint; VG = O.
(b)v_q= o.997.
VG = 2k knots; Vp
• °
VG = 1.020-
(e) VG = _3 knots; V_
Figure 6.- Photographs of _.60-i) automobile tire on glass runwa_ under partial and total hydrO- 6_-92_6
planing conditions. Vertical lo_d, 900 lb; tire pressure_ 20 lb/sq in.; water depth3 0.5 inch.
26

i!ii_
VG - 50 fps VG = 0
Figure 7-- Photographs of model tire (4.9" × 1.9") footprints obtained during perspex drum tests of 6_>-92_7
reference 18. Water depth, 1/16 inch; wheel slip, 79 percent.
eT

%_m
O.
U
E
c
0
D0
120
80
40
120
80
40
V G _- 30 knots
V G-- = 0.48
Vp
L Trailing edge_
VG = 85 knots
VG
V--_ = 1.33
I I
0 .2 .4
Directioh of motion >
Center llne of Iwheel axle _ [ Center of
_/- pressure
l
I Leading edge A
Distance, ft
Figure 8.- Tire ground pressure signatures on water covered runway. Vertical load per tire, approx-
imately 5,600 ib; tire pressure, DO lb/sq in.; water depth, 0.9 inch.
28

u__0
0.
_DC
0C
0
,n
Front of
footprint
lOOiFrontwheel
Rear wheel
I00
I,_Ruu.
0
3.9 ft _
I
Direction
FWwet/Wdry = 0.42 I "_--of motion
V G = 85 knots
Wwet/Wdry = 1.00 VG/Vp = 1.33
r 2 3 4
Distance along runway, ft
Figure 9.- Tandem wheel hydrodynamic ground pressures. Vertical load per tire, approximately
5_600 ib; water depth, 0.5 inch; tire pressure, 50 ib/sq in.
29

Wheel angular
velocity,
radians/sec
2 x 10 2
Water covered runway
Water depth = 0.I0 to 0.4
1
0
Moment about
wheel axle,
Ib - in
44 x i0 Spin-up moment (tire drag sources)
I + DS + (Fv - FV'S)__DR (r - 6)_
2 FvX c
0
_ Spin-up torque impulse
Spin-down torque impulseIIII
-2 I I I | I
0 1 2 3 4 5
Time, sec
Figure i0.- Unbraked wheel spin-down due to hydroplaning. _2 x 8.8 aircraft tire; F V = i0,000 ib;
p = 90 lb/sq in. (Data obtained from ref. ll.)
30

e-
"o
o
g
t,
O
o)>
,-w
m
0_
1.0 m
.8
°6 _
.4
i
.2!
o
4O
Aft main \wheels
Forward main
wheels
Effective slush
depths, inches
I A .75 to 1.25
Vp [] 1.25 to 1.75O 1.75 to 2.25
I I I I I J I
60 80 I00 120 140 160 180
Ground velocity, knots
I
200
Figure ii.- Effect of slush on main wheel rotation. (Data obtained from ref. 15,)

o
g
o
,...i
ii1
Q)
1,O
,8
,6
,2
1,0
.g
,6
,4
,2
I
20
,\4O
Tire pressure
p, Ib/in 2
25 (front wheel)
-- -- 75 (front wheel)
25 and 75 (rear wheel)
60 80 1OO
Ground speed, VG, knots
I
] 20
(a) Variation of wheel spin-down with ground speed.
I I
Hydroplanlng speed, Vp
I
0 .4 .8 2.4
/
1.2 1.6 2.0
Velocity ratio, ground speed to hydroplaning speed,--V G
Vp
(b) Variation of wheel spin-down with velocity ratio.
Figure 12.- Effect of tire hydroplaning speed on wheel spin-down encountered on single tandem
landing gear on water covered runway. F v _ 12_000 Ib; water depth _ i inch.
32

Partial hydroplaning speed Total hydroplaning speed
V G VG= --_ 0.32. (b) V G = 87 knots; --_ l.ll.
(a) V G 25 knots; Vp Vp
Figure 13.- Side view of spray patterns at partial and total hydroplaning speeds obtained during
tests at Langley landing loads track. (See ref. 13.) Four-wheel bogie configuration; tire
pressure, 75 ib/sq in.; F V _ 22,300 ib; water depth, 2 inches.
Partial hydroplaning speed Total hydroplaning speed
V G VG(a) V G = 27 knots; --_ 0.60. (b) VG = 73 knots; --_ 1.62.
Vp Vp
Figure 14.- Front view of spray patterns at partial and total hydroplaning speeds obtained during 65--_2_8
tests at Langley landing loads track. (See ref. 13. ) Four-wheel bogie configuration; tire
pressure, 25 ib/sq in.; F v _ 22,_O0 ib_ slush depth, 1 inch.
33

VG(a) Four-engine Jet transport. VG = 155 knots) p = i_0 ib/sq in.} _pp = 1.41.
(Photograph from ref. 15. )
VG
(b) British Meteor fighter. VG = 87 knots; p = 60 ib/sq in.; _p = 1.2}.
(Photograph from ref. 22.)
Figure 15.- Disappearance of tire bow wave at total hydroplaning speeds during full-scale aircraft 6_-92_9
tests on slush and water covered runways.
34
#D,-4
J_JQJ
a_
-o
,-4
24 - x 103
16 -
8-
L0
00
_Experlmental
0
0 000/_0_ 0
o?' ,/---Vp (Eq.4)
I • I I I
40 80 120 160
Ground speed, VG, knots
Figure 16.- Slush drag on Jet transport. Main wheel tire pressure, 150 ib/sq in. (Data obtained
from ref. i0. )
35

.o
Jo)
o)
_D
_D
4 x 10³
Tire pressure, j_
p, ib/in z
f.75
50 _y -._ __
2 - 25
l_'_JJ_'_ l I l l
0 20 40 60 80 10O
Ground speed, VG, knots
(a) Variation of drag parameter with ground speed.
.o
.-4
0)E
_L
_o
_D
_D
p-4
_----Partial hydroplaning ) < Total hydroplaning-------_regime regime
4 x 10³
2
VHYloplan'n sPled'VPI I
0 .4 .8 1.2 1.6 2.0
VGVelocity ratio, ground speed to hydroplaning speed,--
vP
(b) Variation of drag parameter with velocity ratio.
Figure 17.- Effect of tire hydroplaning speed on the fluid drag developed by a dual-tandem landing
gear on slush and water covered runways. F V = 22,300 lb; water depth normalized to i inch.
36

@
orj
0,;.-I
U
.6-
Dry runway
i I I I0 40 80 120 160
Ground speed, knots
(a) 880 jet transport aircraft (see ref. I0)} concrete runway; anti-skid braking;
p = 150 Ib/sq in. ; gross weight = 150,000 ib; rib tread tires.
u_
.,4
o
0U
0.f-I
u
.4 -
.2 -
_ret" anti-skid braking, _eff
Wheels locked _ _" .._9
_ skid
I I I I40 80 120 160
Ground speed, knots
(b) Swift fighter aircraft (see ref. 2_); wet asphalt runway (water depth _ 2 _);
p = 520 ib/sq in.; gross weight = 16,000 ib; rib tread tires.
Figure 18.- Effect of wet but not flooded runways in anti-skid braking for two aircraft.
37

Wet runway (no puddles)
Puddled runway
(puddle depth = 0.3 in.)
.8
.4
Vp
i
0 A ! , I|
Maximum I
friction
coefflcientj
_max .8 -
.4
(a) Bituminous;
light rain.
i 1 I
(b) Portland cement;
moderate rain.
I i I I 1 I
20 40 60 80 I00 120
Car speed, mph
Figure 19.- Loss of braking traction in runway puddles due to hydroplaning. Data obtained fromreference >; 6.70-15 rib tread automobile tire; vertical load = 92_ lb; p = 24 lb/sq in.
38

.8--
.6zl
U
.40(J
0
U
C-123 aircraft; 17.00 - 20 Type III rib
tread tire; heavy rain (ref. 4)
NACA cart; 6.70 - 15 rib tread automobile
tire; water depth = 0.3 inch (ref. 5)
NASA track; 32 × 8.8 Type VII rib tread tire;
water depth = 0 to 0.5 inch (ref. Ii)
880 jet transport; 39 X 13 Type VII rib tread
tire; slush depth _ 0.5 inch (ref. 14)
_av
p= 120 i_
- p = 260 Ib/in 2
'--= _max40 ib/in 2
\
k
neff _ Yp : 150 ib/in 2 ""
\\
Vp
X__ _skid \ \
p = 60 ib/in2
I , I _k.6 .8
I I
.2 .4 1.0
VVelocity ratio, ground speed to hydroplaning speed, "G
Vp
Figure 20.- Effect of hydroplaning on braking coefficients obtained on water and slush covered
pavement surfaces.
39

Minimum depth
of water between
tire and runway
surfaces, in.
.16
.12
.O8
.O4
Smooth run_
/ Grooved runway
/ (tranverse grooves
II I / i i ,i
.2 .4 .6 .8 1.0
Water depth on runway, in
Figure 21.- Effect of runway water depth on tire displacement from runway under hydroplaningconditions. British Meteor fighter; ground speed, 87 knots; tire pressure, 60 lb/sq in.;
VG/V P = 1.2_. (Data from ref. 22.)
4o

.8
x .6cS
E
0
r"0
u
r..
.4
.2
Dry
_e Water
pth, in
.05
.3
rVp
I I I I I I lI0 20 30 40 50 60 70
Cart sFeed, mph
Figure 22.- Effect of water depth on runway on maximt_nbraking friction coefficient. Langley
landing loads cart test; 6.70-15 automobile rib tread tire; p = 40 ib/sq in.; slip, 0.125.
(Data obtained from ref. 5.)
41

Average
friction
coefficient,
_av
.6
.4
.2
Vp -_
_ Rib tread
_ /5 grooves 0.25 in
_ _depth =
Smooth tread_ _ _
; l I J l !
2 0 4 0 6 0 8 0 100 120
Ground speed, knots
Figure 23.- Loss of aircraft tire traction under partial hydroplaning conditions.
32 x 8.8 aircraft tire; water depth _ 0.3 inch (from Langley landing loads
track tests); vertical load _ 10,500 lb; p = 150 lb/sq in.
42

Maximum
friction
coefficient,
_max
.8
.6
.4
.2
Vp
Rib tread
h = 0.25 in
Sm
J l I I I I J
10 20 30 40 50 60 70
Cart speed, mph
Figure 24.- Loss of automobile tire traction under partial hydroplaning conditions. 6.70-15 4-ply
automobile tire; water depth = 0.3 inch (from braking trailer, ref. 5); vertical load = 929 ib;
p = hO ib/sq in.
43

>
u
c-
O
u
0
Nose or tailwheels
D
*Vf////7/////////I,0 i 2 3 x 10 5
Main wheels
Iflfll/I/I/lll/J,Total
" hydroplaning
regime
I I I I /llll
////j P_rti_l_////hydro_lan*_g//// regime
I I I I Idl I I/ I /
0 I 2 3 x 10 5
Aircraft
Civilian :
0 Prop
[] Prop-Jet
/_ Jet
Military:
• Prop
Prop-j et
• Jet
bomber
• Jet
fighter
Aircraft gross weight, lb.
Figure 2_,- Susceptibility of current aircraft to hydroplaning. (Data obtained from ref. 13. )
44

Tire
hydroplaning
velocity,
Vp, mph
I00
80
60
40
20
0
I0
Trucks and buses
Au tomobi les
2O 3O 4O 60 8O
Tire inflation pressure, p, ib/in 2
Figure 26.- S_ceptibiiity oT some ground vehicles to by_opl_ing.
I00
45

.4
3
U
q_
o
g 2
1
Wheel brake only
plus slushWheel brake
displacement drag Slush depth, in,
1.5
// \\
- _.'_"_ _. .. _ _ 1.0
I I I I I I
20 40 60 80 100 ]20
Ground speed, VG, knots
I
140
Figure 27.- Jet transport braking in slush. (Data obtained from ref. I0. )
46

140
Brakes applied
_n
0
_D
_D
0
_D
120
I00
8O
6O
4O
20
0 1
\\
\
\\
\
\
Slush, I/2 inch deep
(tires hydroplaned)
\ ",k
Wet \
pudd les ) \
\ ',Dry \
/ 'I '
I I I I I2 3 4 5 x 10 3
Distance, ft
Figure 28.- Effect of concrete runway surface condition on stopping distance for a four-
engine Jet transport. Data obtained from reference i0; gross weight = 150,000 ib;
tire pressure = 150 Ib/sq in.; anti-skid braking; thrust reversers not used.
47

.8
d
.6
.4
ou
N .2
I I
I0 20
\
Flooded Davement_ _
\
Dry paveme_t_ _7_
\\
! | I I
3O 40 50 60
Ground speed, VG, mph
(a) Assumed friction-coefficient variation for _to!oping distance calculations.
>
"o
t_
6O
5O
40
30
20
lO
\\\ _ \
Flooded pavement _
Rib-tread tlre -_J
Smooth tire J\/\ \
\\\
I
II ! ! I l|50 I00 50 200 250 300
Stopping distance, ft
\
I !
350 400
(b) Calculated automobile stopping distance on dry and flooded pavements.
Figure 29.- Calculated increase in automobile stopping distance when tires hydroplane on flooded
pavements based on assumed friction-coefficient variation.
48

CeT3t riftl_al
t o rc e, MV_
R
Tire
resistance
force, Mg_
i
©
>
?eo
m
160
100
80
60
49
2O
tPosted Curve
speed, radlu s,
VC, mph R, ft
50 12OO
55 I 55O
I 6_ l 85O
65 2350
I 70 2730
I
I
[ _--Posted speed limit on curve(_ = 0.12 to 0.16)
I \ __-
1 Tire hydroplaning (_ _ 0.05)
I I I I I I i I l
0 12 14 16 18 20 22 24 26
Highway curve radius, ft
Figm'e 50.- Ability of ground vehicles to negotiate unbanked highway curves.
I
28 x 10 2
49

>c_
-1
4J
t-Q)
U
L_
OU
O
u
%4
n_>
<
.6 -Tire
p_essure, Vp, knotsib/in 2
----O--'-- 280 145
----El-- -- 120 99
Average unbraked rolling
E] resistance of tire
gO
m
l J -----T - J i20 40 60 80 i00
Ground speed, VG, knots
(a) Variation of average friction coefficient with ground speed.
>
"i
_J¢-0J
.r4U
a
Q
0
>
.4.-
0
\
I ! I ! I
.2 .4 .6 .8 ] .0
V
_relocity ratio, ground speed to hydroplaning speed, ---_-G
Vp
(b) Variation of average friction coefficient with velocity ratio.
Figure Jl.- Loss in braking traction occurring to smooth tread tire on smooth wet concreterunway. Data obtained from reference ll; 52 X 8.8 Type VII (Tire S1); FV = lO,O00 lb;water depth = 0 to 0.3 inch.
50
Test aircraft tire: 44x13 Type VII,
rib tread. Test membrane: T-12, nylon COated wlth neoprene,smooth surface; 0.048 inch thick
Vp = 127.5 knots
c
o
o=
VG-- = o. 68
Vp
Dry
I I I I j0 .2 .4 .6 .8 I.O
S_p ratio, s I
Figure 32.- Loss _n braking traction suffered by rlb tread tire on smooth wet membrane sur- 65-_?2_0
face placed on top of concrete runway. Data obtained from reference 6; VG = 86 knots)FV = 20,bOO ib; p = 200 ib/sq in.

T-tO landingmatNonskid surfaceUncoatedsurface
-I
_qu_
o
t-o
r..
\\
\\
Dry
Wet(no puddles)
Nonskid coated
mat surface
J Wet(no puddles)
i I I I
0 .2 .4 .6 .8 1.0
Free roll Full skid
Sllp ratio, s I
Uncoated
mat surface
Figure 3J.- Effect of nonskid coating on the coefficient of friction obtained during wet- and dry- 6_-92_i
surface braking tests on an enameled steel landing mat. FV = 1_,020 lb; p = 220 lb/sq in.
VG
Data obtained from reference 6; VG = 84 knots; _p = 0.66.
52
![Hydroplaning during Steady-State Cornering Maneuversedccorp.com/library/HveWpPdfs/HVE-WP-2011-3.pdf · Hydroplaning research has involved both theoretical [1-3] and experimental [4-10]](https://static.fdocuments.us/doc/165x107/5c29a11a09d3f240638cadd4/hydroplaning-during-steady-state-cornering-hydroplaning-research-has-involved.jpg)