Phenology and Human Health: Allergic Disorders · Phenology and Human Health: Allergic Disorders...
64
-
Upload
truongtram -
Category
Documents
-
view
215 -
download
0
Transcript of Phenology and Human Health: Allergic Disorders · Phenology and Human Health: Allergic Disorders...


Phenology and HumanHealth:
Allergic Disorders
Report of a WHO meeting
Rome, Italy16–17 January 2003

EUR/03/5036791 ORIGINAL: ENGLISH E79129
ABSTRACT
With the European phenology network (a European-Commission funded project (EVK2–2000–20005)) and the International Centre for Integrative Studies (ICIS), WHO organized a workshop to discuss the associations between weather, climate change, phenology, pollen trends and allergic disorders, and the possible need to adapt pollen forecasting to a changing climate. The participants included allergologists, bioallergologists, climatologists, epidemiologists, general practitioners, paediatricians and a mathematician. The prevalence of asthma, allergic rhinitis, allergic conjunctivitis and eczema in Europe has increased during the second half of the 20th century. The sensitization to pollen allergens has also increased in many areas in Europe. The geographical distribution of plants with allergenic pollen and allergic sensitivity to pollen allergens varies greatly across Europe. But on average the length of the growing season in Europe has increased by 10–11 days over the last 30 years. An earlier start and peak of the pollen season are more pronounced in species that start flowering earlier in the year. The duration of the season is extended in some summer and late flowering species. Evidence is growing that climate change might facilitate the geographical spread of particular plant species to new areas as they become climatically suitable. Warming is likely to further cause an earlier onset and may extend the duration of flowering and pollen season, for some species (such as grasses and weeds). Some species, such as ragweed and mugwort, present particular risks for health, and require land use measures, maintenance of public areas, or eradication. The impact of climate change on the incidence, prevalence, distribution and severity of allergic disorders is still uncertain. The numerous scientific disciplines involved highlight the need for an expert task force to devise a common basis of knowledge by sharing scientific, technical and managerial know-how, which is plentiful. The workshop participants recommended multidisciplinary collaboration to further clarify the relationship between changing climate, allergens and allergic disorders and to improve forecasting accuracy and effectiveness.
Keywords CLIMATE AND HEALTH ENVIRONMENTAL HEALTH AIR POLLUTION CHRONIC DISEASE
© World Health Organization – 2003 All rights in this document are reserved by the WHO Regional Office for Europe. The document may nevertheless be freely reviewed, abstracted, reproduced or translated into any other language (but not for sale or for use in conjunction with commercial purposes) provided that full acknowledgement is given to the source. For the use of the WHO emblem, permission must be sought from the WHO Regional Office. Any translation should include the words: The translator of this document is responsible for the accuracy of the translation. The Regional Office would appreciate receiving three copies of any translation. Any views expressed by named authors are solely the responsibility of those authors.
This document was text processed in Health Documentatio Services n
WHO Regional Office for Europe, Copenhagen
CONTENTS
Page
Acknowledgements ........................................................................................................................................i 1. Introduction.........................................................................................................................................1 2. Objectives of the meeting ...................................................................................................................1 3. Conclusions of the meeting.................................................................................................................2 4. Session I. Overview of allergies and asthma in Europe......................................................................3
4.1 Overview of allergic diseases in Europe in relation to various exposure and lifestyles ...........3 4.2 A brief introduction into pathogenesis of allergic diseases ......................................................6 4.3 Pollen, allergens and human health ..........................................................................................7 4.4 Pollen related allergies in Europe .............................................................................................8
5. Session II. Effect of climate conditions on pollen and asthma and allergies ......................................9 5.1 Long-term effects of climate conditions on asthma and allergies ............................................9 5.2 Observed changes in flowering of plants connected to the start of the pollen season ............10 5.3 Are there current trends of pollen changes in Europe?...........................................................10 5.4 Country case studies ...............................................................................................................14
6. Session III .........................................................................................................................................19 6.1 What can we conclude on pollen-associated allergic disorders? ............................................19 6.2 What is the association between weather, phenology and pollen trends?...............................20 6.3 What is the association between climate variability/change and allergic disorders?..............21 6.4 Discussion and research gaps .................................................................................................21
7. Session IV. Data availability, data quality and needs: Towards a better exploitation for the future 23 7.1 Climate, biometeorology and air pollution .............................................................................23 7.2 Phenology ...............................................................................................................................25 7.3 Aerobiology ............................................................................................................................28 7.4 Epidemiology..........................................................................................................................29 7.5 EEA Climate Impact Indicators Project/The Topic Centres of the EEA................................30 7.6 The WMO CLIPS project .......................................................................................................31
8. Session V. Pollen forecasting............................................................................................................32 8.1 Pollen forecasting ...................................................................................................................32 8.2 Experiences with pollen forecasting .......................................................................................32 8.3 Forecasting the features of pollen seasons in the scenario of climate change ........................33 8.4 The SPRING project...............................................................................................................34 8.5 The future of pollen forecasting..............................................................................................34 8.6 Pollen forecast and the role of phenological networks ...........................................................35
9. Session VI. Group discussion ...........................................................................................................37 9.1 Data gaps and problems..........................................................................................................37 9.2 Forecasting..............................................................................................................................39 9.3 Recommendations...................................................................................................................40
10. References.........................................................................................................................................41 List of participants.......................................................................................................................................50 Programme of the meeting ..........................................................................................................................53


EUR/03/5036791 page i
Acknowledgements
This report was prepared by Ms Maud Huynen, Dr Bettina Menne, and the workshop participants: Professor Dr Heidrun Behrendt, Dr Roberto Bertollini, Professor Sergio Bonini, Professor Rui Brandao, Mr Bernard Clot, Dr Claudio D’Ambrosio, Dr Paola De Nuntiis, Dr Kristie L. Ebi, Professor Jean Emberlin, Mrs Eszter Erdei Orbanne, Dr Carmen Galán, Ms Maud Huynen, Dr Siegfried Jäger, Ms Sari Kovats, Professor Paolo Mandrioli, Dr Pim Martens, Dr Annette Menzel, Dr Buruhani Nyenzi, Dr Auli Rantio-Lehtimäki, Professor Dr Johannes Ring, Dr Ondrej Rybnicek, Dr Claudia Traidl-Hoffmann, Dr Arnold van Vliet, Dr Thomas Voigt, Professor Stephan Weiland, Dr Magnus Wickman. Dr Charlotte Braun-Fahrländer, Dr Brunello Wuethrich, Dr Bert Brunekreef and Professor Gennaro d'Amato contributed by sending abstracts or publications. Blessy Corda was responsible for the secretarial support. Cover Photo of Birch Pollen: H. Behrendt.

EUR/03/5036791 page 1
1. Introduction
Phenology is the study of the timing of recurring biological phases, the causes of their timing with regard to biotic and abiotic forces, and the interrelation among phases of the same or different species. The “Phase” or “Phenophase”, may be the date of first flowering, budbreak, unfolding of first leaf, first bird migration etc. (Lieth 1974). The timing of phases is very important in biological systems and processes as it influences factors like the length of the growing season, frost damage, timing and duration of pests and diseases, water fluxes, nutrient budgets, carbon sequestration and food availability. The timing of life-cycle events can vary very much from year to year. Thereby, weather (especially temperature) is one of the determining factors. Because of a change in climate, the timing of a large number of life-cycle events is changing too. This has consequences for many different sectors in our society: agriculture, fisheries, biodiversity conservation, forestry, recreation and tourism, private gardening, transportation and health. The timing of phenological processes (flowering of plants) determines the start and duration of the pollen season. The start of pollen release and the amount of pollen in the air strongly depends on weather conditions in the preceding months and vary strongly from year to year. It is expected that some pollen seasons may start earlier and last longer due to climate change. Changes in the growth pattern, seasons of growth and length of period, can change the geographic distribution of certain types of plants. Allergic disorders constitute an important public health problem with high prevalence across Europe. Ten to twenty per cent of the total population in the European countries suffer from pollen-induced allergies.
2. Objectives of the meeting
Within the European phenology network (EPN) (EVK2–2000–20005) project, the WHO European Centre for Environment and Health and the International Centre for Integrative Studies (ICIS), Maastricht University, organized a workshop on phenology and human health. The scope of the workshop was to:
• explore the influences of climate change and phenology on plants;
• explore changes in prevalence of allergic rhinitis and other disorders or diseases as an influence of the changing climate and phenology;
• explore available information, data-sets and the need of future developments;
• explore available preventive measures; and
• improve interdisciplinary collaboration. The participants formed a multidisciplinary group with expertises in epidemiology, medicine, allergology, paediatrics, meteorology, aerobiology, phenology and environmental health. The meeting was organized into six sessions: Session I: Overview of allergies and asthma in Europe; Session II: Effect of climate conditions on pollen, asthma and allergies; Session III:

Group Work to discuss the association between pollen and health, climate variability/change and pollen trends, between climate variability/change and allergic disorders and research gaps; Session IV dealt with data availability, data quality and needs: Towards a better exploitation for the future; and Session V with pollen forecasting. During Session VI the recommendations of the meeting were developed. The report of this meeting reflects the knowledge and opinion of the participants. The WHO, ICIS and EPN as well as the participants are aware that there might be other initiatives, research activities and results, which are not reflected in this report. We would be grateful if this would be communicated to [email protected] as well as any other comments.
3. Conclusions of the meeting
The prevalence of asthma, allergic rhinitis, allergic conjunctivitis and eczema in Europe has increased during the second half of the 20th century. The sensitization to pollen allergens has increased in many areas in Europe, e.g. birch pollen in central and northern Europe, olive pollen in Mediterranean areas, ragweed pollen in Hungary or plane tree and Cupressaceae/Taxaceae pollen as urban aeroallergens, however, the relationship to pollen count is mostly unclear at present. The geographical distribution of plants with allergenic pollen and allergic sensitivity to pollen allergens varies greatly across Europe. Allergic diseases depend on multiple environmental gene interactions, which includes a number of factors. Allergen exposure seems to be a necessary ingredient for the development as well as aggravation of diseases. There might be connections between pollen exposure and other diseases (e.g. an association with daily cardiovascular and respiratory-disease mortality has been reported). The incidence of pollen related allergic diseases might increase in Europe in the next ten years, due to increased background sensitization rates. The burden of IgE-mediated allergic diseases is related to the length of pollen season, the total pollen counts and the number/height of the pollen peaks and allergen bioavailability. The allergen concentration in the air is an important factor for disease development and outcome. Pollens are not only allergen carriers but also might release proinflammatory substances. The allergen content within pollen grains of the same taxon can vary for a number of reasons. On average the length of the growing season in Europe increased by ten to eleven days during the last thirty years. Many studies show that the start of flowering is advancing with species-specific differences (annual more than perennial species, insect pollinators advancing more than wind pollinators). There is a strong seasonal pattern of change. An earlier start and peak of the pollen season is more pronounced in species that start flowering earlier in the year. Duration of the season is extended in some summer and late flowering species. Due to the earlier onset of pollen seasons, the seasons are more often interrupted by adverse weather conditions in late winter/early spring. There is growing evidence that climate change might facilitate the geographical spread of particular plant species to new areas, which become climatically suitable. Warming is likely to further cause an earlier onset and may extend the duration of flowering and pollen season, for some species (e.g. grasses, weeds). However, the effect of the expected rate of warming (0.5°C per decade) could be less pronounced than effects of land use change, sociocultural changes as well as international transport.

EUR/03/5036791 page 3
Some species present particular risks for health and require measures of land use, maintenance of public areas or eradication, e.g. ragweed and mugwort. Increased snowfall (due to increasing precipitation) takes a longer time to melt and may cause later onset of flowering in northern latitudes. The impact of climate change on the incidence, prevalence, distribution and severity of allergic disorders is uncertain. The numerous scientific disciplines involved highlight the need for an expert task force to devise a common basis of knowledge by sharing scientific, technical and managerial know-how. Experts from climatology, bioclimatology, biometeorology, atmospheric physics and meteorology; phenology, aerobiology and palynology, allergology and clinical immunology; pneumology, dermatology, paediatrics, general medicine and epidemiology should compose this task force. There are many data available from the different networks in the different disciplines, at country or regional level and in some cases at global level. Each of these networks has different data gaps and problems. These might be classified into scale (spatial and temporal), quality assurance, and standardization of indicator definition, methodological and managerial. Various experiences of pollen forecasting are available in some countries, including the Austria, Belgium, Czech Republic, Denmark, Finland, France, Germany, Hungary, Italy, the Netherlands, Spain, Sweden, Switzerland and the United Kingdom. Forecasts are made at various time scales: the next day, a week ahead, a month ahead and/or seasonal level. Most of the forecasts exist for grass pollen and for the main airborne allergenic types at a subregional level, e.g. olive and Cupressaceae in Mediterranean countries, pellitory on coastal areas in south Europe, birch in central and northern Europe, ragweed in eastern/central Europe or birch, oak, and weeds (mostly nettles) in the United Kingdom. Forecasts include start of season, season severity, trend and time of peak, duration, and day-to-day variation. Discussions are ongoing on how to adjust the models to the changing climate. Few networks measure allergen quality for scientific purposes. There is a need to better understand the relationship between the changing climate and allergic disorders, to better multidisciplinary collaboration, to improve forecasting accuracy and to test the effectiveness of forecasting methods.
4. Session I. Overview of allergies and asthma in Europe
4.1 Overview of allergic diseases in Europe in relation to various exposure and lifestyles
Symptoms of rhinitis and asthma due to aeroallergens are major causes of morbidity, loss of productivity, and increasing healthcare costs in some European countries (Malone et al. 1997). According to the European Allergy White Paper (Aas et al. 1997) the overall prevalence of seasonal allergic rhinitis in Europe is approximately 15%; the current asthma prevalence rates vary from 2.5–10%; and the prevalence of atopic dermatitis ranges from 9–24%. The prevalence of allergic diseases and asthma has increased steadily in recent years (for example, Haahtela et al. 1990; Aberg et al. 1996; Ring et al. 2001; and Perzanowski et al. 2002) and this trend seems to continue in some parts of Europe, although for example in Italy and the

United Kingdom increasing trends are not reported anymore and they seem to have reached a “plateaux” (Fleming et al. 2001; and Ronchetti et al. 2001). In most of the countries within Europe, from the mid-1970s to the mid-1990s the prevalence of asthma symptoms has been reported to increase by 200% in children, bringing the percentage of affected people to 5% to 20% depending on the age group, with the highest figures among children and teenagers (Strachan et al. 1997). However, the variation in prevalence between countries is substantial, with very high prevalence rates in Great Britain (Figure 4.1) (Strachan et al. 1997). In some eastern European countries as well as in developing countries rates were generally lower. There is a difference in prevalence of respiratory atopic diseases (hay fever and asthma) between former eastern and western Germany according to different life styles (Von Mutius et al. 1992; Ring et al. 1999). Asthmatic and pollen allergic individuals are likely to increase in the total population in absolute during the next ten years due to a cohort effect, while primary prevention is not likely to change this during this rather short time span. However, it is difficult to predict pollen related impacts on health in Europe, as there are regional differences in allergenic pollen types, apparent differences in thresholds of responses in different populations and ranges of responses within populations with age. However the increased sensitization rates might lead to new demands for the health care system, on diagnosis, treatment and education. There might be more individuals with airway hyperreactivity and more individuals will react after pollen exposure due to interaction with air pollutants. A concerted effort is needed to tackle the problem now if we want to stop this increase in the number of children suffering from allergic disease in the future. Many authors have aimed at explaining the heterogeneity and the increase of prevalence of asthma and allergies in a number of industrialized countries. In addition to genetic susceptibility, several factors were related to the prevalence of asthma and atopic disorders in many studies. For example infections in early life, microbial exposure, exposure to endotoxins, indoor and outdoor air pollution as environmental tobacco smoke or traffic-related air pollution (Krämer et al. 2000), poor indoor/outdoor climates, allergen exposure and nutrition seem to coincide with the onset of allergic disease. When the disease is established, some of these factors may also act as triggers of symptoms.

EUR/03/5036791 page 5
Figure 4.1 Prevalence of asthma, rhinitis and eczema symptoms among children of 13–14 years of age, Europe, 1997 (Strachan et al. 1997).
>20%
10–20%
<10%
>15%
10–15%
5–10%
<5%
>20%
10–20%
5–10%
<5%
Eczema symptoms
Rhinitis symptoms
Asthma symptoms
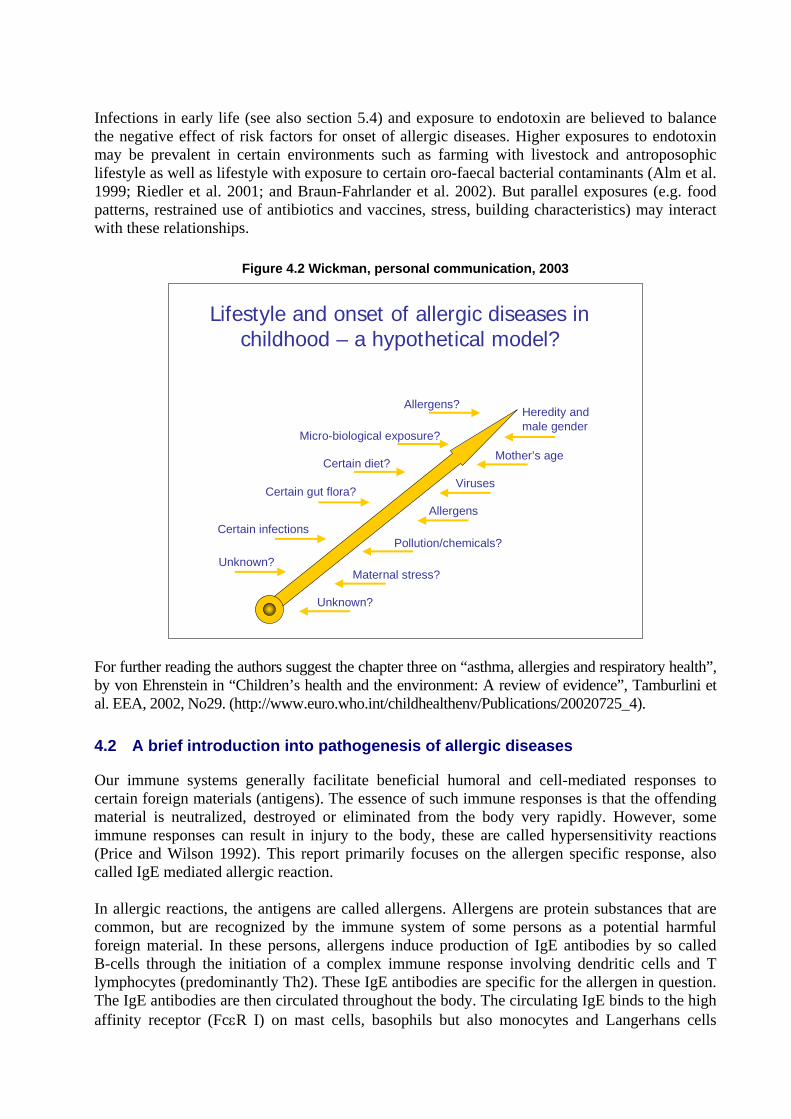
Infections in early life (see also section 5.4) and exposure to endotoxin are believed to balance the negative effect of risk factors for onset of allergic diseases. Higher exposures to endotoxin may be prevalent in certain environments such as farming with livestock and antroposophic lifestyle as well as lifestyle with exposure to certain oro-faecal bacterial contaminants (Alm et al. 1999; Riedler et al. 2001; and Braun-Fahrlander et al. 2002). But parallel exposures (e.g. food patterns, restrained use of antibiotics and vaccines, stress, building characteristics) may interact with these relationships.
Figure 4.2 Wickman, personal communication, 2003
Lifestyle and onset of allergic diseases in childhood – a hypothetical model?
Heredity andmale gender
Pollution/chemicals?
Micro-biological exposure?
Certain gut flora?
Certain diet?
Viruses
Mother’s age
Certain infections
Unknown?Maternal stress?
Allergens
Unknown?
Allergens?
For further reading the authors suggest the chapter three on “asthma, allergies and respiratory health”, by von Ehrenstein in “Children’s health and the environment: A review of evidence”, Tamburlini et al. EEA, 2002, No29. (http://www.euro.who.int/childhealthenv/Publications/20020725_4).
4.2 A brief introduction into pathogenesis of allergic diseases
Our immune systems generally facilitate beneficial humoral and cell-mediated responses to certain foreign materials (antigens). The essence of such immune responses is that the offending material is neutralized, destroyed or eliminated from the body very rapidly. However, some immune responses can result in injury to the body, these are called hypersensitivity reactions (Price and Wilson 1992). This report primarily focuses on the allergen specific response, also called IgE mediated allergic reaction. In allergic reactions, the antigens are called allergens. Allergens are protein substances that are common, but are recognized by the immune system of some persons as a potential harmful foreign material. In these persons, allergens induce production of IgE antibodies by so called B-cells through the initiation of a complex immune response involving dendritic cells and T lymphocytes (predominantly Th2). These IgE antibodies are specific for the allergen in question. The IgE antibodies are then circulated throughout the body. The circulating IgE binds to the high affinity receptor (FcεR I) on mast cells, basophils but also monocytes and Langerhans cells

EUR/03/5036791 page 7
(Metzger et al. 1984; and Bieber et al. 1992). This process, which occurs in the absence of clinical symptoms, is called sensitization. After renewed contact with the antigen, briding of at least two IgE molecules on the surface of a mast cell by the antigen results in the explosive release of substances (e.g. histamines) contained within the mast cells, resulting in an inflammatory reaction, which, in turn, leads to the appearance of the clinical signs of allergy such as rhinitis, asthma or eczema (see for example, Price and Wilson 1992; and Kay 2001).
4.3 Pollen, allergens and human health
The importance of grass pollen as potent inducers of allergic reactions was established almost 130 years ago when Blackley (1959) performed skin and provocation tests (Blackley 1959) and documented the relationship between pollen exposure and allergic symptoms. Today, it is well known that specific aeroallergens released from pollen cause hypersensitivity and lead to allergic diseases (e.g. rhinoconjunctivitis, bronchial asthma, atopic eczema, urticaria, pollen associated food allergies and anaphylaxis). By a procedure called “atopy patch test” it has been shown that pollen also can elicit eczematous skin lesions in atopic eczema patients (Darsow et al. 1997). Pollen grains are not only allergen carriers, but also carriers of bioactive substances (such as pollen associated lipid mediators), and they contain antioxidative activity. Under natural exposure conditions, the bioavailability of allergen depends on the protein liberation from internal binding sites within the allergen carrier (Behrendt and Becker 2001). Little is known about the physiological function of the allergenic proteins within the pollen grain even though some have been identified as defence proteins (Knox and Suphioglu 1996). Thus, the release of these proteins – harmful for humans – depends, in part, on stress situations for the plant. A number of factors have been attributed to cause the allergen release from pollen, such as pH, temperature, UV radiation, humidity, air pollutants, etc. There are a number of hypotheses on how the allergen release occurs, this includes the release through microchannel within the exine, extrusion of cytoplasm after uptake of water (Diaz-Sanchez et al. 2000) and emanation directly from the flower after moisture or drying cycles (Taylor et al. 2002). The majority of studies conducted to date concerning the elicitation and expression of allergic symptoms, have concentrated primarily on individual allergens. However, the immune system of most individuals is not necessarily exposed to the allergen in pure manner, but rather in particulate form (Somonon et al. 1983; Stewart and Holt 1985), either as pollen, starch granules from broken pollen grains (Schappi et al. 1997), or associated with exogenous particulate material such as diesel exhaust particles (Knox et al. 1997). Recently, Traidl-Hoffmann et al. (2002) observed the release of lipid mediators from pollen grains. The group hypotized that rapid release of bioactive lipid mediators from pollen during contact with mucous or respiratory membranes may act as allergen independent proinflammatory factors contributing to initiation, manifestation or aggravation of allergic inflammation. Evidence is accumulating that air pollution may contribute to the increase in pollen allergies and asthma in highly polluted areas (Ishizaki et al. 1987). However, no direct correlation was observed between pollen release and the emission peaks of NOx, SO2 and atmospheric fine dust (Behrendt et al. 1991; and Ring et al. 2001). Pollen grains absorb heavy metals, i.e. lead and cadmium, but also nitrate and sulphur. Furthermore, investigations of dust samples from highly polluted regions in Germany showed a significant degree of particle agglomeration on the surface of pollen grains (Kainka-Stänicke et al. 1988; Kainka-Stänicke et al. 1989; and Behrendt
et al. 1995). Particle-absorbed organic substances belong mainly to the group of polycyclic hydrocarbons, phenols or aza-heterocyclic compounds, which have been shown to mediate pollen-particle interaction. Some studies have investigated the association of daily variations of this kind of air pollution and cardiovascular and respiratory deaths (Pope 1999). Brunekreef and co-workers expanded this view taking pollen as a form of biogenic air pollution, which has been largely ignored in these studies. Most interestingly, they found in a time-series study in the Netherlands, a strong association between the day-to-day variation in pollen concentrations and that of deaths due to cardiovascular disease, chronic obstructive pulmonary disease and pneumonia (Brunekreef et al. 2000).
4.4 Pollen related allergies in Europe
Europe is a geographically complex continent with a wide range of climates and a wide spectrum of vegetation. Pollen calendars differ from one area to the other, however, as a whole pollination starts in late winter and ends in autumn. Pollen are released from grasses, trees and weeds. Several studies show (see section 5.3.) that the pollen maps in Europe are changing, as a result of climatic factors (see section 5.2.), cultural factors (e.g. importation of plants into urban parklands) and greater international travel and transport (e.g. the expansion of ragweed). Grass pollen induced pollinosis is the most frequent pollen allergy. The grass pollen family (Poaceae) comprises more than 600 genera and over 10 000 species. The most abundant airborne grass pollen originates from tall meadow grasses such as timothy (Phleum pratense) orchard grass (Dactylis glomerata) or meadow foxtail (Alopecurus). Cultivated rye (Secale cereale) also has a remarkably high pollen production. In central and eastern Europe the main grass flowering period starts at the beginning of May and finishes end of July. In the Mediterranean it usually starts one month earlier and ends already in June. In northern Europe the season starts depending on the latitude, much later (end of June) and ends later (in August). Accordingly, pollination occurs two to three weeks earlier at sea level than in mountainous areas. Maximum atmospheric grass pollen concentrations can be found one to two months after start of flowering (D’Amato et al. 1998). The most allergenic tree pollen in north, central and eastern Europe is the birch (Betula) pollen. Birch is the major pollen-allergen-producing tree in northern Europe. In western Europe, the main flowering period usually starts at the end of March, and in central and eastern Europe from the beginning to mid-April. Going northward, the flowering season starts, depending on the latitude, from late April to late May (northern Europe). Pollen values peak one to three weeks after the start of the season. The duration of the main season is strongly dependent on temperature and thus varies from two to as much as eight weeks. Far shorter or longer periods, with yearly alternating low and high pollen production, have been observed in various European regions (Spieksma et al. 1995; and Emberlin et al. 2002a). In the Mediterranean, olive pollen is one of the most common causes of pollinosis. The main pollen season is from April to June (D’Amato et al. 1998). Pollen value peak two to three weeks after the start of the season. The duration of the main season varies from eight to twelve weeks, depending on the temperature gradient and topography, with yearly alternating low and high pollen production (Galán et al. 2001a). Pollen of the Cypress family have increasing influence on human health in the Mediterranean (Ariano et al. 1999).
EUR/03/5036791 page 9
As regards to weeds, Partietaria is the main allergic genus of the Urticaceae (nettle) family. P. judaica grows mainly in Mediterranean areas, but also has been found in the United Kingdom. The extraordinary long persistence in the atmosphere of Parietaria pollen in the Mediterranean area is responsible for multiseasonal symptomatology (D’Amato et al. 1998; D’Amato et al. 1999; and Corsico et al. 2000). The most common species of Artemisia are A.vulgaris (mugwort) and A.annua, which grow mainly in western and central Europe, and A.verlotiorum, which grow mainly in southern Europe. A. herba-alba and A. barrelieri grow in south western Spain. Mugwort is present in both urban and rural areas. It flowers from late July to the end of August in northeastern Europe, and about three to four weeks later in Mediterranean areas. As an exception, the flowering period shifts from the northeast to the southwest, usually we experience a drift from the south towards the north. The later flowering in southern Europe contrasts with the pollen season of other allergic plants (e.g. grass) that flower earlier in Mediterranean areas than in central and northern Europe (D’Amato et al. 1998). This fact could be due to the different species growing in the different bio-geographical areas in Europe and also the conditions of extreme aridity in the summer of southwestern Europe localities, that impedes the availability of water (Cariñanos et al. 2000). A.annua and A.verlotiorum flower from September to the end of October. The frequency of sensitization to mugwort among pollinosis patients in Europe is 3% to 30%. A common pollen-associated food allergy is known as the “mugwort-celery syndrome” (D’Amato et al. 1998). Unlike in the United States, where Ambrosia (ragweed) pollen is the etiologic agent in about half of all cases of pollinosis, in most parts of Europe it is not a major cause of pollinosis. However, ragweed sensitization is increasing in Europe (D’Amato et al. 1998; and Rybnicek and Jäger 2001; Clot et al. 2002).
5. Session II. Effect of climate conditions on pollen and asthma and allergies
5.1 Long-term effects of climate conditions on asthma and allergies
The effect of long-term climatic conditions on the incidence and prevalence of asthma and allergies has been investigated only in very few multicentre prevalence studies using national and international data (Hales 1998; Weiland et al. 2000; and Verlato et al. 2002). All studies were based on questionnaire data on symptoms and doctor's diagnoses of atopic diseases. A national study from New Zealand reported a positive association between mean annual temperature and the 12 months period prevalence of wheeze in adults (Hales 1998). An international study found asthma symptoms in adults to be positively associated with temperature in the coldest month of the year (Verlato et al. 2002). A third study investigated the association of climate with atopic diseases in children using data from the International Study of Asthma and Allergies in Childhood (ISAAC) (Weiland et al. 2000). Between 1992 and 1996, each study center studied random samples of children aged 13 to 14 and 6 to 7 years (approximately 3000 per age group and centre) using standardized written and video questionnaires on symptoms of asthma, allergic rhinoconjunctivitis and atopic eczema during the last 12 months. Data on long-term climatic conditions in the centers were abstracted from one standardized source. Mixed linear regression models were calculated to take the clustering of centers within countries into account. In western Europe (57 centres in 12 countries), the prevalence of asthma symptoms, assessed by written questionnaire, increased by 2.7% (95% confidence interval: 1.0%

to 4.5%) with an increase in the estimated annual mean of indoor relative humidity of 10%. Similar associations were seen for the video questionnaire and the younger age group. Altitude and the annual variation of temperature and relative humidity outdoors were negatively associated with asthma symptoms. The prevalence of eczema symptoms correlated with latitude (positively) and mean annual outdoor temperature (negatively).
These findings suggest that climate may affect the prevalence of asthma and allergies in children and adults. Further studies are needed which integrate more detailed information on meteorological conditions and atopic phenotypes, including objective measures such as lung function and atopic sensitization as well as data on temporal occurrence and severity of symptoms.
5.2 Observed changes in flowering of plants connected to the start of the pollen season
Phenology has achieved new importance as an integral bio-indicator for changing environmental conditions as phenological phases are mainly triggered by environmental conditions and are easy to observe (Menzel 2002). The general survey of phenological trends in Europe and North America, along with results from CO2-records, NDVI (Normalized Difference Vegetation Index) satellite data and duration of ice cover, give a relatively consistent image of the changes on the northern hemisphere with a clear lengthening of the growing season mainly due to the advance of spring (e.g. Menzel and Fabian 1999; Menzel 2000; Defila and Clot 2001; Sparks and Menzel 2002). Modelling of phenophases as well as statistical analysis show, that air temperature and the NAO (North Atlantic Oscillation) index of the preceding months explain a high percentage of the annual variability of leaf unfolding and flowering, thus of the duration of the growing season (e.g. Menzel 2003 (in press)). Spring phases, such as beginning of flowering and full flowering, occur progressively earlier. A high spatial variability, and regional differences of changes are revealed. Temporal variability includes a strong seasonal pattern of change. Species specific differences in the advances are found, e.g. annual species advance more than perennials, insect pollinated more than wind pollinated species (Menzel et al. 2001; Fitter and Fitter 2002; and Walther et al. 2002). For end of season phases such as autumn leaf colouring, the influencing environmental factors and the observed trends are not as clear (Menzel et al. 2001; and Menzel 2003 (in press)). The ecological consequences of these phenological changes will concern the competition and interaction of species, the synchrony in ecosystems, e.g. in food chains, as well as human health due to an earlier start of the pollen season (Walther et al. 2002).
5.3 Are there current trends of pollen changes in Europe?
By making use of more than 30 000 years of daily pollen records from Europe (data 1974 to 2002, 17 pollen types, over 450 stations) supported by the members of European Pollen Information (EPI) and European Aeroallergen Network (EAN), S. Jäger (2001) calculated trends for start, peak and end of pollen season as well as trends for intensity and duration of pollen seasons during the past three decades (Figure 5.1).

EUR/03/5036791 page 11
Figure 5.1 Trends for start, peak and end of pollen season as well as trends for intensity and duration of pollen seasons during the past three decades.
In general, an earlier start and peak of pollen seasons was clearly evident, being more pronounced in species that flower earlier in the year. The later the flowering time, the less significant trends become towards earlier start of the season. A later end of the season becomes more likely the later the flowering period. Overall, the pollen season expands. Pollen seasons became longer in particular for species flowering after March/April. An increase of the amount of pollen in the air is not common, but is more frequently observed for grass and weed pollen than for trees (Tables 5.1 and 5.2). Different patterns were observed for all characteristics mentioned above in different climatic zones and in different elevations. Most significant changes are ascertained in central Europe and in elevations between 50 and 1000 meters above sea level. The boreal zone, warm humid climates, and the Mediterranean showed fewest significant trends. Most remarkable with aspect to human health is the increasing occurrence of ragweed pollen in many European regions that gained strongly with the beginning of the 1990s (Figure 5.2). Originating from two hot spots: the Carpathian basin and the Rhône Valley, the plant has invaded into northern Italy and various central European countries, up to southern Sweden. By long-range pollen transport, thresholds for allergic complaints have been exceeded even as far north as Stockholm. Within the next decade, ragweed pollen allergy is likely to become a problem in a number of regions that have not been affected by ragweed pollen before. Birch pollen is suspected to underlay modifications in the allergen content. Several reports indicate increasing prevalence of birch pollen allergy, although pollen levels are not increasing (Figure 5.3).

Table 5.1 Overall trends of timing, duration, and intensity of pollen seasons in Europe 1974 to 2002. Selected pollen species in chronological order of their flowering period (Jaeger 2001).
Significance levels: 0 = not significant.; 1 = p < .05; 2 = p < .001; n = number of observed years. Explanation: start = 1st day (Julian calendar) with a daily mean value > 1% of the annual total, provided that no more than 6 days with zero values or missing values follow in series; peak = day (Julian calendar) with the peak value in case there are more than one peak days after this definition, the first occurrence has been taken; end = day (Julian calendar) when 95% of the annual total has been reached; len = length of season (difference start – end); nofdays = the number of days counted for the respective pollen type with a pollen count > 0 (i.e. number of days with at least one pollen per cubic metre of air in the daily mean); peakval = daily mean pollen count on peak day; anntot = annual total pollen count for the respective pollen type. Note: the different definitions of start and end result from the fact that pollen seasons do not follow a Gaussian curve, but have a steep slope at the beginning and a long fade out period at the end.
overall
Trends (1974–2002) all over Europe
-2 2earlier later -2 2less more
pollentype n= start peak end len nofdays peakval anntotl
Alnus 2305 -2 -2 -2 0 0 0 0Corylus 2285 -2 -2 -2 2 0 0 0Cupressaceae 1768 -2 -2 0 2 2 2 2Populus 1650 -2 -2 -2 2 2 0 0Salix 1706 -2 -2 -2 2 1 0 0Betula 2552 -2 -2 -2 0 -2 0 0Fraxinus 2033 -2 -2 0 2 2 0 0Platanus 1924 -2 -2 -2 0 2 2 2Oleaceae 999 0 0 0 0 -2 0 0Pinus 1877 -2 -2 0 2 2 0 0
intensitytiming duration
PoaceaeCastaneaChenopdiaceaeUrticaceae
2532 -2 -2 0 2 2 2 21350 -2 -2 -2 0 0 2 21958 -2 0 2 2 2 2 22184 -2 -2 2 2 2 2 2
Ambrosia 760 -1 0 2 2 2 1 2Artemisia 2127 -2 0 2 2 2 0 0Mercurialis 596 -2 -1 0 2 0 0 0
Table 5.2 Trends in start, duration (length), and intensity (annual totals) of pollen seasons in
Europe 1974–2002 (Jaeger 2001). Correlation coefficients: ** = p < .001; n = number of investigated years
n= flowering start duration intensity6324 winter -,272** -,280** -,150**3328 early spring -,267** +,104** +,0234585 full spring -,235** +,093** -,0272876 late spring -,216** +,124** -,0187101 summer -,100** +,066** +,116**3481 autumn -,092** +,137** +,067**

EUR/03/5036791 page 13
Figure 5.2 Annual totals of Ambrosia – pollen (ragweed) in Europe 1976–2002
372599848375101805044382415179775595532131N =
Ambrosia Europe
intensity
20022000
19981996
19941992
19901988
19861984
19821980
19781976
95%
CI A
NN
UA
L_T
4000
3000
2000
1000
0
bias !
YEAR 1991 seems to be a turning point. The year 2002 was biased by: a) lack of data from Hungary (hot spot) for 2001 and 2002; and b) by newly incorporated stations where Ambrosia pollen was present with only few days and low values (Scandinavia, first occurrence of Ambrosia ever).
Figure 5.3 Trends for birch pollen annual totals (1976–2002 n.s.) and sensitization rates (proportion of respiratory allergies 1984–2002 in %; p < .001) in Vienna (Jaeger and Berger 2000).

5.4 Country case studies
5.4.1 Evidence for the relationship between family doctor consultations for Seasonal Allergic Rhinitis (SAR) and pollen seasons; implications for changes in demand for health care provision with changes in climate. Case study from the West Midlands, United Kingdom
A trend has been observed in many regions of northern and central Europe. In the United Kingdom, birch pollen seasons become about five days earlier per decade over the last thirty years (Emberlin et al. 1997; and Emberlin et al. 2002). Relationships between the possible future changes in pollen seasons and allergy are complicated. For example, the results from the ISAAC study do not show a close correspondence between the prevalence of hay fever and the severity of pollen seasons (Strachan et al. 1997). Also some pollen seasons have less potential to change than others as the plants are limited by photoperiods. Other problems in predicting impacts on health in Europe include: regional differences in allergenic pollen types, apparent differences in thresholds of response in different populations and ranges of responses within populations with age. Some evidence is available at national and regional levels including doctor consultation registers and sales of hay fever remedies. Indications can be obtained from considering how these aspects differ with the timing and severity of pollen seasons. The case study reported here examines doctor consultations in the West Midlands, United Kingdom over three years (2000 to 2002). The data are from a sentinel service of 160 000 population, covering an area of 120 Km2. The data were analysed in relation to pollen data for the main allergenic taxa of: 1) Betula (birch) March, April, May; 2) Quercus (oak) April, May; and 3) Poaceae (grasses) May to mid August. It was found that most variation occurred for birch (which affect about 25% of hay fever sufferers) with a percentage increase in GP consultation rates in the most severe year of 147%. In the case of Oak this was 76% (affects about 20% hay fever sufferers), whereas for grass (affects about 95% of hay fever sufferers) this was only 11%. In the tree pollen seasons, implications include changes occurring in the timing of the peak of demand for health care and increased general practitioner consultation rates for hay fever. In the grass pollen seasons there was little change in overall demand, but there were changes in the timing of demand, especially when the season extended into late summer. osts to the Health Service through doctor consultation time and medication charges should be added to the costs to individuals for medication charges from pharmacies, time off work or education, lower productivity, and social costs.
5.4.2 Short-term climate changes and allergies related to patterns of aeroallergen abundance in Budapest, Hungary (1992 to 2001)
In the new Hungarian Environmental Health Action Programme, new research topics were addressed, such as the health impacts of climate change. From all hospitalized asthmatic patients in 2001 (141 000/10 000 000) 64% had positive skin prick test for outdoor allergens (Korányi 2002). Therefore, studying changes in aeroallergen abundance related to climatic conditions and descriptions of pollen seasons and characteristics were thought to give useful information for preventing allergic diseases (Frenguelli et al. 1991; and Emberlin et al. 1996). Method: The Hungarian Aerobiological Network’s pollen and spore ten-year-long database (32 different allergenic pollen grains and two mould spores and other spores), which were recorded continuously with standardized method (Burkard seven day volumetric trap) on daily basis by two traps in Budapest (average pg/m3) was used and matched to the Budapest weather

EUR/03/5036791 page 15
database collected by online air pollution monitoring stations of the Metropolitan Institute of State Public Health Service in eight points of the capital. For statistical analysis we used consolidated daily aeroallergen counts of spring trees, grasses and summer-autumn weeds and mould spores (Alternaria, Cladosporium, other spores, sum). As a first step of the analysis, regularly registered day-to-day temperature data, humidity, barometric pressure, wind speed parameters were used for aerobiological analysis. We examined pollen and spore distribution changes related to these conventional meteorological parameters by linear regression models (Erdei et al. 2001; and Erdei et al. 2002). Furthermore, we calculated a new meteorological variable called “total heat sums value” to reveal the essential heat requirement for the starts of the pollination of the most important Hungarian allergenic plants. “Total heat sum value” is frequently used in agrometeorology monitoring crops developments and phenophases. This was the first study, in which we applied these agrometeorological data to find out differences in pollen season’s starting dates and to establish new, predictive models for the starts of the pollination and spore production in Hungary. Results: We described significantly increased production of aeroallergens during the study period in Budapest. Starting dates of the pollen seasons varied remarkably; statistically significant associations were found with T24 and Tmin by years. The abundance of the most allergenic pollen types (like birch, ash, and ragweed) is enhanced during the study period. Predictive calculations can be made using relative heatsum values for starting dates of pollen seasons and fungi spore production, which is a promising tool for the follow-up of aeroallergen exposure in Hungary.
5.4.3 Seasonal pollen allergy and pollen phenology in Fennoscandia
The Nordic countries offer a favourable seasonal climate for studying pollen phenology, yearly onset of allergic symptoms, as well as long-range transport of both intact pollen and small-sized allergenic particles. The pollen seasons are uniformly coherent, and the allergologically most important pollen types (birches (Betula) and other Betulaceae-trees, as well as grasses and mugwort (Artemisia vulgaris)) have relatively no overlapping seasons (The Finnish Pollen Bulletin 1976 to 2002). To date, the phenological observations have played a minor part in determining the start of the pollen season, but cooperation was recently started in Finland between the aerobiological research unit and the nationwide phenological network run by the Finnish Forestry Institute. Climatological maps have recently been established for large geographical areas in Fennoscandia using GIS technology. There are great regional differences in the amount of precipitation and the length of the growing season as demonstrated in a study by Tveito et al. (2001) using data from 788 stations in the Nordic countries. Rainfall occurs in every other day in 65% of the Fennoscandian land area. In 50% of Fennoscandia the growing season (daily mean temperature above five centigrade) starts by 9 May. Winter defined as daily mean temperature below zero is absent from Denmark and the Norwegian west coast, whereas in restricted northern areas winter lasts more than 300 days. Also pollen seasons vary both in length and severity between sampling locations. The Nordic pollen monitoring network comprises of 31 sampling stations: in both Denmark and Iceland there are two stations, and in Norway there are six, in Sweden twelve and in Finland nine sampling stations. There is a two to four week interval between the start of the pollen season in the southern (60 degrees N) and in the northern (70 degrees N) stations in Finland.

There has been a threefold increase in the prevalence of asthma and allergic rhinitis among Finnish adolescents between 1977 and 1991 (Rimpelä et al. 1995). Both pollen and allergen reports are broadcast to the public, and especially the allergen reports are helpful for determining the need for medication (Rantio-Lehtimäki and Matikainen 2002). Commonly, the allergen concentrations in outdoor air start to increase about two weeks prior to the aerobiologically determined onset of pollen period (Rantio-Lehtimäki et al. 1994). Abundancy threshold values are used to inform allergics about the probability of having allergic symptoms. In an early cohort study, allergic symptoms and serum antibody levels were recorded (Viander and Koivikko 1978) and in all of the birch sensitized patients 80 birch pollen grains per cubic metre of air were enough to elicit symptoms. The threshold values for other allergenic pollen types have been determined relative to the birch pollen volume.
5.4.4 Exposure to birch pollen in infancy and development of atopic disease in childhood in Stockholm, Sweden
In the spring of 1993, the birch (Betula) pollen levels in Stockholm (Sweden) were ten times higher than those in 1992 and 50 times higher than those in 1994 (Kihlström et al. 2002). These extremely high levels of birch pollen, created the unique opportunity to study sensitization and development of atopic diseases in children with different exposures to an inhalant allergen during infancy. Kihlström et al. (2002) studied 583 children with atopic heredity, aged 4.5 to 5 years, born in Stockholm in February through April 1992, 1993 or 1994. The children born in 1993 (high-dose exposure to birch pollen at 0 to 3 months) were significantly more often sensitized to birch pollen than children born in 1994 (low exposure); prevalence rates were 17.8% and 8.8% respectively (odds ratio [OR], 2.4; 95% confidence interval [CI], 1.2–5.6). A tendency in the same direction was also shown for children born in 1992 (high-dose exposure at 12 to 15 months), as they were also most often sensitized to birch pollen (than children born in 1994) with a prevalence rate of 14.2% (OR, 1.7; 95% CI, 0.9–3.2). These results were supported by the RAST analysis. The prevalence of bronchial asthma, allergic rhinoconjunctivitis, and atopic dermatitis did not differ between the birth year groups. However, the prevalence of pollen and animal dander induced allergic asthma was significantly increased in the children born in 1993. An interaction between early high-dose exposure to birch pollen and cat in the household was suggested for sensitization to cat. The study concluded that exposure to high levels of birch pollen in infancy increases the risk of sensitization to the same allergens, as well as the risk of allergic asthma.
5.4.5 Switzerland: No further increase in asthma, hay fever and atopic sensitization rates
Braun-Fahrländer et al. examined changes of allergic symptom and sensitization rates between 1992 and 1999 in 14 year old Swiss children by means of three repeated surveys using identical methods as part of the Swiss Surveillance Programme (SCARPOL) (n = 743, 830, and 587). Symptom prevalence was assessed using the ISAAC core questions and specific IgE levels in serum were determined with the RAST method. Multivariate logistic regression analysis controlling for important personal and indoor risk factors, study area and participation rate were used to determine any trend over time. The results (Table 5.3) show that over six years the adjusted prevalence rates of hay fever and atopic sensitization remained constant and the current asthma rates slightly decreased. Thus, no further increase in asthma and hay fever prevalence can be observed in this population of Swiss adolescents. Including an objective marker of atopy (specific IgE) supported these results.
EUR/03/5036791 page 17
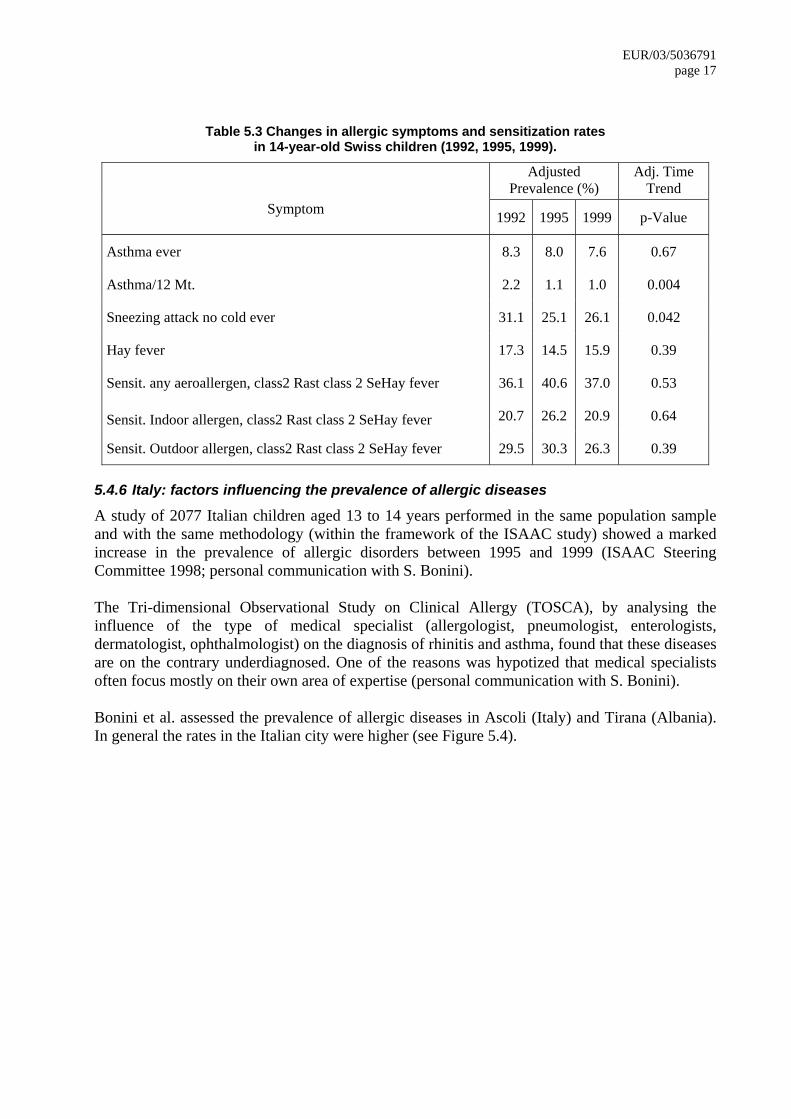
Table 5.3 Changes in allergic symptoms and sensitization rates in 14-year-old Swiss children (1992, 1995, 1999).
Adjusted Prevalence (%)
Adj. Time Trend
Symptom 1992 1995 1999 p-Value
Asthma ever 8.3 8.0 7.6 0.67
Asthma/12 Mt. 2.2 1.1 1.0 0.004
Sneezing attack no cold ever 31.1 25.1 26.1 0.042
Hay fever 17.3 14.5 15.9 0.39
Sensit. any aeroallergen, class2 Rast class 2 SeHay fever 36.1 40.6 37.0 0.53
Sensit. Indoor allergen, class2 Rast class 2 SeHay fever 20.7 26.2 20.9 0.64
Sensit. Outdoor allergen, class2 Rast class 2 SeHay fever 29.5 30.3 26.3 0.39
5.4.6 Italy: factors influencing the prevalence of allergic diseases
A study of 2077 Italian children aged 13 to 14 years performed in the same population sample and with the same methodology (within the framework of the ISAAC study) showed a marked increase in the prevalence of allergic disorders between 1995 and 1999 (ISAAC Steering Committee 1998; personal communication with S. Bonini). The Tri-dimensional Observational Study on Clinical Allergy (TOSCA), by analysing the influence of the type of medical specialist (allergologist, pneumologist, enterologists, dermatologist, ophthalmologist) on the diagnosis of rhinitis and asthma, found that these diseases are on the contrary underdiagnosed. One of the reasons was hypotized that medical specialists often focus mostly on their own area of expertise (personal communication with S. Bonini). Bonini et al. assessed the prevalence of allergic diseases in Ascoli (Italy) and Tirana (Albania). In general the rates in the Italian city were higher (see Figure 5.4).
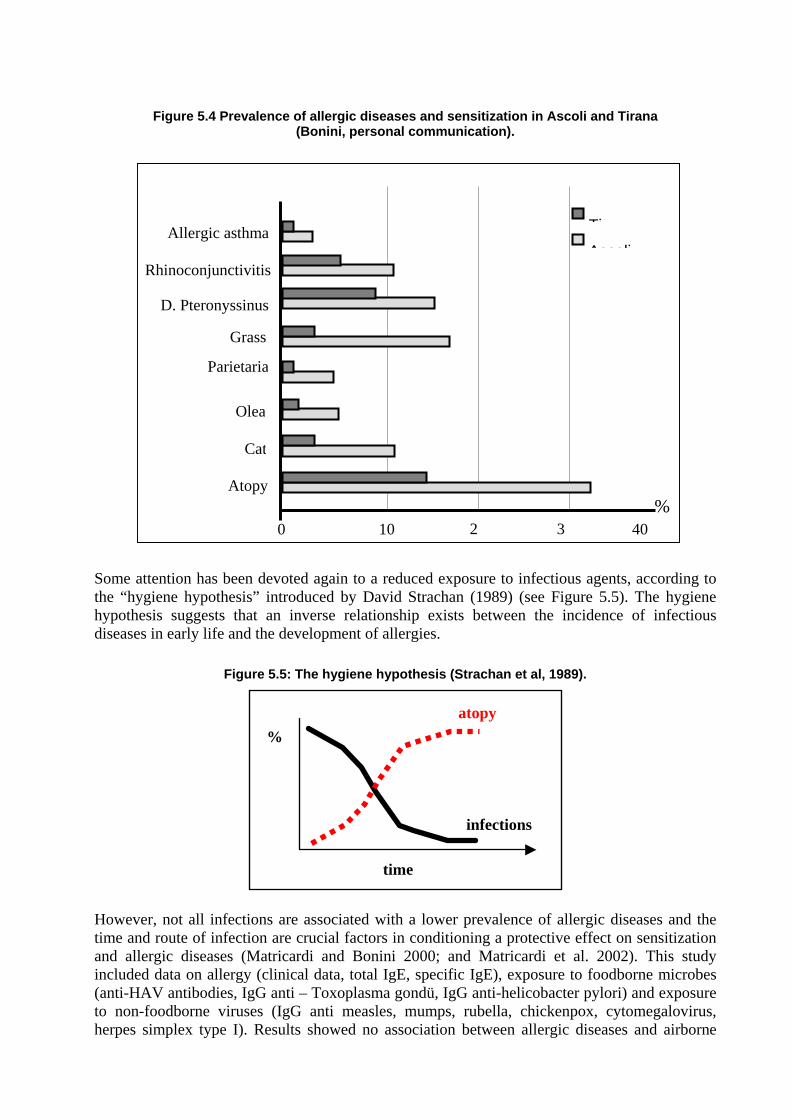
Figure 5.4 Prevalence of allergic diseases and sensitization in Ascoli and Tirana (Bonini, personal communication).
0 10 2 3 40
Atopy
D. Pteronyssinus
Cat
Grass
Olea
Parietaria
TiAscoli
Allergic asthma
Rhinoconjunctivitis
%
Some attention has been devoted again to a reduced exposure to infectious agents, according to the “hygiene hypothesis” introduced by David Strachan (1989) (see Figure 5.5). The hygiene hypothesis suggests that an inverse relationship exists between the incidence of infectious diseases in early life and the development of allergies.
Figure 5.5: The hygiene hypothesis (Strachan et al, 1989).
time
atopy
infections
%
However, not all infections are associated with a lower prevalence of allergic diseases and the time and route of infection are crucial factors in conditioning a protective effect on sensitization and allergic diseases (Matricardi and Bonini 2000; and Matricardi et al. 2002). This study included data on allergy (clinical data, total IgE, specific IgE), exposure to foodborne microbes (anti-HAV antibodies, IgG anti – Toxoplasma gondü, IgG anti-helicobacter pylori) and exposure to non-foodborne viruses (IgG anti measles, mumps, rubella, chickenpox, cytomegalovirus, herpes simplex type I). Results showed no association between allergic diseases and airborne

EUR/03/5036791 page 19
infections, but a strong negative association with foodborne infections. These results were recently confirmed by the same group on the basis of data from The National Health and Nutrition Examination Survey (NHANES) III study based on United States public registries (Matricardi, Rosmini et al. 2002). Whether the observed association is due to a direct effect of the foodborne infections on allergic diseases (see also McIntire et al. 2001) or that these infections are merely a marker of lifestyle is not clear.
6. Session III
During Session III the following main questions were addressed:
• What can we conclude on pollen-associated allergic disorders?
• What is the association between weather, phenology and pollen trends?
• What is the association between climate variability/change and allergic disorders?
• Which are the research gaps?
6.1 What can we conclude on pollen-associated allergic disorders?
• The prevalence of asthma, allergic rhinitis, allergic conjunctivitis and eczema in Europe has increased during the second half of the 20th century.
• The sensitization to pollen allergens has increased in many areas in Europe, e.g. birch pollen in central and northern Europe, olive pollen in Mediterranean areas, ragweed pollen in Hungary or plane tree and Cupressaceae pollen as urban aeroallergens; however, the relationship to pollen count is mostly unclear at present.
• The geographical distribution of plants with allergenic pollen and allergic sensitivity to pollen allergens varies greatly across Europe.
• Allergic diseases depend on multiple environmental-gene interactions, which includes a number of factors. Allergen exposure seems to be a necessary ingredient for the development as well as aggravation of diseases (Figure 6.1).
• There might be connections between pollen exposure and other diseases, e.g. an European association with daily cardiovascular and respiratory disease mortality has been reported (Brunekreef et al. 2000).
• The incidence of pollen related allergic diseases might increase in Europe in the next ten years, due to increased background sensitization rates.
• The allergen concentration in the air is an important factor for disease development and outcome.
• Prevalence rates of hay fever do not correspond with the severity of pollen seasons at the international level (ISAAC).
• The allergen content of pollen grains of the same taxon can vary for a number of reasons.
• Few centres in Europe assess the allergen content of pollen in air samples.
• Pollen might release other substances such as proinflammatory substances.
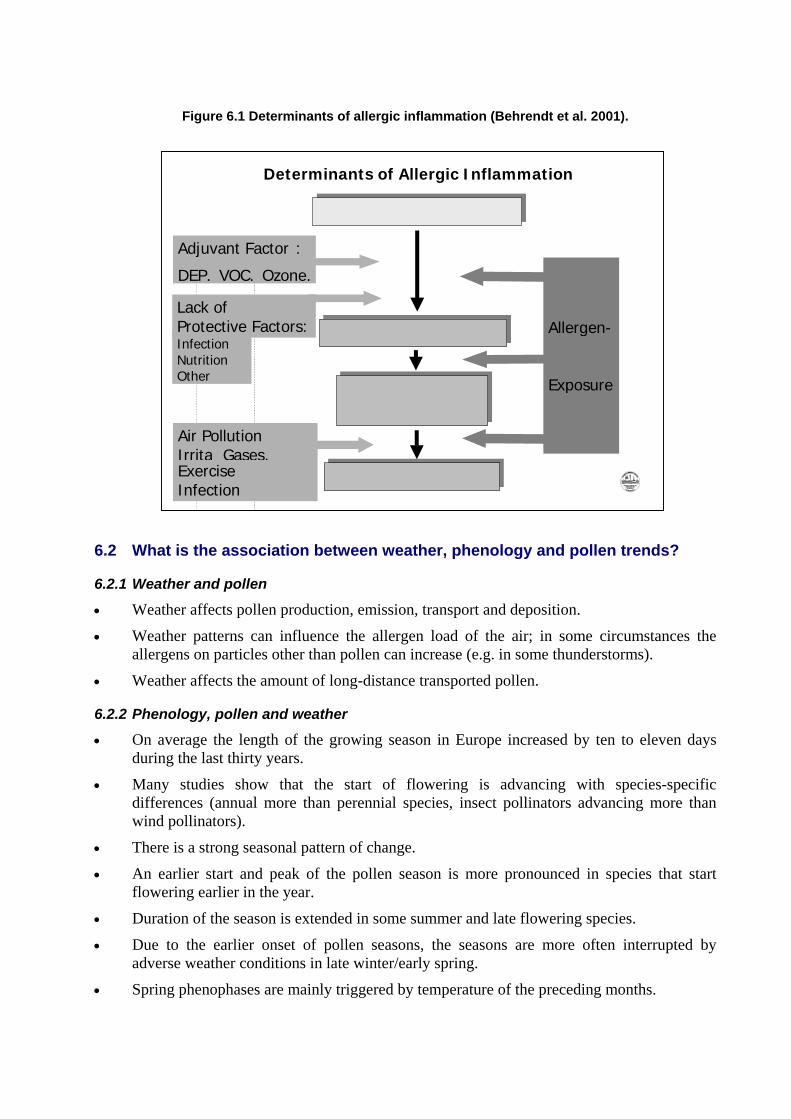
Figure 6.1 Determinants of allergic inflammation (Behrendt et al. 2001).
Determinants of Allergic Inflammation
G yenetic susceptibilitGenetic susceptibility
A nllergic SensitisatioAllergic Sensitization
H y yper reactivitHyper reactivity Airwa / Airway/Skin
A sllergic DiseaseAllergic Diseases
Adjuvant Factor :
DEP, VOC, Ozone,
Lack of
Air Pollution Irrita Gases,ExerciseInfection
Allergen -
Exposure
Protective Factors:Infection Nutrition Other
6.2 What is the association between weather, phenology and pollen trends?
6.2.1 Weather and pollen
• Weather affects pollen production, emission, transport and deposition.
• Weather patterns can influence the allergen load of the air; in some circumstances the allergens on particles other than pollen can increase (e.g. in some thunderstorms).
• Weather affects the amount of long-distance transported pollen.
6.2.2 Phenology, pollen and weather
• On average the length of the growing season in Europe increased by ten to eleven days during the last thirty years.
• Many studies show that the start of flowering is advancing with species-specific differences (annual more than perennial species, insect pollinators advancing more than wind pollinators).
• There is a strong seasonal pattern of change.
• An earlier start and peak of the pollen season is more pronounced in species that start flowering earlier in the year.
• Duration of the season is extended in some summer and late flowering species.
• Due to the earlier onset of pollen seasons, the seasons are more often interrupted by adverse weather conditions in late winter/early spring.
• Spring phenophases are mainly triggered by temperature of the preceding months.

EUR/03/5036791 page 21
6.3 What is the association between climate variability/change and allergic disorders?
6.3.1 Weather, pollen and allergic disorders
• Epidemiological studies have shown associations between climate conditions and allergic diseases.
• Long-term climate conditions have been associated with the prevalence of asthma in children and adults.
• Short-term variations in weather conditions have been found to be associated with exacerbation of allergic diseases (e.g. asthma hospital admissions and thunderstorms).
• There is a need to study more about weather/climate conditions, which can exacerbate asthma or rhinitis, conjunctivitis and allergic skin diseases.
• Epidemiological investigations are needed for a better understanding of the relationship between climatic/weather conditions and allergic diseases. These should include potential effect modifiers and confounders (i.e. contextual factors) of the association between pollen and health outcomes, e.g. air pollution.
• Importance of long-range transported pollen in allergic symptoms should be investigated.
• Long-distance transport of pollen is important especially in northern areas.
6.3.2 Long-term climate change
• Climate changes are very likely to facilitate the geographical spread of particular plant species to new areas, which become climatically suitable.
– The effect of the expected rate of warming (0.5°C per decade) could be less pronounced than effects of land use change, etc. (Riotte-Flandrois and Dechamp 1995; Zanon et al. 2000).
– Some species present particular risks for health, and require measures of land use, maintenance of public areas, or eradication (e.g. ragweed and mugwort).
• Warming is likely to cause an earlier onset and may extend the duration of flowering and pollen season, for some species (e.g. grasses, weeds).
• Increased snowfall (due to increasing precipitation) takes a longer time to melt and may cause later onset of flowering in northern latitudes.
• The impact of climate change on the incidence, prevalence, distribution and severity of allergic disorders is uncertain.
• The burden of IgE-mediated allergic diseases is related to the length of pollen season, the total pollen counts and the number/height of the pollen peaks and allergen bioavailability.
6.4 Discussion and research gaps
Research gaps are present at all levels of interactions mentioned above.
6.4.1 Climate and pollen
• More data are available on the effect of climate variability/change on the variability of pollen than on the duration and intensity of the pollen season. Investigations have shown that warming will lead to an earlier start of the season, but will it also lead to a
prolongation of the season or changes in intensity? Possible effects can, for example be: a) an earlier start of the season, but with several smaller peaks; b) seasons are prolonged, but also divided into multiple sub-seasons with smaller peaks; and c) the temperature during winter influences the wakening up of trees leading to effects on the size of the peak of the pollen season (if trees wake up more slowly the peaks are less high). Thus, more information is needed on the effects of climate on the duration and intensity of the pollen season (for different types of pollen). It is also important to take into account socioeconomic changes in assessing future changes (e.g. impact of agricultural policy on plant species composition).
• Land use and land cover change influence vegetation patterns. Also, climate change can have an influence on vegetation patterns and, therefore, on pollen distribution (leading to “new” pollens in some areas).
• More collaboration is needed on pollen data collection. Geographical coverage of collection sites throughout Europe has to be improved (for example, in the Balkans, Baltic countries and Russian Federation). There is also need for information on airborne allergen concentrations and allergen content.
6.4.2 Climate and phenology
• There is a need of modelling dates of flowering, especially altered timing under climate change conditions.
• There is a need to understand more on the amount of pollen production under climate change conditions (especially higher CO2 conc.).
• This should be accompanied by experiments for model validation and pollen production, integrated by phenological observations and pollen data.
6.4.3 Pollen and allergies
• The pollen-allergy relationship is a multifactorial process. Climate variability is just one of the factors involved and there are many interactions with other factors like, for example, outdoor air pollution. Studies are limited on possible confounding factors. There are multiple interacting factors that affect allergic disorders.
• There is a clear association between weather/climate and pollen. Studies are limited on possible confounding factors, including the potential effects of CO2, soil moisture, temperature (particularly Tmin), humidity, etc. There needs to be an understanding of the consequences of changes in these variables on the pollen mix.
• There is a need to study links between pollen and pollen-allergen exposure to prevalence as well as severity of non-respiratory diseases (e.g. skin and cardiovascular diseases).
• There is a need to understand the effects of pollen on tissue-hyperreactivity.
• There is a need to further understand the effect of changes in pollen season variability and duration on food allergies (cross-reactivity).
• If climate change will lead to an earlier onset of the pollen season and/or prolongation of the pollen season how important will this be for the burden of disease and for the changes of visits of medical practitioners as well as drug sales.
• There is a need to develop and integrate methodologies on measuring allergens. Currently, different groups/countries use different methodologies. The number of groups is small (Finland, Germany, Italy, Spain, Sweden and United Kingdom) It is important to study the

EUR/03/5036791 page 23
pollen allergenic content and concentrations in outdoor air and analyse the factors causing fluctuation in the concentrations/content.
6.4.4 Long term climate change and allergic disorders
• There is a need for more studies on the relation between long term climatic conditions and disease prevalence and incidence. Thereby, it should be recognized that there is a difference between incidence and prevalence. Especially, the lack of knowledge on incidence is considered to be a gap.
• There are many differences in methodology used to study the climate-allergy relationship. It is considered to be difficult to improve the quality in these complex studies. Complex issues like climatological change make it very difficult to come up with good questions that can easily be addressed.
• There is a need for long-term studies on dose-response relationships, although it is recognized that performing such studies would be a huge effort; they would involve measurements, monitoring and analysis within several subpopulations in Europe and an extensive infrastructure to obtain existing and new data. It was also recommended to think about using existing cohort studies. Several are ongoing (some nationally but also internationally). They may provide opportunities to connect some of the studies for climate related analysis. We need to check the possibilities for collaboration.
• Models need to be developed to explore the future.
7. Session IV. Data availability, data quality and needs: Towards a better exploitation for the future
7.1 Climate, biometeorology and air pollution
Many scientists have long been studying asthma and respiratory allergies in relation to atmospheric pollen grains and fungal spores and aerobiological information. In theory, as pollen diffusion is seasonal, calendars should be sufficient, but in practice continuous climatic modifications require ongoing monitoring of the phenological phases of vegetation. In the field of “Phenology, pollen, and allergic disorders”, more efforts/studies are needed for example, to:
A) Explore the influences of climate change and phenology on plants
Data needed would include:
• Vegetation data: Characterization of vegetation as a pollen source (mapping, pollen production).
– Data are available in regional maps such as the CORINE LANDCOVER.
• Phenological data: flowering observations and pollen release timing. Data are available at local and regional observation sites, some of them are collected within EPN.
• Climatic and meteorological data: Meteorological parameters and Dispersion Models; data are available at Meteorological Services and in institutions carrying out atmospheric research.

B) Explore changes in prevalence of respiratory allergies and other disorders in
relation to changing climate
Data needs:
• Aerobiological data (analysis and forecast): Pollen and spore atmospheric concentration/ site/day. Data availability: National Networks, EAN/EPI.
• Air Pollution data (analysis and forecast): Data collected by measurements in field and/or by satellite on SO2, NO2, NOx, O3, PTS, PM10, PM2,5, CO, Benzene. Data availability: Regional Administrations, European Organizations.
• Medical, Clinical and Epidemiological data: some data are available through the National Health Services, WHO Europe, however data on hospital admissions and visits to general practitioners are more difficult to obtain.
C) Explore available preventive measures
D) Improve interdisciplinary collaboration between the following disciplines
• Climatology, Bioclimatolgy, Biometeorology, Atmospheric Physics and Meteorology, Phenology, Aerobiology and Allergology, Clinical Immunology and Epidemiology (see also Table 7.1).
Suggestions for the future are:
• Creation of an interdisciplinary task force of experts.
• Preparation of a project proposal for EU (i.e. 6 FP).
• Identification of the Organizations/Institutions that manage Networks/Databases necessary to the “project”.
• Activation of contacts with the Organizations/Institutions above mentioned.
• Evaluation of the data costs necessary to project.
• Creation of a standard form (parameters and procedures) to collect the medical data.
Table 7.1 The various disciplines advisable to be involved
Discipline Description
Climatology The study of general weather conditions.
Bioclimatology The study of the relationship between organisms and climate.
Biometeorology The study of the interactions between atmospheric processes and living organisms.
Atmospheric Physics and Meteorology The study of micro-weather and macro-weather phenomena.
Phenology The study of the timing of natural biological events.
Aerobiology The study of airborne biological particles such as bacteria, spores, pollen.
Palynology The branch of science concerned with the study of pollen, spores, and similar palynomorphs, living and fossil.
Allergology, Clinical Immunology A complex patient and disease oriented specialty.
Pneumology The study of diseases of the lungs and air passages.
Dermatology The science of the skin and its diseases.
EUR/03/5036791 page 25
Paediatrics Science relating the care of children and the treatment of their diseases.
General medicine Study/science of the maintenance of health, and the prevention and treatment of diseases and illness.
Epidemiology The study of the distribution and determinants of diseases in human populations.
7.2 Phenology
The EPN is a thematic network funded within the European Union’s Fifth Framework Programme for a period of three years, from January 2001 to October 2003 (EVK2–2000–20005) (http://www.dow.wau.nl/msa/epn/). In Europe, there are many professionals and volunteers involved in phenological monitoring and research. There are also many long-term data sets, which provide important information on the relation between climate and natural systems. However, the efficiency of monitoring and use of phenological assessment in prediction of climate induced ecological changes and their effects in Europe is surprisingly low. Some reasons for this are:
• There is no or only limited cooperation and communication between the existing regional and national phenological monitoring networks in Europe.
• There is a lack of access to and integration of data. This is partly caused by the lack of information on what datasets are available, the definitions and techniques used and the quality of the data.
• There is an inefficient use and exchange of existing knowledge within and between the different scientific disciplines on tools and techniques already available for monitoring, data storage and data analysis.
• There is not enough insight in, and awareness of the potential application possibilities of phenological data.
These problems formed the basis for submitting a proposal for a European Phenology Network (EPN). The EPN project was accepted by the European Union’s Fifth Framework Programme in 2000 and is funded for a period of three years, from January 2001 to October 2003 (EVK2–2000–00714) (http://www.dow.wau.nl/msa/epn/).
EPN aims to “improve monitoring, assessment and prediction of climate induced phenological changes and their effects in Europe”. EPN involves thirteen partners from seven countries1. Its overall objective is to increase the efficiency, added value and use of phenological monitoring and research, and to promote the practical use of phenological data in European Member States in assessing the impact of global (climate) change and possible adaptation measures. More specific objectives of the Phenological Thematic Network are: 1 Environmental Systems Analysis Group, Wageningen University, the Netherlands (coordinator); German Weather Service, Germany, SME-Milieuadviseurs (GLOBE-the Netherlands), the Netherlands; Department Data and Computation, Potsdam Institute for Climate Impact Research, Germany; Institute of Geography, University of Berne, Switzerland, Lehrstuhl fuer Bioklimatologie, Technical University Munich, Germany; Institute for Environment and Sustainability, Unit – Land Management, JRC, Italy; Centre for Geoinformation, Wageningen University, the Netherlands; International Centre for Integrative Studies, the Netherlands; World Health Organization, Italy; Department of Agricultural Sciences, Royal Veterinary and Agricultural University, Denmark; Centre for Ecology and Hydrology Monks Wood, United Kingdom, International Centre for Environmental Assessment, Foundation for Sustainable Development, the Netherlands.

• to demonstrate the wide variety of possible applications of phenological research and its
benefits for ecology, agriculture and society (human health + education) and realizing a stronger involvement of the end-users;
• to facilitate integration and cooperation between existing phenological monitoring networks and to actively stimulate expansion of existing and creation of new monitoring networks;
• to improve the integration of, and access to phenological data in Europe in a systematic, structural and user friendly way; and
• to exchange knowledge between phenologists of different scientific disciplines (ecology, agriculture, human health) on tools and techniques used for phenological monitoring, database development, (statistical) data analysis, model development and impact assessment.
To realize these objectives, and a cost-efficient, productive, and long lasting network, the EPN project, includes the following activities:
• coordinates the integration, cooperation, and further expansion of phenological networks in Europe (including: network management, clarifying definitions used, establishing links with educational programmes, non-European networks, international organizations and potential funding organizations);
• establishes an online phenological meta-database and a phenological bibliographical database;
• organizes two European conferences on phenology involving data providers, scientists, (inter)national nongovernmental organizations, commercial enterprises, policy-makers and educational organizations; and
• organizes specialists workshops on specific topics (i.e. modelling, use of earth observation data, phenology and human health (this workshop), phenology and agriculture, bird migration and communication, dissemination and capacity building).
Data availability
In Europe, many phenological monitoring networks exist. Many of these networks also monitor the timing of flowering of a large number of plants. However, because of a number of reasons, the data is often difficult to use/access. Many things are unclear.
• Who is the owner of the data?
• What is the quality of the data?
• What information carrier is used (paper, computer)?
• What is the level of standardization?
• What species are included in the programme?
• During what time period were the observations made?
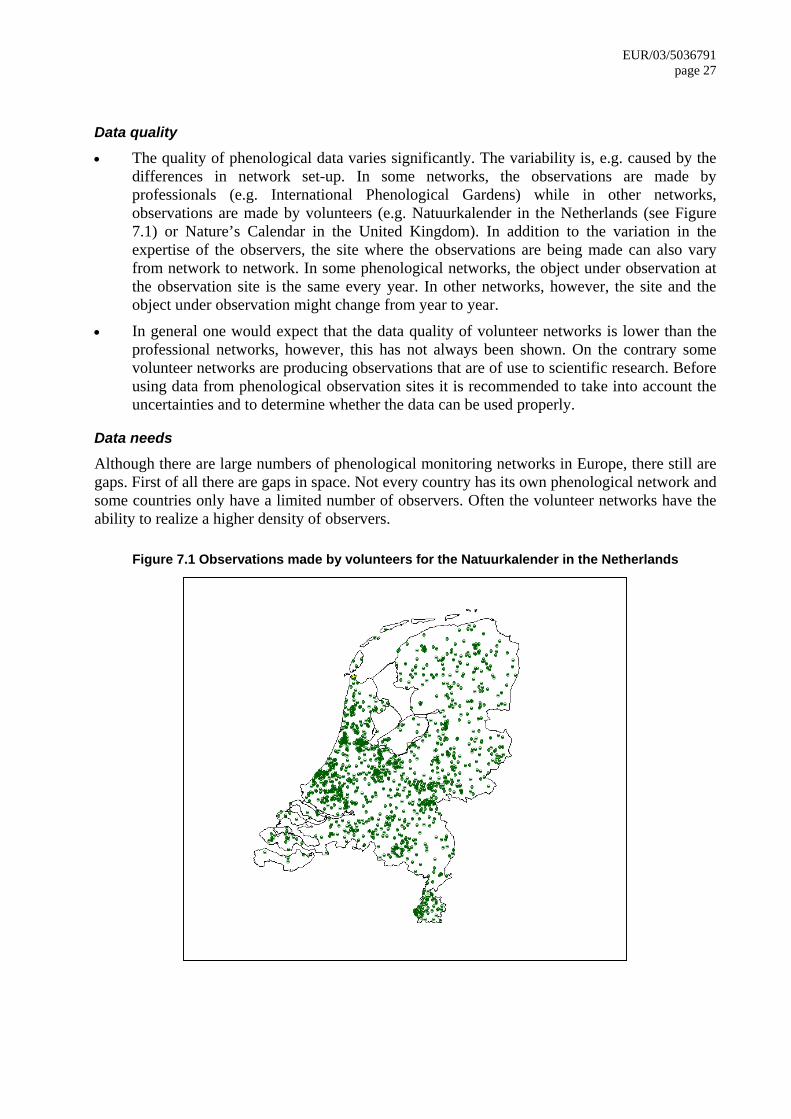
EUR/03/5036791 page 27
Data quality
• The quality of phenological data varies significantly. The variability is, e.g. caused by the differences in network set-up. In some networks, the observations are made by professionals (e.g. International Phenological Gardens) while in other networks, observations are made by volunteers (e.g. Natuurkalender in the Netherlands (see Figure 7.1) or Nature’s Calendar in the United Kingdom). In addition to the variation in the expertise of the observers, the site where the observations are being made can also vary from network to network. In some phenological networks, the object under observation at the observation site is the same every year. In other networks, however, the site and the object under observation might change from year to year.
• In general one would expect that the data quality of volunteer networks is lower than the professional networks, however, this has not always been shown. On the contrary some volunteer networks are producing observations that are of use to scientific research. Before using data from phenological observation sites it is recommended to take into account the uncertainties and to determine whether the data can be used properly.
Data needs
Although there are large numbers of phenological monitoring networks in Europe, there still are gaps. First of all there are gaps in space. Not every country has its own phenological network and some countries only have a limited number of observers. Often the volunteer networks have the ability to realize a higher density of observers.
Figure 7.1 Observations made by volunteers for the Natuurkalender in the Netherlands
Towards a better exploitation of data
In the context of the European Phenology Network, several activities are aimed at improving the exploitation of data.
• An overview will be made of the phenological networks that exist.
• A phenological meta-database will be made available online (http://www.dow.wau.nl/msa/epn/).
• A bibliographical database should give an overview of the research that has been carried out in the field of phenology in a large number of different applications.
• Furthermore, EPN tries to connect networks in an overall framework to improve the standardization and accessibility of data.
• Finally, EPN improves communication between the many actors.
All these activities have significantly improved the use of phenological data in the past years. It has become clear that phenological data have relevance for a large number of different applications. However, there is a clear need to continue to join forces, by continuing actively stimulating cooperation and communication between different thematic disciplines and different user groups (scientists, media, public, private sector, NGO’s, policy). To realize this, new projects are needed in which the many existing and new technologies are linked or in the future will become available.
7.3 Aerobiology
The European Aeroallergen Network (EAN) is a non-profit initiative that has carried out a European pollen database since 1988. This database contains daily values of pollen count per m3 (volumetric data) and monitors start, duration and peaks of pollen seasons. The project also produces, in collaboration with the European Pollen Information (EPI), pollen forecasts on the Internet (http://www.polleninfo.org). Data is sold to pharmaceutical companies for example but any income is immediately reinvested into the site. Participating national networks receive shares in EPI. Main issues with regard to data availability/quality are:
• Taxonomy problems: Not all countries use the same taxonomy.
• Problems with data transfer: Data transfer from the participating stations is expected once a week, but due to the fact that delivery of data is on a voluntary basis some data transfer can be very irregular and some stations deliver once a month or even once a year.
• Coverage problems: Some regions only have few data sites, for example, in the Balkans. Ireland and the Scandinavian countries have few data sites compared to other parts of Europe.
• Quality of data: Quality insurance and control is necessary and therefore standardization procedures exist with regard to, for example, data collection (large differences in pollen count can exist between collection points at, for example, nose level and roof level). Quality control is mandatory in some countries/regions (Germany, Spain, United Kingdom,) or even completely missing for other countries/organizations (Austria, Bulgaria, the Netherlands).
• The degree of education: International biennial basic courses in Aerobiology are held by an expert team in order to avoid fundamental mistakes of beginners.

EUR/03/5036791 page 29
There can be large differences in pollen count at nearby collection sites, but statistically different information on pollen count can be obtained every 150 kilometers (Comtois 1998).
7.4 Epidemiology
Few epidemiological studies have investigated the relation between climatic conditions and the occurrence and severity of asthma and allergies. Short term variations in meteorologic/climatic conditions have been associated with exacerbations of atopic diseases, e.g. increases in asthma admissions following thunderstorms (Celenza et al. 1996; Eberlein-Konig et al. 1996; Epton et al. 1997; Newson et al. 1997; Harju et al. 1998; Newson et al. 1998; and Tanaka et al. 1998). The association between long-term climatic conditions and the prevalence of atopic diseases has been investigated in several studies (Charpin et al. 1988; Charpin et al. 1991; Peat and Woolcock 1991; Larsson et al. 1993; Bjornsson et al. 1994; Allegra et al. 1995; Munir et al. 1995; Peat et al. 1995; Schultz Larsen et al. 1996; Hales 1998; Nicolai et al. 1998; Lau et al. 2000; McNally et al. 2000; Weiland et al. 2000; and Verlato et al. 2002), but few had the necessary number study centres. One national and two international multi-centre prevalence studies did show associations of mainly the prevalence of asthma with climatic factors, e.g. mean annual temperature and indoor relative humidity (Hales 1998; Weiland et al. 2000; and Verlato et al. 2002). However, these findings should be interpreted with caution due to the low number of studies, limitations in the study methods, particularly climate assessment, and partly conflicting results. In addition, these studies did involve objective measurements of atopic sensitization and lung function. Further research on the association between pollen-related allergic diseases and climate/weather variables, phenological events and/or pollen/allergen exposure should include:
• studies linking detailed and standardized prevalence and incidence data (e.g. data on allergen specific sensitization and changes in lung function, as well as on severity of disease) to climatic and phenological information;
• studies linking variations of weather and pollen to health outcomes, looking at exacerbation, severity and seasonality of diseases;
• contextual factors (potential effect modifiers and/or confounders) to be taken into account; and
• spatial and temporal (daily) availability of information. There are now good standardized and comparable prevalence data on symptoms and objective markers of allergic disease in children and adults available, which should be analysed in relation to climatic conditions (Burney et al. 1994; Asher et al. 1995; Strachan et al. 1997; Asher and Weiland 1998; ISAAC Steering Committee 1998b; ISAAC Steering Committee 1998a; and Williams et al. 1999). There are, however, problems with the availability, quality and comparability of time related data on allergic conditions. Many epidemiological studies on other diseases use mortality data, but the use of mortality data for asthma is not a good option, as well as mortality data on hay fever, as not many individuals die from these conditions. Asthma admission rates have been used, but these are only available in few countries. Hospital admission data on hay fever and eczema are only of very limited value in this context, because they reflect a highly selected and biased subgroup of the whole spectrum of disease.

A valuable option could be the use of data on doctor consultations, although also this is not without problems since not all patients go to the doctor and the data are often not easily acceptable. An alternative approach would be to study panels of affected patients prospectively using diaries of symptom occurrences. This approach is cost intensive but would allow some of the above-mentioned problems to be overcome. Finally, one could use data from allergy specific health care services and use or sales of allergy medication. It will be important to quantify the severity of the disease. Different standardized questionnaire based approaches have been developed to achieve this for asthma. A scoring system exists for atopic eczema but not for allergic rhino-conjunctivitis. Most studies have been performed with prevalence data. However, it is also very important to study the association between weather/climate/pollen and incidence rates of allergic diseases and sensitization, although incidence data are scarce. The development of allergic diseases is a multifactorial process, and it is largely unknown which proportion of the disease incidence is attributable to the different causal components. Another important research gap is the lack of information/studies on important confounders (contextual factors) of the climate/pollen-allergy association. Additionally, most studies use measurements on pollen, but it would also be very interesting to use allergen bioavailability. Only a few groups in Europe are measuring allergens outdoors, which is very expensive and time consuming. Collaboration between these European groups would be desirable in order to provide (comparable) exposure data for epidemiological research. Also, epidemiologists need to cooperate closer with meteorologist and climatologists, who are often dealing with similar issues. For example, the importance of changes in weather patterns under several climate change scenarios for allergies or the use of existing weather forecasts systems (e.g. El Nino in the United States).
7.5 EEA Climate Impact Indicators Project/The Topic Centres of the EEA
The European Topic Centres (ETCs) of the European Environment Agency (EEA) are international consortia brought together to assist the EEA in its work of collecting, analysing, evaluating and synthesizing information on topics relevant to the environment. Presently ETCs exist for the following topics:
• Water (ETC/WTR)
• Waste (ETC/W)
• Terrestrial Environment, (ETC/TE)
• Nature Protection and Biodiversity (ETC/NPB)
• Air and Climate Change (ETC/ACC). The European Topic Centre on Air and Climate Change (ETC/ACC) was established in 2001. The ETC/ACC is structured in the subgroups on Air-Quality (RIVM; Bilthoven, Netherlands), Air Emission (UBA-V; Vienna, Austria) and Climate Change (UBA-B; Berlin, Germany). In the subgroup on climate change a project deals with climate change state and impact indicators, having the goal to identify indicators in nine different categories (climate and atmosphere, cryosphere, soils and resources, agriculture and forestry, ecosystems and biodiversity, hydrology and water resources, marine environment and coastal zones, economy and infrastructure and

EUR/03/5036791 page 31
human health) which describe already ongoing climate changes and their impacts in Europe (Ehrhard et al. 2002). In the category on climate change impacts on human health the following indicators have been proposed:
• Seasonality of Hay Fever
• Vector Distribution
• Distribution of Vector-Borne Diseases
• Catastrophic Weather Related Events
• Death Attributable to Heat
• Seasonal Peak of Food/Waterborne Diseases.
7.6 The WMO CLIPS project
In recent years, major advances have been made in the monitoring and analysis of climate information and the ability to exchange it rapidly and efficiently. Promising scientific results have been obtained concerning the prediction of climate on time scales from seasonal to interannual. To ensure that comprehensive information on present and future climate and its variations will be delivered to users on a timely basis and in a suitable format, the World Meteorological Organization (WMO) has developed a project called Climate Information and Prediction Services (CLIPS). The project fosters international cooperation to enable all countries to develop climate services derived from recent scientific and technological advances in both analysis of the past and contemporary climate and future climate prediction. CLIPS is an implementing project of WCASP, the World Climate Applications and Services Programme, itself part of the World Climate Programme (WCP). One of the main objectives of the CLIPS Project is to improve the capacity of the National Meteorological and Hydrological Services (NMHSs) to take advantage of the new advances in the science of climate so that they can process and deliver the climate information, and finally distribute it to all the user community thus improving the climate services. At the same time, CLIPS needs to build on a developing capability to predict climate on monthly, seasonal and interannual time scales (World Meteorological Organization 1995; World Meteorological Organization 1997). In close collaboration with the users in both public and private sectors, CLIPS focuses its efforts in enhancing traditional climate service thus resulting to decision-making process, which will be proactive in nature, and will promote sustainability in various socioeconomic activities. The project aims at establishing a mechanism for providing the best possible climate information, including climate prediction products, improvement of the economic and social decisions, thus reducing risks and improving economic vitality as well as the quality of life. The main objectives of the CLIPS Project are:
• to develop the infrastructure for Seasonal to Interannual Prediction (SIP);
• to develop the concept of Regional Climate Centres (RCCs);
• to demonstrate the value and eventual socioeconomic benefits of climate information and prediction services;

• to provide an international framework to enhance and promote climate information and
prediction; and
• to contribute in the capacity building of experts.
CLIPS helps in the capacity development of NMHSs in the areas of climate information and its application. The project has continued to work closely with other WMO Programmes, Meteorological Regional Institutions, International Climate Institutions, and with programmes and projects of other international organizations like World Health Organization (WHO), United Nations Environment Programme (UNEP), Food and Agriculture Organization (FAO), etc. Climate monitoring, prediction and timely early warning of extreme climate events which likely to affect the health sector in Europe are the best strategies for mitigation of the negative impacts of such events. Many institutions/organizations are currently involved in the development, production and delivery of climate services, and these products are being used to mitigate those adverse impacts on various sectors such as water resources, energy, health and all other socioeconomic sectors. In this respect the interaction of the activities of these sectors with those of the WMO Working Group on Climate matters for the European region is highly recommended.
8. Session V. Pollen forecasting
8.1 Pollen forecasting
Pollen forecasts can be used by, for example, physicians (allergists), health professionals, allergic people, pharmaceutical industry, scientists and authorities (health, environment) and for a wide variety of purposes for example, prevention, preventive medication, management of therapy (e.g. pre-seasonal hyposensitization), planning of holidays or travels, planning of medicine production and distribution and start of short term forecast models. There are numerous networks in Europe measuring pollen concentration and there is a well-established cooperation between allergologists and aerobiologists. Few examples of effectiveness of forecasts have been published; most are feedback from public and clients. Effectiveness of forecasts is also shown in, for example, successful timing of clinical trials based on forecasts. In addition, the growth of the forecast market provides evidence of demand and effectiveness. Currently, two main types of pollen forecasts are provided, long-range forecasts predict the main features of the pollen seasons including start dates, severity and duration. Secondly, medium range (five days ahead) and short-range (next day) forecasts are used to predict day-to-day variation once the seasons have started.
8.2 Experiences with pollen forecasting
Currently, aerobiology is being used as a tool to quantify pollen emission and the flowering intensity in anemophilous plants. Regarding long term forecasts, one of the most important features to be predicted is the pollen season start (Galán et al. 2001b; and García-Mozo et al. 2002). In woody plants, depending on the period of flowering, the accumulated heat unit or heat unit and photoperiod during prior

EUR/03/5036791 page 33
months are the most affecting parameters. Regarding grasses in the Mediterranean Region pollen season start depend overall on the rainfall (Frenguelli et al. 1991; Clot 1998: Mandrioli et al. 2000; Clot 2001; Galán et al. 2001c). Regarding short-term forecasts, it is important to consider the influence of the seasonal meteorological parameters. When a long series of pollen is available it is interesting to make a classification of the years. Depending of the class in which a year is included there is an associated potential allergenic risk. Most of the researchers use regression analysis to produce a forecast but currently other analysis are being used, such as neural network models (Sánchez-Mesa et al. 2002). However in these type of forecasts only meteorological parameters and pollen count of previous days have been taken into account. It is also important to include other variables such as phenological and topographical data and land use databases (Vázquez et al. 2002). Geostatistics allow us to compare different monitoring sites, and then select an appropriate both number and location of sampling points. Moreover, this tool permits us to know in a global idea information from those sites without aerobiology information by considering the records of the neighbour sampling point. A European project, ASTHMA, has developed an automatic system for pollen forecast in four pilot sites in the Mediterranean Region: Bologna (Italy), Nice (France), Barcelona and Córdoba (Spain). The forecast system includes one atmospheric physics module, the meteorological module, and three biological models applied to other computational modules, the blossoming, the emission and the dispersion models (www.enviport.com).
8.3 Forecasting the features of pollen seasons in the scenario of climate change
The National Pollen Research Unit has been forecasting pollen seasons for over a decade. Forecasts are provided on a regional basis (typically the United Kingdom as 12 bioclimatic regions) and for various timescales. Two main types of forecasts are provided – long-range forecasts predict the main features of the pollen seasons including start dates, severity and duration. These features are forecast up to three months in advance but the accuracy of the forecasts increases notably with shorter lead times, for example, of one month. Secondly, medium range (five days ahead) and short-range (next day) forecasts are used to predict day-to-day variation once the seasons have started. In both cases the main techniques used in forecasting are based on regression of empirical pollen data sets against weather variables, and local vegetation information (Emberlin et al. 1999; and Adams-Groom et al. 2002). The long-range forecasts are sold to pharmaceutical companies and health care providers to facilitate stock flow and marketing. The medium and short-range forecasts are issued to the public via media outlets, web sites, mobile phones, e-mail etc. The scenario of using the past to predict the future is typical of most environmental forecasting as the theoretical basis is poorly developed. Even the latest techniques of neural networks rely on the past experience. However, in the scenario of changing climates these approaches encounter problems. In recent years, the weather has been extreme in many parts of Europe including the United Kingdom. Conditions have been outside the range of experience with the resulting of a lack of analogues. These extremes have been accompanied by increased variability, which have accentuated the difficulties of forecasting. In addition, evidence indicates that changing environments may lead to changing allergenicity in some pollen types due to stress from, e.g. pollution and temperatures.

Most pollen forecast models are site/region specific due the unique combinations of local conditions. Given this scenario it is not realistic to draw comparisons from other regions. However, it is important to maintain and improve the accuracy of pollen forecasts both for public and commercial reasons. In order to achieve this, more research is needed on the variation of pollen seasons in changing climates.
8.4 The SPRING project
“The SPRING project (Galan et al. 2002) defined an integrated pollen service for European countries by developing targets including defining the procedures for information provision and measuring methods and by normalizing the pollen information content”. The Spring Consortium successfully identified the different categories of pollen information users including personal users, and professional users such as healthcare professionals, pharmaceutical companies, scientists, mass media, environment protection agencies and the public sectors, and the project also defined pollen scenarios where the service will provide information. Standard procedures with normalized content were defined. These aimed to give pollen categories/thresholds to be applied, multilingual information and comprehensible language, quick and easy access at any scenario and flexible consulting hours with a personalized service. The forecasts are based on national regions with bioclimatic and biogeographical parameters. Forecasts were compiled at the national level then sent via Internet to the SPRING service centre in Seville. From here the forecasts are displayed on the web site and disseminated to the end users (e.g. by e-mail, WAP and mobile phone). During 2002 the service was validated and tested. This project has achieved its aims and has for the first time produced multilingual standardized and frequently updated pollen forecasts that are accessible and user friendly. The study group recommended that these forecasts should be developed further to include more countries and used by the European Pollen Information Service to provide enhanced services.
8.5 The future of pollen forecasting
Several types of pollen forecasts are produced, e.g. onset and abundance of the pollen season for the long term (weeks), or daily pollen concentration in the short term (one to three days). Daily pollen forecasts have been up to now based on statistical analysis of long data sets (more than 20 years when available). The use of dispersion models coupled with weather forecast models for daily pollen forecasts is desirable, in particular in a context of changing climate, but some data required by these models are not commonly available, e.g. pollen production abundance, mapping and timing. The FP5 project ASTHMA (www.enviport.com) has shown the usefulness and also the difficulties of such models. In order to design the best forecast systems for the future, several questions have to be answered and the goals and time frames defined, also in the perspective of a long term evolving process, so that the research and implementation efforts will be as efficient as possible and land on target:
• What to forecast? Pollen and spores, allergens, allergic risk (including e.g. the effect of pollution).
• Which kind of information? Presence/absence, class of risk (problem to define the thresholds) and concentration.
• For whom? Physicians, allergists, health professionals, public, pharmaceutical industry, scientists and authorities.

EUR/03/5036791 page 35
• For what? Prevention, adaptation of medication, behaviour and planning, increased public awareness.
• How? Through mass media, Internet, telephone, fax and mobile phone.
• At what scale (European, national, regional, local) and what time scale (week, day, hour)?
• What is available? Previous data, models, measurement networks, weather data and forecasts and information distribution channels.
• What is needed? Integration of botanical, phenological, meteorological, aerobiological and epidemiological data. Better information on distribution of pollen sources, timing and abundance of pollen release. Real time data availability. Climate change needs to be included into the model. More collaboration and resources for research and integration at European level.
With regard to climate change the following questions arise:
• Will the vegetation change?
• Will the amount of pollen change?
• Will the timing of pollen release change?
• Will models still be useful? Pollen forecasting of the future does not depend on research with uncertain outcome, but on international and interdisciplinary collaboration and building on the foundation of knowledge that already exists.
8.6 Pollen forecast and the role of phenological networks
During the workshop on human health and several previous workshops that were organized in the context of the European Phenology Network, it became clear that there is a need for a follow up of EPN after it ends in October 2003. The timing of life-cycle events plays an important role in many environmental and socioeconomic disciplines but to in order to go beyond the current state of the art, some developments have to take place. This presentation discussed a possible way forward in the context of the Sixth Framework Programme of the European Commission. First an overview was given of the things that the EPN network would like to realize in the future. The objectives are to:
• monitor the variability and trends in ecological, environmental, and socioeconomic variables and how they interact with (changes in) weather in a standardized way;
• set up infrastructures that facilitate the storage, linkage, access and analysis of data;
• forecast future changes based on different environmental and socioeconomic variables; and
• visualize and communicate the past, current and potential future states and impacts at different locations at different scales.
In order to achieve this, we need an overall framework, e.g. such as the one that is presented in the Figure 8.1. To realize this, a lot of information is needed. It is, however, becoming clear that most of the required information is already available:
• weather data
• weather forecasts (short and long-term)
• phenological data
• phenological models
• crop growth models
• digital elevation maps
• tools for statistical analysis
• soil maps
• land cover/land use maps (including location infrastructure)
• species distribution maps
• socioeconomic data (population density, income levels, etc.)
• communication facilities (internet)
• database facilities
• geographic information systems
• remote sensing data. It is only possible to make use of the data if we realize:
• cooperation between users groups
• communication between user groups
• linkages between existing databases.
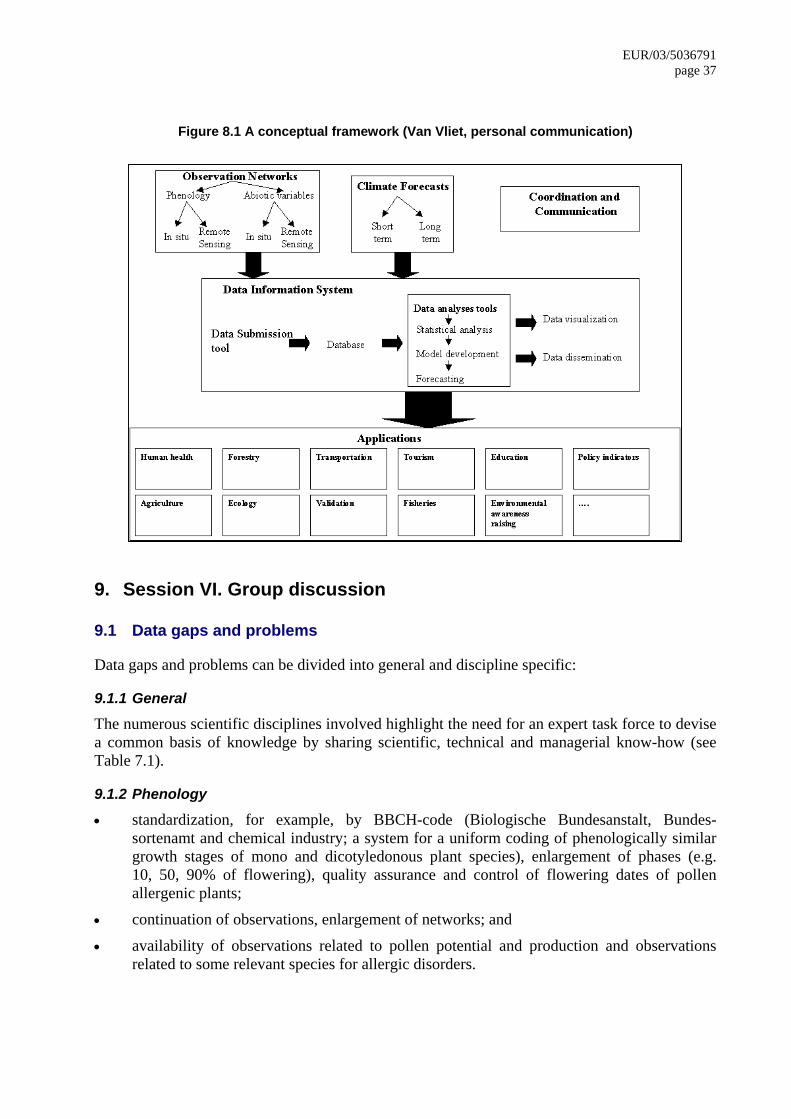
EUR/03/5036791 page 37
Figure 8.1 A conceptual framework (Van Vliet, personal communication)
9. Session VI. Group discussion
9.1 Data gaps and problems
Data gaps and problems can be divided into general and discipline specific:
9.1.1 General
The numerous scientific disciplines involved highlight the need for an expert task force to devise a common basis of knowledge by sharing scientific, technical and managerial know-how (see Table 7.1).
9.1.2 Phenology
• standardization, for example, by BBCH-code (Biologische Bundesanstalt, Bundes-sortenamt and chemical industry; a system for a uniform coding of phenologically similar growth stages of mono and dicotyledonous plant species), enlargement of phases (e.g. 10, 50, 90% of flowering), quality assurance and control of flowering dates of pollen allergenic plants;
• continuation of observations, enlargement of networks; and
• availability of observations related to pollen potential and production and observations related to some relevant species for allergic disorders.

9.1.3 Pollen network (Aerobiology)
• The European Pollen Information Network monitoring is based on standardized collection methods and location of sites even though the density of the network varies across Europe.
• Recommended 150 km grid points should give statistically significant different information.
• Some regions do not have adequate coverage (e.g. eastern Europe, Greece).
• Taxonomic problems (differences occur in the level of taxonomic evaluation of pollen between countries).
• Frequency of data transfer
• Continuation of data flow.
• Time and spatial resolution.
• Quality assurance and control (Measures differ across Europe from full quality assurance to none).
• Need for a site directory (geographical coordinates, elevation above sea level/above ground, characteristics of the surrounding vegetation, urban/rural environment, etc.).
• Integration of phenology data.
• Data on moulds and spores, so far minimum of data available in the EAN database.
9.1.4 Epidemiology
• There is a need for studies linking detailed and standardized prevalence and incidence data (e.g. data on allergen specific sensitization and changes in lung function, as well as on severity of disease) to climatoligical/meteorological and phenological information.
• There is a need for studies linking variations of weather and pollen to health outcomes looking at exacerbation, severity and seasonality of diseases
• Contextual factors (potential effect modifiers and/or confounders) should be taken into account.
• Spatial and temporal (daily) availability of information.
9.1.5 Climatological and meteorological data
• There is a need to answer the question: Which meteorological, climatological or bioclimatological indices should be used?
• How to adjust the forecasting models for climate change?
9.1.6 Allergology and Clinical Immunology
• Case definition, better definition of phenotypes etc.;
• Purification and standardization of pollen and mould allergens for diagnosis and treatment;
• Additional studies on sensitivity rates against individual pollen species and moulds;
• Mechanism of immune response to pollen allergens and genetic and environmental factors influencing it;
• Crossreactivity;
• Studies of mechanisms involved in interactions between pollens and mucosal surfaces; and

EUR/03/5036791 page 39
• It is necessary to evaluate the impact of individual pollen taxa in subjects with seasonal allergic rhinitis on the development of bronchial hyperreactivity and/or asthma symptoms, see for example, the WHO initiative “Allergic Rhinitis and its Impact on Asthma” (ARIA) (Bousquet et al. 2001).
9.1.7 Indicators of climate change
• Phenological and aerobiological data, such as changes in flowering and in the pollen season onset, intensity and duration, can be used to derive indicators of climate change; and
• At present, there are few useful indicators based on health outcomes (e.g. reported consultations for allergic rhinitis) due to lack of long term health data series, and lack of routine surveillance of symptoms of allergic disorders.
9.2 Forecasting
9.2.1 General
• Various experiences of pollen forecasting are available in some countries, including Austria, Belgium, Czech Republic, Denmark, Finland, France, Germany, Hungary, Italy, the Netherlands, Spain, Sweden, Switzerland and the United Kingdom.
• Forecasts are made at various time scales: the next day, a week ahead, a month ahead and/or seasonal level.
• Most of the forecasts exist for grass pollen and for the main airborne allergenic types at a sub-regional level, e.g. olive and Cupressaceae in Mediterranean countries, pellitory on coastal areas in south Europe, birch in central and northern Europe, ragweed in eastern/central Europe or birch, oak, and weeds (mostly nettles) in the United Kingdom.
• More research is needed on several pollen types and cross reactivity.
• Forecasts include start of season, season severity, trend and time of peak, duration, and day-to-day variation.
9.2.2 Requirements
• Most forecast models are based on empirical datasets, these should be at least of 15 years duration.
• Accurate forecasting requires the most up to date data (reliable, continuous, quality checked, standardized), including phenological observations of flowering, pollen counts, weather variables, vegetation and land-use
• The target audience:
– For whom? Forecasts have been developed for public, medical and commercial users.
• How is it delivered?
– There are different developments in different countries; the example of the approach uniformity in the SPRING EC project was described.
– In many cases media announcements, and/or mobile phones (SMS), e-mail, and websites are the information media.

9.2.3 Problems
• The climate scenarios need to be integrated into the pollen forecasting models, as the current weather is out of norm.
• There is a need to better integrate the different components within the flow of the forecast system.
• Spatial and temporal.
• Still most of models based on linear regression techniques but it might become appropriate after phenological input to develop other models (e.g. dispersion models). More data concerning abundance and timing of pollen production per surface unit are needed.
• Financial support.
• How should the models be adjusted with the changing climate?
• There is a gap of other aerobiological data (e.g. fungal spores) and gap of forecasting them.
• Lack of measurements of allergen quality and quantity therefore no forecast.
• The research design of several studies (e.g. enhancing causal inferences in observational studies, plannification of measurements).
9.3 Recommendations
1. There is growing evidence that climate change might facilitate the geographical spread of particular plant species to new areas, which become climatically suitable. Warming is likely to further cause an earlier onset and may extend the duration of flowering and pollen season, for some species (e.g. grasses, weeds). Although, the effect of the expected rate of warming (0.5°C per decade) could be less pronounced than effects of land use change, sociocultural changes as well as international transport, we still observe that on average the length of the growing season in Europe increased by ten to eleven days during the last thirty years. Many studies show that the start of flowering is advancing with species – specific differences (annual more than perennial species, insect pollinators advancing more than wind pollinators). There is a strong seasonal pattern of change. An earlier start and peak of the pollen season is more pronounced in species that start flowering earlier in the year. Duration of the season is extended in some summer and late flowering species. Due to the earlier onset of pollen seasons, the seasons are more often interrupted by adverse weather conditions in late winter/early spring. There is a need to understand in European countries whether this will have implications for changes in demand for health care provisions.
2. The sensitization rates to pollen allergens have increased in many areas in Europe, as well as there is the hypothesis that the incidence of pollen related allergic diseases might increase in Europe in the next ten years, due to increased background sensitization rates. There is a need to monitor trends during the next ten years.
3. There is a need to understand, the relationship between the allergen content of pollen the length of pollen season, the total pollen counts and the number/height of the pollen peaks and sensitization rates.
4. There is a need to understand how differences between the environment of airborne particle samplers and individual's environmental exposure affect the interpretation of pollen and mold counts.

EUR/03/5036791 page 41
5. Pollens are not only allergen carriers but also might release proinflammatory substances. The allergen content within pollen grains of the same taxon can vary for a number of reasons. There is a need to further understand the physiopathological mechanisms.
6. Some invasive species present particular risks for health, and require measures of land use, maintenance of public areas, or eradication, e.g. ragweed, as well as better public information.
7. It is important to note that increased snowfall (due to increasing precipitation) takes a longer time to melt and may cause later onset of flowering in northern latitudes.
8. The impact of climate change on the incidence, prevalence, distribution and severity of allergic disorders is uncertain.
9. The numerous scientific disciplines involved highlight the need for an expert task force to devise a common basis of knowledge by sharing scientific, technical and managerial know-how. Experts from climatology, bioclimatology, biometeorology, atmospheric physics and meteorology, phenology, aerobiology, palynology, allergology and clinical immunology, pneumology, dermatology, paediatrics, general medicine and epidemiology should compose this task force.
10. Various experiences of pollen forecasting are available in some countries. Forecasts include start of season, season severity, trend and time of peak, duration, and day-to-day variation. Discussions are ongoing on how to adjust the models to the changing climate. Allergen quality is not measured and therefore not forecasted.
11. There is a need for further studies and international collaboration on the standardization of monitoring and analysis of pollen related phenological events; on pollen bioavailability and pollen measurements (e.g. standardization of measurement); and on climatology and forecasting.
12. Several future research projects were discussed. This included an application for the sixth Framework Programme as a continuation of: a) the EPN, as discussed under item 8.5; and b) a proposal to form a network of excellence on asthma and allergies (FP6; BT42).
10. References
1. Aas K, Aberg N, Bachert C, Bergmann K, Bergmann R, Bonini S, Bousquet J, de Weck A, Farkas I, Hejdenberg K (1997) European Allergy White Paper: Allergic Diseases as a Public Health Problem. The UCB Institute of Allergy, Brussels, Belgium.
2. Aberg N, Sundell J, Eriksson B, Hesselmar B, Aberg B (1996) Prevalence of allergic diseases in schoolchildren in relation to family history, upper respiratory infections, and residential characteristics. Allergy 51: 232–237.
3. Adams-Groom B, Emberlin J, Corden J, Millington W, Mullins J (2002) Predicting the start of the Birch Pollen Season at London, Derby and Cardiff, United Kingdom, using a Multiple Regression Model, based on data from 1987 to 1997. Aerobiologia 18: 117–123.
4. Allegra L, Cogo A, Legnani D, Diano P, Fasano V, Negretto G (1995) High-altitude exposure reduces bronchial responsiveness to hypoosmolar aerosol in lowland asthmatics. Eur Respir J 8: 1842–1846.
5. Alm J, Swartz J, Lilja G, Scheynius A, Pershagen G (1999) Atopy in children of families with an anthroposophic lifestyle. Lancet 353: 1485–1488.

6. Asher M, Keil U, Anderson H, Beasley R, Crane J, Martinez F, Mitchell E, Pearce N,
Sibbald B, Steward A, Strachan D, Weiland S, Williams H (1995) International Study of Asthma and Allergies in Childhood-ISAAC: rationale and methods. Eur Respir J 8: 483–491.
7. Asher M, Weiland S (1998) The International Study of Asthma and Allergies in Childhood (ISAAC). Clin Exp Allergy 28: 52–66.
8. Behrendt H, Becker W (2001) Localization, release and bioavailability of pollen allergens: the influence of environmental factors. Curr Opin Immunol 13: 709–715.
9. Behrendt H, Friedrichs K, Krämer U, Hitzfeld B, Becker W, Ring J (1995) The role of indoor and outdoor air pollution on allergic diseases. In: Johansson J (ed) Progress in Allergy and Clinical Immunology. Hoegrefe & Huber, Seattle, pp 83–89.
10. Behrendt H, Frierichs K, Kainka-Stänicke E, Darsow U, Becker W, Tomingas R (1991) Allergens and pollutants in the air - a complex interaction. In: Ring J, Prybilla B (eds) New Trends in Allergy III, pp 467–478.
11. Behrendt H, Tomczok J, Sliwa-Tomczok W, Kasche A, Ebner von Eschenbach C, Becker W, Ring J (1999) Timothy grass (Phleum pratense L.) pollen as allergen carriers and initiators of an allergic response. Int Arch Allergy Immunol 118: 414–418.
12. Bieber T, De la Salle H, Wollenberg A, Hakimi J, Chizzonite R, Ring J, Hanau D, De la Salle C (1992) Human Langerhans cells express the high affinity receptor for immunoglobulin E (FcERI). J Exp med 175: 1285–1290.
13. Bjornsson E, Plaschke P, Norrman E, Janson C, Lundback B, Rosenhall A, Lindholm N, Rosenhall L, Berglund E, Boman G (1994) Symptoms related to asthma and chronic bronchitis in three areas of Sweden. Eur Respir J 7: 2146–2153.
14. Blackley C (1959) Experimental researches on the causes and nature of Catarrhus aestivus (hay fever or hay-asthma). Dawson's of Pall Mall (originally publication: London: Balliere, Tindall & Cox; 1873), London.
15. Bousquet J, Van Cauwenberge P, Khaltaev N (2001) Allergic rhinitis and its impact on asthma. J Allergy Clin Immunol 108: S147–334.
16. Braun-Fahrlander C, Riedler J, Herz U, Eder W, Waser M, Grize L, Maisch S, Carr D, Gerlach F, Bufe A, Lauener R, Schierl R, Renz H, Nowak D, Mutius von E (2002) Environmental exposure to endotoxin and its relation to asthma in school-age children. N Engl J Med. 347: 869–877.
17. Brunekreef B, Hoek G, Fisher P, Spieksma F (2000) Relation between airborne pollen concentrations and daily cardiovascular and respiratory-disease mortality. Lancet 355: 1517–1519.
18. Burney P, Luczynska C, Chinn S, Jarvis D (1994) The European Community Respiratory Health Survey. Eur Respir J 7: 954–960.
19. Cariñanos C, Galán C, et al. (2000) Allergenic pollen in the subdesert areas of the Iberian Peninsula. Invest. Allergol. Clin. Immunol. 10: 242–247.
20. Celenza A, Fothergill J, Kupek E, Shaw R (1996) Thunderstorm associated asthma: a detailed analysis of environmental factors. BMJ 312 :604–607.
21. Charpin D, Birnbaum J, Haddi E (1991) Altitude and allergy to house dustmites: a paradigm of the influence of environmental exposure on allergic sensitization. Am Rev Respir Dis 143: 983–986.

EUR/03/5036791 page 43
22. Charpin D, Kleisbauer J, Lanteaume A (1988) Asthma and allergy to house dust mites in populations living in high altitudes. 93:756–761.
23. Clot B (2001). Airborne birch pollen in Neuchâtel (Switzerland): onset, peak and daily patterns. Aerobiologia 17: 25–29.
24. Clot B (1998). Forecast of the Poaceae pollination in Zurich and Basle (Switzerland). Aerobiologia 14: 267–268.
25. Clot B, Gehrig R, Peeters Ag, Schneiter D, Tercier P, Thibaudon M. Ambrosia pollen in Switzerland: local production or transport? European Annals of Allergy and Clinical Immunology 34: 126–128 (2002).
26. Comtois P (1998) Time and Space Determinants in Aerobiology. International Conference on Aerobiology, Perugia conference proceedings
27. Corsico R, Falagiani P, Ariano R, Berra D, Biale C, Bonifazi F, Campi P, Feliziani V, Frenguelli G, Galimberti M, Gallesio M, Liccardi G, Loreti A, Marcer G, Marcucci F, Meriggi A, Minelli
28. M, Nardelli R, Nardi G, Negrini C, Papa G, Piu G, Pozzan M, D’Ambrosio F, Riva G (2000) An epidemiological survey on the allergological importance of some emerging pollens in Italy. J Investig Allergol Clin Immunol. 10: 155–161.
29. D’Amato G, Spieksma F, Liccardi G, Jaeger S, Russo M, Kontou-Fili K, Nikkels H, Wutrich B, Bonini S (1998) Pollen related Allergy in Europe. Allergy 53:567–578.
30. D’Amato M, Picardi A, Menna T, Di Somma C, Ariano R, di Pietro A, Charron D, Maggi E, Matricardi P, Plebani A, Poto S, Testa G, Sacerdoti G, Ruffilli A (1999) HLA-DRB1* and allergy to Parietaria: linkage and association analyzes. Human Immunol 60: 1250–1258.
31. Darsow U, Behrendt H, Ring J (1997) Gramineae pollen as trigger factors of atopic eczema – evaluation of diagnostic measures using the atopy patch test. Br J Dermatol 137: 201–207.
32. Defila C, Clot B. (2001). Phytophenological trends in Switzerland. Int. J. Biometeorol. 45: 203–207.
33. Diaz-Sanchez D, Penichet-Garcia M, Saxon A (2000) Diesel exhaust particles directly induce activated mast cells to degranulate and increase histamine levels and symptom severity. JACI 105: 1140–1146.
34. Eberlein-Konig B, Spiegl A, Przybilla B (1996) Change of skin roughness due to lowering air humidity in climate chamber. Acta Derm Venereol 76: 447–449.
35. Ehrhard M, Minnen van J, Voigt T (2002) Proposed Set of Climate Change State and Impact Indicators in Europe; EEA, Copenhagen.
36. Emberlin J, Detandt M, Gehrig R, Jaeger S, Nolard N, Rantio-Lehtimäki A (2002a) Responses in the start of Betula (birch) pollen seasons to recent changes in spring temperatures across Europe. Int J Biometeorol 46: 159–170.
37. Emberlin J, Detant M, Gehrig, Jaeger S, Nolard N, Rantio-Letimaki A (2002b) Responses in the start of the Betula (Birch) pollen seasons to recent changes in spring temperatures across Europe. International Journal of Biometeorology 46: 159-170.
38. Emberlin J, Mullins J, Corden J, Millington W, Brooke M, Savage M (1999) Regional
variations in grass pollen seasons in the UK. Long term trends and forecast models. Clinical and Experimental Allergy 29: 347–357.
39. Emberlin J, Mullins J, Corden J, Millington W, Brooke M, Savage M, Jones S (1996) Changes in the flowering times of Birch trees in England and Wales; a biotic response to global warming? In: Programme and the summaries of the European Symposium on Aerobiology, Santiago de Compostella, 11–13. Sept.
40. Emberlin J, Mullins J, Corden J, Millington W, Brooke M, Savage M, Jones S (1997) The trend to earlier Birch pollen seasons in the United Kingdom: A biotic response to changes in weather conditions? Grana 36: 29–33.
41. Epton M, Martin I, Graham P (1997) Climate and aeroallergen levels in asthma: a 12-month prospective study. Thorax 52: 528–534.
42. Erdei E, Bobvos J, Farkas I, Magyar D, Paldy A (2002) Patterns in aeroallergen abundance and their associations with short-term climate changes in Budapest (1992–2001). Epidemiology 13: S81.
43. Erdei E, Bobvos J, Farkas I, Magyar D, Páldy A (2001) Short-term effects of climate change and aeroallergen concentrations in Budapest, Hungary (1992–1998) Descriptive results using the database of the Hungarian Aerobiological Network. Epidemiology 12: S7.
44. Fitter A, Fitter R (2002) Rapid changes in flowering times in British plants. Science 296: 1689-1691.
45. Fleming D, Sunderland R, Cross K, Ross A (2001) Declining incidence of episodes of asthma: a study of trends in new episodes presenting to general practitioners in the period 1989–1998. Thorax 55 657–661.
46. Frenguelli G, Spieksma F, Bricchi E, Romano B, Mincigrucci G, Nikkels A, Dankaart W, Ferranti F (1991) The influence of air temperature on the strating dates of the pollen season of Alnus and Populus. Grana 30: 196–200.
47. Galán C, Cariñanos C, et al. (2001a) Model for forecasting Olea europaea L. airborne pollen in southwest Andalucía, Spain. International Journal of Biometeorology 45: 59–63.
48. Galán C, García-Mozo H, Cariñanos P, Alcázar P, Domínguez-Vilches E (2001b) The role of temperature in the onset of the Olea europaea L. pollen season in southwestern Spain. International Journal of Biometeorology 45: 8–12.
49. Galán C, Prieto J, Sánchez-Mesa J, Hidalgo P, Domínguez E (2001c) The Poaceae family: an aerobiological approach. Aerobiology 2001. Symposium of the Pan-American Aerobiology Association, Raleigh, north Caroline. 16–19 June 2001.
50. Galan G, Carinanos P, de Nuntius P, Emberlin J, Jaeger S, Jaeger C, Leon G, Mandrioli P, Massot O, Thibaudon M (2002) Spring Project: a tool to help prevent symptoms of pollen allergy at the European level. Seventh International Congress on Aerobiology, Canada August 5th–9th.
51. García-Mozo H, Galán C, Aira M, Belmonte J, Díaz de la Guardia C, Fernández D, Guitierrez F, Trigo M, Domínguez E (2002) Modelling start of oak pollen season in different climatic zones in Spain. Agricultural and Forest Meteorology 110: 247–257.
52. Haahtela T, Lindholm H, Björkstén F, et al. (1990) Prevalence of asthma in Finnish young men. BMJ 301: 266–268.

EUR/03/5036791 page 45
53. Hales Sea (1998) Prevalence of adult asthma symptoms in relation to climate in New Zealand. Environ Health Perspect 106: 607–10.
54. Harju T, Tuuponen T, Keistinen T, Kivela S (1998) Seasonal variations in hospital treatment periods and deaths among adult asthmatics. Eur Respir J 12: 1362–1365.
55. ISAAC Steering Committee (1998a) worldwide variations in prevalence of asthma symptoms: The International Study of Asthma and Allergies in Childhood (ISAAC). Eur Resp J 12: 315–335.
56. ISAAC Steering Committee (1998b) Worldwide variations in prevalence of symptoms of asthma, allergic rhinoconjunctivitis and atopic eczema: ISAAC. Lancet 351: 1225–32.
57. Ishizaki T, Koizumi K, Ikemori R, Ishiyama Y, Kushibiki E (1987) Studies of prevalence of Japanese cedar pollinosis among the residents in a densely cultivated area. Ann Allergy 58: 265–270.
58. Jaeger S (2001) Allergies in the 20th and 21st century: start, duration and intensity of the pollen season. International Conference, Wageningen, 5–7 December.
59. Jaeger S, Berger U (2000) Trends in Betula Pollen Counts versus RAST Positivity in a Viennese population 1984–1999. In. Abstract band 2nd ECA, Vienna.
60. Kainka-Stänicke E, Behrendt H, Friedrichs K, Tomigas R (1988) Morphological alterations of pollen and spores induced by airborne pollutants: observations form two differently polluted areas in west Germany. Allergy 43 (S7): 57.
61. Kainka-Stänicke E, Behrendt H, Friedrichs K, Tomingas R (1989) Surface alterations of pollen and spres by particulate air pollutants. J Hyg Environm Med 188: 516
62. Kay A (2001) Allergy and allergic diseases. First of two parts. N Engl J Med 344: 30–37.
63. Kihlström A, Gunnar L, Pershagen G, Hedlin G (2002) Exposure to birch pollen in infancy and development of atopic disease in childhood. J Allergy Clin Immunol 110: 78–84.
64. Knox R, Suphioglu C (1996) Pollen allergens: development and function. Sex Plant Reprod 9: 318–323.
65. Knox R, Suphiolglu C, Taylor P, Desai R, Watson H, Penga J (1997) Major grass pollen allergen Lol p 1 binds to diesel exhaust particles: implications of asthma and air pollution. Clin Exp Allergy 27: 246–251.
66. Korányi (2002) TBC and Pulmonological Disease Institute’s Yearbook of 2001: calendar year based on the epidemiological data of hospitals' pulmonological units. Korányi Press, Budapest, Hungary.
67. Krämer U, Koch T, Ranft U, Ring J, Behendt H (2000) Traffic-related air pollution is associated with atopy in children living in urban areas. Epidemiology 11: 64–70.
68. Larsson K, Ohlsen P, Larsson L, Malmberg P, Rydstrom P, Ulriksen K (1993) High prevalence of asthma in cross-country skiers. BMJ 307: 1326–1329.
69. Lau S, Illi S, Sommerfeld C, Niggemann B, Bergmann R, von Mutius E, Wahn U (2000) Early exposure to house-dust mite and cat allergens and development of childhood asthma: a cohort study. Lancet 356: 1392–1397.
70. Lieth H (1974) Phenology and seasonality modelling. Chapman and Hall, London.
71. Malone D, Lawson K, Smith D, Arrighi H, Battista C (1997) A cost of illness study of allergic rhinitis in the United States. J Allergy Clin Immunol 99: 22–27.

72. Mandrioli P, Galán C, Hidalgo P, De Nuntiis P, Arialtti A (2000) Criteria to forecast the
pollen season start. Annual Symposium of the Pan-American Aerobiology Association, Albany, 28–30 April.
73. Matricardi P, Bonini S (2000) High microbial turnover rate preventing atopy: a solution to inconsistencies impinging on the Hygiene hypothesis? Clin Exp Allergy 30: 1506–1510.
74. Matricardi P, Rosmini F, Panetta V, Ferrigno L, Bonini S (2002) Hay fever and asthma in relation to markers of infection in the United States. J Allergy Clin Immunol 110: 381–387.
75. McIntire J, Umetsu S, Akbari O, Potter M, Kuchroo V, Barsh G, Freeman G, Umetsu D, DeKruyff R (2001) Identification of Tapr (an airway hyper reactivity regulatory locus) and the linked Tim gene family. Nat Immunol 2: 1109–1116.
76. McNally N, Williams H, Phillips D, Strachan D (2000). Is there a geographical variation in eczema prevalence in the United Kingdom? Evidence from the 1958 British Birth Cohort Study. Br J Dermatol 142: 712–720.
77. Menzel A (2000) Trends in phenological phases in Europe between 1951 and 1996. International Journal of Biometeorology 44: 76–81.
78. Menzel A (2002) Phenology, its importance to the Global Change Community. Editorial Comment. Climatic Change 54: 379–385.
79. Menzel A (2003 (in press)) Phenological anomalies in Germany and their relation to air temperature and NAO.
80. Menzel A, Estrella N, Fabian P (2001) Spatial and temporal variability of the phenological seasons in Germany from 1951–1996. Global Change Biology 7: 657–666.
81. Menzel A, Fabian P (1999) Growing season extended in Europe. Nature 397: 659.
82. Metzger H, Rivnay B, Henkart M, Kanner B, Kinet J, Perez-Montfort R (1984) Analysis of the structure and function of the receptor for immunoglobulin. Mol Immunol 21: 1167–1173.
83. Munir A, Bjorksten B, Einarsson R, Ekstrandtobin A, Moller C, Warner A, Kjellman N (1995) Mite allergens in relation to home conditions and sensitization of asthmatic children from three climatic regions. Allergy 50: 55–64.
84. Newson R, Strachan D, Archibald E, Emberlin J, Hardaker P, Collier C (1997) Effect of thunderstorms and airborne grass pollen on the incidence of acute asthma in England, 1990–1994. Thorax 52: 680–685.
85. Newson R, Strachan D, Archibald E, Emberlin J, Hardaker P, Collier C (1998) Acute asthma epidemics, weather and pollen in England, 1987–1994. Eur Respir J 11: 694–701.
86. Nicolai T, Illi S, von Mutius E (1998) Effect of dampness at home in childhood on bronchial hyper reactivity in adolescence. Thorax 53: 1035–1040.
87. Peat J, Toelle B, Gray E, Haby M, Belousova E, Mellis C, Woolcock A (1995) Prevalence and severity of childhood asthma and allergic sensitisation in seven climatic regions of new south Wales. Med J Aust 163: 22–26.
88. Peat J, Woolcock A (1991) Sensitivity to common allergens: relation to respiratory symptoms and bronchial hyper-responsiveness in children from three different climatic areas of Australia. Clin Exp Allergy 21: 573–581.
EUR/03/5036791 page 47
89. Perzanowski M, Ronmark E, Platts-Mills T, Lundback B (2002) Effect of cat and dog ownership on sensitization and development of asthma among pre-teenage children. Am J Respir Crit Care Med 166: 696–702.
90. Pope C (1999) II. Mortality and air pollution: association persist with continued advances in research methodology. Environ Health Perspect 107: 613–614.
91. Price S, Wilson L (1992) Pathophysiology: Clinical concepts of disease processes. Mosby Year Book, St. Louis.
92. Rantio-Lehtimäki A, Matikainen E (2002) Pollen allergen reports help to understand preseason symptoms. Aerobiologia 18: 135–140.
93. Rantio-Lehtimäki A, Viander M, Koivikko A (1994) Airborne birch pollen antigens in different particle sizes. Clin Exp Allergy 24: 23–28.
94. Riedler J, Braun-Fahrlander C, Eder W, Schreuer MW, M, Maisch S, Carr D, Schierl R, Nowak D, Mutius von E (2001) Exposure to farming in early life and development of asthma and allergy: a cross-sectional survey. Lancet 358:1129–1133.
95. Rimpelä A, Savonius B, Rimpelä M, Haahtela T (1995) Asthma and allergic rhinitis among Finnish adolescents in 1977–1991. Scandinavian Journal of Social Medicine 23: 60–65.
96. Ring J, Krämer U, Schäfer T, Abeck D, Vieluf D, Behrendt H (1999) Environmental risk factors for respiratory and skin atopy: results from epidemiological studies in former East and West Germany. Int Arch Allergy Immunol 118:403–407.
97. Ring J, Kramer U, Schafer T, Behrendt H (2001) Why are allergies increasing? Curr Opin Immunol 13: 701–708.
98. Riotte-Flandrois F, Dechamp C (1995) New legislation from the Politique Agricole Commune passed in 1994 and its impact on the spread of ragweed. The public health laws are the responsibility of the mayor, the health department, the General Council and the State Council (in French). Allerg Immunol 27: 345–346.
99. Ronchetti R, Villa M, Barreto M, Rota R, Pagani J, Martella S, Falasca C, Paggi B, Guglielmi F, Ciofetta G (2001) Is the increase in childhood asthma coming to an end? Findings from three surveys of schoolchildren in Rome, Italy. Eur Respir J 17: 881–886.
100. Rybnicek O, Jäger S (2001) Ambrosia (Ragweed) in Europe. Allergy and Clinical Immunology 13: 60–66.
101. Sánchez-Mesa J, Galán C, Martínez-Heras J, Hervás-Martínez C (2002) The use of an neural network to forecast daily grass pollen concentration in a Mediterranean region: the southern part of the Iberian Peninsula. Cli. Exp. Allergy 32: 1–7.
102. Schappi G, Suphioglu C, Taylor P, Knox R (1997) Concentrations of the major birch tree allergen Bet v 1 in pollen and respirable fine particles in the atmosphere. J Allergy Clin Immunol 100: 656–661.
103. Schultz Larsen F, Diepgen T, Svensson A (1996) The occurrence of atopic dermatitis in north Europe: an international questionnaire study. J Am Acad Dermatol 34: 760–764.
104. Somonon W, Burge H, Muilenberg M (1983) Allergen carriage by atmospheric aerosol. Ragweed pollen determinants in smaller micronic fractions. J Allergy Clin Immunol 72: 443–447.
105. Sparks T, Menzel A (2002) Observed changes in seasons: an overview. Int J Climatology
22: 1715–1725.
106. Spieksma FTM, Emberlin J, Hjelmroos M, Jäger S, Leuschner R (1995) Atmospheric birch (Betula) pollen in Europe: Trends and fluctuations in annual quantities and the starting dates of the seasons. Grana 34: 51–57.
107. Stewart G, Holt P (1985) Submicronic airborne allergens. Med J Aust 143: 426–427.
108. Strachan D (1989) Hay fever, hygiene and household size. BMJ 299: 1259–1260.
109. Strachan D, Sibbald B, Weiland S, al. e (1997) Worldwide variations in prevalence of symptoms of allergic rhinoconjunctivitis in children: The International Study of Asthma and Allergies in Childhood (ISAAC). Pediatr Allergy Immunol 8: 161–176.
110. Tanaka H, Honma S, Nishi M, Igarashi T, Teramoto S, Nishio F, Abe S (1998) Acid fog and hospital visits for asthma: an epidemiological study. Eur Respir J 11: 1301–1306.
111. Taylor P, Flagan R, Valenta R, Glovsky M (2002) Release of allergens as respirable aerosols: A link between grass pollen and asthma. JACI 109: 51–56.
112. The Finnish Pollen Bulletin (1976–2002) In: vol. 1–27. Aerobiology unit, University of Turku, Turku.
113. Traidl-Hoffmann C, Kasche A, Jakob T, Huger M, Plötz S, Feussner I, Ring J, Behrendt H (2002) Lipid mediators from pollen act as chemoattractants and activators of polymorphonuclear granulocytes. J Allergy Clin Immunol 109: 831–838.
114. Tveito O, Forland E, Alexandersson H, Drebs A, Jonsson T, Tuomenvirta H, Vaarby Laursen E (2001) Nordic climate maps. In. DNMI Report 06/01 KLIMA.
115. Vázquez L, Gómez-Casero M, Galán C, Domínguez E (2002) Definición de un parámetro fenológico para la predicción de las concnentraciones de polen de olivo en la ciudad de Córdoba (España). In: XIV Simposio de Palinología de la Asociación de Palinologos de lengua Española (APLE), Salamanca. Septiembre, 2002
116. Verlato G, Calabrese R, De Marco R (2002) Correlation between asthma and climate in the European Community Respiratory Health Survey. Arch Environ Health 57: 48–52.
117. Viander M, Koivikko A (1978) The seasonal symptoms of hyposensitized anduntreated hay fever patients in relation to birch pollen counts: correlation with nasal sensitivity, prick tests and RAST. Clin Allergy 8: 387–396.
118. Von Mutius E, Fritzsch C, Weiland S, Röll G, Magnussen H (1992) Prevalence of asthma and allergic disorders among children in united Germany: a descriptive comparison. Br Med J 305: 1395–1399.
119. Walther G, Post E, Convey P, Menzel A, Parmesan C, Beebee T, Fromentin J, Hoegh-Guldberg O, Bairlein F (2002) Ecological responses to recent climate change. Nature 416: 389–395.
120. Weiland S, Hüsing A, Strachan D (2000) Climate and the Prevalence of Childhood Asthma & Allergies in Europe: Results from the International Study of Asthma and Allergies in Childhood (ISAAC). Epidemiology 11: 117.
121. Williams H, Robertson C, Stewart A, Aït-Khaled N, Anabwani G (1999) Worldwide variations in prevalence of symptoms of atopic eczema in the International Study of Asthma and Allergies in Childhood. Clin Immunol 103: 125–138.

EUR/03/5036791 page 49
122. World Meteorological Organization (1995) Climate Information and Prediction Services. In. WMO, Geneva.
123. World Meteorological Organization (1997) Stepping forward- Implementation of the WMO CLIPS project. In. WMO, Geneva.
124. Zanon P, Chiodini E, Berra D (2000) Allergy to ragweed in northern Italy and prevention strategies. Monaldi Arch Chest Dis 57: 144–6.

Annex 1
LIST OF PARTICIPANTS
Professor Dr Heidrun Behrendt Technical University Munich Centre of Allergy and Environment Munich, Germany Professor Sergio Bonini Institute of Neurobiology and Molecular Medicine Italian National Research Council (CNR) Rome, Italy Professor Rui Brandao Universidade de Evora Department Biologia Evora, Portugal Mr Bernard Clot MeteoSwiss Payerne, Switzerland Dr Paola De Nuntiis Institute of Atmospheric Sciences and Climate Bologna, Italy Dr Kristie L. Ebi Global Climate Change Research, EPRI Palo Alto, United States Professor Jean Emberlin, National Pollen Research Unit University College Worcester, United Kingdom Mrs Eszter Erdei Orbanne National Centre of Public Health National Institute Environment Health Department of Biological Monitoring Budapest, Hungary Dr Carmen Galán University of Córdoba Department Plant Biology Córdoba, Spain
EUR/03/5036791 page 51
Ms Maud Huynen Maatsricht University International Centre for Integrative Studies (ICIS) Maastricht, Netherlands Dr Siegfried Jäger HNO-Klinik Vienna, Austria Ms Sari Kovats London School of Hygiene and Tropical Medicine Centre on Global Change and Health Department of Epidemiology and Population Health London, United Kingdom Professor Paolo Mandrioli Institute of Atmospheric Sciences and Climate Bologna, Italy Dr Pim Martens Maatsricht University International Centre for Integrative Studies (ICIS) Maastricht, Netherlands Dr Annette Menzel Technical University Munich Department of Ecology Centre of Life Science Freising, Germany Dr Buruhani Nyenzi, World Meteorological Organization World Climate Programme World Climate Applications and CLIPS Division Geneva, Switzerland Dr Auli Rantio-Lehtimäki University of Turku Department of Biology Aerobiology Unit Turku, Finland Professor Dr Johannes Ring Technical University Munich Department of Dermatology and Allergy Munich, Germany

Dr Ondrej Rybnicek University Hospital Brno 2nd Paediat. Dept. Brno, Czech Republic Dr Arnold van Vliet Wageningen University Department of Environmental Sciences Environmental Systems Analysis Group Wageningen, the Netherlands Dr Thomas Voigt European Topic Centre on Air and Climate Change/Federal Environment Agency Berlin, Germany Professor Stephan Weiland University of Ulm Department of Epidemiology Ulm, Germany Dr Magnus Wickman Karolinska Hospital Department of Environment Health Stockholm, Sweden World Health Organization Dr Roberto Bertollini WHO Regional Office for Europe Technical Support Division 2 “Health Determinants” Copenhagen, Denmark Dr Bettina Menne WHO European Centre for Environment and Health Global Change & Health Rome, Italy Observers Dr Claudia Traidl-Hoffmann Technical University Munich Centre of Allergy and Environment Munich, Germany Dr Claudio D’Ambrosio Institute of Neurobiology and Molecular Medicine Italian National Research Council (CNR)

EUR/03/5036791 page 53
Annex 2
PROGRAMME OF THE MEETING
Thursday 16 January 2002 09:00–09:30 Opening of the meeting and welcome Roberto Bertollini 09:30–09:45 Presentation of overall EPN project
Arnold van Vliet 09:45–10:00 Scope and Purpose of the workshop
Pim Martens and Bettina Menne Overview of allergies and asthma in Europe 10:00–10:15 “Overview of allergic diseases in Europe in relation to various exposures and
lifestyles” Magnus Wickman
10:15–10:30 “A brief introduction into pathogenesis of allergic diseases”
Johannes Ring 10:30–10:45 “Impact of pollen on human health”
Heidrun Behrendt 10:45–11:00 Discussion 11:00–11:15 Coffee break Effect of climate conditions on pollens and asthma and allergies 11:15–11:30 “Long-term effects of climate conditions on asthma and allergies” Stefan Weiland 11:30–11:45 “Observed changes in flowering of plants connected to the start of the pollen
season” Annette Menzel
11:45–12:00 “Are there current trends of pollen changes in Europe?”
Siegfried Jaeger

12:00–13:00 Country Hyde Park Corner:
“Evidence for the relationship between family doctor consultations for Seasonal Allergic rhinitis (SAR) and pollen seasons; implications for changes in demand for health care provision with changes in climate. Case study from the West Midlands, United Kingdom”. Jean Emberlin “Short-term climate changes and allergies related to patterns of aeroallergen abundance in Budapest, Hungary (1992 to 2001)” Eszter Erdei
“Seasonal pollen allergy and pollen phenology in the northern climate” Auli Rantio-Lehtimäki
“Factors influencing the prevalence of allergic diseases in Italy” Sergio Bonini
13:00–14:00 Lunch break 14:00–16:00 Group work: Elaboration of recommendations for WHO Member States and
for the research community
– What can we conclude on pollen-associated allergic disorders? – What is the association between weather, phenology and pollen trends? – What is the association between climate variability/change and allergic
disorders – Which are the research gaps?
16:00–16:15 Coffee break 16:15–18:00 Presentation of the group work and discussion Friday, 17 January 2003 Data availability, data quality and needs from a medical, phenological, climatological and remote sensing point of view: towards a better exploitation for the future 09:00–10:00 “Data availability, data quality and gaps: Towards a better exploitation in the
future”
Climatology, Climate, biometeorology and air pollution. Paolo Mandrioli Phenology. Arnold von Vliet Bioaerology. Siegfried Jaeger Epidemiology. Kristie L Ebi
10:00–10:45 Discussion 10:45–11:00 EEA climate impact indicators project.
Thomas Voigt 11:00–11:15 Coffee break

EUR/03/5036791 page 55
Pollen season forecast models and phenological models. Improving cooperation, identifying problems and improvements and potential use of these models for climate impact research. 11:15–11:30 “Experiences with pollen forecasting”
Carmen Galán 11:30–11:45 “Forecasting the features of pollen seasons in the scenario of climate change”. Jean Emberlin 11:45–12:00 “The future of pollen forecasting”
Bernard Clot 12:00–12:15 “Pollen forecast, remote sensing and the role of phenological networks” Arnold van Vliet 12:15–13:00 Discussion 13:00–14:00 Lunch Break 14:00–15:00 Group Work: Elaboration of recommendations for WHO Member States and
for the research community 15:00–16:00 Discussion 16:00–16:15 Coffee break 16:15–17:00 Recommendations and future steps
Closure of the workshop

EUR/03/5036791 ORIGINAL: ENGLISH
This report addresses the associations between weather, climate change, phenology, pollen trends and allergic disorders, and the possible need to adapt pollen forecasting to a changing climate.
The prevalence of asthma, allergic rhinitis, allergic conjunctivitis and eczema in Europe has increased during the second half of the 20th century. The sensitization to pollen allergens has also increased in many areas in Europe. The geographical distribution of plants with allergenic pollen and allergic sensitivity to pollen allergens varies greatly across Europe. But on average the length of the growing
season in Europe has increased by 10–11 days over the last 30 years. An earlier start and peak of the pollen season are more pronounced in
species that start flowering earlier in the year. The duration of the season is extended in some summer and late flowering species.
Evidence is growing that climate change might facilitate the
geographical spread of particular plant species to new areas as they become climatically suitable. Warming is likely to further cause an earlier onset and may extend the duration of flowering and pollen
season, for some species (such as grasses and weeds). Some species,such as ragweed and mugwort, present particular risks for health, and
require land use measures, maintenance of public areas, or eradicationThe impact of climate change on the incidence, prevalence,
distribution and severity of allergic disorders is still uncertain.
Multidisciplinary collaboration was recommended to further clarify the relationship between changing climate, allergens and allergic
disorders and to improve forecasting accuracy and effectiveness.
World Health Organization, Regional Office for Europe European Centre for Environment and Health, Rome Division
Via Francesco Crispi, 10 – 00187 Rome, Italy Tel.: 0039 06 487751 Fax 0039 06 4877599
[email protected]; [email protected]
http://www.euro.who.int/globalchange