PhD THESIS TITLE GUIDELINES FOR THE DESIGN OF … · COST EFFECTIVE NETWORKS IN A MANUFACTURING...
225
PhD THESIS TITLE GUIDELINES FOR THE DESIGN OF ENHANCED, COST EFFECTIVE NETWORKS IN A MANUFACTURING ENVIRONMENT. c B.MXines School of Electronic, Communication and Electrical Engineering University of Plymouth, Devon, UK February 1994
Transcript of PhD THESIS TITLE GUIDELINES FOR THE DESIGN OF … · COST EFFECTIVE NETWORKS IN A MANUFACTURING...

PhD THESIS
T I T L E
GUIDELINES FOR THE DESIGN OF ENHANCED, COST E F F E C T I V E NETWORKS IN A MANUFACTURING ENVIRONMENT.
c
B.MXines School of Electronic, Communication and Electrical Engineering
University of Plymouth, Devon, U K
February 1994

15. NOV. 1994
UNIVERSITY OF PLYMOUTH V LIBRARY SERVICES
fir iSRll:
90 0207063 0
REFERENCE ONLY

COPYRIGHT STATEMENT
This copy of the thesis has been supplied on condition that anyone who consults it is
understood to recognise that the copyright rests with its author and that no quotation
from the thesis and no information from it may be published without the author's prior
written consent.
(i)

AUTHOR^S DECLARATION
At no time during the registration for the degree of Doctor of philosophy has the author been registered for any other University award.
The study was financed by:-
- University of Plymouth - British Telecom - Research Fellowship - short term - DTI - Grant for Innovation.
Relevant scientific seminars and conferences were regularly attended at which work was often presented, external institutions were visited for consultation purposes, and several (6) papers presented for publication.
Publications:- see attached list.
Presentations and Conferences attended:- see attached list.
Signed:
Dated: ,
.(Benn Lines)
BML387sh

Presentations & Conferences Attended
European Conference on Speech Technology University of Edinburgh, Scotland 2nd-4th September 1987
lEE Colloquium "Speech Processing" lEE, Savoy Place, London I9th January 1988
International Conference on Private Switching Systems and Networks, lEE, Savoy Place, London 21st-23rd June 1988
International Conference on "Integration, Information and Material Flow Factory 2000", lERE, Churchill College, Cambridge, UK 2nd-4th September, 1988
lEE Second National Conference on "Telecommunications", lEE, University of York, York, UK 2nd-5th April, 1989
International Conference on Integration, Information and Materials Flow Factory 2000" lEE/IERE, Churchill College, Cambridge, UK 10th-12th July 1990
BML387sh

LINES.B.M* 'A Model for Assessing Subjectively the Effect of Delaying Packets in a Packet Switched Network.* Proc. European Conference on 'Speech Technology', University of Edinburgh. ScoUand, UK, September 1987. Vol.2. ppl27-130. •Author of this Thesis.
LINES.B .M* 'A Model for Optimising the Size of Speech Packets for use on a Packet Switched Networks Carrying Real-Time Interactive Speech.' l E E Colloquium on 'Speech Processing'. Savoy Place, London, U K , 19 Jan. 1988. pp.9/1-9/3. •Author of this Thesis.
LINES.B .M* 'A Model for Assess the Ability of an Office L A N , Employmg the Technical Office Protocol(TOP), to Carry Interactive Speech while Heavily Loaded with Data Traffic' Proc. l E E International Conference on Private Switching Systems and Networks.'. Savoy Place, London. UK. 21-23 June 1988, pp. 190-195. •Author of this Thesis.
LINES.B .M* & Prof.D.HUGHES# 'Issues Affecting the Transmission of Real-Time Interactive Speech on MAP/TOP Local Area Networks in a Computer Integrated Manufacturing Environment.' Proc. l E R E International Conference on 'Integrating Information and Material Flow - Factory 2000', Churchill College. Cambridge, U K . 31 Aug.-2 Sept 1988. pp.311-317. •Author of this Thesis. ^Professor of Computer Integrated Manufacturing at Polytechnic Southwest. Plymouth. UK.
LINES.B .M* 'Assessment of the Ability of an Office Local Area Network.employing TOP to carry Interactive Speech while Heavily Loaded with Data Traff ic ' Proc. l E E Second National Conference on 'Telecommunications', University of York, York. UK, 2-5 . April 1989, pp.349-351. •Author of this Thesis
LINES.B .M* & Prof D Hughes^ 'Performance Criteria for the Transmission of Real-Time Interactive Speech over LANs Employing both MAP and TOP in a C I M Environment.' Proc. l E E Second International Conference on 'Integrating Information and Material Flow - Factory 2001', Churchill College. Cambridge. UK. 10-12 July 1990, pp.71-75. •Author of this Thesis.

B E N N M I C H A E L L I N E S Guidelines for the Design of Enhanced, Cost Effective Networks in a Manufacturing Environment
A B S T R A C T
Investigations into the transmission of real-time interactive speech over local area networks (LAN) in an industriai/commerciai environment to eventually obviate the need for a private automatic branch exchange and ultimately prepare the way for a single interactive integrated information system (PS) that provides work stations, which are networked via a LAN, with a fully interactive speech and graphics facility commensurate with the future requirements in computer integrated manufacturing (CIM).
The reasons for conducting this programme of research were that existing LANs do not offer a real time interactive speech facility. Any verbal communication between workstation users on the L A N has to be carried out over a telephone network (PABX). This necessitates the provision of a second completely separate network with its associated costs. Initial investigations indicate that there is sufGcient capacity on existing LANs to support both data and real-time speech provided certain data packet delay criteria can be met.
Earlier research work (in the late 1980s) has been conducted at Bell Labs and MIT. [Ref 25, 27 & 28], University of Strathclyde [Ref 24] and at B T R L [Ref 22 and 37]. In all of these cases the real time implementation issues were not fijlly addressed. In this thesis the research work reported provides the main criteria for the implementation of real-time interactive speech on both existing and newly installed networks.
With such enhanced communication facilities, designers and engineers on the shop floor can be projected into their suppliers, providing a much greater integration between manufacturer and supplier which will be beneficial as Concurrent and Simultaneous Engineering Methodologies are further developed.
As a result, various LANs have been evaluated as to their suitability for the transmission of real time interactive speech. As LANs, in general, can be separated into those with either deterministic or stochastic access mechanisms, investigations were carried out into the ability of both the:
(i) Token Passing Bus LANs supporting the Manufacturing and Automation Protocol (MAP)—Deterministic
and
(u) Carrier Sense Multiple Access/Collision Detection (CSMA/CD) LANs supporting the Technical Office Protocol (TOP)— Stochastic

to support real time interactive speech, as both are used extensively in commerce and manufacturing.
The thesis that real time interactive speech can be transmitted over LANs employed in a computer integrated manufacturing environment has to be moderated following the tests carried out in this work, as follows:-
The Token Passing LAN presents no serious problems under normal traffic conditions, however, the CSMA/CD L A N can only be used in relatively light traffic conditions i.e. below 30% of its designed maximum capacity, providing special arrangements are made to minimise the access, transmission and processing delays of speech packets.
Given that a certain amount of delay is inevitable in packet switched systems (LANs), investigations have been carried out into techniques for reducing the subjective efifect of speech packet loss on real-time interactive systems due to the unacceptable delays caused by the conditions mentioned above.

CONTENTS
Page No 1. I N I R O D U C T I Q N 8
C O M M U N I C A T I O N S Y S T E M S IN M A N U F A C T U R I N G 12 ENVIRONMENTS
2.1 E V O L U T I O N OF COMMUNICATION S Y S T E M S IN COMMERCE AND INDUSTRY
2.1.1 Teleconununication Systems 2.1.2 Circuit Switching 2.1.3 Packet Switching 2.1.4 Computer systems 2.1.5 Data on Speech Networks or Visa-Versa
- LANs.v.PABXs
2.2 STATE OF T H E ART
2.2.1 Private Automatic Branch Exchanges (PABXs) 2.2.2 Data over a PABX 2.2.3 Local Area Networks (LANs) 2.2.4 Stochastic (non Deterministic) LANs - Carrier Sense
Multiple Access/Collision Detection (CSMA/CD) 2.2.5 Access Methods for CSMA/CD LANs 2.2.6 Application of CSMA/CD LANs in Office Automation 2.2.7 Deterministic LANs (Token Passing) 2.2.8 Access Methods for Token Passing Ring LANs 2.2.9 Access Methods for Token Passing Bus LANs 2.2.10 Applications of Token Passing LANs to Automated
Manufacturing 2.2.11 Manufacturing Automation Protocol (MAP) 2.2.12 Optical Fibre Systems - FDDI I&n 2.2.13 MAP 3.0 and Optical Fibre 2.2.14 Technical Office Protocol (TOP) 2.2.15 Interconnection of MAP and TOP 2.2.16 Comparison of Deterministic and Non-Deterministic
LANs

23 SPEECH AND DATA ON A COMMON COMMUNICATION NETWORK
2.3.1 Speech and Data Traffic Compared
R E A L T I M E I N T E R A C T I V E S P E E C H O V E R L O C A L 65 A R E A N E T W O R K S
3.1 CATEGORISATION OF T H E MECHANISMS WHICH CAUSE SPEECH PACKETS T O B E D E L A Y E D WHEN TRANSMTTTED O V E R LANS
3.1.1 Protocol Wrapping and Unwrapping
3.1.2 Transmission Delays
3.1.3 Medium Access Delays
3.2 T H E E F F E C T ON R E A L - T I M E S P E E C H O F L O S T PACKETS
3.2.1 Digitisation of Speech (PCM)
3.2.2 Relationship between Packet Loss and Speech Quality'
3.2.3 Optimisation of Speech Parcel Size
S U B J E C T I V E M E A S U R E M E N T O F T H E E F F E C T ON 77 S P E E C H O F D E L A Y E D S P E E C H P A C K E T S -U S I N G S P E E C H P R O C E S S O R - X I
4.1 CONDUCTED AT UNIVERSITY O F P L Y M O U T H (UoP)
4.1.1 Delay Characteristics
4.1.2 Simulation of Speech Packet Delay
4.1.3 Listening Tests with Fixed Delays

4.1.4 Listening Tests with Variable Delays
4.1.5 Conversational Tests with Fixed Delays
4.1.6 Conversational Tests with Variable Delays
4.1.7 Relationship between Speech Parcel Size and Percentage Packet Loss.
4.1.8 Methods for Improving Speech Quality
4.1.9 Conclusions drawn from the Tests at UoP
4.2 CONDUCTED AT BRITISH T E L E C O M RESEARCH LABORATORIES (BTRL) MARTLESHAM H E A T H
4.2.1 Aims and Rationale for the Investigations
4.2.2 Test Methodologies
4.2.3 Test Format for the 4msec Packet Tests
4.2.4 Results from the 4msec Packet Tests
4.2.5 Analysis of the 4msec Packet Tests
4.2.6 Conclusions drawn from the 4msec Packet Tests
4.3 CONCLUSIONS DRAWN F R O M THE S U B J E C T I V E TESTS CONDUCTED AT UNIVERSFFY O F P L Y M O U T H AND B T R L
5. CONCLUSIONS 149
5.1 Introduction
5.2 Networks for Commerce and Industry

c
5.3 Integration of Speech and Data
5.4 Delays on LANs
5.5 Strategies for Minimising the effect of delays on LANS
5.6 Investigations into characteristics of delay hits
5.7 Packet Size
5.8 Percentage Packet Loss
5.9 Clustering
5.10 Strategies for Minimising speech loss due to clustering
5.11 Speech Parcel Size Considerations
5.12 Concluding remarks
6. F U T U l ^ E R E S E A R C H
( 6.1 EchoAletum Loss Considerations
6.2. Neural Networks/Genetic Algorithms
h A N N E X E S 167
8. A P P E N D I C E S 177
9. R E F E R E N C E S 185

10. A C K N O W L E D G E M E N T S

C H A P T E R 1
I N T R O D U C T I O N
This thesis investigates the problems associated with implementing real-time interactive speech and data on a single information system, namely, a local area network, designed primarily for the transmission of data in a conmiercial/manufacturing environment. Current practice is to provide two expensive and completely separate networics, one for speech in the form of a PABX, and the other for data comprising a local area network(s). The research work reported in this thesis defines the limitations encountered when real-time interactive speech is combined with data on LANs employed in a commercial/manufacturing environment, and then provides a number of various strategies for minimising the reduction in speech quality caused by these fundamental limitations.
The focus of this research is thus to investigate the problems of integrating both real-time speech and data onto one common information system for use in a commercial/manufacturing environment. Successful implementation of such a system substantially reduces the installation, running, and reconfiguration costs in the IT area, eventually paving the way for a truly integrated information system whereby every woiicstation will have a real-time speech capability thus considerably enhancing user intercommunication.
The enhancement of the user communication will n\anifest itself in terms of ease of coimection, in that once a session has been established between two (or more) users on a network, then no addition telephone type call set-up procedures will be required. Any facility, such as this enhanced communication system, will ease the burden of already stretched professional engineers in the manufacturing sector. Given that engineering expertise in this area is a scarce commodity it is important to use the resource in the most cost efifective manner - improved communication systems of the type developed in this thesis certainly assist in this area. In addition, results show that existing networks and workstations can be modified (at a reasonable cosf to support a real time interactive speech facility.
The separate evolution of speech and data networks is briefly outlined in Chapter 2 together with a description of the current situation concerning IT networks in modem commercial/ manufacturing environments. Chapter 2 is rather large because it covers the background knowledge required to appreciate the integration of the two major information technologies i.e. Conmiunication and Computing - an understanding of these two areas beii^ essential for appreciating the significance of this research activity. In the latter part of Chapter 2 the problems associated with the transmission of real-time interactive speech over LANs are then introduced. These problems axQ primarily a result of the variability of the delays suffered by the speech packets in

accessing, crossing, and then exiting the LANs employed. Unlike data, real-time interactive speech requires a steady stream of bytes to be carried by die network at a modest data rate of 64Kbps (which is the current internationally agreed telephony standard). If access to the L A N is irregular, or, transmission delays excessively variable, then reconstitution of the analogue speech from the received digital bit stream at the receiving end will result in degradation of the received speech quality. In this section the mechanisms that cause packet delay are identified, and the types of delay that occur are defined. Under certain circimistances, particularly related to the trafi&c being carried by the network, the delays encountered could be excessive.
Conventional techniques employed for the digitising of speech require that packets must arrive at the receiving end within a given "time window" prior to being reconstituted into analogue speech. Research work mentioned above indicates that some speech packets will be delayed to such an extent that they could arrive after the time-window had closed for that epoch. As the reconstitution of the analogue speech from the digital byte stream is a continuous process and caimot be halted to wait for delayed bytes, the speech has to be reconstituted with some bytes missing. The result of excessive packet delay is that degradation in speech quality occurs.
Research into the nature of the packet delays on actual networks requires that the occurrence of "packet clustering" is investigated. This phenomenon is a result of packets being caught in a server queue at a switching node in a network. It is usual for the network management system to divert packets away from a busy node once the queue reaches a critical size. However, the impact of this strategy on the received byte stream is that the speech packets not only arrive out of order but that a cluster of speech packets can also be delayed, or even lost, depending on the queue length at the offending node. This loss of a series of consecutive speech samples (to be referred to forthwith as speech parcels) is investigated and results shown, as this aspect of the research is very relevant to the transmission of real time speech over LANs .
The importance of packet clustering is also manifest in the study of speech parcelling, where a number of consecutive speech packets are collected together to form a parcel which is sent tn the data block of an information frame e.g. High Level Data Litik Control (HDLC) protocol, so as to improve transmission efficiency. However, the disadvantage of this technique is that should the frame (speech parcel) be delayed or lost, then a large block of speech is lost resulting in a significant loss in speech quality identical in effect to that outlined in the previous paragraph. In Chapter 3 the impact of packet clustering is evaluated for both eventualities.
Two major strategies are considered to minimise the reduction in speech quality caused by the loss of speech packets, they are:-

(a) minimise actual length of the delays in accessing, transiting and exiting the network
(b) minimise the effect on speech quality of the lost speech packets.
Some techniques already exist in categories (a) and (b), but were foimd to be of limited value, so it was decided to develop new and more powerful techniques, these are reported in this section.
As with most man-machine interfaces the true measure of their effectiveness is their ability to satisfy the user. To this end subjective tests are employed to establish user tolerance to both the fixed and variable delays suffered by speech packets transiting LANs, as mentioned in the previous section. Chapter 4 of the thesis describes these subjective tests carried out initially at University of Plymouth (UoP), and then latterly at British Telecom Research Laboratories (BTRL), to establish the overall maximimi delay that speech packets can suffer, yet still maintaining reasonable commercial speech quality. This was made possible because B T R L have developed the most modem Speech Subjective Testing Unit in Europe which enables a full range of both electronic and environmental conditions to be accurately controlled. Further subjective testing conducted at B T R L establishes the effectiveness of the techniques developed to minimise the effect on speech due to packet loss {see (b) above}. Results of these tests are reported in this section.
In addition, further testing was conducted at UoP to establish the optimum speech parcel size for transmission over LANs employing Carrier Sense Multiple Access/Collision Detection (CSMA/CD) access techniques, given that the L A N data frame would also be contain screen data to support a truly interactive session. In these tests the following parameters were of prime consideration:-
* Maximisation of transmission efficiency,
* Optimisation of the ratio of speech bytes (speech parcel size) to data bytes (screen information),
* provide reasonable screen refresh rate,
" provide reasonable speech quality (similar to that on the PSTN),
* meet speech delivery rates of 8000 bytes per second, on average,
* operate the CSMA/CD L A N within 30% of its maximum design bit rate of 10Mbps.
10
r

operational recommendations are provided for LANs which are to be used to carry both data and real-time interactive speech in a commercial/manufacturing environment, given the problems that are likely to be encountered as mentioned above, see The Conclusion Chapter 7 for details. From the research carried out, the deterministic type of LAN (Token Passing) offers considerable operational advantages over the stochastic variety (CSMA/CD) for any real-time application. However, as there is a very large installed base of Ethernet (CSMA/CD) particularly in the field of oflSce automation, it is important that the special problems associated with implementation are minimised before a truly integrated information system can be implemented.
Results of current research activity taking place at University of Plymouth, as to the suitability of neural netwodcs for reconstituting missing speech packets that have been lost, is reported under Further Research in Chapter 6. The opportunity to reconstitute these missing speech packets exist because the receiving terminal must buffer the received speech packets prior to the analogue speech being reconstituted by the digital-to-analogue converter and then sent to the transducer (speaker). The reason for this buffering process is that the incoming packets may arrive out of time sequence and thus must therefore be re-ordered (in time sequence) prior to reconstituting the analogue signal. This operation must take place within the time-window defined previously. The received buffer will therefore contain, for a short period or time, speech packets (8 bit samples) either side of those that are missing i.e. preceding and succeeding packets. Investigations are being carried out as to whether a neural network, in possession of the preceding speech packets and the succeeding speech packets, can reconstitute those that are missing on a continual basis, and within the very limited time-window that exists. Early results fi-om a primitive neural netwoiic operating on single packet loss are reported and compared with those already developed, see Chapter 6 for details. Initial indications show that this is an extremely powerful tool as it has the capability to "learn" as the conversation progresses. In addition, the system degrades gracefully in the event of an increase in packet loss, thus avoiding the crash-syndrome associated with many digital systems. However, the neural network algorithm does require a considerable amount of computing power at the present, although it is anticipated that this could be reduced with further research.
The thesis is that real-time interactive speech can be carried by LANs (also carrying data traffic) under certain well controlled conditions which are investigated as follows:-
(a) identification of the mechanisms that cause packet delay
(b) defmition of the types of delays that occur
(c) establishing the tolerance levels of human users to the types of delays defmed in (b)
11
(d) investigation of methods for reducing both the length and variability of the delays generated by the different types of LANs currently employed in commercial/industriaJ environments.
(d) evaluation of existing techniques for minimising the effect of delayed speech packets, and the development of new and more effective strategies
(e) evaJuation of the effectiveness of these new strategies against the existing techniques described in (d) and (e) by subjective testing under controlled conditions.
(0 provide recommendations for the successful implementation of both real-time interactive speech and data on a common LAN(s).
End of Chapter 1
12
CHAPTER 2
2. COMMUNICATION SYSTEMS IN MANUFACTURING ENVIRONMENTS
2.1 E V O L U T I O N OF C O M M U N I C A T I O N S Y S T E M S I N COMMERCE/INDUSTRY
Since the invention of the telephone by Sir Alexander Graham Bell in 1876, and the computer by Babbage in the 1950s, these two giant industries have evolved each developing there own major electronic information system essentially independent of one another. This development has been at a rapid rate, mainly in response to market forces, but with little or no cooperation between the two industries.
Another interesting comparison that can be made is that while telecommunications have been looked upon (until fairly recently) as a service industry, often under the auspices of the government, the computing industry has remained very much in the private sector. This aspect of their separate evolution will be referred to again in this chapter. Even at company level, the two systems are viewed differently by the management i.e. 'telephones' are often considered 'low-tech' and therefore come under the responsibility of the office manager who also orders stationery and paper clips - whereas the computing requirements are seen as being 'high-tech' and are managed by a computer manager in a special computer suite. This perception is also reflected in the salaries paid to the staff who have responsibilities in these respective areas.
Until the late 1970s the major telecommunications equipment manufactures, suppliers, and carriers felt that they had little to fear from computing equipment manufacturers and systems houses as the two markets had remained more or less separated and technologically incompatible. The reason for this separate development and technological incompatibility can be found by comparing the technology employed in the two systems. Until the early 1970s all the major telecommunications networks in the world employed analogue transmission and switching, as they were originally designed specifically for the carrying of analogue speech signals. In contrast, computer systems had been designed to process digital data employing purely digital techniques.
It is also worthy of note that early computer systems (networks) had the same star topology as the telecommunication systems. However, developments over the last ten years in the field of distributed computing has resulted in a major change in the topology of computer networks. The move has been away from the main-frame based 'star' topologies where all die intelligence was concentrated at the hub and the terminals are dumb, and towards bus and ring structures which are more appropriate for the new generation of intelligent workstations now being employed in both office and manufacturing automation. This evolutionary process has spawned local, national and international computer networks, mostly under private control, which now forms a major part of the enabling technology for all modern information systems so essential for companies who wish to maintain that competitive edge.
12

The next section describes briefly the current state of the teleconimunications networks both nationally and internationally with a view to explaining the limitations of this network for data transmission.
2.1.1 TELECOMMUNICATIONS SYSTEMS
Given that the telecommunications industry was borne some 70 years before the first computing machines (as we know them today) were produced, it is hardly surprising that the industry has become mature and extremely well established on both a national and international basis with a framework of active standards bodies (CCITT and CCIR The level of international cooperation, in terms of standards agreement, that has been achieved over the past 70 years, through the work of the CCITT and the CCIR, in spite of the considerable political differences that exist from country to country, has been little short of amazing. As a result it is currently possible, through services like International Direct Dialling (IDD). to direct-dial most telephone subscribers (customers) all over the world without the aid of an operator.
The basic architecture of most telecommunication systems is hierarchical . . . with traffic -
between subscribers taking the most economic route (usually the shortest) in the first instance. However, during busy periods (called "busy-hours") traffic will be diverted automatically to higher layers in the network when the shortest routes become congested. The reason for the provision of these higher layers in the national network is to prevent calls being lost through congestion and thus meet internationally agreed standards on "grade of service"- specified in terms of the number of lost calls.
Although the overall suiicture of current telecommunications networks is hierarchical, the elemental networks are all based on a 'star structure* with all the intelligence concentrated in the central switch. Each star shaped network has connections to the layer above from the central switching point and is, in effect, a subset of the layer above. The reason for this adherence to star structured networks by
( ' telecommunications authorities throughout the world is that for analogue transmission systems employing circuit switching ( see later in this section for a description of circuit switching ) it can be shown theoretically that this configuration minimises the amount of cabling required for a reasonable geographical spread of subscribers within a given local exchange area. As cabling costs represent the single most significant capital investment in a telecommunications network it is important to optimise this cost/performance ratio.
It can be seen from Fig 2.1.1(a) and (b) that each star configured network is a subset of the layer above in the network, very similar to a Mandelbrot set [REF 1] with direct circuits linking adjacent star networks e.g. a PABX in a commercial/industrial will support possibly hundreds of extension telephones where each telephone has a
r
*CCITT: - Consultaiivc Commiticc for Imernaiional Telqjhony & Telegraphy CCIR: - Cofisulmivc Commkicc for Irucmational Radio.
13

direct link ( a two w'ure dedicated circuit) back to the central switching equipment, thus forming a star topology. The d'u^t exchange lines that provide the PABX with connection to the outside world are fed from the local BT/Mercury Exchange. However, that group of exchange lines forms only a small portion of the total number of lines available from the Local Exchange, typically 10,000. The direct exchange lines from the Local Exchange are also arranged in a "star structure" feeding all subscribers with in a given geographical area, typically about 16knis in diameter.
Distribution Point
Telephone Cabinet
Distribution Point (DP)
Subscribers* Telephones
Cabinet \ i — i ^
2 \ ijC3b
Exchange
Fig.2.1.1(a) Telephone Connection to Exchange
14

c
o
Fig 2.1.1(b) Diagram of PABXs and other Subscribers forming Local Exchanges which in turn form Charging Groups
15

To provide national communication Local Exchanges are grouped to togetlier on a geographical basis to form Charging Groups (within which all calls are charged at "local call" rates). Calls between subscribers on different exchanges but within the same charging group are routed over special circuits that link the exchanges called Junctions. Because it is not usually economic to interconnect all exchanges in a charging group one of the exchanges in the charging group is nominated as the central switching point for that group and is called the Group Switching Centre (GSC). As a result calls between exchanges within the charging group are normally routed through the GSC. However, i f their is sufficient traffic ( telephone calls ) between two exchanges then Direct Junctions are provided between the two exchanges ( not going via the GSC ) see Fig 2.1.1(c). These Direct Junctions are provided so as to carry approximately 80% of the maximum traffic occurring during the busiest hour of the day ( Busy-Hour ). The other 20% of the Busy-Hour traffic is routed to its destination over Junctions via the GSC i.e. it effectively overflows via the GSC. This approach is employed to reduce the amount of circuits standing idle ( not revenue earning ) during times of reduced traffic and is universally employed. It can therefore be seen that the Charging Group is basically another star structured network with the GSC at the hub similar in nature to the Local Exchange below it in the hierarchy and the PABX below that.
Trunk Trunk
• Trunk 1 G S C
Junction
Local Local
Junction +
Fig 2.1.1(c) Provision of Junctions between GSCs on the PSTN
To provide communication between Charging Groups special circuits are provided as the distances involved can be quite large. These circuits are called Trunks. Trunk circuits terminate in the GSC of each Charging Group. As with the Junctions, it is not economic to interconnect all GSCs with Trunk circiiits. The result is that GSCs are grouped together into Districts, and one GSC within each District is nominated as the District Switching Centre ( DSC ). These DSC is connected to all the GSCs within that District by Trunk circuits in a star stmcture. Direct Trunks between GSCs are not normally provided, unless there is sufficient demand when direct trunks are installed ( on the same basis as above ). Yet another star structured network!
16

The top layer in the hierarchy employs Main Switching Centres (MSCs). Again, the DSCs are grouped together to form main switching areas in which one DSC is nominated as the main centre and all DSCs are connected to it in a star structured network. The difference with the MSCs as opposed to the DSCs and the GSCs is that all MSCs are fully interconnected. Currently Uieir are 9 MSCs which are to be found in the main conurbations in this country i.e. London, Birmingham, Manchester, Liverpool, Bristol, Edinburgh and Glasgow etc. See Fig 2.1.1(d) for diagram of the U.K. National Network.
GSC
( G S C C
Fig 2.1.1(d) Diagram of the U.K. Public Switched Telephone Network.
The international telecommunications network also reflects the hierarchical type topology based on a star structure with major switching centres ( called CTs ) based in the developed counties, with the third world operating as satellites off their nearest CT,
The reliance on the star structure topology by telecommunication authorities is of fiindamental importance to the research work reported in this thesis as it imposes certain restrictions on teleconununication networks which will have far-reaching effects in the development of future information networks. Certain PTTs have realised the constraints with which they are faced and are endeavouring to move away from star-based architectures.
17

2.1,2 CIRCUIT SWITCHING
Until fairly recently PTTs throughout the world have adopted a policy of rigid adherence to circuit-switched systems. This method of interconnecting telephones/terminals necessitates the establishment of a conununication channel between the two parties concerned for the duration of the connection. In reality this connection has to be set up before any information transfer can take place, necessitating a "set-up" time. On completion of the call the connection has to be broken down (cleared down), requiring a "clear down" time. Both the set-up and clear-down times are considered as overhead as no revenue earning information can be transferred during these periods. However as speech conversations tend to be much longer than these set-up and clear-down times the original designers tended to ignore their significance. The telephone system was designed specifically to carry speech employing analogue transmission and switching techniques.
Two world wide networks, one for speech, and the other for data (TELEX), operated mainly by national PTTs. successfully evolved using these techniques exclusively , until the early 1970s. Another circuit switched network also existed for the exchange of vision (television) signals within Europe (Eurovision) and between the USA. This network does not provide the same degree of coverage or flexibility as the telephony and telex networks mainly because the technology did not then exist for the "broadband" switching required for broadcast quality vision signals. However, the key issue here is that separate systems were required for each signal type, a limitation not found with packet switching described in the next subsection.
There are times in any interactive information system, be it speech or data, when periods of inactivity occur. With circuit switched systems the connection is still maintained during these periods'with the appropriate tariff continuing to be charged. This is another major disadvantage with circuit switched systems.
It can be shown that the communication channels and switching equipment can be employed in a more efficient manner by employing a technique called Packet Switching. However, this improvement in efficiency is bought at a price. The price to be paid is in the currency of time delay, the explanation of which forms a fundamental part of this thesis.
In addition to those points indicated above, the rate at which information can be transferred over the current generation of circuit switched systems is inherently low compared to the packet switched networks (discussed in the next section). The channel bandwidth, having been designed to carry commercial quality speech, is basically only 300Hz to 3.4kHz by international agreement. The latest modem technology employing QAM(Quadrature Amplitude Modulation), still necessary for data transmission, can support only 14,400kbps on the best PSTN connections, frequently it is considerably less than this figure, typically 9.600kbps. This figure compares with 10s of Mbps in packet switched systems and represents 1000 fold increase in the rate that information can be transferred.
18
2.1.3 PACKET SWITCHING
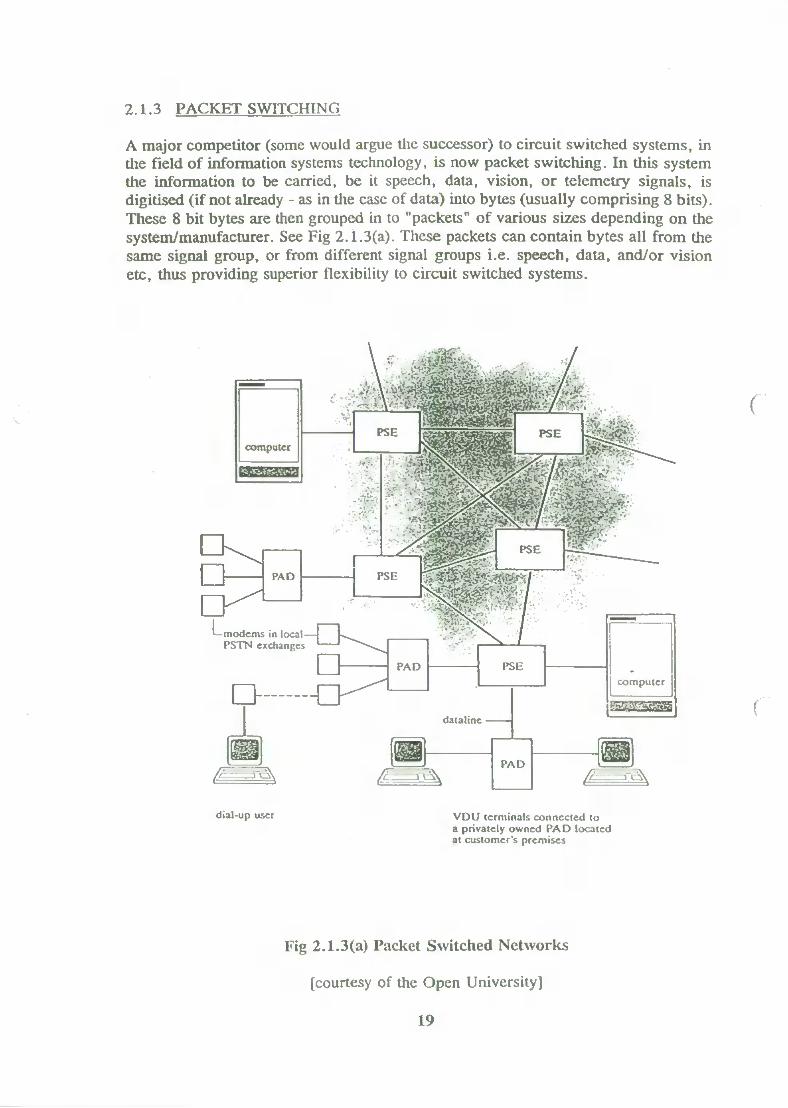
A major competitor (some would argue tlie successor) to circuit switched systems, in the field of information systems technology, is now packet switching. In tliis system the information to be carried, be it speech, data, vision, or telemetry signals, is digitised (if not already - as in the case of data) into bytes (usually comprising 8 bits). These 8 bit bytes are then grouped in to "packets" of various sizes depending on the system/manufacturer. See Fig 2.1.3(a). These packets can contain bytes all from the same signal group, or from different signal groups i.e. speech, data, and/or vision etc, thus providing superior flexibility to circuit switched systems.
m I modems in local — P S T N exchanges
P A D
computer
datalme
P A D
dial-up user V D U terminals connected to a privately owned P A D located at customer's premises
Fig 2.1.3(a) Packet Switched Networks
[courtesy of the Open University]
19

The packets mentioned above not only contain the information to be transported but also routing information, as tliere is no circuit set-up facility as witli the circuit switched system. This routing information is contained in a packet "header" which holds botli the source and destination address of the packet in question. When the packet is fed into the packet switched system the packet arrives at the first node where the destination address is read. The communication software within that node will tlien route the packet to the next node en route to its final destination. The routing is achieved by algorithms contained in each node which provide the optimum path to be taken. In more sophisticated systems, which contain overall network management systems, node congestion can be quickly identified and packets routed away from problem areas. Should a packet not be accepted by its intended destination, then it can be routed back to its source as this information is contained in the packet header. See Fig 2.1.3(b)
octet 1 O C t c i n
sent first sent 1
OUmiO address control 2-octct F C S
flag
O l l I l l l O
Fig 2.1.3(b) Packet Header Format
[courtesy of the Open University]
From the above brief description, it can be seen that packets can take a number of different routes tlirough the network depending on:-
(1) the traffic on the network
(2) the time of day
Inherent in this type of network is the variability in the time taken for packets to be delivered - commonly referred to as packet delay. The study of the nature of these delays and mechanisms for minimising their occurrence and effect forms the major part of this thesis.
Because of the variation in delay likely to be experienced by packets it is not unusual for packets to arrive out of sequence at their destination. As a result it is normal to include in the packet header a packet sequence number if the information being transmitted is spread over a number of packets. I f packets do arrive out of order then
20

(
they must be re-ordered before tlie original information can be reconstituted, particularly if it is required in an analogue form. This re-ordering process incurs a time penalty which can adversely effect time-critical applications, e.g. real-time systems in the form of interactive speech and/or process control in a manufacturing environment.
For packets to be transmitted over a packet switched system it is obviously necessary to provide circuits between the various nodes. The main difference between packet switched systems and circuit switched systems is that in the former the connection between the nodes is only held for the duration long enough for the packet to be transmitted, after which they are released in readiness to perform the next switching operation. As a result the channels and the switching equipment are used much more efficiently because they are only set-up and held when actual information is being sent. This arrangement is reflected in the tariffs levied.
To achieve the high speed set-up and clear-down times, high speed digital switches are required at the nodes, which tend to be more expensive than the slower speed devices employed in circuit switched systems. However, it can be shown that far less high speed digital cross points (switches) are required in the packet switched nodes because they are only held for short durations (10s or 100s of nanosecs = packet length), unlike the long holding times experienced in circuit switched systems (minutes on a typical telephone call).
Another significant advantage of packet switching is that once the information is in a digital form and packetised, it can be transmitted and switched by the packet switched system with no real regard for the contents of the packets, i.e. the packet switched system is information-type independent. This enables a single information system to be a distinct possibility resulting in the oppormnity for considerable savings to be made in installation, maintenance and reconfiguration.
Although packet switched systems offer a number of significant advantages over circuit switching, it does suffers from one fundamental limitation, not experienced in circuit switched systems, in that packet delay is non-deterministic because it is traffic dependant. For many applications this is not a critical issue, but for real-time environments where certain processes have to be carried out in a given time-window, this limitation has serious consequences for consistent system operation.
As will be seen later in this thesis, the packet delay problem inherent in packet switched systems requires special arrangements to be made to cater for real-time systems.
2.1.4 COMPUTER SYSTEMS
Until the early 1980s computer systems were almost exclusively based on the "star structured networks" with a powerful mainframe at the hub containing all the intelligence, being accessed by and a large number of dumb terminals operating over dedicated circuits via multiplexors/terminal concentrators. Over the past ten years the topology of computer systems/networks has changed considerably due to the
2 1

availability of relatively low cost work stations and PCs with much greater internal computational power. As a result more information can now be processed locally without reference to the mainframe, thus reducing the requirement for communication with the mainframe (and the mainframe its self !), but increasing the need for inter-workstation conununication via Local Networks and National Networks as information systems play an ever increasingly role in both industry and commerce.
This "distributing of the intelligence" within the computer system has produced major changes and given birth to a new generation of computer networks. In response to these changes Local Area Networks (LANs) have evolved which enable different types of work stations and termmals to be interconnected via a common communication network. See Fig 2.1.4(a) below.
J ? o
I T ring
Fig. 2.1.4(a) Topology of Popular Local Area Networks
[courtesy of the Open University]
These LANs have developed by employing the principles of packet switching, as large blocks of data are normally transmitted over the network for the purposes of electronic mail, file transfer, access to printers or plotters etc. The LAN architectures currently employ mainly either bus or ring topologies and are of length not more than 2 to 10 Km, usually confined to a particular commercial concern.
22

For access to other networks, links have to be established either on dedicated circuits, if justified by the traffic levels, or by global networks provided by large common carriers such as BT or Mercury. For international companies with offices and plants throughout the world it is often advantageous for them, on the basis of both cost and security, to operate their own personal information network. These networks are often a number of LANs interconnected by low speed national or international circuits leased from PTTs, and are referred to as Wide Area Networks (WANs). See Fig 2.1.4(b) below.
(.
Corporate network
ICateway \
Divisional network
I Gateway I
Plant backbone MAP
Plant segment MAP
r
Fig.2.1.4(b) Wide Area Networks Topologies
The evolution of these LANs and WANs has not been without it problems particularly in the area of compatibility, as equipment manufactures and suppliers have been reluctant to adhere to standards in an attempt to protect their markets. This development has been in complete contrast to that experienced in the telecommunications industry, as mentioned early, where standards receive universal adherence.
23

As a result there has been a proliferation of standards in the computing industry (IEEE, ECMA.EIA, and ISO f which has done little to protect the innocent purchaser from the evils of equipment incompatibility.
It should, however, be remembered that it has taken the telecommunications industry over 100 years to achieve its current state of standards harmony,the history of the industry [REF 2] shows that the path to this current position was far from smooth. In addition, it should be remembered that the computing industry is still very much in its infancy and current standards activity by the International Standards Organisation (ISO) in producing their 7 Layer Model for Open Systems Interconnection . offers considerable hope for the future.
2.1.5 DATA ON SPEECH NETWORKS OR VISA VERSA — LANs V PABXs
From the preceding explanations it would appear that fundamental limitation of packet delays would rule.out the use of packet switched systems for real-time operation i.e. conversational speech and real-time control etc, thus leaving the way clear for circuit switched PABXs to be the network technology for the integrated interactive information systems required by industry, commerce, domestic and leisure industries for the next century. This scenario implies that LAN and WAN technologies are but passing phases in the evolution of information technology, as was telegraphy.
There are, however, some very strong arguments in favour of the developments of LAN/WAN technology at the expense of the circuit switched PABX architectures. Not least of these is that British Telecom and every other PTT in the world have a major investment in twisted pair cable technology which has a very low information handling capacity, even over sh'ort distances, typically 100s of kbps. This is several orders of magnitude less than current LANs which operate at IGs of Mbps. The next generation of optical fibre based LANs F D D I I and I I ^ are already available and boast operating speeds in excess of a 100Mbps. This difference in the speed at which information can be transferred from one station to another has important implications on the systems operational characteristics, and-may in some respects alleviate the problems caused by packet delay.
The current political situation is that BT would very much like to replace their inadequate twisted pair network with optical fibres, particularly the 'local ends', but the enormous cost of such an investment could only be off-set by a high income from domestic users. This could easily be obtained by BT by being allowed to distribute multichannel TV over their optical fibre network. Unfortunately for them the government's policy is to promote free enterprise. The official line is that if BT are permitted to transmit TV as well as their telephony, in addition to other broad-band data services that the fibre will easily support, then they wil l effectively put all the other broadcast TV systems out of business along with Mercury et al. This is,
ISO Imcnuiiona] Standards Organisaiion I E E E Institute of Electrical and Electronic Engineers ECMA European Computer Manufacturers Association EIA Elcct/ica] Industries Associates
24
apparently, against a free enterprise culture, so the goverrunent in their infinite wisdom have refused BT a license to distribute domestic TV. The net result is that BT cannot afford to re-engineer its cable network, so we are saddled with this antiquated system for the foreseeable future.
As a result an excellent window of opportunity has opened, albeit for a short period, for the development of alternative forms of networks capable of carrying both speech and data for commerce and industry.
It is for this reason diat this project was initiated to investigate the problems associated with the transmission of real-time interactive speech over LANs and then make recommendations as to how these systems could be implemented on the current range of networks in the market place, with a view to eventually developing the 'all singing-all dancing' tmly integrated interactive information system for the 21st century.
The next section describes the current state-of-the-art in both PABXs and LANs as employed in commerce/industry.
2.2 STATE-OF-THE-ART
The IT budget for the developed world is currently running at approximately $100 Billion per annum and is expected to increase at 20% per armum until the end of the century, having already grown at a rate of approximately 35% per annum since 1980. It is therefore no surprise that both the telecommunications industry and the computing industry are vying for control of this multibillion dollar market with both offering differing solutions to, meet the information systems requirements of commerce and industry. This section provides a 'snap-shot' of current products in the market place for both of the above mentioned areas in IT provision.
2.2.1 PRIVATE AUTOMATIC BRANCH EXCHANGES
There is an ever increasing number of sophisticated products in this area of IT provision designed primarily to support the telephony needs, with only a token attempt at trying to satisfying any of the major data processing/transfer requirements commensurate with a modern automated commercial/industrial environment. In particular, the telephony demands are catered for by the provision of a number of standard 'fixed point' service access points the usefulness of which is certainly questionable in the light of the flexibility offered by the current range of personal and portable communicators that are now available. Rather than attempt to cover all the PABX products in the market place the current BT offering is considered as it does provide most of the services available from other manufactures. This product is referred to as iSDX.
This system, developed in parmership widi GPT, is offered in a range varying in complexity and cost to suit most customers' requirements. The topology of this information system remains 'star-stmctured' with a central switch and all terminals connected to it on a radial basis requiring physically dedicated analogue circuits
25
(

operating on a circuit-switched basis (see Fig 2.2.1a). The central switch employs digital switching technology thus requiring that every terminal connection must be interfaced to it via an analogue/digital converter. Listed below are some of the functions offered by this latest generation of PABX:-
(1) call-transfer facility
(2)
(3)
(4)
(5)
(6)
(7)
teleconferencing
push-button dialling
call-diversion facility
camp-on facility
recall-when-free facility
direct in-dialling to extensions from PSTN
Site 8
vol
:2L
SPG Exchange
with Store-and-Forward Capabilities
Business Data
Terminal
"Z. > S i leC
Site D
Exchange Lines
Process Conirol/Moniloring/Alarm Devices
Site A
VDI Key:
vol Telephone instrument acting as a voice and data input device
Fig.2.2.1(a) STAR-STRUCTURED PABX (iSDX)
BT's decision to retain analogue transmission and circuit-switching yet embrace the latest digital switching technology is due in part to the fact that their vast installed base of telecommunications equipment is still a circuit-switched analogue transmission system employing digital main exchanges (System X and Y). Links between the main exchanges, as shown in the national network are trunks- for long distances, and junctions- for short distances of less than ~ 56km. The existing twisted
26

pair and coaxial cables in the national trunk and junction network are being replaced, as a matter of policy, with monomode optical fibre which is currently an all digital transmission system. As a result BT find themselves in a very difficult position of knowing that if they want to retain their market share of an increasingly competitive information systems industry, as a major carrier, they must 'go-digital* all the way to the customers premises, yet they have a huge investment in analogue circuit switched equipment which does not lend itself to easy modification.
In response to market forces BT are in the process of 'going digital',as mentioned above, all the way to the customers premises, by effectively overlaying a new network called the Integrated Services Digital Network (ISDN) on the existing PSTN. When fully operational, the ISDN will provide a fiilly digital Capability into the customers premises. This service will take the form of three digital channels comprising two B channels each of 64 kbps, and one D channel of 16 kbps and is therefore referred to as 2B+D system (see Fig 2.2.1(b) below). The use of these channels can be defmed by the customer for either:-
(a) Telephony speech (64kbps) on the B channels, with low speed data on the D channel data (16kbps) for text transfer,
r
or
(b) Data transfer at (64kbps) Full-Duplex (both direction of transfer at the same time) using the slow speed D channel for control, supervisory, or back-up functions.
N T E voice or non-voice 64 kbits E - ' '
non-voicc _8_kbitssJ'_
signalling 8 kbiis S-'
80 kbits s -on local cable pair
2 Mbits s'
System X local
exchange
N T E voice or non-voice 64 kbits S-'
non-votcc 8 kbits S-'
signalling 8 kbits S-'
80 kbits s " on local cable pair
remote multiplexer
to other System X exchanges
Fig.2.2.1(b) 2B+D Configuration of ISDN
[courtesy of the Open University]
The impact/importance of this system to national communications in the UK will be discussed at length in the Discussion/Conclusion at the end of this thesis.
(
27

2.2.2 DATA OVER A PABX
Because telephones are still essentially analogue devices, transmission to and from the central switch is analogue. Thus to use a PABX to switch data traffic the digital data must first be converted into an analogue form for transmission and switching. This process is well known and is achieved by use of a modem. At the receiving end the analogue signals are convened back in a digital form by a modem prior to being fed to the terminal or workstation.
The rate at which data can be transferred across a PABX based system is modest by current standards because these systems were designed to carry only normal commercial quality speech hence requiring low cost cables and switches of limited information carrying capacity (for sound economic reasons). This information carrying capacity can be quantified in terras of either bandwidth (cycles per second. Hz) for analogue systems, or in terms of data rate (bits per second, bps) for digital systems. By international agreement the bandwidth for conmiercial quality speech is from 300Hz to 3400H2, a bandwidth of some 3100Hz. and this imposes severe restrictions on the rate at which data can be transferred over a PABX system. Current modems operate at 9600bps with the facility to go to 14400bps for better quality connections.
The quality of the end to end connection in digital systems is measured in terms of the error rate. i.e. the number of bits that arrive in error over the number of bits that are received. For commercial quality speech systems this figure is typically one bit lost in one million received (an error rate of 1 in a million ) . For financial systems where large sums of money are involved the error rate has to be improved to 1 in hundred million.
It is sometimes difficult to achieve these higher data rates and still maintain acceptable error rates on PABX systems because the construction of the multi-pair telephone cables allows energy to leak from one circuit to another at high data rates thus causing interference and increasing the number of errors received. As will be seen in the next section, the data handling performance of the PABX with a data rate of typically 10.000bps for an error rate of 1 in a million does not compare very favourably with the Local Area Network (LAN) which can support a data rate of 10Mbps at a similar error rate. It must, however, be pointed out that the real-time speech handling capacity of LANs has yet to be fully quantified in the presence of other data traffic.
2.2.3 LOCAL AREA NETWORKS
As mentioned earlier in section 2.1.4 computer networks were originally based on a star structure with all the 'intelligence* (computing power) centralised in the mainframe. The terminals contained no data processing ability and were classed as 'dumb' as all data was transmitted to the mainframe by low speed lines, processed, then returned to the terminal for inspection by the operator.
28

The evolution of Local Area Networks(LANs) started during the late 1970s with the advent of the personal computer as a result of cheaper hardware (processing power) being made available following significant advances in Very Large Scale Integration(VLSI) design and manufacture of integrated circuits. It was now possible to build a data processing ability into terminals at a reasonable cost. At a stroke the terminals ceased to be 'dumb* and became so called 'intelligent*.
With considerably more processing power now being available 'locally* within the terminal/personal computer, as opposed to being concentrated in the mainframe, the demands on its computing power were substantially reduced.
As personal computers (PCs) become more and more powerful it can be argued that the need for mainframe computers will diminish to such an extent that they wil l eventually become extinct. Their place will be taken by networks linking PCs and workstations for interconamunication and the sharing of communal service devices like printers, plotters, disc stores, etc. This architecture is ideally suited to support the new information-age that is already dawning. Local Area Networks are the first step in this process.
LANs hold the middle ground in the networking fraternity between multiprocessors systems on the one hand and Wide Area Networks (WAN) on the other. The multiprocessor systems employ 'tight* coupling between the processors which are usually linked by high speed parallel bus structures e.g. address, data and control buses. Applications of these architectures can be found in high speed parallel processing systems, and in environments which require high levels of reliability necessitating the duplication or even triplication of the central processor such as . in Defence systems, Nuclear Power Plants and Telephone Exchanges to name but a few.(See Fig 2.2.3)
M M
5 ta)
M M
M M
M M
M
M
(b)
Fig.2.2.3 Multiprocessor Systems Configuration [courtesy of Andrew S Tanenbaum]
29

WANs are 'loosely* coupled compared witii LANs. Segments of these networks can often be separated by thousands of miles. As a result the linking of the various parts is achieved over relatively low speed channels compared with multiprocessor systems and LANs, in the interests of economising on communication costs. Typical speeds of operation would be of the order of 10s or 100s of kilobits per second, operating over 1000s of kilometers. The application of these networks can be found in large multinationals companies where they are the enabling technology for the corporate information systems so necessary for current and future growth.
LANs often form the segments, or sub-networks, within a W A N and provide intercommunication between PCs, workstations, printers and plotters for modem offices or industrial plants, thus providing the enabling technology to support the Mocar information systems. Office Automation (OA) is normally supported on LANs, as is Automated Manufacturing Technology (AMT), but unfortunately the characteristics of the two LANs that have become international standards in these respective areas are significantly different and as a result pose severe interconnection problems particularly for real time applications. These differences wi l l be discussed in detail in the following section.
The physical length of LAN is normally limited to approximately 2-to-lOKm, for reasons associated with signal propagation delays during the phase of initially accessing the network. Data rates on these networks vary between lOMbps to 16Mbps. However, the current generation of optical fibre LANs (FDDI-1 and FDDI-2) offer considerably longer lengths with data rates far in excess of the lOMbps specified above. lOOMbps are current data rates being discussed in connection with FDDI-2.
LANS can be subdivided into t\vo main categories, basically in terms of the methods employed by the stations to access the network, these are:-
(a) STOCHASTIC LANS (NON-DETERMINISTIC)
In this category the time taken to access the LAN (called the 'access time') is dependant on the level of data traffic both on the LAN and attempting to gain access to the LAN. As a result it is not possible to determine exactly the actual access time, instead it has to be defined statistically -hence the term 'Stochastic or Non-Deterministic LAN' . It is theoretically possible for the access time in this type of LAN to approach infinity. However, in practice the access times are highly variable but finite.
(b) DETERMINISTIC LANS
In this category the access time is dependant more on the number of stations connected to the LAN rather than the traffic level, under normal operating conditions. Only when the traffic levels approach 95 % of the design capacity does the access time . show a marked increase. As a result this category of network is classified as being 'Deterministic' because the worst-case access t'mie can be calculated i f the total number of stations connected to the ring/bus is known.
30
The variations in the access times for the two categories of LANs has far reaching implications for their application in both commerce and industry. For real-time application, particulary in the control of automated manufacture, non-deterministic LANs have severe limitations and are not normally employed in that environment. However, Deterministic LANs are being used successfully for real-time control and are specified as international standards for this purpose. Office automation does not require (as yet!) real-time capabilities from its LAN and. as a result. Non-Deterministic LANs are employed extensively in this area of commerce and have also been specified as an inlematioiial standard.
It is the study of existing methods, and the development of new strategies, for minimising the access delays, with particular reference to real-time interactive systems using Non-Deterministic LANs, that forms the major part of this thesis.
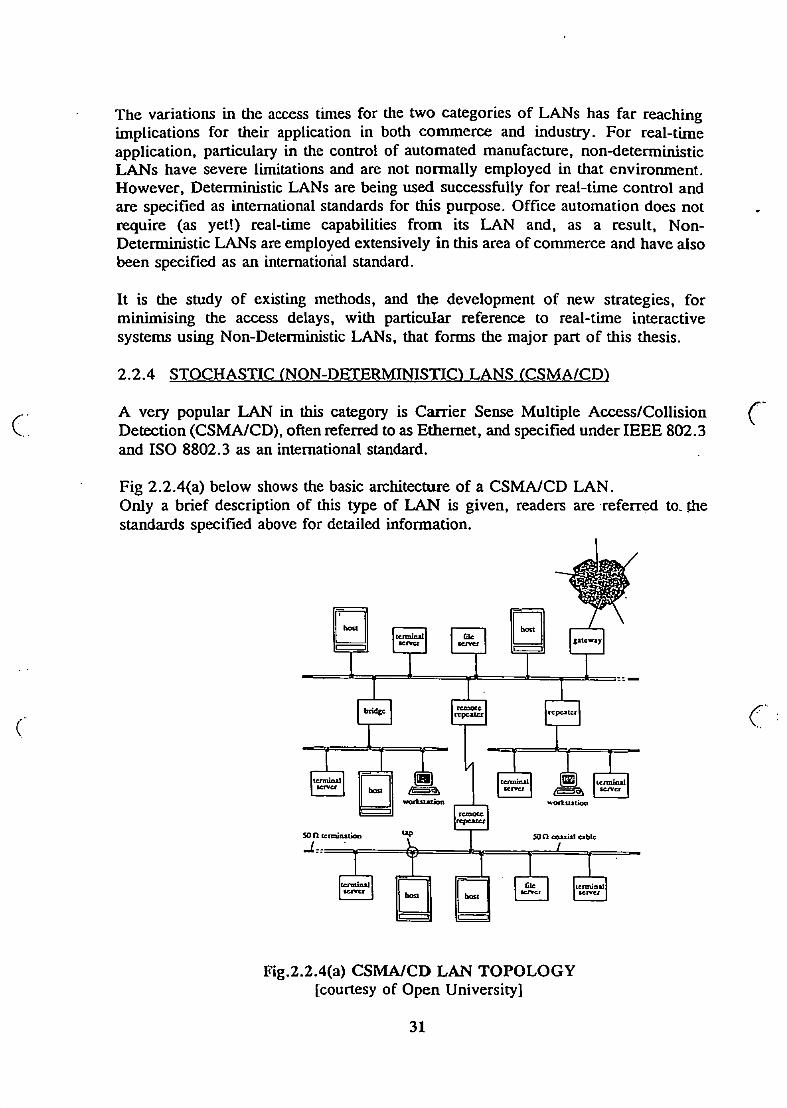
2.2.4 STOCHASTIC (NON-DETERMINISTIC) LANS (CSMA/CD)
A very popular LAN in this category is Carrier Sense Multiple Access/Collision Detection (CSMA/CD), often referred to as Ethernet, and specified under IEEE 802.3 and ISO 8802.3 as an international standard.
Fig 2.2.4(a) below shows the basic architecture of a CSMA/CD LAN. Only a brief description of this type of LAN is given, readers are referred to. the standards specified above for detailed information.
1
Son boit
1
Son tcnuinil tcrtct •crvcf
boit
' —' tcnuinil tcrtct •crvcf
1 • - .1
brid(c remote repciter fcpcitct
SO n unaituikKi up
tcnmiul icnnitul K T V C f server
remote rcpcuer
jtenniiu] tcrve.1
workiuiioa
son couiil able /
Gle icrvcr tcnniaal
Fig.2.2.4(a) CSMA/CD LAN TOPOLOGY [courtesy of Open University]
31
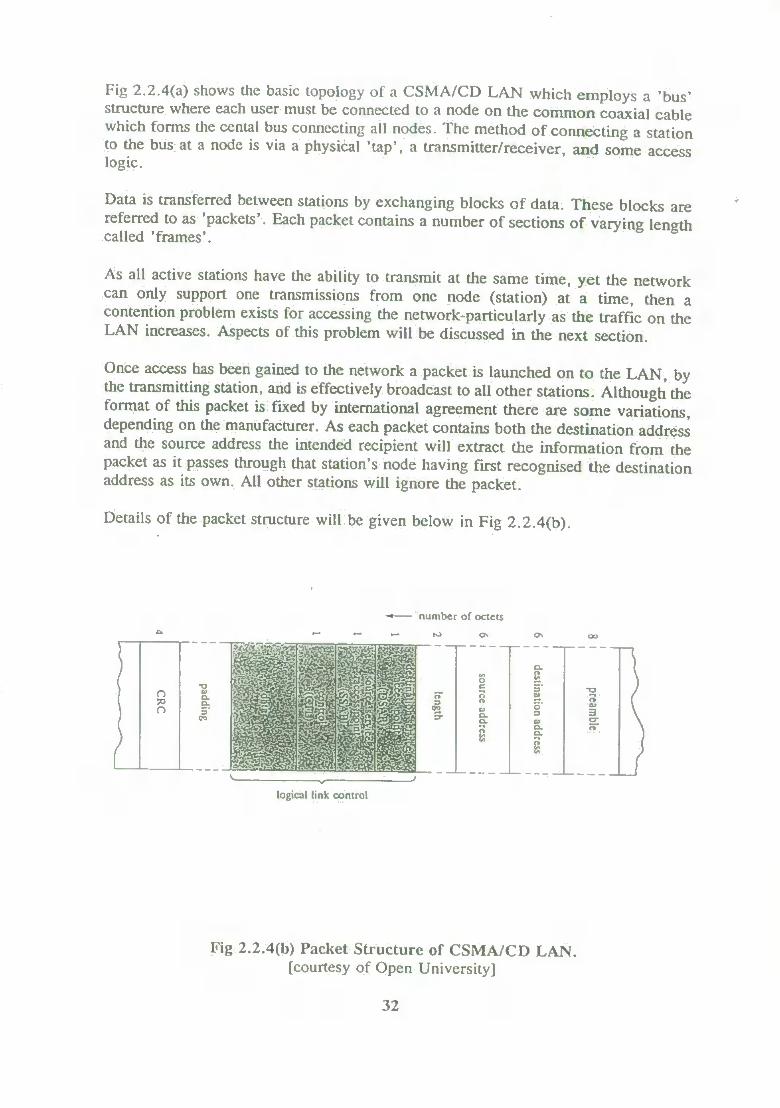
Fig 2.2.4(a) shows the basic topology of a CSMA/CD LAN which employs a 'bus' structure where each user must be connected to a node on the common coaxial cable which forms the cental bus connecting all nodes. The method of connecting a station to the bus at a node is via a physical 'tap', a transmitter/receiver, and some access logic.
Data is transferred between stations by exchanging blocks of data. These blocks are referred to as 'packets'. Each packet contains a number of sections of varying length called 'frames'.
As all active stations have the ability to transmit at the same time, yet the network can only support one transmissions from one node (station) at a time, then a contention problem exists for accessing the network-particularly as the traffic on the LAN increases. Aspects of this problem will be discussed in the next section.
Once access has been gained to the network a packet is launched on to the L A N , by the transmitting station, and is effectively broadcast to all other stations. Although the format of this packet is fixed by international agreement there are some variations, depending on the manufacturer. As each packet contains both the destination address and the source address the intended recipient will extract the information from the packet as it passes through that station's node having first recognised the destination address as its own. All other stations will ignore the packet.
Details of the packet structure will be given below in Fig 2.2.4(b).
number of ortcts K > O N
-J
s
logical link control
Fig 2.2.4(b) Packet Structure of CSMA/CD LAN [courtesy of Open University]
32

2.2.5 ACCESS METHODS FOR CSMA/CD LANs
The time to gain access/control of the network is a crucial issue in real-time systems, and is obviously dependant on the level of usage (traffic) on the LAN. In addition, there is the likelihood of collisions occurring during the initial 'seizing' phase, which is also traffic dependant. Collisions will occur when two or more stations try and seize the network simultaneously, or witliin a given time window (dependant on the lengtli of the LAN)
To gain access/control of the network, where only one user can transmit (successfully) at a time, a set procedure must be adopted, this is outlined below:-
'Listen' to establish if the network is in use:
- i f yes - keep listening - i f no - wait for a short period-then transmit the packet ^
monitor the transmission of your packet by using the 'receiver' in the node hardware to look for collisions see below (*) for explanation.
If after a given time-widow no collisions have occurred then control of the network can be assumed and transmission of the packet can be completed.
* A collision condition exists when the transmitted data is different from that being received, in that two simultaneously transmitted packets have collided resulting in the data becoming corrupted. Once this has been detected the station access logic will stop transmitting the initial packet immediately and instead send a 'jamming packet' indicating to all stations that a collision has occurred and that any data received should be ignored. The two stations involved in the collision will then 'back-off for a given amount of time controlled by an Exponential Back-Off Algorithm before trying again. The algorithm is such tliat it prevents these two stations from colliding again by giving them different back-off times. However, if in the mean time, further collisions have occurred as a result of other stations attempting to gain access to the network, the algorithm will give those stations that have been trying for the longest time priority in accessing the network over those who have just started making attempts to gain access.
The implications of employing this access methodology, as far as real-lime operations are concerned, is a major cause of concern. As a result the applicability of CSMA/CD, to real-time control and real-time speech systems, is severely limited unless special steps are taken to give packets containing speech bytes priority. These issues are discussed at length later in this thesis, and various methodologies for reducing the access time on CSMA/CD LANs are proposed and evaluated.
33

2.2.6 APPLICATIONS OF CSMA/CD LANs IN OFFICE AUTOMATION (OA^
In spite of their lack of suitability to real-time operations CSMA/CD LANs, in the form of Ethernets, are very popular as an 'entry-level technology' into Office Automation, as access time (within reason) is not usually an important issue in this area of commercial/industry. There is, in fact, a very large installed base of CSMA/CD LANs in the U.K.. Europe and the U.S.A. provided by a very wide range of manufactures, both big and small, all offering variations on the main Ethernet theme in an attempt to gain a competitive edge.
One of the reasons for the popularity of CSMA/CD in the area of OA is that the technology is well known, well supported, relatively simple/straight forward and hence reliable. In addition, the LAN performs adequately in terms of access delays provided the traffic levels remain below approximately 30% of the maximum bit rate [REF-3] (the IEEE 802.3 standard recommends 10 Mbps as the maximum bit rate).
As a result of the popularity of CSMA/CD a protocol stack has been adopted as a standard to aid compatibility between OA systems. This protocol is called the Technical Office Protocol (TOP) and is usually implemented on CSMA/CD LANs and used in an office type environment.
Given that the aim of this research project is to investigate the possibility of fully integrating real-time interactive speech and data on the same LAN, or LANs, thus providing a powerful communication medium between the design office and the shop fioor, then a major issue is to first identify, then quantifying the delays inherent in OA networks, followed by the development of strategies to minimise their effect particularly on real-time systems in an OA environment. These issues are addressed in later sections of this thesis.
2.2.7 DETERMINISTIC LANS (TOKEN PASSING)
There are two basic categories of Token Passing LANs they are:-
(a) Token Passing Ring - IEEE 802.5 / ISO 8802.5
and
(b) Token Passing Bus - IEEE 802.4 / ISO 8802.4
With both of these systems, access to the LAN is controlled, and achieved in an orderly manner by the passing of a 'token* between the stations connected to the LAN. A station can only transmit when it holds the token. On completion of a transmission of data the station concerned will then release the token and effectively 'pass' the token to the next station in the predetermined sequence. A brief outline of these procedures is given in the next section.
34

2.2.8 ACCESS METHOD FOR A TOKEN PASSING RING LANs
Fig 2.2.8(a) below shows the topology of a ring structured system and indicates a typical sequence in which the token could be passed from station to station (in the form of a 'logical' ring).
momcor
Figure 6.8 Token ring
Fig.2.2.8(a)Topology of a Token Passing Ring [courtesy ofthe Open University]
• The packet structure of the Token Passing Ring is similar in structure to CSMA/CD but does differ in several-important ways, particularly in relation to the token, see Fig 2.2.8(b) below.
number of oacis V o o»
C"
end
o
8
start cx o vt M &
n
aitu
iji »ntn
—
-1 <> "1
Fig.2.2.8(b)Packet Format for the Token Passing Ring [courtesy of the Open University]
35

2.2.9 ACCESS METHOD FOR A TOKEN PASSING BUS T.AN<:
Fig 2.2,9(a) below shows the topology of the bus structured system and indicates a typical sequence in which the token could circulate around the ring'
P = Predecessor S = Successor
A - C P « C S = D
P = B S « A
.
Bus
B D B P = D S = C
Lo^cal ring
D P = A S = B
Fig.2.2.9(a)Topology of a Token Passing Bus L A N (showing a typical token ring sequence)
[courtesy of Rodd & Deravi]
The packet structure shown in Fig 2.2.9(b) below is similar to both that of CSMA/CD and Token Passing Ring, but does differ in a number of important areas.
•
FIG 2.2.9(b)Packet Structure of Token Passing Bus
1 or more bytes PREAMBLE 1 Byte START DELIMITER 1 Byte (TOKEN) FRAME CONTROL 6 Bytes DESTINATION ADDRESS 6 Bytes SOURCE ADDRESS Length is application dependent
DATA UNIT
4 Bytes FRAME CHECK SEQUENCE 1 Byte END DELIMITER
TOKEN FRAME 0 0 0 0 1 0 0 0
36

(
PHYSICAL COMPONENTS FOR THE TOKEN RING
There are three different media defined within tlie token bus specification, depending on the users requirements. Each uses a different topology, employs a different data encoding techniques, and runs at different speeds.
The first is a simple linear bus, using 75 cable, witli station attached via very short 'stub* cables. It employs Manchester encoding and a form of frequency shift keying (FSK). termed 'continuous phase*, in which the translations between the signalling frequencies are performed by a continuous change of frequency rather than a step change. It operates a single channel at 1Mbps, modulated onto a single frequency.
The second is also a broad band network, using a different form of FSK called 'phase coherent' - the frequency changes are made when the carrier signal has a zero voltage - and offering a choice of frequencies, depending on the speed required. It operates over a tree-structured topology, but with no active headend, and can be run at 5Mbps or 10Mbps. (
Unlike the first two, the third version offers multiple channel operation, over a full broadband network, with speeds of either 1Mbps, 5Mbps or 10Mbps.
In the next section the application of the token bus and ring LANs are outlined witli particular reference to manufacturing and the need for guaranteed response times.
2.2.10 APPLICATION OF TOKEN PASSING LANs TO AUTOMATED MANUFACTURE.
Due to the deterministic nature of this category of LAN it has been adopted as a standard in the manufacturing industry, particularly for process control. The Token Passing Bus LAN has been adopted to support a protocol set especially designed for automated manufacturing. The name of this protocol is the Manufacturing Automation Protocol (MAP), and it is currently on version 3.0. Details of this standard are given in Appendix VI I I , with a brief explanation in Section 2.2.11 following.
The MAP version 3.0 can be implemented on the different types of Token Passing Bus LANs briefly referred to at the end of the last section. These are more conunonly known as :-
(a) Broadband semi-rigid coaxial cable - 75 coaxial cable up to 400MHz
(b) Baseband flexible .. -50 10Mbps (c) Carrierband - between (a) and (b)
The Broadband option offers a range of information channels all carried on the same cable using Frequency Division Multiplexing (FDM) techniques, o|>erating completely separately and suitable for supporting services such as speech, data, vision etc. The FDM approach enables each channel to be accessed separately, however, the
37

complexity of the nodes results in greater system costs because of the high performance modulators/demodulators (modems) required. The head-end amplifiers required for dual cable operation, or the retransmission facility necessary for single cable operation, add substantially to the overall system cost.
A detailed explanation of the operation of Broadband LANs can be found in Reference 4.
Fig 2.2.10 (a) below indicates die basic structure of a Base Band and a Broadband system
Bandwidth
Unutilised medium bandwidth-(e.g. coaxiat cable)
Baseband transmission system
A Bandwidth
Broadband transmission system
Time
Channel n
Channel A
Channel 3
Channel 2
Channel 1
Time
Fig.2.2.10 (a) Broadband Basic System FDM Arrangements [courtesy of Kaufells Bib-99]
38

Hcad-cnd amplifier Tap
•Q
r7 I r Signal in Signal out
Dual-cable configuration
Central retransmission facility
c •
Signal out
c R..f. modem
Signal in
I L I HI«Bandspl i t t cr Le^Low-frcqucncy band
H = High-frequency band
Single-cable configuraiion
(a)
Fig.2.2.10 (b) BroadBand Basic System Cable Configurations
(1) Dual-cable working (2) Single-cable working
[courtesy of Rodd Ref 4]
Carrierband employs the mid-ground between the high capacity/high cost Broadband systems and the lower capacity/lower cost Baseband systems. A simplified analogue transmission can be achieved if neither FDM nor amplifiers (shown above) are used. In such a Carrierband system, bidirectional transmission, using bus topology, is possible because the use of amplifiers is ruled out. As a result there is no need for a head end. As FDM is not used, a modem with far less stringent specifications would be adequate because there is no need for complex band-limiting stages in the modem to limit the spread of energy. Clarrierband therefore offers a competitive performance to baseband systems at a comparable price, with higher noise immunity.
c
39

Reference 4 offers a detailed explanation of the operation of Carrierband LANs.
Broadband Versus Baseband
Baseband systems have the advantage of simplicity, and therefore reliability at a lower cost. The passive nature of the medium and its easy installation make it ideal for rapid evolving applications. The disadvantages of Baseband include its limitations in capacity and range. Precautions must be taken to avoid subjecting the cable to external noise sources.
Broadband technology offers an enormous capacity, with the possibility of partitioning a system into isolated services. The use of amplifiers gives Broadband its very wide area coverage. Also, because the system is based on proven Conununity Anterma TV (CATV) technology, expertise and components are readily available. However, it should be remembered that CATV was designed and is operated as a unidirectional system (signals travelling from the antenna to TV) whereas Broadband systems can be bidirectional if even only one cable is employed.
Broadband systems are much more complex than Baseband to install and maintain and there may be a need for redundancy to increase reliability. The initial installation must include the setting of all amplifiers and taps, followed by periodic testing and alignment of all network parameters, using specialised tools. The unidirectional nature of the dual-cable broadband system implies that the average propagation delay between stations is twice that for comparable Baseband systems.
2.2.11 MANUFACTURING AUTOMATION PROTOCOL (MAP)
Undoubtedly one of the most significant influences on CIM has been the initiation by General Motors of the MAP exercise [Ref 100]. Although certain aspects of its technological appropriateness have been hotly disputed, MAP has begun an extremely important process which will have world-wide ramifications. Above all, MAP attempts to bring some sanity into a situation which is currently a 'technological jungle* of networks, protocols and interface standards which only the brave dare enter. Whilst it will be some years before MAP becomes a universally accepted and economically viable solution, it is crucial to understand it and its underlying philosophy. -
FUNDAMENTAL ISSUES IN MAP
(i) Design Issues
The objectives which the MAP group set out [Ref 100] can be summarised as follows. Their aim was to provide:
* A communications link capable of sending messages and commands between two or more computer-based systems,
* Facilities to ensure that messages get to the correct destination and that they are not corrupted.
40

c.
* The ability to send information files between systems which may structure their internal files completely differently.
* A common format in which commands to various low-level controllers, such as robot systems, automatic guided vehicles, etc., can be expressed (i.e. common language to support shop floor-level control).
In essence, MAP sets out to allow one application program to communicate with another, where the two programs could reside in totally different computing systems, coimnunicating over both long/short distances. MAP has had to propose formats for the transmission of data, right from the highest level. It does not try to establish a programming language. Instead, it says that to meet the MAP specifications, any user program must produce the information which it requires to send in a specific format, in terms of its data structures, etc. In the end. the user program and the application program on some distant node will see the whole MAP structure as transparent in line with the OSI philosophy.
(ii) Practical Realities
The basic communication media that have been adopted in MAP are:
(a) the broadband coaxial cable (for both Broadband and Carrierband systems)
and
(b) optical fibre
which provides the physical communication between the various computing devices. Note that TOP can, of course, mn on a lighter-weight coaxial cable, as used within, say, Ethernet. The selection by MAP of the broadband cable was based on the concept that on such a structure a multiplicity of channels can be created [Ref 100]. MAP, in fact, uses 12 channels 6 in-bound and 6 out-bound. This means that the following information systems could all be supported, for example:
MAP could mn over two or three channels, video signals for vision recognition systems/security cameras over another two charmels, and maybe point-to-point high speed data links/fast access systems (minimal delay). TOP (Technical Office Protocol for office automation) signals.
It is technically feasible to transmit speech over the spare channel, this facility will be discussed at length later in this thesis.
The communication system is therefore true Frequency Division Multiplexed(FDM) and offers many attractions. The broadband cable itself is fairly rigid with a bending radius of approximately 0.5m at room temperature. Normally its characteristic impedance is 75 and, physically, it is 13nrun in diameter. More detailed information has been provided earlier in this chapter on the construction of the Physical layer. It
41

is, however important to note that in a factory, the cable will probably be run in a false ceiling/the roof space, in conduit where safety is important, while in offices it may run under the floor. As a result a number of situations inherently incorporate their own shielding and provide good protection from electromagnetic interference. However, areas in close proximity to high current carrying devices which are being switched, additional shielding is often required. It is in situations such as this that optical fibre systems offer considerable advantages. These will be discussed at length in Section 2.2.13.
The use of 'taps* for connection to the coaxial cable, and 'head-end remodulators' to change the frequency of the channels in the Broadband system has already been described. However the reliability of these components is an important issue where the functionality of a complete factory is dependant on the LAN supporting the MAP/TOP information system employed to coordinate automated manufacture. As a result, i f reliability is critical (and it should always be), then head-end devices would have to be duplicated; in fact, it is current practice to duplicate the whole network, such is the importance of modem information systems to the viability of companies.
The technology is. however, by no means cheap, and one of the biggest drawbacks to the use of broadband is its sheer cost. For this reason. MAP has proposed a subsidiary bus structure, intended for use at 'entry level* into automated manufacturing, thus reducing the initial cost. This system offers a lower level of sophistication i.e. not forming the major backbone of an installation but providing, say, a network interconnecting various cell controllers. It is proposed that this be based on a Carrierband approach, whereby a lower-cost coaxial cable may be used, offering single-channel capability and typically running at 5Mbps rather than the 10Mbps adopted on the current broadband proposal. The adoption of so-called 'carrierband MAP' clearly has many financial advantages, although it loses some of the true broadband approach.
Fig 2.2,11(a) overleaf indicates the physical layout of a typical broadband MAP network.
42
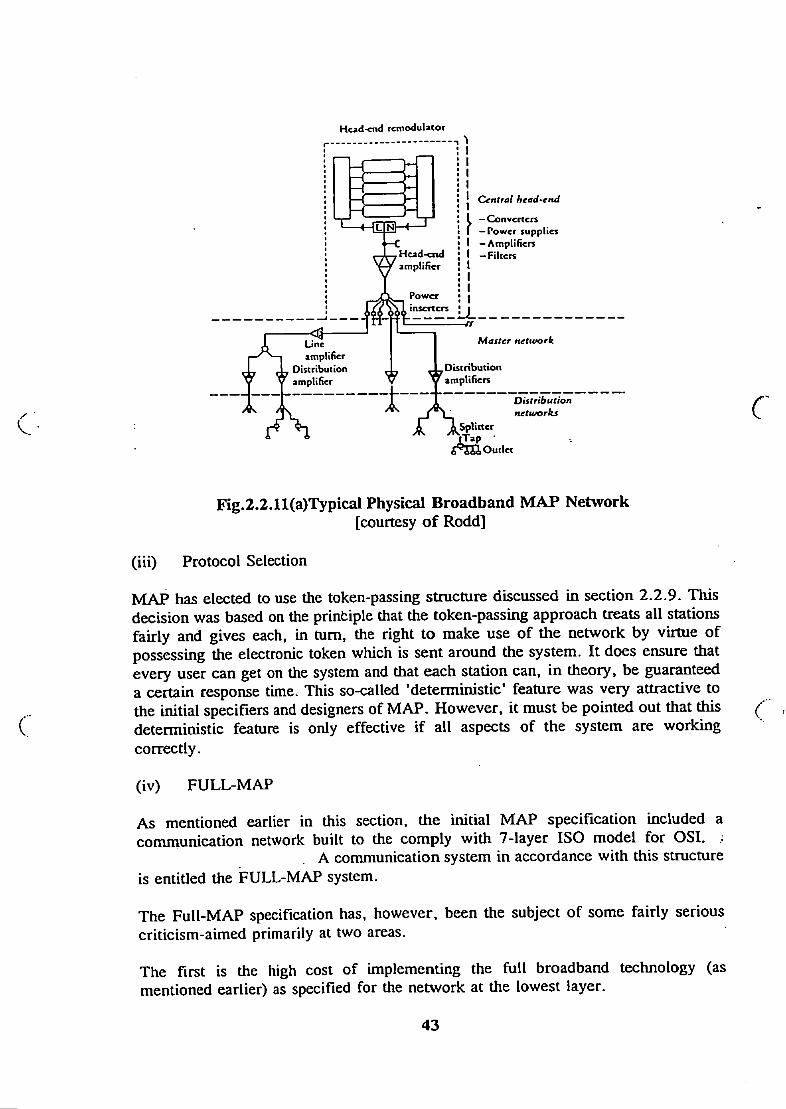
Hcad-cnd rcmoduUcor
Central head-erui
: Power supplies I —Amplifiers
Hcad-cnd amplifier
Filters
nserxers
X Une amplifier
r*7 m Distribuiion y Y amplifier
± Master nettvork
^Dis tr ibut ion Y amplifiers
_ Distribution networks
.Outlet
c
Fig.2.2.11(a)Typical Physical Broadband MAP Network [courtesy of Rodd]
(iii) Protocol Selection
MAP has elected to use the token-passing structure discussed in section 2.2.9. This decision was based on the printiple that the token-passing approach treats all stations fairly and gives each, in turn, the right to make use of the network by virtue of possessing the electronic token which is sent around the system. It does ensure that every user can get on the system and that each station can. in theory, be guaranteed a certain response time. This so-called 'deterministic' feature was very attractive to the initial specifiers and designers of MAP. However, it must be pointed out that this deterministic feature is only effective if all aspects of the system are working correctly.
(iv) FULL-MAP
As mentioned earlier in this section, the initial MAP specification included a communication network built to the comply with 7-layer ISO model for OSI.
A conununication system in accordance with this structure is entitled the irULL-MAP system.
The Full-MAP specification has. however, been the subject of some fairly serious criticism-aimed primarily at two areas.
The first is the high cost of implementing the full broadband technology (as mentioned earlier) as specified for the network at the lowest layer.
43
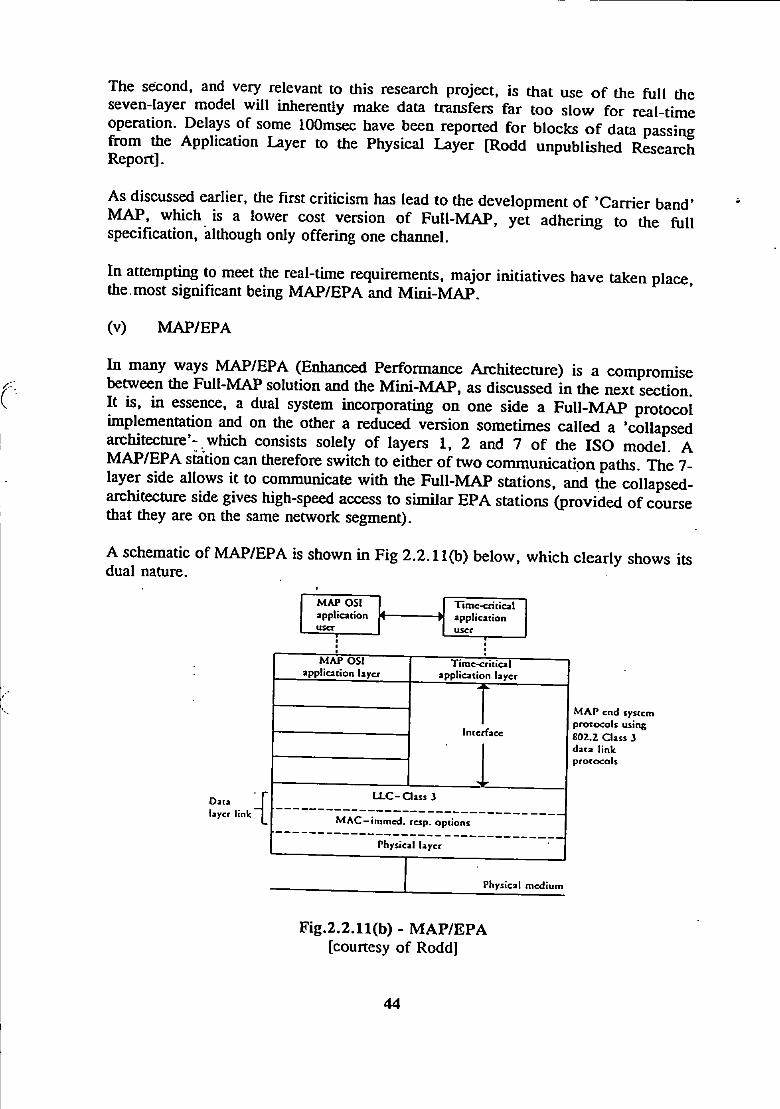
The second, and very relevant to this research project, is that use of the full the seven-layer model will inherently make data transfers far too slow for real-time operation. Delays of some 100msec have been reported for blocks of data passing firom the Application Layer to the Physical Layer [Rodd unpublished Research Report].
As discussed earlier, the first criticism has lead to the development of 'Carrier band' MAP, which is a lower cost version of Full-MAP, yet adhering to the full specification, although only offering one chaimel.
In attempting to meet the real-time requirements, major initiatives have taken place, the. most significant being MAP/EPA and Mini-MAP.
(v) MAP/EPA
In many ways MAP/EPA (Enhanced Performance Architecture) is a compromise between the Full-MAP solution and the Mini-MAP, as discussed in the next section. It is, in essence, a dual system incorporating on one side a Full-MAP protocol implementation and on the other a reduced version sometimes called a 'collapsed architecture'- which consists solely of layers 1, 2 and 7 of the ISO model. A MAP/EPA station can therefore switch to either of two conmiunicatipn paths. The 7-layer side allows it to communicate with the Full-MAP stations, and the collapsed-architecture side gives high-speed access to similar EPA stations (provided of course that they are on the same network segment).
A schematic of MAP/EPA is shown in Fig 2.2.11(b) below, which clearly shows its dual nature.
MAP osi application user
Time-critical application user
Data layer link
, ! ^ _ : MAP OSI
application layer Time-critical
application layer J
rface Intc rface Intc rface Intc rface
L L C - a a s s 3
M A C - i m m c d . rcsp. options
Physical layer
Physical medium
M A P end system protocols using 802.2 Class 3 data link protocols
Fig.2.2,ll(b) - MAP/EPA (courtesy of Rodd]
44
It is important to note that the Full-MAP structure, as shown on one side has no apparent restrictions or reductions. However, this is not, in practice, as simple as it appears! It must be noted that MAP/EPA uses the Logical Link Control Class 3 protocol, which is a superset of LLC Class 1. This means that an EPA station can operate with either an acknowledged connectionless (Type 3) service or a simple connectionless (Type 3) service. Also, it wil l offer a Token-Bus Medium Access Control (MAC) with immediate response (IR), together with a Token-Bus MAC without IR! A MAP/EPA station must, however, be able to revert to being LLC Class 1. with a simple Token-Bus MAC, i f it is to communicate with a FuU-MAP station.
The initial assumption made when designing this architecture was that network access time (NAT) was of prime concern. It was initially estimated, that the worst-case NAT was in the region of 50msec, this having been specified in an earlier standard issued by a section of the process-control industry. The MAP/EPA specification was for a LAN that was supporting 32 nodes, with a total length of less than 1km. Because the network was smaller than that proposed by the process-control industry, it was ^
V . suggested that an access time in the order of 25msec might be obtainable. It was also assumed that messages in the application would typically be around the 16 to 20 byte length. Also important in the specification of EPA was the fact that some nodes on a time-critical network might require a response to a message within less than one token-rotation of the network. To achieve this possibility, an immediate response-acknowledgement service was required. In EPA these services allow for a node to receive message delivery acknowledgements (or data replies from a remote station whilst the local station still holds a token, i.e. a message can be transmitted and an acknowledgement immediately returned before the token passes on to the next station.
An other point which is currently being considered relates to redundancy. Other standardisation committees are working on the problem of redundant cable implementation, since cable breaks and other degradations are among the most common problems met within a factory environment. When these bodies (such as Proway and IEEE 802. Committee) produce standards, these will be included with MAP/EPA.
Section 2.2.12 dealing with FDDI I / I I describes how a dual Token-passing ring optical fibre system provides a measure of protection against such cable breaks.
It must be pointed out that by going to the reduced version of MAP, i.e. the model bypasses layers 3-6, the applications layer has to interface directly with the data link layer. As a result, many of the services which would normally be available from these omitted layers are now not available to the system. This results in several major drawbacks. There is clearly no guarantee that the message will be delivered, and those messages which are delivered are confined to the local segment of the network. Also, messages are restricted to the maximum size of the data link unit, and only one outstanding message is possible at any one time.
45

In terms of the transmission of real-time interactive speech, the loss o f layers 3-to-6 in favour of considerable improved (reduced) NAT is not as disastrous as would first appear because the speech packets do not normally require acknowledgement, nor do they need packetising like large data transfers. In addition, the initial implementation of real-time interactive speech systems will almost certainly be confined to the local segment of the LAN until delays through gateways/bridges/routers can be substantially reduced to meet end-to-end delay criteria specified later in this thesis.
(vi) MINI-MAP
Mini-MAP is essentially one side of the MAP/EPA discussed above. I t is completely non-MAP compatible and was designed for the applications which do not necessarily require the full range of MAP services, essentially at cell level. Above all. it was designed to interconnect low-cost devices via a time-critical network which could ultimately be Imked to a Broadband or Carrierband MAP spine by means of a MAP/EPA station. This facility could be used to inject and recover real-time interactive speech to and from the LAN, i f the time taken for speech packets to negotiate the full 7 layers of the ISO stack is too great. The main problem is, however that a Mini-MAP station can only communicate with either another Mini-MAP station or the time-critical side of MAP/EPA station as illustrated in Fig 2.2.11(c) below.
Timc-crirical application
Interface
L L C
M A C
Physical layer
Physical medium
Figure 7.4 M i n i - M A P
Fig.2.2.11(c)MlNI-MAP [courtesy of Rodd]
46

2.2.12 OPTICAL-FIBRE SYSTEMS
An optical fibre is a thin, flexible strand of transparent material capable of carrying modulated light rays at frequencies in, and adjacent to, the optical band ( approximately 10*14Hz). The fibre can be made from glass or plastic. The former is more brittle but offers considerably less transmission loss, whereas the latter is more flexible but subjects the optical signal to more attenuation en route. The basic fibre, which is only as thick as a human hair, is 'cladded' with a plastic raaterizd of slightly lower refractive index than the actual fibre. The modulated light beam, containing the information to be transmitted, is launched from an optical source into the end of the fibre in such a manner that the angle made between the light beam and the axis of the fibre should be as low as possible so as to retain the optical signal within the fibre by using the principle of total internal reflection at the boundary of the fibre and the external cladding. Light sources currently employed are:-
(a) Lasers for long distance communication using high purity mono-mode glass r C. fibre •
or
(b) Light Emitting Diodes (LEDs) for lower-cost general purpose systems.
An indication of the advantages of optical fibre over traditional cable systems in the form of twisted-pair and coaxial cable, is that British Telecom have currently in operation an optical system running at 150Mbps over distances of lOOkms without any form of intermediate regeneration (amplification) being employed. A conventional cable system would require regeneration of the signal at these data rates every 5kms. The saving this represents in cabling cost alone makes optical systems the preferred choice over existing cable systems, yet optical technology is still in its infancy. The Japanese have recently reported that NTT (Japanese BT) have an unregenerated 150Mps system operating at 200kms!
Optical systems are not without their draw-backs in this early stage of development. One such disadvantage is that it is very difficult to make a 'tap'(connection) onto a fibre as required in a bus-type network. As a result the fibre has to be taken in to a node and converted into an electrical signal, where the 'tap' is made, and then converted back into an optical form for retransmission to the rest of the network.
There is a considerable amount of research activity currently being expended in an attempt to make an 'optical coupler' similar to the simple wire tap. Varying degrees of success have been reported in this area, but as yet, those devices produced are very wavelength-dependant resulting in narrow bandwidths. Success in eventually producing optical-couplers (taps) will result in the removal of one of the great advantages that optical fibres have over traditional cable systems in the area of security against unlawful monitoring. Currently, anyone wishing to illegally tap into an optical fibre system must first break the fibre. This action is instantly detectable. Optical couplers will, however, allow information to be 'leaked' from the system unknown to the operating authority unless extremely sophisticated time-domain
47
(

reflectometers are employed to continually monitor reflections on the fibre.
As a result optical fibre is currently best suited to point-to-point links and is therefore particularly useful in the construction of ring topology networks where each section of the ring can be considered as a point-to-point link! Fibres are also employed as a Back-Bone spine for bus structures.
The Fibre Distributed Data Interface (FDDI) is an emerging standard for one such ring with a data rate of 100Mbps ' with reports of a 200Mbps being under consideration by various standards bodies.
In the following sub-sections the architectures of two popular optical fire LANs are shown with a detailed explanation given in Appendix IX.
(a) OPTICAL FIBRE ARCHITECTURES FOR LANS
IEEE have produced two standards incorporating optical fibre at the physical layer in LANs, they are:-
(1) Token Passive Star
As it is virtually impossible at this time to coimect a passive tap to a optical fibre cable, a solution is to me a 'star* - either active or passive. I n the option recommended by MAP each node is connected to a central hub by two optical fibres -one for transmitting signals to the hub, and the other for receiving signals from the hub. as shown in the Fig 2.2.12(a) below. The hub or, the 'central coupler', accepts signals from the transmitting node and distributes them evenly along the receiving fibres to all the nodes on the network.
Signal path
Coupler Reception fibres
iransmission fibres
Transmitdng node
Fig.2.2.12(a)Token Passive Star
48
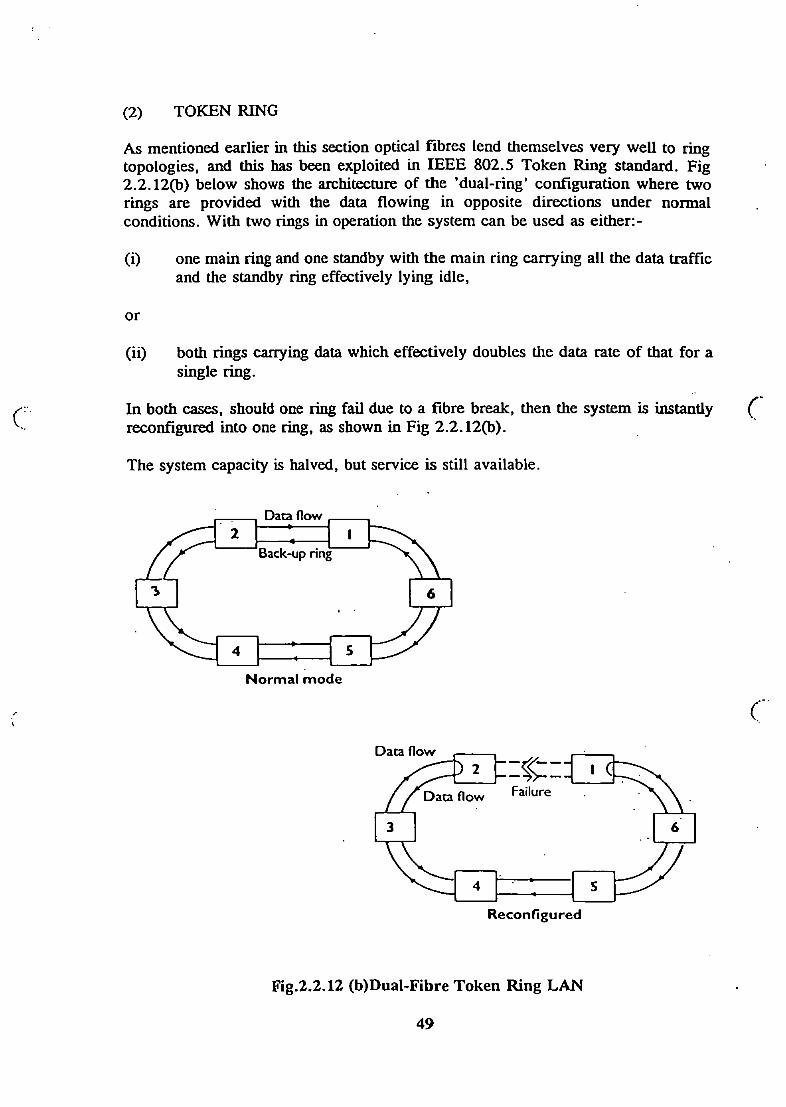
(2) TOKEN RING
As mentioned earlier in this section optical fibres lend themselves very well to ring topologies, and this has been exploited in IEEE 802.5 Token Ring standard. Fig 2.2.12(b) below shows the architecture of the 'dual-ring' configuration where two rings are provided with the data flowing in opposite directions under normal conditions. With two rings in operation the system can be used as either:-
(i) one main ring and one standby with the mam ring carrying all the data traffic and the standby ring effectively lying idle.
or
(ii) both rings carrying data which effectively doubles the data rate of that for a single ring.
In both cases, should one ring fail due to a fibre break, then the system is instantly reconfigured into one ring, as shown in Fig 2.2.12(b).
The system capacity is halved, but service is still available.
Data flow
Back-up nng
Normal mode
Data flow
Failure Data flow
Reconfigured
Fig,2.2,12 (b)Dual-Fibre Token Ring LAN
49

FIBRE DISTRIBUTED DATA INTERFACE (FDDI)
FDDI is being promoted by the American National Standards Institute's X3T9.5 working group, which is charged with examining high speed communications. They have concentrated on the physical and MAC layers, along with station management, choosing to model the LAN on the IEEE 802.5 Token Ring (as indicated previously). There are, however, many dissimilarities, the first being that there are no limits on the number of stations nor on size of the ring. This will vary depending on the application, but rings of 500 stations, spreading over 100km, will be possible. The raw data rate of 100Mbps will mean significant performance differences over current LANs.
The network is configured as two rings, as mentioned previously, with data also flowing in opposite directions in the primary (main) and secondary (standby) circuits. In some cases both rings can be used simultaneously, but with FDDI the secondary will only be used if the primary fails. Because it is expensive to connect each station to two rings, two classes of station have been defined. Class A stations - see Fig 2.2.12(c) - will be able to connect to both rings, but simpler Class B stations - see Fig 2.2.12(d) will only be connected to one or other of the rings.
LLC
MAC
Physical physical
^Bypass System^
t I I r To both Rings
Fig.2.2.12(c)- Class A Station
MAC
Physical
Fig.2.2.12(d)- Class B Station
50
To single Ring

An extension of the Class A station, shown in Fig 2.2.12(e), has also been defmed to give the same sort of functionality as a wiring concentrator of the token ring. Tliis enables Class B stations to be logically attached to both main rings, as the concentrator will route the traffic to whichever ring is in use.The concentrator is already being seen as an enabling star or tree style topologies to be adopted, where this more appropriate than the ring.
LLC
MAC
Physical Physical
^Bypass Systemj
• I I t To twth Rings
Physical
Physical
Physical
>• To Class B ^ Stations
Fig.2.2.12(e) Class a FDDI station configured as a concentrator
Because of its very high speed, FDDI was originally seen as a type of back-end network, used to connect mainframe CPUs to fast peripherals, such as discs, usually within a computer room, or even several computer rooms many kilometres apart. As it has developed, however, it is apparent that the concentrator mechanisms will permit FDDI to be used as a high speed backbone L A N , connecting a number of slower ISO LANs. As air the LANs are compatible from the LLC layer upwards, and as the FDDI data rale could support traffic from several such LANs without degradation, such a configuration as shown in Fig 2.2.12(f) becomes a possibility.
FOOmACK-ENO
CPU CPU CPU
RXXOACKOONE
Nil
CSUMOOW*
Fig.2.2.12(f) Example of FFDI as a Backbone and Back-end LAN.
51

The previous diagram shows a PABX connected to the FDDI backbone. This is possible if the most recent work, dubbed FDDI I I . is adopted. In this scheme, the 100 Mbps channel would be divided into 16 channels each of 6.144Mbps. plus a control channel. As this is a convenient multiple of both the US and European voice rates, it is being pursued with great interest on both side of the Atlantic.
With the immense bandwidth/data rates that FDDI systems wil l offer in the future it is more than likely that each service (speech, vision, data, etc) wil l be allocated its own wavelength, using wavelength division multiplexing(WDM). This wi l l effectively be a super-broadband system hopefully offering all the advantages of broadband(CATV). but at a much lower cost when the optical technology reaches maturity.
With the comprehensive range of advantages that optical fibre offers over coaxial cable systems it is hardly surprising that MAP 3.0 has embraced optical technology so as to provide a LAN that functions error free in the hostile environment of the shop floor.
2.2.13 MAP 3 0 AND OPTICAL FIBRE SYSTEMS
As a candidate for MAP's Physical Layer, fibre optics has many advantages over conventional cable, they are:-
a. light weight b. very low attenuation c. very high data rates d. long distance communication without regeneration e. immune to electrical noise-f. intrinsically safe in hazardous environments g. unaffected by lightning h. secure from authorised tapping i . ideal for networks requiring isolation between different electrical
ground planes.
MAP acknowledges these attractions by including framework recommendations for a fibre-optics Physical Layer in an Appendix to the Specification. Once the Standards are technically stable, and enough experimental feedback has been gathered on usage, the intention is to accept the new medium for use * in all MAP networks where it is appropriate'.
At the time of writing Appendix 6, written by the European MAP Users Group (EMUG), contains the recommendations to date.
52

MAP OPTIONS
MAP 3.0 specifies two alternatives for its Physical Layer:
(a) IEEE 802.4 Token-Passing Bus on Broadband 10Mbps
(b) IEEE 802.5 Token-Passing Ring on Carrier Band 5Mbps
To these the EMUG Working Group 2 Appendix 6 adds the following optical-fibre options:-
IEEE 802.4 Token-Passing Bus on Fibre 10Mbps
IEEE 802.5 Token-Passing Ring on Fibre 16Mbps
Extensions to the 802.4 and 802.5 Standards, to cover the options, are being developed, and to help make migration between them easier, the emerging of IEEE 802.8B reconunendations on the installations are specified for each.
IEEE 802.4 TOKEN BUS
The IEEE 802.4 Working Group considered the three main configurations for a fibre-optics Physical Layer:
(a) linear active bus
(b) passive and active star (see Fig 2.2.12(a))
The EMUG Working Group concluded that the linear active bus had no significant advantages over the passive star or dual ring, discussed below.
C The following IEEE 802.4 implementation is recommended for investigation in MAP Appendix 6:
Data rate: 10Mbps
Configuration: Single passive star with up to 32 ports
Cable: Dual-window (850 and 1300nm), with a loss of not more than 3dB/km(850nm) and 1.3dB/km(1300nm).
Power budget: High-Sensitivity (30dB)
Window length: 850nm
Preferred fibre size: 62.5/125(ratio of core diameter to cladding diameter - both in micrometers[um])
53
r

It is not as economically a viable a proposition (at the time of writing) to tap an optical-fibre cable as it.is a coaxial or twisted pair cable. A solution is to use a star -either an active or passive. In the option recommended for investigation by MAP,
each node is connected to a central star coupler by two fibres - one for transmitting, one for receiving, signals. The central coupler accepts signals from the transmitting node and distributes them evenly along the receiver fibres to all nodes on the network.
IEEE 802.5 Token Ring
IEEE 802.5 Token Ring on Fibre is recommended as an alternative to IEEE802.4 Token Bus on Fibre for applications requiring any or all of the following:
More than 32 stations on a single network
Data rates of more than 10Mbps
Guaranteed response times of the order of 5ms
Network with a cable radius greater than 2km
No network failure as a result of a single failure
No disconnection as a result of a LED or cable failure.
With their point-to-point configuration, rings are excellent partners for optical fibres. Token passing, for example, is'quicker with a ring than a bus, for the sequence in which the token is offered to the nodes (the so-called 'logical ring') always coincides with the sequence on the actual physical ring, and the token does not therefore have to be continually re-sent as a frame (as it must on a bus) to get it from node to node. The speed with which nodes can get priority access to the token is another advantage.
On the debit side, the ring, being an active system, has to be protected against catastrophic breakdown as a result of a single node or link failure. This aspect has received a great deal of attention, and, as a result, a dual ring reconfiguration is being developed for the 802.5 Standard.
The dual ring (see Fig 2.2.12(b)) relies on contra-rotating back-up links to route its way around back-up links to route its way around failures. In another option - the spur-bypass - the bypassing job is done by active concentrators, to which all the nodes are connected in a star form. Both types can be intermingled.
The following IEEE 802.5 implementation is recommended for investigation in MAP Appendix 6:
Data rate: 16Mbps
Cable: Dual-window (850nm and 1300nm), with a loss of not more than
54

3dB/km(850nm) and 1.3dB/km(1300nm)
Optional use of fibre-optics bypass relays
Transmission window: 850nm
Preferred cable size: 62.5/125
Being essentially point to point systems, ring topologies are ideal partners for a fibre optic medium. However, being also active systems, they have to incorporate some sort of automatic self-reconfiguration facility for bypassing a single node or link failure, so as to allow the rest of the network to continue functioning. The dual ring is one way of achieving this goal. In the diagrams two fibres connect each node, and the data path is identified by the dotted line. One diagram shows the system in normal operation; the other shows the system after reconfiguration, see Fig.2.2.12(b).
2.2.14 TECHNICAL OFFICE PROTOCOL (TOP)
At about the same time as MAP was being unveiled, a group spearheaded by Boeing Corporation was formed to develop a subset of the OSI standards for technical and office applications. The name given to these efforts was the Technical and Office Protocol (TOP). In order to be able to cottununicate between the office and the factory environment, efforts were made to be as compatible with MAP as possible.
The differences between the physical envirorunents of the factory and the office are marked. This is coupled with the fact that a different set of vendors are operating in each area. At the time when TOP was conceived, the dominant network system for office applications was Ethernet. Accordingly, the IEEE 802.3 (CSMA/CD) baseband standard was chosen as the preferred physical layer of TOP version 1.0. This provided an upgrade path for Ethernet users and fitted in well with the IEEE 802.2 data-link layer.
V Layers 2 (data-link) up to Layer 6 (presentation) are identical in TOP and MAP, and it is only at Layer 7 (application) that significant differences arise. The application requirements in an office environment will be more concerned with nonreal-time information transfer e.g. electronic mail, data base access etc. The only application service specified by TOP version 1.0 is a subset of ISO FT A M file transfer service. Implementing of the CASE is not required by TOP at the time of writing. Appendix VI I provides a comprehensive coverage of the current version (3.0) of TOP and its relationship to all IEEE and ISO standards.
2.2.15 THE INTERCONNECTION OF MAP AND TOP
The full MAP solution is a BroadBand 10Mbps system, conforming to the OSI model, using a variety of selected standards. However, the US MAP Users Group has suggested that a variety of interconnection modules might be necessary in order to construct a complete system. There are, in the first case, many reduced versions of MAP such as CarrierBand MAP and then, more radically. MAP/EPA and Mini-Map.
55
r
(

When, however. Full-MAP systems factory-wide are common place, other devices are needed to interconnect the various parts of the network. These are reviewed below. In view of the fact that the interconnection of MAP and TOP systems can become extremely complicated (and hence expensive to maintain and reconfigure ) attention is drawn to the example of the so-called CATANET (see Fig 2.2.15(a) below) suggested in the MAP network architecture specifications, which indicates how the various devices that are available for interconnection can be employed. It is important to see how complex some networks can get - although in some cases the Gateways shown below could be replaced by Routers (if, say. TOP was used in the office environment - as is usual), with consequent reduction in cost!
Corporate network
ICatcwayl
Dmsiocul networit
I Gateway I
Plant backbone MAP
Plant segment MAP
Bridu
Fig, 2.2.15(a) CATANET: An Example of MAP
BRIDGES
A bridge is a device that interconnects two or more segments of networks at Data-Link level. It acts essentially transparently in that a device cannot tell whether it is communicating with another node by means of a Bridge. At the Applications level, the intercommunicating devices need not even know that the Bridge exists. Since Bridges act as separate token-holding stations, each segment connected to a Bridge
56
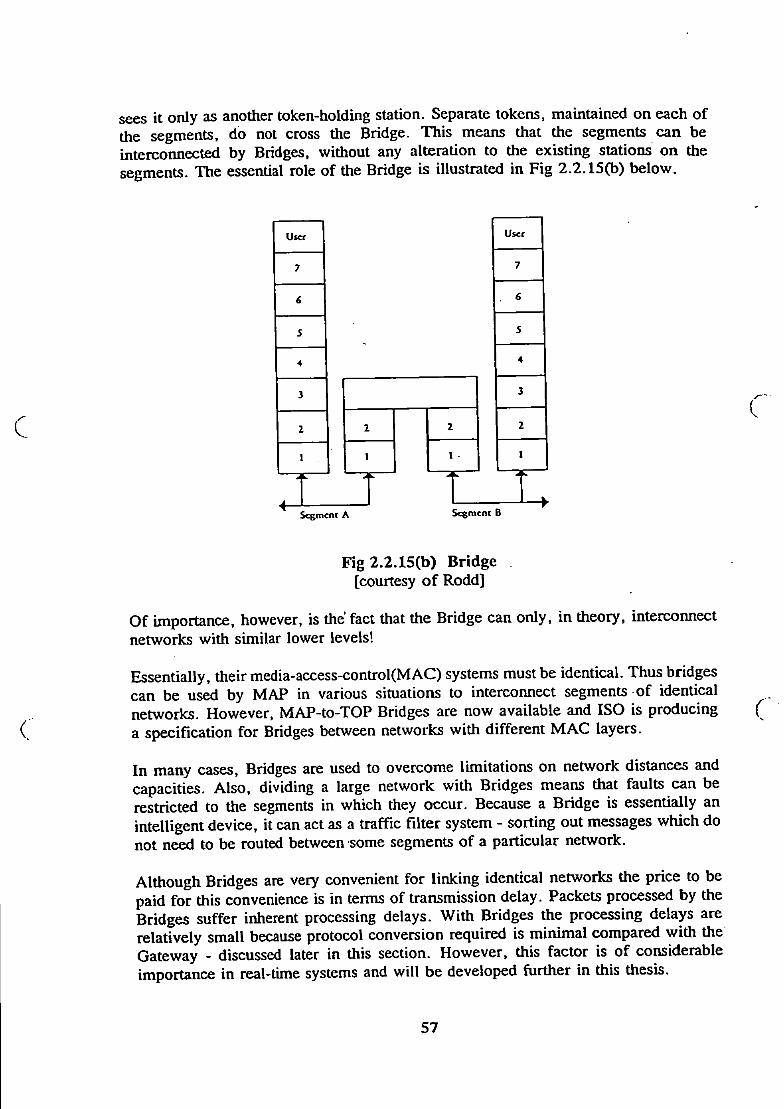
sees it only as another token-holding station. Separate tokens, maintained on each of the segments, do not cross the Bridge. Tliis means that the segments can be interconnected by Bridges, widiout any alteration to the existing stations on the segments. The essential role of the Bridge is illustrated in Fig 2.2.15(b) below.
User User
Segment A Segment B
Fig 2.2.15(b) Bridge [courtesy of Rodd]
Of importance, however, is the'fact that the Bridge can only, in theory, interconnect networks with similar lower levels!
Essentially, their media-access-control(MAC) systems must be identical. Thus bridges can be used by MAP in various situations to interconnect segments of identical networks. However, MAP-to-TOP Bridges are now available and ISO is producing a specification for Bridges between networks with different MAC layers.
In many cases. Bridges are used to overcome limitations on network distances and capacities. Also, dividing a large network with Bridges means that faults can be restricted to the segments in which they occur. Because a Bridge is essentially an intelligent device, it can act as a traffic filter system - sorting out messages which do not need to be routed between some segments of a particular network.
Although Bridges are very convenient for linking identical networks the price to be paid for this convenience is in terms of transmission delay. Packets processed by the Bridges suffer inherent processing delays. With Bridges the processing delays are relatively small because protocol conversion required is minimal compared with the Gateway - discussed later in this section. However, this factor is of considerable importance in real-time systems and will be developed further in this thesis.
(
57

ROUTERS
In essence, Routers are similar to Bridges, except that they are used to interconnect two or more different networks at a common point. In essence, they implement layers l-to-3 of the MAP architecture and have slightly greater facilities than Bridges. Unlike Bridges, however, they are not transparent and have to be addresses if they are to be used. They provide a service which can be used for routing, including the establishment of paths between networks and could, for example, be used to link a MAP to a TOP system. Essentially, then, the Router addresses must be known by the communicating systems. In many ways they are far more complicated than Bridges and require management above the Data-Link layer. Fig 2.2.15(c) shows the arrangement of a Router.
Inicrneiwork
Network A Network B Network C
Fig 2.2.15(c) ROUTER [courtesy of Rodd Ref .4]
As stated with the Bridge, the price to be paid for these extra facilities is in terms of the packet processing time. With the Router, the packets have to be partially •unwrapped', to level 3, before being 'rewrapped' for onward transmission. This operation consumes several valuable milliseconds - particularly important in real-time systems.
GATEWAY
A Gateway is essentially a very generalised means for interconnecting networks. In essence, it is a 'dual' architectural/protocol device which, on the one side, has all the layers of protocol to suit a particular network (say Network A as shown in Fig 2.2.15(d)), and on the other side it has all the protocol layers to suit a second Network B. A message, having passed all the way up through the layers of protocol, is then communicated as an intelligent message and passed down the other side for subsequent transmission. In essence, then, the Gateways can be used to interconnect two networks operating on totally different protocols - whether in fact they adhere to the ISO standard or not.
It is clear that a Gateway is an extremely complex computing device, which can therefore be expected to be very expensive. In addition, the time taken to carry out the protocol conversion twice (i.e.from level 1 up to level 7, then back down to level 1) incurs a significant penalty in terms the packet processing time at the Gateway and
58

is of the order of lOOmsecs. The implication of the requirement for complex protocol conversion at Gateways has an important bearing on their application to real-tune systems, and is discussed later in this thesis.
User User
Nnwork A (Sa/ OSI)
Network B (Anochcr protocol)
Fig 2.2.15(d) GATEWAY
2.2.16. COMPARISON OF DETERNONISTIC AND NON-DETERMINISTIC LANS
CSMA/CD and Token Bus form the two types of medium-access control techniques on bus/tree topologies. Table 2.2.16 below summarizes some of the advantages and disadvantages of these two systems.
Table 2.2.16. CSMA/CD v Token Bus
CSMA/CD Token Bus
Simple algorithm
Established technology
Good performance at low to medium loads
Poor performance at heavy loads
Non-deterministic access
Complex algorithm
New technology
Tolerates wide range of loads
Excellent throughput performance
Deterministic access
59

Despite its relative simplicity and the advantages it has gained through having been widely used over a long time, CSMA/CD has some serious disadvantages, in particular in the context of real-time systems. For certain data rates and frame sizes, the algorithm perfonns poorly as load increases. The collision detection requirement imposes a minimum frame size, which is wasteful of bandwidth in situations where the messages are short, such as those which may be produced by sensors in a realtime control system. The protocol is biased towards longer transmission times that are required for file transfers frequently required in office automation environments.
The greatest advantage of the Token Bus is the stability of its performance. The access time does not increase significantly with network loading and the throughput increases as the data rate mcreases. levels off at high network loading, but does not decline as the medium saturates (see Fig 2.2.16a below).
Access time
CSMA/CD ,
Token bus 1
0 50 100 Network loading (•/•)
Total throughput'
Token bus
CSMA/CD
0 SO Network loading (%)
•Throughput is defined as the fraction of time thai is spent transmitting data
1 100
Fig 2,2.16(a)CSMA/CD v TOKEN BUS
Access to a Token Bus can be regulated, and may be fairer at.high loads. It avoids the last-in, first-out phenomenon that can occur in CSMA/CD. I f priorities are required, as they can be in a manufacturing or process control, real-time environment, these can be accommodated. The Token Bus can guarantee a certain bandwidth; this may be necessary for certain types of data such as voice, digital video and telemetry. The Token Bus is deterministic in the sense that, because each station in the logical ring can hold a token for a specified maximum time, there is an upper bound on the amount of time any station must wait before transmission can be established. (There is always a finite possibility of transmission error, which can cause token loss. In practice, this makes the Token Bus also non-deterministic in a sense.) In contrast, in CSMA/CD the delay time has. theoretically, no upper bound.
60

For real-time systems, like process control and conversational speech, this non-deterministic behaviour is unacceptable.
One of the.major disadvantages of the Token Bus is its complexity, although with new VLSI chip sets implementing most of the complex functions, this problem should not be a serious disadvantage for much longer. The other disadvantage witli Token Bus lies in the overheads involved. Under lightly loaded conditions, there may be an unnecessary long wait before a token is acquired for transmission. However, as this delay has an upper bound, allowance for this can be engineered in to most real-time systems.
The choice of the appropriate access mechanism is based on the requirements and the relative costs prevailing at the time, and on the real-time nature of the applications involved. The decision can also be influenced by the Baseband versus Broadband debate - however- the cost of Broadband systems appears to be currently prohibitive for other than major manufacturers who are totally committed to CIM. ^-
Conclusions
The two lowest layers of the OSI model are of crucial importance to the development of the LAN market and availability of low-cost network interfaces. Because of the complexities of the algorithms involved, it is necessary to have a VLSI solution. However, semiconductor manufacturers will only be willing to conunit themselves to the development and support of such devices, should a large volume be needed in the market. This has prompted the development of LAN standards to ensure that such large-volume markets would emerge. Equipment from a variety of manufacturers will have to interwork.
The IEEE 802 LAN standards address this problem and in particular attack the two lowest layers of the OSI reference model. In this standard the LLC provides for the exchange of data between the Service Access Points (SAPs). which are multiplexed over a single physical connection to the L A N . ^.
At the medium access control (MAC) layer, there are three standards for LANs. CSMA/CD has converged with the Ethernet specification and is well suited to typical office automation applications. Both baseband and broadband options exist at several data rates. Two forms of token access have also been standardised, namely Token Bus and Token Ring. These are provided for time- critical applications, such as process control, as well as for office applications. For Token Bus. three physical layers are provided as options. The simplest and the least expensive is Carrierband.
Given that the Token Passing systems are deterministic and that delays due to token access can be catered for in the system design, the remainder of this thesis concentrates on problems created by LANs employing CSMA/CD medium access control algorithm when used to carry conunercial quality real-thne interactive speech under varying data traffic conditions.
61

2.3 SPEECH AND DATA ON A COMMON COMMUNICATION NETWORK
In the preceding sections the current status of PABXs (for real-time speech) and LANS (for data) has been outlined and described, giving both the respective strengths and the weaknesses of the various networks.
In this concluding section of this chapter a comparison is made between data signals and real-time speech signals with a view to considering the suitability of LANs to carry real-time speech.
The desirability of using LANs to carry real-time speech is easily demonstrated in that:-
(a) only one cabling system is thus required to support a single information systems (crucial to any commercial/industrial concern). This approach results in considerable savings in:-
(1) the initial installation^ only one network required) (2) the cost of reconfiguring the network as a result of changes in the
office/factory layouts (only one set of contractors to deal with).
(b) the management of the information system as a whole can now become the province of one authority,(teIephone systems are, by tradition, the responsibility of the office manager, while LANs tend to be ' IT ' which usually comes under the auspices of the IT Director.)
(c) the power of a workstation which now incorporates real-time speech facility considerably enhances its marketability.
(d) the range of new communication facilities combining both real-time speech and interactive vision that will be available with this type of network have tremendous potential- which has yet to be fully explored.
On the debit side, the provision of a single network to support both speech and data raises question concerning communication reliability as the failure of the LAN will result in the complete failure of all communication systems within the company. This situation could well be unacceptable to certain commercial/industrial concerns. Steps, therefore, are taken to duplicate or triplicate all or certain parts of the network. This effectively means that the cost savings mentioned above could be reduced.
2.3.1 Speech and Data Traffic Compared
Before attempting to combine real-time speech with the existing data on a LAN it is important to compare the characteristics of the two types of traffic.
62
SPEECH TRAFFIC
Using conventional A - > - D and D->-A techniques at bit rate of 64kbps is required, while the conversation is in progress (connection held), in both directions. This can also be considered as either:-
8.000 - 8 bit bytes per sec, or one 8 bit frame every 125usec.
Although 64kbps is considered a rather modest data rate by modem standards it is important that the speech packets (each 8 bit byte is one speech packet) do arrive at the receiving end within a given time window. I f packets suffer too much delayed then it may not be possible to use them in the reconstitution of the original signal at the receiving end D->-A convertor. Packet loss of this nature results in the
^ degradation of the received speech quality. ( ^ V As a result a steady and slow speed packet delivery service is therefore required from
the L A N , with minimal delay. In addition, as the users (humans) are 'intelligent' and thus able to contextually interpolate for any missing word parts, it is not absolutely necessary for the provision of sophisticated error detection/correction algorithms, as is required with data traffic, where the terminals are effectively dumb.
A significant portion of this thesis is devoted to the reporting of investigations carried out into the nature and magnitude of these delays, and how the packet loss resulting from these delays affects user acceptability. Also reported on are a range of measures taken to improve user acceptability given that a certain level of delay, and hence packet loss, will be inevitable in-LANs due to the medium access control algorithms employed (see Sections 2.2.5. 2.2.8 and 2.2.9).
DATA TRAFFIC:-
By comparison, data is usually required to be transferred from station to station, or r " to printer/plotter in large blocks i.e. file transfers or screen dumps. This type of ^ traffic therefore usually requires:-
(a) relatively high speed data rates usually in the megabit range. (b) delays are not normally a crucial issue unless the data is for
real-time control. However, long file transfers over slow speed data links can result in unacceptably long delays.
(c) terminals employed are not normally capable of contextual interpolation, like humans, as a result it is necessary to implement sophisticated error detection and correction algorithms to deal with transmission errors etc.
From the above comparison it can be seen that the two traffic types are completely different, yet it could be argued that they are complementary from the network view point because they make different demands i.e.
63

Speech traffic requires real-time operation whereas data does not (unless realtime control)
Speech requires the slow but regular transmission of the speech parcels, whereas data needs large blocks of data to be delivered within a given time window (which is much longer than that required by speech).
Data traffic requires the provision of error detection and correction algorithms because the terminals are 'dumb' compared to the sophisticated contextual interpolation facilities available to humans for speech recognition.
The 'complementary' aspects of speech and data traffic over LANs is explored later in this thesis in the sections dealing with the actual implementation of real-time speech on LANs in the presence of data traffic. It wi l l be seen that some overall benefit is derived from combining these two totally different traffic types, rather than endeavouring to transmit the two signals separately, in the time domain.
The next section deals with the definition and evaluation of the crucial issues in the transmission of real-time interactive.speech over LANs.
End of Chapter 2
64
CHAPTER 3
3. REAL-TIME INTERACTIVE SPEECH OVER LOCAL AREA NETWORKS
The types of LANs that are available in the mailcet place have been discussed and described in detail in Section 2. From these descriptions and evaluations it can be appreciated that the cmcial issue for the successful transmission of real-time interactive speech over a LAN is that of speech packet delay. I f the speech packets are delayed by significant amounts, then the quality of the communication will be impaired.
The following subsections deal first with the mechanisms which cause packet delay, and then with the efifects on speech quality of delayed packets. ^
3.1 CATEGORISATION OF TliE MECHANISMS WHICH CAUSE SPEECH PACKETS TO BE DELAYED WHEN TRANSMITTED OVER LANS
The main delay mechanisms are listed below:-
(1) Protocol Wrapping and Unwrapping
(2) Transmission Delays
(3) Medium Access Delays
A detailed explanation of each will follow and include an indication of the relative magnitude of the delays to be expected.
3.1.1. Protocol Wrapping and Unwrapping
When a work station equq)ped with a real-time speech capability is instructed to set up a connection with another workstation on the same LAN (say), the first operation is to establish a 'session' between the two parties concerned. This involves using the ISO stack of protocols.
The entry level into the stack depends on the particular layer of the ISO stack at which the speech is to be inject/removed. The further up the stack the speech is injected/removed then the greater the level of control that can be exercised by the station, but this additional control is gained at the expense of added delay. There is no international standard for the provision of real-time speech systems in any of the protocols at the 7 layers as yet This aspect of the system design will be discussed at length in the later section dealing with implementation issues.
c
65

Preliminary investigations conducted by Rodd[4] indicate that as much as lOOmsec of delay can be expected from the top layer of the ISO stack to the Physical layer i f the speech is injected via the MMS (Manufacturing Message Standard) protocol. Values obtained at University of Plymouth using MMS on a Token Passing Bus LAN supplied by Sealan Ltd of Exeter under a DTI research grant to the author for the purpose investigate flexibility in automated manufacturing[5] indicates that Rodd's figures are pessimistic. More typical is a figure of between 10 to 50 msec, even under heavy data traffic conditions. However, protocol ^wrapping' (attaching headers and trailers) will have a significant effect on the overall delay particularly in view of the fact that the reverse process has to take place at the receiving end with similar time penalties involved.
3.1.2 Transmission Delays
Basic calculations for transmission times over LANs using twisted pair cable, coaxial cable or optical fibre involving distances of, say, 2Km at transmission speed of approximately 0.6 the speed of light (300,000,000m/sec) for packet sizes of LSKbytes at a bit rate of 10Mbps give a transmission delay of O.ljxsec per bit. Thus the time taken to transmit a 1,500 byte packet is L2msecs. This last figure is not a delay as such - more a transmission time, the more important number is the lO^secs, which compared with the protocol v^pping time is insignificant as it is at least three orders of magnitude less.
Optical fibres will not reduce this figure of 10|j.sec by an appreciable amount as the fiindamental physical limit of the speed of light is beir^ approached.
One rather alaiming development that is becoming current practice amor^ LAN vendors is to provide an RS 232 port for connection to the network, particularly for process control applications. On the surface this appears to be justifiable in terms of the provision a well-understood standard interface. However, examination of the standard reveals that the maximum bit rate that a RS 232 port will sensibly support is of the order of 38Kbps, which is considerably lower than the 64Kbps required for real-time speech, in each direction.
'fhe limitations of RS 232 could have considerable bearing on the viability of the proposed system. However, bit rate reduction techniques are available and offer good quality speech on bit rates as low as 8Kbps.
3.L3. Medium Access Delays
By far the most significant of the three categories is the medium access delays, particularly in the case of the CSMA/CD (non-deterministic) networks.
66

In the case of the Token Passing networks, which are deterministic, access to the LAN is guaranteed within a worst case condition which is dependant on:-
and (a) the number of stations cormected to the LAN,
(b) any prioritisation in operation.
Typical delay figures for manufacturing LANs, where the data traffic is often relatively light, are of the order of 10s of msec.
In comparison, the access time for CSMA/CD LANs is theoretically infinite, however, in reality, the delay is very much traffic dependant. Fig 3.1.1(a) below gives an indication of the relative delays of the Token Bus and CSMA/CD LANS.
C Access time
CSMA/CD
I 50
Token bus 1
too
Total throughput"
Token bus
CSMA/CD
Network loading (%)
Throughput is defined as the fraction of time chat is spent transmitting data
I 1 0 50 100
Network loading (%)
Fig 3.1.1(a) Relative Delays on Token Bus and CSMA/CD LANs [courtesy of Rodd]
As the traffic on a CSMA/CD LAN is:-
(a) a function of the number of stations connected to the LAN,
and (b) the type of applications being run,
it is very difficult to give a general picture of the delays expected. In addition, manufactures are very reluctant to release such operational data, and one gets the
(
67

impression that there is a certain amount of professional jealousy in this area - even a conspiracy of silence!
However, measurements have been made at University of Plymouth on the full MAP 3.0 DTI/Sealan Token passing bus LAN of delays incurred when model manufacturing processes have been controlled over the network using a form of MMS. Again, these results are particular to the network specified, but they do mirror those indicated in Fig 3.1.1(a) for lower percentage network loadings. At the higher traffic loadings, (this was achieved using artificial messages designed to simulate actual process control data transfer) the delay time did show an increase of some 100% on the lower loadings - but this is still orders of magnitude lower than that reported on CSMA/CD networks with similar traffic loadings.
The initial studies showed that provided the traffic loadings were:-
(a) Less than 30% for CSMA/CD
or
(b) Less than (95%) for Token Passing bus
delays remained of the order of 10s of msec, which will be seen to be satisfactory on the basis of criteria established in later research.
3.2 THE EFFECT ON REAL-TIME SPEECH OF LOST PACKETS •
Until recently, very little serious research had been conducted into the effect on speech of lost packets. The reason for the absence of such investigations is that existing digital speech systems are based on circuit-switching common to most telecommunication systems (as explained in Section 2.1.2) where actual packet loss is very unlikely. In these systems the circuit is set up before any speech packets are transmitted and maintained until the conversation is completed. As a result, the main problem on these circuits is that of electrical noise and interference which can cause the contents of the packets to be corrupted, but not totally lost. Techniques exist for these errors to be detected and corrected.
In comparison, packet-switched systems (as described in Section 2.1.3) do not set up the circuit before hand. With these systems the data to be sent carries a destination address which is used by each node to route the packet to its required destination. As a result, queues can and do form at nodes resulting in delays in delivering the packets. I f faults occur at nodes, or in the transmission links between the nodes, then packets can be completely lost Before considering in detail the effect of lost packets on real-time speech it is advisable to fu^t consider the mechanisms for both the digitisation of speech and the reverse
68
process, as these processes have a considerable influence on the methods evaluated later in this thesis for attempting to reduce the efTect of packet loss . The technique commonly employed for the digitisation of speech is known as Pulse Code Modulation (PCM) or Analogue - Digital Conversion (A/D).
3.2.1. Digitisation of Speech (PCM)
A detailed explanation of PCM, is provided by Cattermole [6]. In this section a brief overview will be given of reasons why digital systems are currently preferred to analogue systems, followed by a description of PCM with sufficient detail so as to give an appreciation of the effect on real-time speech of lost packets.
Analogue Systems
As speech is an analogue signal, which varies continuously with time, it is vulnerable to contamination by noise^terference when switched, transmitted or amplified. The reason for this vulnerability is that in all of the above mentioned processes the wave-shape of the signal has to be maintained i f its quality is to be preserved. Unfortunately, electrical noise, particulaiiy thermal noise, is a fundamental limitation on all electrical systems that operate at a temperature above absolute zero (which includes most systems on this planet). This limitation is so severe that the lengths of long distance analogue communication systems are limited by the accumulation of noise because the unwanted noise signal grows to equal and eventually exceed the wanted speech signal, irrespective of how much ttie wanted signal is amplifiedL
The reason for this situation is that analogue amplifiers are relative unintelligent devices in that they amplify, slavishly, all the signals that are presented at their input As a result both the noise and the speech signals are amplified.
Another major disadvantage with analogue systems is that once the wave-shape of the analogue signal has been corrupted it almost impossible to recover the original information which is contained in the amplitude variations of the analogue signal i.e. error detection and correction techniques that are available for digital systems do not appt>' to analogue signals.
Digital Systems
With digital systems all wanted information, irrespective of its soiu*ce, is produced in terms of Is and Os. These wanted signals are switched, transmitted and amplified in a similar maimer to the analogue signals mentioned above. However, there is one significant difference, and that is with digital signals the wave shape does not have to be meticulously retained as with analogue signals. In the digital case the wanted signals
69
have only to be 'detected correctly' such that the T condition can be detected as opposed to a '0\ without error, and visa versa.
The demands made on the electronic circuitry are considerably less because only two amplitudes have to be detected. In addition, once these two amplitudes have been detected then a brand new signal can be regenerated - completely xmcorrupted by noise or interference.
The key to appreciating the difference between the two systems is that in analogue systems the amplifiers are referred to as REPEATERS (because all they do is to repeat what ever signals appear at their inputs), whereas in digital systems they are called REGENERATORS (because they actually regenerate a brand new signal). The proviso is that the digital signal must not be allowed to become so corrupted by noise and interference that accurate detection is impossible. A measure of the relative systems performances in the presence of noise is the ratio of the signal level to that of the noise level - this is referred to as the signal-to-noise ratio (S/N)- that can be tolerated to produce reasonable quality speech at the receiving end. For analogue systems a S/N ratio of 100,000-to-l produces good quality speech, but by no means hi-fi, with the worst acceptable quality at 1,000-to-l S/N.
For digital systems using fairly unsophisticated modulation methods (Binary Amplitude Shift Keying) at an error rate of only one bit lost in a miUion bits transmitted (1 in 10*6), can be achieved with a S/N ratio of only 14dB on the transmission medium.
The above results show that the distal systems use the available bandwidth more efiBciently.
The implication of the above results are that:-
(a) much poorer quality circuits can be used using a digital (PCM) system.
or
(b) for the same type of circuit the quality of the received signal is much better using digital (PCM) system.
The price to be paid for this improvement in system utilisation is that all analogue signals have to be converted into a digital format before being transmitted, regenerated and switched, then converted back into an analogue form at the receiver. This process, referred to as PCM, does introduce a certain amoimt of distortion, and can be expensive in terms of bandwidth (the frequencies used).
70

The details of this conversion process are discussed below.
Pulse Code Modulation
As indicated above, PCM involves two separate operations, these are:-
(a) Analogue to digital conversion at the transmitter
and
(b) Digital to analogue conversion - at the receiving end
These two processes are inextricably linked.
C (a) Analogue to Digital Process Taking the A-to-D process first, there are three stages involved in producing a digital signal fi'om the original analogue speech message, they are:-
c
(1) Band litniting the original message such that:-
(i) the top message fi^uency is less than half the sampling fi'equency
and
(ii) the noise at the input to the converter is reduced to a minimum.
The CCITT agreed bandwidth is 0 to 3.4KHz ^
(2) Sample the band limited speech message at a rate just greater than twice the highest frequency component contained in the bandlimited message.
The CCnr agreed sampling rate for speech is 8KHz
(3) Ouantisation is the process of taking each of the sample amplitudes generated by the sampling process and converting the height of each sample into a unique digital code depending on the sample amplitude ready for transmission and/or switching.
71
The CCrrr agreed quantisation process requires each sample to be encoded into one of 256 different levels, thus requiring an 8 bit digital code, using a non-linear transfer function for the encoder which provides a better S/N at lower signal levels at the expense of louder signals. (See section on Companding in Ref 6).
The processes outlined above require the generation of:-
(a) 8000 samples a second
(b) each sample contains 8 bits
(c) thus resulting in a bit rate of 64Kbps which must be sustained in both directions while the cormection is held, irrespective of whether any one is actually speaking.
A block diagram showing the basic configuration of the sub-sections in the A-to-D process, is given in Refence 6.
(b) Digital to Analogue Conversion
There are two basic stages to D-to-A process, these are:-
(1) Dequantisation of the incoming bit stream such that the stream of 8 bit bytes arriving at the receiving end, at the rate of 8000 a second, have to be converted back into the 'sampled' speech signal, i.e. as close as possible to the sampled speech signal in the A-to-D converter. This process involves taking each 8 bit byte and reconstituting the sample pulses whose amplitudes are commensurate with the binaiy codes contained in each of the 8
^ bit bytes. (2) Filtering of the reproduced 'sampled' signal fi-om the output of
the dequantiser so as to remove the unwanted higher order frequency components to leave the original speech signal.
The CCITT agreed bandwidth of this filter is 0-to-3.4KH2.
Reference 6 contains diagrams of the D-to-A process.
Distortion caused by the Digitisation of Speech
The process of digitising speech, for the convenience of transmission, switching and storage, does introduce some distortion into the received signal - this is called
72

Quantisation Noise. By careful choice of the system parameters quantisation noise can be kept to minimum. However, as quantisation noise is generated every time the A-to-D and D-to-A process is carried out, it is important to only implement one such conversion and reconstmction in any end-to-end cormection.
Details of the nature of quantisation noise and its relationship to the system parameters of signal bandwidth (quality of speech), sampling rate, number of quanta and system bit rate are included in Reference 6.
The description of PCM given above is only a veiy brief overview. However, an appreciation of the principles of PCM is important to the understanding of how speech quality will be effected by the loss of some of the speech packets as a result of excessively long delays. This very important issue is discussed in the next section.
3.2.2 The Relationship between Packet Loss and Speech Ouality
From the brief description of PCM given above, and with reference to Appendix X I , it can be seen that the sampling process generates the sample amplitudes. These sample amplitudes are coded into 8 bit binary numbers for transmission at 8000 times per second.
At the receiving end, these 8 bit bytes are received and the waveform of the speech efifectively 'reconstituted' firom the amplitudes of the sample amplitudes reproduced by the dequantiser. This reconstitution is efifectively achieved by 'joining-up' the sample pulse heights, which is done by the relatively long time constant of final low pass filter. This joining-up is ,in fact, a form of electrical interpolation. See Fig 3.2.1(a) below.
voltage
limc
(a)
voltage
mrrrtTTm
(c)
voltage
llllllllll
(b)
voltage
Fig 3.2.1(a) Sampled Speech Signals At the Receiver [courtesy of the Open University]
73

It should be appreciated that the loss of a speech packet (containing one 8 bit byte) will result in gap appearing between successive samples at the output of the dequantiser See Fig 3.2.1(b) below.
voltage
L milHIii time
Fig 3.2.2(b) The Loss of a Single Speech Packet
The low pass filter following the dequantiser will thus attempt to *join-up' the successive pulse an )litudes produced by the dequantiser, only this time the gap between successive samples will be double that of other samples. The time constant of the low pass filter is such it can not linearly interpolate over the missii^ sample and so the amplitude of the waveform approximates to zero. See Fig 3.2.1(c) below.
voltage RffSllLT O F
time
Fig 3.2.1(c) Interpolation, by the Low Pass Filter, as the result of the Loss of Single Speech Packet
An issue worthy of note at this juncture is the value allocated by the dequantiser when a byte has not arrived at its input within a given time firame. It will be seen later in this thesis that this issue is the subject of extensive investigation, but for the present it is assumed that the value given by the dequantiser for a missing packet will be zero (00000000), which is the effective mid-range value between the positive peak and the negative peak. The loss of speech packet (s) effectively reduces the sampling rate which is specified as 8000 times per second for commercial/domestic quality speech [Ref 7]. The effect of this is to produce 'aliasing" at the receiver such that extraneous fi-equencies appear within the pass-band of the final low pass filter. These frequencies are heard by the car, in addition to the expected voice, and represents unwanted audible noise. As a result the reconstituted speech is distorted by an amount depending on:-
74

(1) the number of lost packets, with time (rate of packet loss),
and
(2) the statistical distribution of packet loss, with time.
The Rate of Packet Loss
It is usual in digital systems to employ the number of bits that arrive in error - per second, referred to as the Bit Error Rate (BER), as a figure of merit. Values specified for BER depend on the type of information being carried, and particularly on its sensitivity to loss and customer confidence i.e. financial information systems require a BER of one bit lost in one hundred million (1 in 10*8) whereas commercial speech /T systems are designed to operate at a BER of 1 in 10*6 falling to 1 in 10*3 for short term worst case conditions.
Unfortunately, BER figure of merits, give little information as to the distribution of bits in errors. An example can found in certain digital microwave radio systems which are very prone to the errors occurring in short bursts (burst errors) due to fading caused by multi-path propagation as the result of temperature inversions. In these systems, althoi)^ the overall error rate is within the specified BER, there are times when a burst of errors will cause the system to 'drop ouf because synchronisation (essential to all digital systems) is lost and valuable time to taken to recover normality. During this time all data being carried is often lost!
The CCITT have recently recognised this limitation and are in the process of collecting data to publish a new recommendation G821 [Ref 83].
Statistical Nature of Packet Loss (Errors) ^
As mentioned above, the key issue is the statistical nature of how errors occur/packets are lost i.e.
(a) are the packet losses/errors evenly distributed over the time period?
or (b) are the errors/packet losses occurring in bursts?
In practice, it can be assumed that a combination of both mechanisms are effectively attacking any operational system, with line systems more likely to suffer from (a) while radio systems definitely fall victim of (b). Unfortunately, long distant communication systems often comprise both!
75

To establish the tolerance of real-time interactive speech on LANs to the typo of packet loss referred to above it was necessary to carry out a series of tests on actual conversations. The speech packets generated were then subjected to a range of tests which reflected the statistical nature of the packet losses/errors that occur, particularly in LANs in an industrial/commercial environment [Ref 51 and 52].
Speech Packet Clustering on LAN
A unique problem was unearthed in the research into real-time speech on LANs during this project in that it was found necessar>' to transmit a number of consecutive speech bytes in a single data frame in the interests of transmission efficiency and the need to meet the delivery of 8000 speech bytes per second, on average, in addition to the screen data bytes. The dilemma facing the designer being:-
a) increasing the number of speech bytes (larger speech parcels) in a given LAN data frame increases transmission efficiency and the delivery rate.
but b) increasing the size of the speech parcel reduces the number of bytes
available for screen data, and hence reduces the screen refresh rate and
c) should a LAN frame be delayed in delivery, then a large number of consecutive speech bytes will be lost, (the impact being greater on the speech quality than on the screen refresh rate).
The next major section, Chapter 4, of this thesis deals with a range of tests that were conducted initially at the University of Plymouth and latterly at British Telecomms Research Laboratories at Martlesham Heath, SufiFolk, UK, to establish levels of customer acceptability in terms of packet loss rate/parcel size/user acceptability for real-time interactive speech systems. This information was then to used to evaluate existing systems and make recommendations for future networks.
End of Chapter 3
76

CHAPTER 4
4. SUBJECTIVE MEASUREMENTS OF THE EFFECT ON REAL-TIME SPEECH OF DELAYED SPEECH PACKETS
It has been established beyond all reasonable doubt, in the earlier sections of this thesis, that any type of packet (speech or data) will suffer delay when being carried by a LAN - the nature of this delay being dependant on:-
(a) the type of network (Access Protocols employed)
(b) the topology of the networic
(c) the nature and quantity of traffic being carried by the LAN.
Before any recommendations can be made as to the suitability of any particular LAN to carry real-time speech it is important to establish user acceptability/tolerance to speech packet delays. The following subsections describe in detail tests carried by the author at both the University of Plymouth and British Telecom Research Laboratories (BTRL).
4.1 SPEECH TESTS CONDUCTED AT UNIVERSITY OF PLYMOUTH
Considerable research was carried out at Uiuversity of Plymouth into both:-
(a) the type of the delays that were likely to be encountered and
(b) the methods for assessing the effect of these delays on the end-users
4,1.1 Delay Characteristics
References [lO-to-17] give a clear indication as to the type of delays that are likely to occur in packet switched networks. These delay characteristics comprise
(i) a FIXED/STATIC delay, due to transmission time, which is function of the network topology. Actual values will depend on the length of the cormection, but for LANs of approximately 2Km in length the transmission delay is relatively insignificant at about 10|xsecs,
(ii) a VARIABLE delay, due to medium access procedures, that are often directly related to the traffic on the network, which is continuously varying.
77

Typical figures will depend on the type of Medium access Control (MAC) being employed e.g. for Non-Deterministic LANs, like CSMA/CD, this type of delay can, in theory, be infinite, but in practice is typically of the order of lOmsec for traffic loadings below approximately 30%. However, for traflBc beyond 30%, the access delays increase very rapidly becoming asymptotic to the vertical at approximately 60% of the maximimi data traffic loading of 10Mbps [Ref 91].
Deterministic LANS, like Token Passing systems, have higher access times, typically 10s of msecs, depending on the number of stations connected to the system. However, access times are relatively constant as they are more dependant on the token rotation time than the traffic levels. It is only for traffic loadings in excess of — 95% that the delays show any significant increase, and become traffic dependant.
The characteristics of both CSMA/CD and Token Passing LANs are well documented (sec Ref 91). Fig 4.1.1(a) overleaf, provides a comparison of the delay/throughput characteristics for both CSMA/CD and Token Passing LANS operating at 10Mbps (Ref 91].
Some research work conducte.d during the early 1980s [Ref 21 to 28] had been reported concerning the investigation of the subjective effect of lost speech packets on LANs. However, this research work had concentrated mainly on smaller speech packet loss for various loss rates.
As discussed in Secdon 3,2.2 j the prune concern of this research is to establish the criteria for the transmission of real-time speech and screen refresh data in the soitte LAN frame for a reasonable level of user acceptability, titis necessitates the investigation of nuddpte-consecutive packet loss ie, a form of clustering.
However, before embarking on the subjective testing involving multiple-consecutive speech packet loss, it was decided to repeat some of the tests conducted by Wasem et al [Ref 21 to 28] to establish the validity of the test equipment deseed and built at UoP and methodologies employed.
A Speech Processor was designed and built in the Electronic Engineering Laborotories at UoP to simulate single and multiple speech packet delay under computer control. The final version was named XI. The design and operation of this device is given in Section 4.1.2.
78

Fig 4.1.1 (a) Comparisons of Delay/Throughput Charateristics of CSMA/CD and Token Passing LANs Operating at 10Mbps [Ref 91].
I i
(
79

In terms of the methodology to be employed, extensive tests had been carried out much earlier (1973) by Richards [Ref 18] into techniques for subjectively testing telephone analogue speech quality in the presence of noise and other forms of distortion. A similar methodology was adopted for the tests conducted in this aspect of the research programme, the results of which are reported later in sections 4.1.3 to 4.1.6
4.1.2 Simulation of Speech Packet Delay
To establish a framework for assessing the ability of LANs to successfully carry real-time speech it is important to define the levels of user tolerance to delayed speech packets. It was decided to construct an actual model/simulation of the mechanisms that would produce delayed speech packets under controlled conditions, thus enabling the user's tolerance to be measured accurately.
As a result of studies carried out it was found necessary to develop a hardware/software model which could simulate the required delays in a real-time speech conversation. As no such device was conunercialty available designs were produced to meet the requirements analysed These requirements are listed below:-
(1) Accept telephone quality analogue speech and produce a digitised output, (PCM), A-to-D Conversion
(2) Take the 8 bit PCM bytes and subject them to controlled delay conditions similar to those encountered in commercially available LANs
(3) Store the delayed speech in a Dynamic Speech Buffer
(4) Reconstitute the analogue speech from the contents of the Dynamic Speech Buffer, D-to-A Conversion
(5) Pass the recoi\stituted speech to the telephone ear piece.
(6) Carry out the same process in the reverse direction, but ensure that the delay processes are uncorrelated for the two directions of transmission.
It was important to gain a feel for the level of user acceptability with regard to speech packet loss before any meaningful comparisons could be made between LANs for use in a commercial/industrial enviromnent.
Thus with due regard for the needs and requirements listed above a hardware/software simulator was built in the labs at UoP. This model was referred to as the Speech
80

Processor XI when it was finally completed and was controlled firom four BBC 'B' Computers. Before describing the tests in detail, an explanation of the evolution and the operation of the Speech Processor is given.
Speech Processor XI
The main purpose of the Speech Processor was to accept telephone quality analogue speech, digitise the analogue signal, then artificially delay the speech bytes before finally reconstructing a distorted analogue signal. The amount of delay inserted could be carefully controlled and hence the user's response accurately quantified. From the results obtained the suitability of the various LANs, currently being employed in commerce and industiy for CIM activities, could be evaluated for cany both real-time speech and data. The general functionality of the Speech Processor, designed to carry out the above defined function, is described below.
A-to-D Conversion
As it was going to be necessary to control the reconstitution of the analogue signal fi-om the delayed byte stream it was decided to employ A<-to->D 'pods' which could be easily driven firom BBC 'B' Computers. To achieve the necessary level of control in both directions of transmission, and maintain statistical independence, two BBC 'B's were required. Each BBC had attached to it a Speech Packet Delay Generator so that the necessary delays could be generated independently.
The arrangement for the basic connections described above is given in the Simplified Block Diagram of Phase 1 of the Speech Processor shown in Fig 4.1.2 (a), with the detailed connection given in the diagram on the following page.
It can be seen that access to each BBC is via a Versatile Interface Adaptor (VIA) which is connected to the lN4Hz Bus . The VIA has two ports, one is devoted to the A<-to->D 'pod' while the other receives the delay generator output.
Step 1: 2-\vire to 4-wire Conversion
The bi-directional speech on the 2-wire telephone line must be separated in terms of its 'GO' and 'RETURK directions to enable the digitisation processes to be carried out The technique for this 'splitting* fimction is well known and is performed by a passive device called a Hybrid Transformer. The use of a traditional British Telecom device caused considerable problems and had eventuaUy to be completely redesigned. Details of this exercise are given later in this section. Shown over leaf is the block diagram of the Speech Processor XI and the detailed circuit diagram for Phase I (containing the traditional BT hybrid).
81

Fig 4.1.2(a) Block Diagram of the Speech Processor - Phase 1.
82

PHASE - 1 Fig n.l.Z (a)
I n v e s t i g a t i o n into t h e s u b j e c t i v e e f f e c t o f s p e e c h s a m p l e s b e i n g r a n d o m l y d e l a y e d , a n d t h e s p e e c h r e c o n s t i t u t e d w i t h no a t t e m p t h a v i n g b e e n m a d e to r e o r d e r t h e p a c k e t s .
t T E L E P H O N E A
HYBRID
D E L A Y
G E N E R A T O R A /
/ D
D E L A Y
G E N E R A T O R A /
/ D I
SWITCHED CAPACITOR F I L T E R (LOW-PASS I
SWITCHED CAPACITOR f l L T C R
ktOW-PASSl
D E L A Y
G E N E R A T O R
D U A L
VIA
I N T E R
F A C E
UNIT
D U A L
VIA
I N T E R
F A C E
UNIT
B B C - B (1)
D U A L
VIA
I N T E R
F A C E
UNIT
1 u H Z eus B B C - B (1)
D U A L
VIA
I N T E R
F A C E
UNIT
B B C - B (1)
D U A L
VIA
I N T E R
F A C E
UNIT C H I P Z N 430
A - D POD
3 5 0 K H 2 O S C I L L A T O R
FOR F I L T E R S
DUAL
INTER
F A C E
U N I T
1 MHZ BUS
SWITCHED CAPACITOPq F I L T E R
[Clow-PA SSI
SWITCHED. CAPACITOR F I L T E R (LOW-PASS)
c
HY6HID
T E L E P H O
D O C 0 ( 2 )
r

Fig 4.1.2(a) continued. The FuU Circuit Diagram of the Speech Processor - Phase 1
83

\3ac ^Qj?eL B VIA
UA//T
DOtt 3
Cti ZTOO AX
-5CJ27 LOW ^AS3 /=/£T^/i At
U W 7itAf/^
U.W /fee
sac yyiODCL 3
e 3 / T
aus G
: J
8S(i) .

Step 2: Bandwidth Limiting
The Nyquist Criterion for 'sampling' prior to quantisation is that the analogue signal to be sampled must contain no frequencies higher than half the sampling fi-equency. In the Speech Processor the sampling fixquency is fixed at 8KHz, in line with current commercial practice and international recommendations. As a result the low-pass filter used to band-limit the analogue speech signal has a cut-off fi-equency of 3.5KH2. The design of the filter had to be refined several times to achieve sufiBcicntly low levels of aliasing so as not to mask small levels of distortion when packet delays were minimal - see Step 6 for detailed design.
Step 3: Sampling and Quantising by the POD
As mentioned above, the sampling rate was fixed at SKHz, using 8 bits per sample with linear quantising.
Step 4: Storage (Write-in/Delay/Read-out)
Each 8-bit byte of digitised speech fi-om the A-to-D pod is written-in to the RAM of the BBC in successive locations. At the same time ( - not quite, due to machine cycle offset) speech stored earlier is being read-out to the D-to-A pod. If there is no artificial delay being generated then there is a small time delay between the speech being written-in and when it is eventually been read-out, usually of the order of isecs.
The artificial time delay is produced by the Delay Generator which provides a range of pseudo-random numerical values being written-in sequentially fi-om the other port of the VIA. All bytes are delayed by a fixed minimum period (attributed to the protocol wrapping), added to this is the variable delay factor which is the traffic-dependant contribution.
The magnitude of the number read-in fi*om the Delay Generator provides the magnitude of the delay.
A number of revisions to the range of the pseudo random binary number (PRBN) and the mechanisms for generating it (software) had to be made before a suitable distribution was obtained.
The names given to the programs referred to above are:-
(a) The Delay routines - DELAY l-to-5
(b) Gaussian Distribution - GAUSS 1 (c) General Routines to read/write to the varioxis ports.
84

step 5: D->TO->A (Samples to RAM)
The 8-bit bytes are read-out of the RAM, having been delayed, and are fed to the D-to-A pod. The pod produces a Pulse Amplitude Modulated (PAM) waveform, the envelope of which contains the speech signal required, plus a number of unwanted higher order harmonics related to the sampling process which have to be removed.
(B) Hybrids...Echo/Return Loss
An additional source of noise and interference, which was generated from outside the PCM system, was the Hybrid Transformers. Similar unpublished findings by BT in 1987 have already had far reaching effects within the PSTN
The problem is best described by first explaining the role of the Hybrid (2 wire-to-4 wire converter) , then discussing its limitations in relation to the tests performed followed by a statement on the far-reaching implications of these findings.
Step 6: Reconstruction Filtering
The final low-pass filter passes the original speech signal but rejects the higher order harmonics related to the sampling process. Bandwidth 0-to-3.5KHz.
As with the initial filter, this filter had to be redesigned to enable low levels of distortion, due to delayed packets, to be measured meaningfully.
Major Areas Of DifiQculty
(A) Noise and Interference
In any system under test, it is important to reduce the amplitude of all sources of interference, other than that being measured, to a minimum. It is normal practice to ensure that the unwanted interference/distortion is at least an order of magnitude lower than that being measured. In some systems under test the difference has to be even greater.
With reference to the above, the noise generated during the A-to-D and D-to-A processes must be kept to minimum, so that only interference generated by the delayed/lost packets affects the user acceptability rating. The primary noise/interference sources generated within a PCM system are listed below:-
(a) Quantisation Noise - produced in the sampling operations.
85

(b) Noise due to Aliasing - as a result of imperfect filtering at both the I/P and O/P.
(c) Thermal Noise - due to the fact the system is being operated at a temperature which is above absolute zero, typically room temperature 293K.
The main mechanism for reducing quantisation noise is to increase the number of bits per sample which reduces the quanta size [see Ref 6 ppl25 for details] - however, the C C m have specified the complete PCM system [Ref 7] which fixes both the Companding Laws (A and \i) and the number of bits per sample at 8, and hence the quanta sizes and thus the noise, giving no room for manoeuvre.
Improving the filter performance offered the best opportunity to reduce system noise. This was achieved by dispensing with the usual multistage operational amplifier feedback configurations and moving to 'Switch Capacitor* filters. Linear ICs had just become available fi-om Linear Circuit Technology (LCT) in the USA which ofifcred extremely rapid rates of cut-off in the region of 80dB/octave on a single chip - the LCT 1062.
The reality of the situation was that although the filters did function a predicted, they proved extremely unreliable at first. The problems and their solutions are briefly listed below:-
(1) These filters require a 350KHz clock supply to function properly. The presence of this relatively h i ^ frequency near other devices operating at lower frequencies resulted in 'clock break through' which produced an increase in system noise. The physical configuration of the electronic components inside the Speech Processor had to be completely changed, with some having to be screened, against electromagnetic interference (EMI) to reduce the effects of clock break through to a minimum.
(2) The unreliability of the LCT 1062 caused dismay on several occasions until it was discovered that the devices on the chip were exU-emely 'load-sensitive', in spite of advice to the contrary from the manufacturers. Buffers were inserted between the LCT 1062 and all other components in the circuit with a result that no more failures resulted.
86

(3) Thermal noise is a physical limitation in electronic circuits which can only be reduced by lowering the temperature of the devices in the circuit. This is impractical for room temperature operated devices employed in a commercial or industrial environment.
The Role oftlie Hybrid in Speech Transmission
Hybrid transformers are a fundamental part of long distant telephone transmission and two such devices are employed in eveiy telephone conversation where the distances exceed 50km i.e. trunk calls. Its function is to separate the directions of transmission so that speech signals can be amplified by analogue amplifiers, as most amplifiers are only unidirectional devices (Repeaters - see Section 2.3.1).
Existing passive Hybrid devices have some serious deficiencies which have been well documented in a number of respected texts [Ref 19 Chapter 3], but the effects of these limitations have not adversely affected analogue speech transmissions as adequate engineering maigins were originally designed into the overall system. Unfortunately, digital systems are not as tolerant of the Hybrid's deficiencies as are analogue systems. This situation stems fi*om the fact that analogue systems contain a considerable amount of inherent redundancy, where as digital systems tend to be far more efficient in their use of system bandwidth. To put it more bluntly - there is a lot of 'slack' in analogue speech systems compared to their digital counterpart.
The main disadvantage of the passive Hybrid is that energy leaks across' the device particularly from the 'return side' to the 'go side', see Fig 4.1.2(b) below.
Go-Uf4£ Re^laeGr
TO i Go'
Fig 4.1.2(b) Basic 4-Wire Trunk Circuit Employing a Passive Hybrid.
C LOCAL Er^all'^J
87
The implication of this 'leakage' from Return to Go at each passive hybrid is that 'echo paths' are created which result in possible distortion of the speech for both the receiver and transmitter, as foUows:-
Echo at the Source The original speech is fed back to the source having travelled a distance equal to nearly twice the length of the connection. Fig 4.1.2(c) below indicates the mechanism for this type of echo.
It can be seen that the magnitude of the echo will depend on:-
(1) the amount of leakage that occurs across the passive hybrid. and
(2) the overall loop gain/loss of the 4-wire section, plus the losses in the 2-wire Local End (which will be a function of its length).
In addition, the delay in receiving the echo is also a factor in defining user acceptability. The factors which effect the 'echo delay' are:-
and (1) the distance the echo signal travels before eventually being heard.
(2) the velocity of propagation of the signals on the circuit.
In Figs 4.1.2(c) and (d) shown below the mechanisms for generating echoes are shown.
1
Fig 4.1.2(c) The Mechanism for Producing Source Echo
88

Go'
C
Fig 4.1.2(d) The Mechanism for Producing Receiver Echo
Implications of Echo in the Simulation of Speech Packet Delay.
With imperfect passive hybrids in the circuit, speech packets tend to circulate causing unwanted packets to be received which in turn generates noise and distortion and masks those effects due to lost packets that are being measured. It was therefore imperative that the echoes had to be considerably reduced in amplitude so as to make them inconsequential.
To achieve the goal stated above it was necessary to completely redesign the passive hybrid using active components that provided the required degree of isolation between the Go and Return and 2-wire points in the hybrid.
The circuits used are described in the next section.
Active Hybrids
With the design employed it was a straight forward matter to completely isolate the transmit and receive directions of transmission and thus remove a very large percentage of the distortion caused by echo. However, it is important in any type of subjective testing to reproduce circuit conditions that are as close to the norm as possible. To this end it was established by Richards [Ref 18] that if two directions of speech transmission in a real-time interactive telephone conversation are completely isolated then the users found that the circuit appeared *dead', as there was no feedback from
89

mouthpiece to earpiece. As a result, a certain amount of feedback is built into telephone instruments to give the impression that the telephone is Tive'. This feature is referred to as 'Sidetone', and the level require has been established for a whole range of conditions by Richards [Ref 18]
To satisfy the Sidetone requirements a very small amount of feedback was applied from the transmit side to the receive side of the circuit in the model by introducing a 'bleed-link' via a 47K ohm pot, as shown on Final Version of the Speech Processor circuit diagram shown in Appendix II. Adjustment of this pot effectively trimmed the circuit for maximum user acceptability prior to the tests beginning.
The block diagram of the Final Version (Phase 2) of the Speech Processor XI is shown overleaf in Fig 4.1.2(e), with the four BBC 'B* Computers coimected, the final version of the complete circuit diagram including the Ijleed resistors* for sidetone is also included.
On the page following Figs 4.1.2(e i & ii) show the Complete Circuit Diagram of the Speech Processor XI, with, Figs 4.1.2(f), depicting various photographs of the Speech Processor XI and the BBCs employed.
90

Fig 4.1.2 (e - i)> Set-up for Two way Subjective Testing on Randomly Blanked Speech
(
91

J ^ r . Q P r ^ ^ j ^ ^ ^ ^ ^ ^ ^ ^ ^
^ 3 c /
POAL V / A f r
usrn
a Wire Mr»
r
8 J>ATA a / r S /yj^ ^CA£V*»
s a c 3
sac i£
^'^i JI I I
cr

Fig 4.1.2.(e - ii):- Complete Circuit Diagram for Phase 2 of the Speech Processor XI
(
92

rW:-->-
CI I zroa
— I I
_ ( L < ^ [Hi V—(7 Zpj*** i7
V- V* rU'J- T t "
33 C ynov^^- ^
A
^f^t^^J^ro~i>A
Mm
r n
C7 J„ etocjf f
/ • O A .
s _
11. -1 27<»ri^,^ ^ ^ +5
STAa/UiC^
ref7Ai/A^AT,Ns cfA^t-r a / » z / . c ^ f / j ^ p ^ 7000
-TO A
*r>c.
iojc
^ I ^ATTgf^^
^ ;ej^ L£/a;Af^ ' 3*r3
7 / 8
/© / f
\
I f f / I T G
O/^S ' • ' ^ ^ ^ £ ^ , f , ^ ^
i l ^ - ' . 1 / *
/I r- I
4-i-2C£-iO

Fig 4.1.2(f) Photographs of the Speech Processor XI
93

(
\ 4 .1 .2 (0 Photographs of the Speech Processor X I

The next sections describe the subjective tests carried out in the labs at UoP using the Speech Processor.
4.1.3 Listening Tests with Fixed Delays.
By way of an introduction to subjective testing it was decided to:-
(a) use Listening Tests, as opposed to Conversation Tests, in the initial investigations,
and (b) employ Fixed Delays, as opposed to Variable Delays, in each direction
of transmission, in the first instance.
The initial step was to consider the type of material to be transmitted and the nature of the voice to be used. Following discussions with the Dr Ian Dennis of the Department of Psychology at UoP, and further investigations, it was decided to employ non-contextual material with a range of different speakers and listeners. The rationale for these choices were that:-
(1) Non-Contextual Material would be much more difl&cult for the listener, and hence much more demanding on the system, such that if the conditions imposed were found acceptable under non-contextual tests then it was expected that the results for the contextual material would be superior.
(2) Range of Speakers were employed so as to try and remove any particular misunderstandings due to regional accents or speech impediments, that might otherwise invalidate the results obtained,
(3) Range of Listeners were employed to tiy and avoid inaccuracies due to hearing irregularities, and similar reasons to those stated in (2).
The method employed for inserting fixed delay in one direction only entailed setting the switch box settings, see Fig 4.1.3, to the desired value - which ranged from:-
Ijisec in steps of 10 to lOOjisec lOO sec in steps of 100 to lOOO isec 1msec in steps of 1 to 100msec 100msec in steps of 100 to I sec
The BBC 'B' was programmed to read the switch box value and delay its reading-out of all the speech packets by the amount indicated.The results from this first investigation proved of Uttie value as fixed delays in listening tests are well known to be very difficult
94

10 detect because of the lack of any interaction between sender and recipient. However, one aspect of the testing procedure was brought into sharp focus that had been investigated in-depth by Richards [Ref 18] Le. the acoustics of the test area created considerable difficulties. Steps were taken to reduce reverberation times and limit all other sources of extraneous noise to a minimum, but this proved very difficult with the limited fiinds available. From this first series of investigations a considerable amount was learnt about conducting subjective tests. It was also decided to dispense with non-contextual material as source information because it was veiy difficult to generate, employ and evaluate. In addition, the selection of suitable candidates requires skill, as does the formatting of the questionnaire, if the results obtained are to be easily evaluated. ^
4,1.4 Listening Tests with Variable Delays.
The first step in this series of tests was to establish an appropriate delay distribution which mirrored the delays that packets were likely to experience on a typical LAN. It had been decided to concentrate the investigations on the Non-Deterministic LAN (CSMA/CD) as die relatively constant delay characteristic of the Token Passing LANs would only pose operational problems at very high traffic levels.
As stated eaiiier in 2.2.16, the delay characteristic of a CSMA/CD LAN lises exponentially with increases in traffic for loadings in excess of 30%.
The exact shape of the delay distribution for a LAN depends on the length of the network, the number of statioas, the traffic levels and the medium access strategy being employed. The general shape of the delay characteristic for different LANs are well known. Fig 4.1.4(a) over leaf shows the 'Mean Transfer Time/Mean Packet Transmission Time against Throughput Rate/Transmission Rate for both CSMA [Ref ( 91].
It should be realised that the values shown are average values and thus, by definition, do not apply to any particular set of practical conditions. However, they are representative of the delays that speech packets are likely to encounter on CSMA/CD and Token Passing LANs.
95

Fig 4.1.4(a) Distribution of Delays on a Typical CSMA/CD and Token Passing LANs
96

Fig 4.1.4(a) Comparisons of Delay/Throughput Charatcristics of CSMA/CD and Token Passing LANs Operating at 10Mbps [Ref 91).
(
(

Methods of Testing
Contextual material was employed using a range of different speakers and listeners for the reasons explained in Section 4.1.3 above. Speech packets were written into the memory of one BBC 'B*, while another machine was running the Delay Algorithm, thus making the two processes independent of each other. The actual delay value being employed in the reading out of the speech packets was controlled by the number generated by the Delay Algorithm. The larger the number the greater the delay, and visa versa.
(a) Non-Reordering of Delayed Speech Packets
With this system speech packets are not necessarily read out in the order that Ihey were written in, as the Delay Algorithm causes the computer to jump from one address to another under control of the delay generator's statistical algorithm. The effect on the intelligibility of reconstructed speech was very destructive resulting in a very low user-tolerance level, typically less than the equivalence of Imsec of delay. See the graph showing levels of user acceptability in Fig 4.1.4(b) over leaf. Initial Listening tests on user acceptability indicated that the reading-out of speech packets, making no attempt to reorder the delayed speech packets, resulted in a very low threshold -typically Imsec at very best. This result is hardly surprising when the practical significance of the these tests is considered. Referring to the PCM process described in Section 3.2.1, it can be seen that the delay process using the model as it stands, will cause the speech packets to be read back out of their original order, i.e. the original time sequence of the packets will have been destroyed. It was expected to find the speech badly distorted for even small delays, so the above results were anticipated. This can be appreciated as follows; employing the worst case value as an example, Imsecs worth of speech actually contains 8 speech packets, and the effect of changing the order of these packets, in sympathy with a semi-random algorithm, will almost certainly destroy the original intelligibility contained within the speech. In fact, the levels of limited recognition that could be achieved, in spite of the interference to the true packet order, was very surprising and can only be attributed to the marvellous capacity of the brain to pattern-match and contextually-interpolate in the presence of a large amount of noise. From the findings of the initial research described above it was apparent that speech packets, which had been subjected to varying amounts of delay, must be reordered at the receiving end before the digital-to-analogue conversion takes place. This reordering process is absolutely crucial to the successfxil transmission of conmiercial quality speech. The subject of Pattern-Matching and Contextual Interpolation will be revisited later in tiiis report when algoriUims to improve speech quality, in the presence of packet delays, are considered in more detail in Section 4.1.8.
97

Fig 4.1.4(b) Listening Tests - Variable Delays - No Reordering of Received Packets. [See Annex I for details of the tests]
98

BF414B.XLS
Fig 4.1.4(b)
LISTENING T E S T S AT UoP
Listening Tests Conducted at UoP of User Acceptability(%} against Speech Packet Delay With no attempt made to reorder the delayed speech packets.
Delay(ms) 0.1 0.2 0.3 0.5 0.7 10 U.A.(%) 100 99 97 93 89 80 70 30 15
Listening Tests at UoP
5?
a
I 0) tn D
100 90 80 70 60 50 40 30 20 10
0
T ' 1
• • J
• L 1
I I
1 3 1 I 1 1 [ J A 0.1 0.2 0.3 0.5 0.7 1 2 3
Speech Packet Delay(msec) 10

The Re-Order ing o f Delayed Speech Packets
T o alleviate the problem o f speech packets arriving out o f order, as discussed above, it was necessary to develop a re-ordering methodology within the Speech Processor X I . The simplest and easiest mechanism to implement, on the equipment available, was that o f a computer controlled Buffer-Store ( this w i l l be described in detail later in this section) into which all packets arriving at the receiving end are written, then re-ordered, before being read-out to the D- to-A converter.
This process requires that all packets be either:-
(a) Time-Stamped at the point o f origin,
or
(b) Numbered at the point o f o r ^ i n .
Both systems were considered in detail but it was finally decided to use (b) i n the model under test (because it was easier to implement than a real-time clock). However, in operational systems, time-stamping would be preferred where a multiplicity o f users are expected.
The merits and deficiencies o f these systems are briefly outlined below:-
Time-Stamping provides a global reference as to the order o f the packet, yet necessitates that all participants on the network have synchronised clocks (which is of ten d i f f icul t to achieve).
Numbered Packets do not cany any global time reference and therefore are not subject to the vagaries o f time-synchronisation. However, the packet numbering scheme to be employed needs to take into account the number o f stations that are likely to be connected to the neKvork. For small L A N s and systems limited to a f ew stations, Packet Numbering offers a very good solution, but when L A N s become interconnected to f o r m W A N s , Time-Stamping provides a better solution.
Results
From the graph shown below o f User-Acceptability against Packet Delay i n Fig 4,1.4(c) i t can be seen that the re-ordering o f the packets prior to the reconstitution o f the analogue speech at the receiving end has, as expected, considerably improved the system performance.
99

Fig 4.1.4(c) User-Acceptability against Packet Delay fo r Re-ordered Packets [See Annex I for details o f the test]
100

BF414C.XLS
Fig 4.1.4(c)
T A B L E O F L I S T E N I N G T E S T S A T UoP
Ciiirning T e s t s Conducted at UoP of User Acceptibility(%) against S p e e c h Packet Delay employing the Reordering of S p e e c h Packets using a Dynamic S p e c h BuHer of 100msec capacity
Delay(ms) U.A.(%)
0 ICQ
100
90
80
70
60
50
40
30
20
10
50 100
100 100
150 94
200 86
250 68
300 56
350 48
400 26
450 500 14
Listening Tests at UoP
8
50 100 150 200 250 300 Delay(msec)
350 400 450 500

It can be seen f rom Fig 4.1.4(c) that 70% o f users found delays in excess o f 240msecs unacceptable in these listening tests. In addition, it was found that the range o f delays, about a mean value, also influenced User-Acceptability; - the greater the range, the lower the User-Acceptability. With a mean value o f 34.5msec, which was specifically chosen to be 15% greater than the minimum delay value o f the truncated Poisson distribution (30msecs), User-Acceptability dropped below the critical value o f 7 0 % when the standard deviation o f the delay value exceeded 46msecs. These results are shown graphically in Fig 4.1.4(d) overleaf.
The results shown overleaf indicate that User-Acceptability drops o f f ver>' rapidly as the Standard Deviation is increased. T o obtain sensible results f r o m these tests it was decided to limit the maximum delay that the Delay Generator could produce and thus provide an indication o f the maximum delay to which the users were being subjected. The reason fo r this approach stemmed from the method being employed to reorder the delayed speech packets. I t was found that the re-ordering process necessitated the use o f a Speech Packet Buf fe r Store in the receiver (described below) which was effectively masking delays o f less than, say, lOOmsecs. As a result, the fol lowing factors assumed considerable importance:-
(1) the maximum delay - particularly i f it exceeded the delay introduced by the buffer store,
and
(2) the number o f times the maximum delay figure was exceeded in any given lime period.
The re-ordeiing process necessitated the use o f a dynamic speech packet storage mechanism (dynamic buffer) at the receiving end. The modification o f the Speech Processor X I to include this device is described below in Phase T w o o f the tests.
101

Fig 4.1.4(d) l is tening Tests Graph o f User-Acceptability against Standard Deviation o f the Delay about a Mean 15% greater than the M i n i m u m Delay. [SeeAnnex I for details o f the tests]
r •
102

BF414D.XLS
!5 S a
< Q) tA
100
90
80
70
60
50
40
30
20
10
0
Fig 4.1.4(d)
T A B L E O F L I S T E N I N G T E S T S A T UoP
Listening Tests Conducted at I JoP for User Acceptibility(%) Against Standard Deviat latlon of S peech Packet Delay in - (msec) About a Mean 15% Greater than the Minimum Delay
S.Dev 0 10 20 30 40 50 60 70 80 90 U.A.(&) 100 94 93 88 80 52 24 12 6 4
Listening Tests at UoP
10 20 30 40 50 60
Standard Deviation(msec)
70 80 90
O

IMjasc 2; Dynainic Re ordcr inti 4)f the Spi cch rac kcls
To achieve reasonable speech quality it had been found necessary to reorder the delayed packets thai had anived at the receiving end out o f order. To achieve this it was necessary to provide a dynamic buf fe r store where by packets were being read in I rom the line, reordered, and then read-out. This process required the inclusion o f a third B B C *B' computer to handle packet delay/re-ordering. Fig 4.1.4(e) overleaf shows the block diagram o f the system employed with B B C 'B's 1 and 2 providing the f ollowing facilities:-
(a) Reading the delay value f rom the Delay Generator, (b) Delaying the speech packet before writ ing it into the Dynamic BufTer
Store, (c) Re-order the speech packets in the D>Tiamic Bu f f e r Store, (d) Read-out the reordered speech packets to the D- to -A Convenor.
As wi l l be demonstrated later in this thesis, the inclusion o f this dynamic buffer store in the Speech Processor X I - Phase 2, Is o f considerable importance to received speech quality as it enables considerable improvements to be made to the levels o f user-acceptability in packet-switched voice systems.
lliose packets which have suffered very large delays wi l l not have been included in the read-out process (d) because they wil l have been out o f position at the time o f read-out, and wi l l , therefore, have been lost. This situation exactly models the characteristics o f a packet switched network/LAN where delayed packets w i l l not have arrived in lime to be read-out in the correct time sequence and wiU thus be disregarded by the receiver.
The size o f the dxnamic speech bulTer therefore controls what is in effect a buffer delay at the receiving end, and the dimensions o f this memory have an important bearing on the amount o f packet delay that is introduced by the system.
Dyi ia in i i Speech Buffe r Dimensions
It has been established in preliminary tests that the end-to-end delay must not exceed 240msec, even fo r listening tests (one way). As this is the very worst case condition then the delay introduced by the buffer must never exceed 240msec, in fact, allowance must be made for other operations i.e. A - > D and D - > A conversions. To cater for these aspects o f the process an allowance o f 60msec was made, leaving approximately 200msec for the buffer .
1 he speech digitising process in P C M produces 8000 - 8bit bytes per second, thus to introduce a 200msec delay the buffer size must be a minimum o f 8000x1/5 bytes = 1600 bytes, which poses no problems for any static or dynamic R A M chip.
103

Fig 4.1.4(e) PHASE 2 B L O C K S Y S T E M D I A G R A M
104

PHASE - 2
Investigation into the subjective effect of speech samples being randomly delayed, the speech is then reconstructed following the recording of the delayed packets wi thout th^ose p^^^ which have been delayed by an amount exceeding an arbitrary fixed maximum delay-value. - —
T E L E P H O N E A
S T A T I S T I C A L
D E L A Y G E N E R A T O R
HYBRID
SWITCHED CAPACITOR F I L T E R (LOW-PASS)
SWITCHED CAPACITOR F I L T E R (LOW-PASS)
C B 2 ^
U S E R P O R T
B B C
B ( I )
U S E R P O R T
D U A L 1 MHZ B U S
A - D POD
SWITCHED CAPACITOR Fl LTER.
(LOW-PASS)
3 5 0 K H Z O S C I L L A T O R FOR F I L T E R S
<^
LL D E L A Y A / ^ <^
LL G E N E R A T O R
> / D
A - D POD
DUAL
I N T E R -
SWITCHED. CAPACITOR F I L T E R {LOW-PASS)
HYBRID
1 MHZ BU^ B B C 8 ( 2 )
T E L E P H O N

In the original design 2K. o f R A M was allocated to this operation, but i t was found to be insufficient. Further investigation identified that reductions could be made in the time taken to perform the D - > A process i f extra memory was made available. As a result the memory allocation was increased to 3 K bytes.
Results
The surprising aspect of Uiis phase of Uie research work was tJte beneficiaL effect that the buffer had on user acceptability for yvide range of delay values. With the the delay generator producing a statistically varying delay pattern truncated at higher values from the keyboard, and limited at the lower value by the f i xed delay in the system, it had been expected that the user acceptability would be poor even fo r small standard deviations.
The delay variations which were greater than the buffer size (translated into the dimensions of time), resulted in those packets that had not arrived within the 'time window' provided by the buffer being lost Various buffer sizes were tried ranging
from lOObytes to SKbytes for different delay patterns and upper delay values. It was deduced from the listening tests that users became aware of delays at i 00msec but found them quite acceptable, and, as found with the fixed delays tests reported in Section 4.1.3, the length of the delay was unimportant - provided no interaction of any kind was required.
Relationship Between Packet L o s s ( % ) , Speech Parcel Size(bj les) and User Accept ibi l i ty .
As mentioned earlier in this thesis, the main thrust o f the research work is establish the operational criteria o f the transnussion o f both real-time speech and screen refresh data in the same C S M A / C D frame fo r reasonable user acceptibility. To this end it is impoitant to establish the optimum ratio o f speech bytes to screen bytes per data frame. However, user acceptibility is also a function o f the size o f the speech parcel and the packet loss rate. It was therefore decided to conduct series o f listening tests where user acceptibility was measure for a range o f speech parcel sizes at given packet losses rates.
Fig 4.1.4(f) overleaf shows a three-dimensional plot o f User Acceptibility/Speech Parcel Size(b>tes)./Packet Loss Rate(%).
105

Fig 4 1 4 ( f ) Listening Tests for User-Acceptability against Packet Loss Rate(%) f o r various Speech Parcel Sizes(bytes). [ See Annex I f o r details o f the tests]
106

SHEET2.XLS
Fig 4.1.4(f)
LISTENING TESTS AT UoP
Empteyinq C o n f Jrtu«l M f H I and Zmro InW A l ^ ^ r i ^ Speech Pared
(Bytaa) L O M ( % )
LISTENING TESTS AT Uo
P a c k . t L o t s (% S p « « c h P a r c e l 8 i x « {byUt

CHART3.XLC
o < 0) V)
3
500
100
Speech Parcel Size (bytes)
Packet Loss (%)
Page 1
CHART2.XLC
LISTENING TESTS AT UoP
1
2
5
• 10
20
50
100
200
500
Packet Loss (%) Speech Parcel Size (bytes)
Page 1

Conclusions f r o m the Listenhig Tests
The outcome o f these tests showed the importance o f the buffer in : -
(a) smoothing out delay variations
(b) providing a fixed time window within which the delayed speech packets must arrive i f they are to take part i n the reconstitution o f the speech
The final listening tests were o f particular importance in that a measure was obtained o f the optimum size for the speech parcel i n terms o f the packet loss rate. However, as mentioned above, tlie speech parcel size cannot be decided on these two factors alone as the screen refi'esh rate, packet transmission time, medium access rate and the speech parcel delivery rate have also to be taken into consideration. These factors are quantified below:-
Speech Packet Delivery Rate
With P C M it is necessary to deliver 8000 speech bytes(packets) per second. This can also seen as 8 packets per msec, or 80 packets per lOmsec etc.. f o r each direction o f transmission.
!
Packet Transmission Time
A tj'pical L A N will support a transmission rate o f lOMbps. I f the frame size is 1526bytes then the time taken to transmit the f u l l data frame is:-
(1526 X 8)bits/I0*7bps -= 1.22msec
Medium Access Rate This parameter is a function o f the traffic on through network, but i t is assumed that provided the network tralfic is below 30% o f the designed maximum o f lOMbps, then a station should be able to gain access at least every lOmsec, i f not more fi-equently. However i t should be remembered that a session requires the delivery o f data frames in both directions.
Screen Refresh Rate
For a screen 40 chaiacters wide by 25 rows deep, the number o f pixels contained within that screen fi-ame requires 64,000 bjtes i.e. 8000 bjtes. Given that the largest speech parcel size is likely to be 320 bytes ( f rom user-acceptablity ratings) and that the
107

overhead i n the data frame requires 26 bytes, then 1186 bytes are left f o r screen refresh bytes. Using this figure the screen coutd be refreshed:-
(8000/1186) X 20msec = 135msec per screen
This represents anproximateiv 7 complete screen refreshes per sec. (This is slow compared to a T V screen o f 25 complete pictures per second.) However, i t is expected that not all the screen wi l l need to be refreshed as some o f the picture detail w i l l remain the same, so the actual refresh rate could be much faster i f a sophisticated software package is provided to perform the necessary video processing.
With due regard for the above parameters it can be seen that although a speech ^ parcel size of 320 bytes could be employed, an optimum is probably 80 or 160 V_ speech bytes transmitted every 10msec, required in both directions.
It is possible to transmit a 160 byte speech parcel every 20msec, but as is explained in Section 4.1.8, the use o f a special algorithm to improve speech quality favours smaller speech packet sizes as a doubling o f the speech packet size is necessary.
In conclusion, one aspect not discussed so far in this report are the steps taken to minimise the effect o f lost packets. In tlie listening tests just described, an absent packet was given a zero value which translates into a pulse o f zero volts amplitude. As wi l l be seen later in the thesis (see Section 4.1.8), a number o f different methods are developed and investigated to minimise the effect o f these lost packets.
4.1.5 Conversational Tests with Fixed Delays
A considerable amount o f subjective research work was carried out in the late 1960s and early 1970s by telecommunications organisations into the effect o f fixed delays on conversational speech. This activity had been prompted by the development o f geostationary satellites f o r international telecommunications, as an alternative to submarine cables. Unlike the latter, geostationary satellites introduce significant transmission delays into the conversations being handled. The simple calculations below indicates the relative differences between the delays introduced by the two systems:-
Cable Transmission
Given that a typical transatlantic telephone call between, say, London and New York
has the fo l lowing parameters:-
(a) a circuit distance o f approximately 6,OO0Km,
108

(b) the speech energy travels at between 0.6 and 0.7 times the speed of light - 2.0 (10*8)m/sec over the cable, when it is possible to calculate the transmission time the signal, that is>
6,000,000/2.0(10*8) = 3.0(10*-2) = 30msec
Satellite Transmission
Geostationary satellites are positioned at approximately 36,000Km above the surface o f the Earth, so as to maintain the same angular velocity as the Earth (appear stationary to observers on the surface of the Earth), and balance their centrifugal force (due to their rotational velocity) with the gravitational pull of the Earth.
As a result of the satellite being positioned at this very high altitude there is a considerable time lapse in the speech signals travelling from London to New York, and/or visa versa.
As the height of the satellite is much greater than the distance between London and New York by a factor of 6, it is permissible to approximate the distance the speech signals travels to twice the height of the satellite, that is 72,000Km. With radio wave propagation systems the energy travels at very close to the speed o f light.
Calculating the transmission time is thus:-72,000,000/ 3(10*8) = 0.26sec = 260msec
It can be seen that the transmission delays are very different resulting in the satellite intioducing substantial delays.
As mentioned earlier in this section, the subjective effects on conversational speech of long fixed delays have been documented and result in very low user acceptability. Although it was decided not to duplicate the research work on fixed delays in detail it was necessaiy that the Speech Processor be tested to establish as to whether the results obtained from it agreed in general with those carried out by PTTs in Western Europe and the USA as a prelude to satellite transmission in the 1960s.
Loop Delay
As with the published results, it was found that the important parameter, as far as user acceptability was concerned, was the Loop Delay. This factor is the time taken for a signal to be sent (e.g. Hello...) and the response received by the original sender (....Hello) in return.
109

The apportionment of this delay, in terms of the Go and Remm speech chamiels is not particularly ciilical, although user acceptability started to fall o f f when the ratio of these two delays exceeded 4 to I for a loop delay on the threshold o f user unacceptability, 200msec in UoP tests. This value compares with 2l0msec established by the CC[TT. Fig 4.1.5(a) overleaf, shows the Loop Delay user acceptability ratings, while Fig 4.1.5(b) indicates the Delay Ratios for various user unacceptability thresholds.
Conclusions from the Conversational Tests with Fixed Delays
The results obtained at UoP concurred with those established by the CCITT/CCIR at a loop delay of 200insec which is within 10% o f the C C m / C C I R figure o f 192msec, In addition, the conclusions drawn that the apportionment of the delay in the two ( directions of transmission was not critical broadly agreed with the CCITT/CCIR recommendations on this subject.
From this work considerable confidence was drawn from the fact that the results obtained did agree with those published by CCITT/CCIR. As a result it was decide to continue with the testing as the Speech Processor had produced the correct results for the conditions imposed.
110

Fig 4.1.5(a) Loop Delay against User Acceptability Ratings for Conversational Tests where the delays are Fixed. [ See Annex n for details of Tests]
111

BF1G415AXLJS
I ^.
COiJvERSATIONAL T E S T S
Table ol RosuHs lof —^, ,— , , f s i ^ ^ m o x ^ ^
L.D.lms<^
Conversational T e s t s at UoP
100 o
25 50 75 100 125 150 175 Loop Delay (msec)

Fig 4.1.5(b) Ratio of the Go/Return Delay Ratio against User Acceptability for Fixed Loop Delays on Conversational Tests. [ See Annex n for details of Tests]
112

B F I G 4 1 5 B . X L S
Fig 4.1.5(b)
CONVERSATIONAL TESTS AT UoP
Takto of R m u H s for Commational Jmmta showing tho Uoor Acco|Mob«ty<%) in terms of C k>/fWtum ratio for dHforing vahioo of Rxod Loop Doloy (mooc)
Go/Ret. Rxod Loop Doloy Valueo (msac) Ratio
0 50 100 150 200 250 1.1 1CX> 100 94 84 70 44 1.2 100 100 94 84 70 42 1.3 100 100 92 84 70 44 1.4 100 100 94 83 70 42 1.5 100 99 90 82 68 42 1.6 100 96 89 80 66 40 1.7 100 90 82 74 58 34 1.8 100 80 72 62 48 18
I
100
90
80
70
60
50
40
Conversational Tests at UoP
I I
1.1
• 90 100 • 80 90 • 70-80 • 60-70 • 50-60 • 40 50 • 30 40 • 20 30 • 10-20 • 0 10
Go/Return Ratio
100
Fixed Loop Delay (msec)
1.7 150
200 250
Page 1 i a i i > ,

4.1.6 Conversational Tests with Variable Delays
Employing the expertise gained in subjective testing, while carrying out the Listening Tests, a representative cross section of people were gathered to assess the quality o f the speech for a range of speech packet delay conditions.
The test subjects were asked to conduct an interactive telephone conversation, via the Speech Processor X I , while some of the packets were being delayed in sympathy with the delay algorithm generated by the Delay Generator. Fig 4.1.6(a) below shows the full block diagram of the system employed to conduct the conversational tests at UoP.
Fig 4.1.6(a) Full Block Diagram of the Speech Processor X I as used in the Conversational Tests with Variable Delays is shown overieaf.
The description o f the operation of the above diagram has already been covered in Section 4.1.2. The main difference in the diagram shown in Fig 4.1.6(a) is that both directions of transmission have been equipped with Delay Generators that are statistically independent, thus requiring the fourth BBC microcomputer.
Tests with No Reordering of the Received Speech Packets
As experienced with the listening tests in this category, reported on in Section 4.1.4, the effect on the speech quality of not reordering the delayed speech packets was extreme. Introducing 1msec of average speech packet delay caused the user acceptability to drop dramatically, with conversations being unsustainable at 2msec o f average speech packet delay.
Tests with Delayed Speech Packets Buffered and Reordered
The introduction of the reordering and bufifering o f the received speech packets resulted in a marked improvement in the user acceptability. This situation is demonstrated in Fig 4.1.6(b) over leaf where user acceptability drops below the 70% value for average loop delays of approximately 200msec, a marked improvement.
113

Fig 4.1.6(a) Final Version of Speech Processor X I
c
114

DUAL V / A t
i f
Cuae
/ton
A/£i AO/A A/Ot, £>/A
caz
a rf/rj / f j A I MOiU
/
sac 3
4y
\ / \ / \ \
\ TT
C O X
S3C 2
Ci9i ( I _J I ] I ]
tf/r»5 ^<ojn Mo/sc es^Af^
7x
Fig 4 1.6(b) Conversational Tests of User Acceptibility (%) against Speech Packet Delay(msec) employing Reordering and a Speecli Buffer. [See Annex I I for details of the Tests).
r
115

Sheetl
^Fig 4.1.6(b)
i C O N V E R S A T I O N A L T E S T S A T U o P )
Conversat ional T e s t s with Variable D e l a y s for U s e r Acceptabi l i ty aga ins t Packet Delay employing Reorder ing and a S p e e c h Buffer
Delay(ms) U.A.(%) 100
AO 100
80 100
100 99
120 160 98 88
200 70
240 280 44 25
Listening Tests at UoP
0"
'3
< tt) {/)
100
90
80
70
60
50
40
30
20
10
40 80 100 120 160 200
S p e e c h Packet D e l a y ( m s e c ) 240 280

BUFFER SIZE
The optimum size of the buffer is a function of the maximum speech packet delay that can be tolerated in a given conversation, including all the fixed and variable delays.
To establish a figure for the buffer size a number of conversational tests were carried out using the Speech Processor X I for a range of buffer sizes.
Given that the buffer introduces a fixed delay, and its main function is to effectively 'mask' all variable delays while the reordering process is taking place, the real purpose of the tests was to establish the maximum fixed delay that could be introduced into a conversation for a 70% user acceptability ratio. AU packets that were delayed by more than fixed value introduced by the buffer were effectively excluded fi-om the reconstniction process and lost.
Following extensive testing it was found that the user acceptability ratio dropped to approximately 70% for buffer sizes introducing delays of the order of 100msec per direction o f transmission. This figure agreed with some earlier investigations carried by the CCITT/CCIR on the delays introduced by analogue satellite systems used to carry trunk telephony.
This figure o f 100msec deserves fiirther explanation in that:-
(1) the 100msec must be introduced in the receivers at ends of the link, thus giving a total loop delay of not more than 200msec,
(2) this loop delay is only 20% less than the fixed delay of 250msec encountered on geostationary satellite systems, which is found ^ unacceptable by most users,
(3) the total of 200msec delay must now be apportioned such that there is 100msec in each <lirection o f transmission.
Realisation of the Buffer
As the buffer's function was to both reorder the delayed speech packets and introduce a fixed delay, this was best achieved by employing the volatile memory (RAM) in the BBC computers (2) and (3) As ti^e speech packets would normally arrive at the receiving end every 125usec (at the rate of 8000 per sec) then a buffer store capable of dynamically holding 100msec worth of speech need only be 800 bytes in capacity. Practical tests showed that for operational reasons it was best to provide I K bytes o f R A M .
116

This capacity was easily available from the onboard R A M in the BBCs.
Conclusions on the BufTer Effectiveness
As mentioned earlier, the effect of the buffer on received speech quality \\?as to provide a marked improvement with average delays of the order of 100msec (in each direction) being within the acceptable quality range - compared with I to 2msec for non-buffered speech . Only when a the speech packet delay exceeded the buffer size was the packet omitted from the reconstruction process and the User Acceptibility start to fall o f f .
In the Speech Processor X I the techniques employed to deal with lost packets involved giving the empty packet slot an artificial value. In the tests described above it was foimd most convenient to ascribe a mid-range value (half way between the most positive value and the most negative value i,e. zero) to the missing packets. However, as will be seen later in this thesis in Section 4.1.8, still further improvements in speech quality can be made by careful consideration o f the arrangements made for dealing with the empty speech packet slots.
Another issue that was raised during the initial phase o f the conversational tests conducted at UoP that have just been described was Uiat of the effect of:-
(a) percentage packet loss/error rate
(b) speech parcel size
on the received speech quality particularly in view of the fact that LANs were to be the transport mechanism.
The next section discusses these issues.
4.1.7 Relationship between Speech Parcel Size. Percentage Packet Loss, and Clustering.
As an introduction to this aspect of the research, the earlier descriptions o f the L A N topology and access mechanisms for CSMA/CD, must be revisited.
The L A N frame size can be any length between 64 and 1,526 bytes with a typical 'overhead' of 26 bytes for every frame transmitted, with the ravy data rate on the cable being 10Mbps. As speech bytes are generated at the rate o f SKbytes per second it is expedient to send the speech packets in groups, or parcels, in an attempt to improve the transmission efficiency of the L A N . This technique lends its self ideaUy to the mixing of the speech packets (parcels) and the screen data within a L A N data frame that will
117

be required to be interchanged between workstations in the trtily interactive information systems required for manufacturing and design in the future, e.g. Multimedia for an automated manufacturing environment
Speech Packet Size
To investigate the optimisation of the speech parcel size two factors had to be considered, they were:-
(A) the ratio of speech packets to data packets in a CSMA/CD frame to sustain a satisfactory interaction.
(B) the maximum number of speech packets that can be sensibly transmitted in one frame.
(C) the delays incmred in assembling a large number o f speech packets.
Taking (A), little or no research had been reported in this area o f work, and only at the time o f writing are initiatives being launched in this area.
With reference to (B), using the Speech Processor X I it was possible to delay groups o f consecutive packets (later to be renamed 'clusters') and investigate the impact of the loss o f these parcels on the speech quality.
A rai^e of different parcel sizes were employed starting at 10 bytes and increasing up to 4000 (this represents O.Ssec of speech).
Before discussing the results obtained it should be remembered that in the previous tests only single packet losses were generated, effectively obviating the possibility of (
clustering.
It soon became apparent that, in this phase of the research, the loss o f consecutive packets had a more serious effect on the intelligibility o f the speech than did the loss of the same number of lost packets being randomly distributed.
From results obtained, user acceptability dropped to 70% when parcel sizes approach 320 bytes, provided that the occurrence o f such losses were iitfrequent. Speech with parcel sizes up to 1000 bytes were employed in the tests, but the were found to produce seiious distortion at times. Speech with 440 byte packets was still intelligible but the sound quality was deemed unacceptable by the testers. Before discussing the frequency o f parcel loss on a typical L A N , the effect of losing 320 bytes consecutively is explained.
118

The loss of 320 consecutive byles represenis the loss o f 40msec o f speech in one 'hil'. The effect of these delay 'hits' will depend on which part o f the speech is actually lost. I f the loss occurs in a period of silence i.e. a pause, then the hit will pass unnoticed. If, on the other hand, a part of a word is lost, then a measure of ambiguity is introduced into the conversation. 'Yhc level of this ambiguity was found to be a function of:-
(1) which part of the word was effected,
(2) the length of the word affected.
In (1) listening tests at Uop showed that the loss o f the first syllable introduced the worst ambiguity. The reason for this discoveiy was found in the fact that most English words carry a considerable amount of information in the first phoneme o f each word spoken (--SOmsecs of speech). I f this phoneme is lost then the remainder o f the word cannot often be uniquely identified by the listener.
Loss o f the middle or end syllables were found to be far less important. Although the delay liits caused ambiguity when the start of a word was lost it was found difficult to accept that the loss of so much of the word often resulted in only a minor loss o f intelligibility.
In (2) the same listening tests revealed that the shorter the word the greater was the efifect on intelligibility o f the loss of part o f that word. This was only to be expected, and came as no real surprise.
Test (1) were repeated a number of times, as were the tests in (2) to establish the high tolerance to delay hits demonstrated by those under test. It was eventually established that, in a conversational mode of test using a fairly limited vocabulary o f 500 to 1000 words, the brain was continually performing a form o f 'contextual interpolation' on the missing phonemes. This was established beyond ail reasonable doubt by retesting the subjects using non-contextual material e.g. reading passages from the telephone directory and checking their interpretation. In these tests the intelligibilily ratings were far lower than Ibr the foimer by I'acior of 20%. In addition, spoken language also contains a large poition of silence periods, so the probability o f a delay hit occurring in a period o f silence is quite high - and hence pass unnoticed - thus not effecting the intelligibility o f the conversation particularly i f the missing parcel is replaced with a zero value - exactly that which was losti
With regard to (C), the time taken to assemble large packets, test data from manufactures of CSMA/CD networks was veiy limited. Work earned by Prof Rodd at University of Wales (unpublished at the lime of writing) indicated that packet assembly times could well be of the order of 10s of msec.
119
Given that in many cases the speech packets may have to be injected into the n^wori< T Z AppUcatior^ (7th) layer of the ISO Model, these delays may be a cause for
concern.
As will be seen later in Section 4.1.8. that strategies to reduce these packetising delays are discussed and methodologies introduced to reduce, but not eradicate, this problem.
Practical Signincance of these Test Results
In a commercial/industrial environment it is often found that the technical vocabulary employed is limited by the very nature of woiic. As a result, the information system and its users are likely to be more tolerant of the loss of large packets due to delay hits. In -addition, the transmission of large data files that occur in an automated ofQce systems, C. and which can cause severe access delays to other potential users, tend not to be the norm in automated manufacturing environments - thus reducing the probability of a delay hit occiuring in the first place.
From these tests it appears that the use of a L A N to support both real-time speech and data for screen transfer as well as data for cell control, may well be possible for a limited geographical area.
The research work so far reported in this area stems fi-om Gruber[ReB3 and 34], Goodman[Ref27], Gallagher[Ref69], Voelcker & Crow[Ref68], Dunlop & Rashid[Ref24], Wasem et al[Ref28], and Nult & Bayer[Ref42]. All of these researchers have tested differing packet lengths but not to establish a packet length maximum for a user acceptability of 70%. l l ie main thrust of the research listed above is to test a limited range of relatively short packet sizes which would be compatible with existing infonnation systems i.e. 8, 16 ,32, 64 and 128 byte, for, say ISDN, ATM etc. No research has been conducted, other than that reported above at UoP, for combined speech and data in a manufacturing environment.
Percentage Packet Loss .V. Clustering
As mentioned earlier, packet loss, as a result of clustering, can, under the right conditions, be far more detrimental to the speech quality than the same number of packets lost in a randomly distributed manner. The reason for this situation is that for single packet loss the low pass filter in the receiver tries to linearly interpolates between amplitude of the sample preceding the lost sample and the amplitude of the succeeding pulse because of its relatively long time constant (a feauire of low-pass filters). In addition, the brain will also perform textual interpolation on the missing I25)asec of speech. For longer gaps the linear inteipolation becomes increasir^iy ineffective, while the textual interpolation using the brain continues to be effective. In addition, interactive
120

speech between humans has one significant advantage over data transmission between data terminals in thai the human user can easily ask for a retransmission of data in the event of a delay hit by requesting retransmission ...pardon!
As an attempt to provide some engineering significance to the relative packet losses in terms of error rates normally quoted for LANs the following figures are provided:-
Tcsts conducted at UoP showed that a 70% user acceptability ratio was obtained for packet losses of the order of 2% for small parcel sizes of less than 16 bytes. These figures were confirmed by similar work being carried out at B T R L by Voelcker[Ref 22 and 68] and Wasem et al [Ref 28] . The significance of these results are that a 2% packet loss translates into a bit error rate of 2 in 10*2. Comparing this value with typical L A N enor rate of 1 in 10*6 to 1 in 10*8 indicates that there will be no restrictions fiom a transmission view point (as anticipated). It should be appreciated that the enor rate quoted for the L A N in no way includes errors caused by medium access delays - the real source of the delays and hence system errors.
It is worthy of mention, at this point, of the high tolerance of real-time speech systems to lost packets. This implies that a high degree of redundancy , in terms of iitformation content, must exist in the waveform. The removal of this inherent redundancy by some bit-rate compression techniques will result in a considerable reduction in the ability of a real-time system to withstand significant packet loss and hence retain acceptable levels of intelligibility.
The source of the delays have now been identified and extensive tests have been carried out at UoP into (he levels of user acceptability for various types of delays for a range of packet losses and speech parcel sizes.
The next section deals with strategies developed at UoP to improve the quality of the received speech.
4.1.8 Methods for Improving Speech Quality
As mentioned above, steps can be taken to improve the quality of speech which has suffered packet loss. In the process described above lost packets were given mid-range values (zero volts) which, given tliat there aie a large number of silence periods in conversational speech, is the most probable level. This is only true for single packet loss which is occuning very infrequently ( typically one packet lost in a thousand ).
Fig 4.1.8(a) overleaf, shows the loss of a single speech packet (1 byte). The low pass filter's time constant is such as to have little or no effect on smoothing out the gap resulting from the lost sample.
121

Fig 4.1.8(a) Linear Interpolation of Speech SufTering Trom Single Packet Loss.
As multimedia systems in the future will employ LANs it was important to investigate methods for minimising the effect on speech quality of the loss of a large number of consecutive speech packets, as would be the case if parcels of speech, in the L A N data frame, were excessively delayed due to medium access problems.
For coasecutive packet loss, which occurs under clustering conditions, tests at UoP have shown that the use of a zero volt mid-range value, makes no substantial improvement in the user acceptability ratio. As can be seen from Fig 4. L 8(b) overleaf, the loss of a large number of consecutive packets results in the energy in the speech waveform tending towards zero volts - the mid-range value. This value has a very low probability of representing the actual speech that has been lost, unless a long pause had taken place in the conversation.
122
\ GAP IISI speCcrt
L O S T SceecH PACKETS
Fig 4.1.8(b) Effect on Speech Waveform when a Large Number of Consecutive packets are Lost
Tests at UoP indicated that not only was speech lost, and intelligibility reduced, but the loss of a group of consecutive packets produced an audible 'click' in the receiver, upon which some users commented (23 % of those tested). The reason for this 'click' can be seen from Fig 4.1.8(c) where the rapid transition at the start and at the end of the group of missing packets (samples) produces a sudden 'dc shift' resulting in transient being produced in the diaphragm of the earpiece of the telephone - hence the 'click*. For small nimibers of consecutively lost packets the transient produced is too rapid for the diaphragm to react as it is a mechanically damped system with considerable inertia.
V o L T A €r
Fig 4.L8(c) Generation o f Clicks' in Receiver due to the Loss of a Large number of Consecutive Speech Packets.
123

From the tests reported on above it was apparent that techniques needed to be developed to:-
(a) reduce the effect of lost speech packets and, if possible,
(b) replace the missing packets.
Reduce the Effect of Missing Speech Packets
There are a number of researchers active in this area who have proposed differing techniques to improve the quality of the received speech following delay hits. Listed below are their names and main areas of interest:-
(1) Dimlop and Rashid [Ref 24] - Reduced bit rate techniques. University of Strathclyde, Glasgow, U K .
(2) Flood and Tucker [Ref 23] - Speech Interpolation University of Aston, Birmingham, U K .
(3) Jayant and Christensen [Ref 25] - Odd-Even Sample Interpolation Procedure. (Bell Laboratories, Murray Hill, New Jersey, USA.)
(4) Wasem et al [Ref 28] - Waveform Substitution using:-(MTY, Massachusetts, USA) - Pitch Waveform Replication.
(5) Goodman et al [Ref 27] - Waveform Substitution using:-(AT&T Bell Research Labs, - Pattern Matching New Jersey, USA.) - Estimation of Voice Pitch,
(6) Gruber et al [Ref 33 & 34] - Substitution Techniques - Bell Northern, Research Labs, Canada.
Each technique proposed offers some improvement over the quality obtained by using the insertion of a mid-range value for lost packet(s), as described above. However, the types of testing employed were mainly of the listening variety. Work carried out at UoP has indicated that conversation tests are the only true measure of user acceptability. Flood [Ref 23] also suggest that listening tests are no substitute for conversational tests, however, the former are far more easy to control and evaluate.
The following subsections describe a series of techniques developed at UoP for improving speech quality, and their perfoitnance is compared with those listed above, as far as it is possible to compare listening tests with conversational tests.
124

(a) Phase Transition Reduction When packet loss occurs there is an abrupt phase transition, the magnitude of which depends on the amplitude of the speech at that instant. The worst case subjective condition exists when the lost packet contains a speech sample representing either a positive maximum {FF(16)} or a negative maximum {00(16)}, especially when contained in a sequence of similar values. Fig 4.1.8(d) below indicates the effect on the reconstituted speech of packet loss for the worst case condition.
V o L T S
Fig 4.1.8(d). Worst Case Phase Transitions due to Packet Loss
As mentioned above, the sharper the transition, the louder the 'click', and the more subjectively unacceptable the s>'stem becomes. To reduce the 'click' to a minimum it was important to reduce the rate of change of amplitude as far as possible. With single packet loss there is very limited smoothing produced by the low pass filter in the receiver. For multiple successive packet loss the low pass filter becomes ineffective, although it will reduce the rale of change of amplitude both at the beginning and at the end of the gap in the speech waveform caused by the packet(s) loss.
It was found after considerable trial and error that little improvement could be made over that already provided, by the low pass filter, and that it was cost-ineffective. As will be seen in the following results, far more substantial improvements can be achieved employing other algorithms.
Bench Mark System
As the system just described is effectively the 'Basic System', because no additional techniques are employed other than those required for normal PCM speech, it was decided to use the Retum-to-Mid Range value as the 1>ench mark' against which all other techniques would be measured i.e. a User-Acceptability Rating of 70% for 2% packet loss, for small packets (less than 16 bytes) and no clustering.
125

(b) Noise rnjected into the Gap in the Speech Waveform Left by the Missing Speech Packets.
A number of dilTerent algorithms were investigated in leims of:-
1. Their effectiveness compared with the standard smoothing technique,
and
2. The easy of implementation.
In the initial phase of the investigation missing packets were identified by the Speech ^ Processor and the BBCB's were used to insert a semi-random number, or series of semi-random numbers, into the store locations allocated to the missing packet(s). This is a different technique than that employed by Wasem et al [Ref 28] as the injection at UoP is carried out in the digital domain as opposed to the analogue domain. As will be seen, there are a number of significant advantages to this approach in terms of its effectiveness and ease of implementation.
Stage (i) Noise Insertion Algorithm - Not Related to the Energy in the Speech Waveform adjacent to the lost Packet
Once the missing packets had been identified, a series of pseudo-random 8 bit numbers were generated and inserted in the empty store locations which had been allocated to the missing speech packets. No attempt was made to relate the level of the noise, in any way, to the signal levels adjacent to the missing speech packets.
Subjective measurements indicated an improvement in the user acceptability for the ^ same levels of packet loss and no effective clustering, over the basic techruque (Retum-to-Mid Range value) of a factor of 1.5, thus raising the percentage packet loss to 3.0 for the same user-acceptability ratings.
On inspection of the reconstituted analogue signal, it was possible to see the effect of the noise insertion on the phase discontinuities by very carefiil triggering of the storage C R O in conjunction with the BBCT3' that was generating the random numbers. As expected, the severity of the phase transitions had been considerably reduced, thus diminishing the subjective effect of the audible clicks. However, the improvement in user acceptability obtained was not as significant as was expected.
Further investigation showed that the algorithm being employed had the same statistical distribution as that ased to simulate packet delay occuirence (prior to skewing) i.e. a Normal distiibution with a mean of zero. The impact of the Normal distribution, as
126

opposed to a truly random distribution, is that the numerical values produced in the former will have a much higher probability of being zero than would be the case for the latter. As a result the phase transitions would not be removed but just 'probably' reduced in magnitude - hence the 50% improvement in acceptable packet loss to 3.0%.
The use of a pseudo-random number generator with upper and lower bounds coinciding with the positive maximum and negative maximum speech levels respectively, produced a significant improvement in acceptable packet loss to 4.0%. The pseudo-random numbers now being generated were eqimlly probable.
Investigation of the analogue waveform (after reconstruction) as before, revealed that the phase transitions had been reduced in amplitude still further, but that the level of bacl^ound noise had increased considerably, although User-Acceptability ratings had improved. Fig 4.1,8(e) below shows the time domain representation of the reconstituted speech signal with Gausian noise inserted in the gaps caused by lost packets.
Further tests were scheduled to be carried out in this area but the resolution of the test equipment available at UoP had been reached. As a result, it was at this point that overtures were made to British Telecom Research Laboratories (BTRL), Martlesham, Ipswich, UK, to use their more sophisticated subjective testing facility. In the event, this aspect of the research was never fully explored at B T R L due to the lack of time available at the test facility due to commercial pressures within BT.
^ T T M C
To LOST pftQiers
Fig 4.1.8(e) Time Domain Representation of Reconstituted Speech with Gausian Noise Injected in the gaps left by Lost Speech Packets.
127

Stage (ii) Signal Related Noise Insertion Algorithm
Earlier research woik carried out by Gixiber [Ref 21,33 & 34] suggested that improvements in packet-switched speech could be made by injecting noise into the gaps at a level related to the signal level either side of the lost speech. With the buffer store holding lOOmsec of speech (800 packets), it was possible to obtain an average value of the signal level over a number of packets covering the lost packet(s). Following considerable trial and error it was found most appropriate to employ a frame of 32 bytes (speech samples), including those lost. As expected, the lower the packet loss, the more effective this technique became - as with the others.
The averaging process took the average of the amplitudes before the lost packet(s), and z^-performed the same operation on those packets succeeding the lost packet(s), then the ^ -foUowing procedures were adopted:-
(a) If only one packet was lost then it was given the 'average of the averages'.
(b) I f two consecutive packets were lost then the first packet was given the value established by averaging the preceding packets amplitudes, while the second missing packet was given the value established by the averaging of the succeeding packet amplitudes.
(c) For multiple packet loss the store locations allocated to the lost packets were divided into three approximately equal groups, with:-
1. the first group all given the same value as the preceding packet average,
2. the middle group given the 'average of the averages' ^
3. the last group all given the same value as the succeeding group.
The results of these tests showed a marked improvement over the Non-Speech-Related Noise Insertion Algorithm by increasing the percentage packet loss to 5% for the same User Acceptability ratio. This value of 5% compares with a similar figure reported by Wasem et al [Ref 27] and Goodman et al [Ref 27] for a Repeat Last Packet Algorithm, where the last missing packets are replaced by a copy of those already sent. Given the presence of the speech buffer in the receiver, and having studied the implementation techniques for the two methods, it would appear that the Repeat Last Packet Algorithm is much simpler and faster to implement than the Signal Related Noise Insertion Algorithm developed at UoP. However, when the tests were repeated at UoP it was found impossible to achieve the results obtained by Wasem et al and Goodman et al. The reason for this
128
discrepancy could well be attributed to the differences in equipment types and set-up levels.
Natural Caps/Pauses in the Speech
An area of concern during the noise insertion tests was that of the injection of noise into natural gaps or pauses in the conversation speech, in addition to those gaps caused by packet loss, thus tending to destroy its original integrity.
Subjective tests at UoP indicated that User-Acceptability levels appeared to be little affected by the injection of noise in to the empty speech slots. However, to the trained ear, the background Tiiss' (ver>' akin to tape hiss on magnetic recordings) generated by the noise being injected into empty slots could be heard plainly.
There was obviously a need to be able to differentiate between gaps in the speech caused by packet loss, and those that occur naturally. Using the Speech Processor X I there was no obvious way in which this could be achieved as the length and statistical nature of both are almost identical.
A meaningful test that needed to be carried out was that of somehow only injecting the noise into the missing-packet slots and not those naturally left empty by pauses in the conversation. By employing the Speech Processor X L and modifications to the software, this was attempted at,UoP using the Packet Delay Generating Algorithm to only 'enable' tlie Noise Injection Algorithm when speech packet(s) were about to be removed (lost).
Unfortunate^, these tests were unsuccessfxil in their attempt to inject the noise into only the empty speech packets. Much effort was expended on this seemingly straight forward task without any reward and it was eventually abandoned.
However, in the ne.xt set of tests, it was decided to remove any gaps in the speech wavefonn, irrespective of whether they had occunred as a result of lost packets or natural pauses in the speech.
(c) Time Compression Tests
I'or this series of tests an algorithm was developed to remove any packets that contained a zero value, thus compressing the speech waveform in the time domain. The greater the number of consecutive packets that are missing, the greater is the compression.
r'rom the veiy outset of these tests it became apparent that the quality of the speech was going to be severely affected, even for relatively minor time compressions. The
129

main complaint from die users was thai the character of the voice changed depending on the degree of compression that was taking place. As this time compression was not only a function of the packet loss, but also the number of natural pauses in the conversation, the probability of compression occuning was fairly high.
The main change that occurred in the character of the voice was that the pitch of the voice increased (the Chip-Monk effect). As a result, it proved very unpopular with (he male pailicipants in the tests.
Even using relatively small packet sizes of 16 bytes, the compression that occuired rendered this technique of little value.
(d) Pitch Replication and Pattern Matching
fhe above techniques have exhaustively researched by Wasem et al [Ref28] and Goodman et al [Ref27] using sophisticated test equipment similar to that available to B T R L . It was felt that there was little value in repeating these series of tests, but instead develop and investigate new techniques for improving the quality of the speech suffering fi-om lost packets. The Results from Wasem et al and Goodman et al are quoted below for the sake of completeness. It should be noted that the results are for relatively small packet sizes .i.e. 128 bytes maximum, and wilh no attempt to assess the eflfect of clustering losses.
It has been subsequently established at both UoP and B T R L that the effect of 'clustering' is extremely significant and requires ftulher investigation.
(
130

S -R -O -T -P -
S I L R N C E S U B S T I T U T I O N ( M I D - R A N G E S U B S T I T U T I O N ) P A C K E T R E P E T I T I O N ONE-SIDED P A T T E R N M A T C H I N G TWO-SIDED P A I T E R N M A T C H I N G P I T C H W A V E F O R M R E P L I C A T I O N
Fig 4.1.8(0 Mean Opinion Score as a function of Percentage Missing Packets for, Mid-Range Substitution, Packet Repetition, One and Two-Side Pattern Matching, and Pitch Waveform Substitution, [Ref28].
From the above curves it can be seen dial, for a 70% User-Acceptability rating, the maximum missing packet ratios that can be tolerated are:-
1. Mid-Range value <2%
2. Repeat Last Packet <5%
3. One-Sided Pattern Matcliing...<6%
4. Two-Sided Pattern Matclung...<6%
5. Pitch Waveform Replication...< 10%
131

From these results the Pitch Waveform Replication technique offers either:-
a) a considerable improvement in User-Acceptability for a given Missing Packet Ratio over the Bench Mark,
or
b) for a given User-Acceptability Ratio a far higher Missing Packet Ratio can be tolerated.
A detailed explanation of the operational details of the Pitch Waveform replication technique can be found in [Ref28].
(e) Speech Parcel Duplication (UoP)
Given that this research is aimed at providing a real-time interactive speech facility between workstations connected to a CSMA/CD L A N for the support of a CIM environment, it was decided to take a closer look at the structure of the information medium in terms of:-
the LAN packet structure,
and
2. the relationship between the types of information to be canied by the LAN in the same CSMA/CD data frame
As the CSMA/CD data frame can carry up to 1,526 bytes there is likely to be Z^-considerable spare capacity in the data frame after the requirements for the screen data, ^ the speech data, and any manufacturing cell control data have been met. As a result, it was decided to investigate the possibility of employing this spare capacity to develop a form of speech packet duplication and thus reduce the effect of speech packets being lost i h r o i ^ excessive dehys.
A number of methodologies were investigated at UoP, but the most effective proved to be the arrangement where by a form of 100% redundancy is employed as follows:-
Each speech parcel, comprising 'n' bytes, is first copied and then the copy is divided in to two equal parts of *n/2' bytes. Assuming that this is the Nth speech parcel the first half of the divided speech parcel is included in the preceding CSMA/CD frame -{N-l}lh (remember there is a speech buffer at the transmit end as well as the receive end) along with the complete {N-l}th speech parcel. The second hall' of the copied Nth speech parcel is now inserted in the {N+l}th CSMA/CD frame along with the
132

compleie {NMHli speech parcel. Meanwhile the original Nth speech parcel is inseited mto the Nth CSiVIA/CD frame - this CSMA/CD frame will also contain the first half of the {N+l}th speech parcel and the second half of the {N-l}th speech parcel. Fig 4.1.8(g) below indicates the arrangement just described.
S P E E C H P A R C E L S P R I O R T O DUPl J C A T I O N '
A . C m - O TV
V CSMAyCD F R A M E S T R A N S M I T T E D C O N T A I N I N G D L T P L I C A T E D
P A R C E L S
Fig 4.1.8(g) Diagrammatic Representation of Speech Parcel Dupllcatiun.
It can be seen from this technique that should a CSMA/CD frame, say the Nth, be lost due to delays as a result of medium access problems'caused by heavy traffic on the LAN, then the Nth speech parcel contained within the lost frame can be reconstituted from the speech parcels in {N-I}th and the {N+l}th CSMA/CD frames. The impact of this methodolog>^ on the network, is to increase the data traffic and hence the loading, which could increase the access delays, and thus nuUiiy any advantage gained. However, if the various effects are quantified, it can be seen that the speech traffic will double in the first instance. A range of speech parcel sizes (64, 128, or 256 bytes) have been proposed by B T R L [unpublished report on optimum speech parcel size]. Although there are advantages to increasing the parcel size to a maximum in terms of transmission efficiency, the processing delays for large packets impose a ceiling on the packet size of 64 b aes. Using this figure to compute Ihe increase in data traffic as a result of duplicating the speech parcels, it can be seen that the speech traffic will rise from 64 bytes to 128 byles in a frame capable of carrying 1,518 by1os. This represents an increase in actual data traffic from 4.2% to 8.4% for a frill packet. Provided that the composite (speech and data) traffic level remains below the critical
133

30% of the LANs total traffic carrying capacity then this small percentage increase in traffic will have an insignificant effect on the delay characteristics of the network.
In tests carried out at UoP this technique displayed considerable potential. The main problem was in the implementation, and particularly the processing delays both at the transmit buffer and the receive buffer. Using BBC'B's with relatively low clock speeds, by 486 standards, the loop delay rapidly approached the critical figure of 200msec. However, inspite of these processing delay problems the Lost Packet ratio for a 70% User-Acceptability ratio for SPD algorithm exceeded that reported by Wasem et al[Ref28] for their Pitch Waveform Replication(PWR) technique by 1.6% see Fig 4.1.8(h) overieaf for details.
Fig 4.1.8(h) shows that for a User Acceptibility of 70% SPD(UoP) algorithm can ^ tolerate a 11% Packet Loss, whereas the P W R (M.I.T.) technique requires a Packet Loss Rate of 9.4%.
Use of high speed processors would substantially reduce the processing delays to well below the 200msec and thus make this technique a VQty powerful alternative to those proposed by Wasem et al and Goodman et aL Theoretical studies indicate that the Speech Parcel Duplication technique should only cease to be effective when two success CSMA/CD data fi-ames are lost, any situation less critical than this should be recoverable.
Time did not permit the testing of this technique on a true CSMA/CD network loaded with data traffic, but it is the intention to continue diese studies with the assistance of a DTI grant.
It should be pointed out that this technique Ls very appropriate to L A N topologies, particularly in manufacturing where the full data frame is invariably not used, as only \ short control messages are being exchanged across the network. This contrasts with the automated office environment where large file transfers tend to be the norm, using the full frame.
Fig 4.1.8(h) overleaf compares the effectiveness of two techniques for improving speech quality given that a number of consecutive speech packets are lost due accessing/processing delays.
Fig 4.1.8(i) compares the effectiveness of four techniques for improving speech quality, the two shown in Fig 4.1.8(h) and two less effective techniques employing Zero Infill Algorithms developed at UoP and M.I.T. respectively.
Fig 4.L8(j) shows a three dimensional plot of User Acceptibility(%) against Speech Packet Loss(%) for Listening T ests using the SPD Algorithm developed al UoP.
134
Fig 4.1.8(h) Comparison of Listening Tests I. UoP SPD Algorithm
M.I.T. PWR Algorithm
135

BF418H.XLS
R g 4 . 1 . 8 l h )
C o m p o r i i o n o f U r t e r d n g Tests 1. UoP SPP A i g o r i t h m 1 6 0 b y t p parcel - [See A n n o x I f o r detai ls o f Tes t ino l 2 . M . t . T PWR A l g o r i t h m 1 2 8 byte parcel - 1 . . J i
PL(%) 0 .1 0 . 2 0 .5 1 0 2 0 5 0 U o P O ) 1 0 0 1 0 0 0 5 9 1 8 3 7 2 6 9 2 5 M.I .T.(2» 1 0 0 9 9 9 7 9 4 8 9 7 9 6 3 2 0
A Comparison of Algorhhms to Improve Speech QuaCty fodowing the Loss of some Speech Packets
1 0 0
9 0
8 0
7 0
6 0 # f Z I -
4 0
3 0
2 0
10
1 ' [
1 1 1 1
1 1
1 1
c 1
I 1
I
1
1
1
1
• UoP (1)
• M.I .T. (2»
0 .1 0 . 2 0 .5 1 2 5
Speech Packet Lcns (%)
1 0 2 0 5 0
PoflO I ^ S t i ^ ,
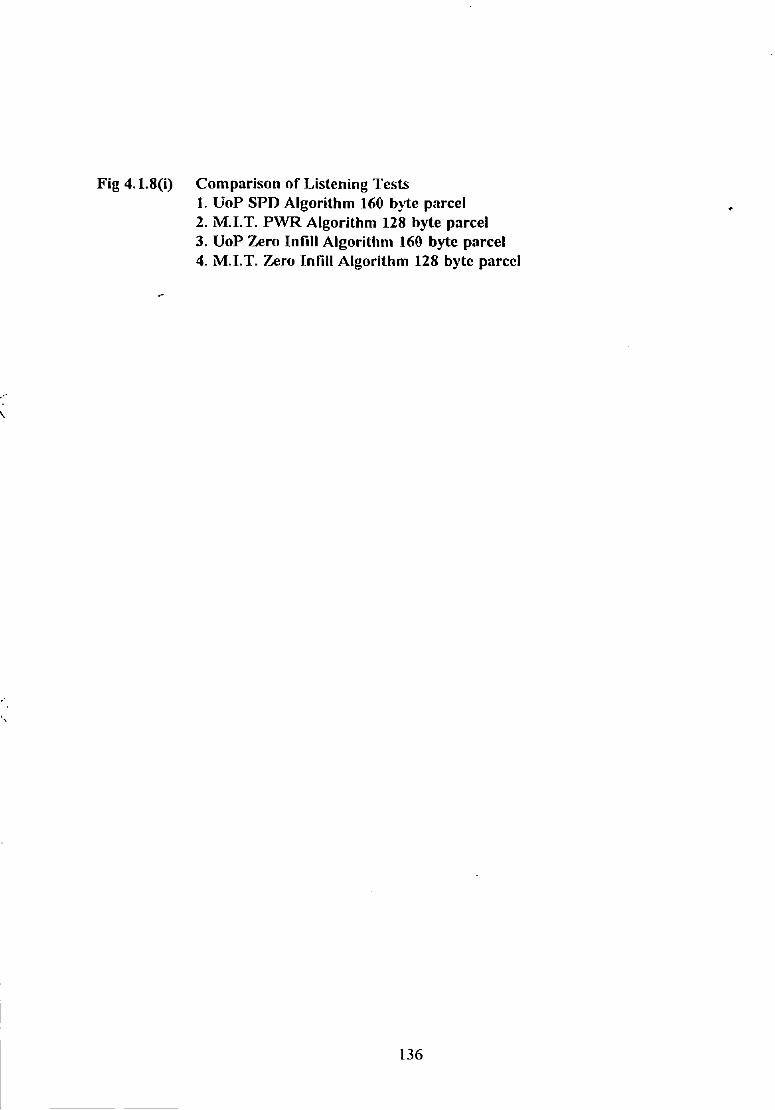
Fig 4.1.8(i) Comparison of Listening Tests 1. UoP SPD Algorithm 160 byte parcel 2. M.I.T. PWR Algorithm 128 byte parcel 3. UoP Zero Infill Algorithm 160 byte parcel 4. M.I.T. Zero Infill Algorithm 128 byte parcel
136

BF418I .XLS
Fig 4 . 1 . 8 ( i )
Compar ison o f Uv ten ing Testa - [See A n n e x 1 f o r detsQs o f Tests] o f Testa] 1. UoP SPD A l g o r i t h m 1 6 0 b v t e paicel)
2 . M . l . T PWR A l g o r i t h m 1 2 8 b y t o parce l
3. UoP Zero I n f i l l A l g o r i t h m 1 6 0 by te parce l
4 . M . l . T . Zero I n f i l l A l g o r i t h m 1 2 8 b y t e packe t
0 .1 0 . 2 0 .6 1 2 5 1 0 2 0 6 0 UoP (1) 1 0 0 1 0 0 8 8 9 5 9 1 8 3 7 2 6 9 2 6 M . I . T ( 2 ) 1 0 0 9 9 97 9 4 8 9 7 9 6 9 6 3 2 0 UoP(3) 1 0 0 9 7 88 7 8 8 6 4 6 3 0 14 6 M . I . T { 4 ) 1 0 0 9 6 89 7 7 6 5 4 6 2 9 1 2 6
Comparison of Algorithms to Improve Speech Quality
1 0 0
9 0
8 0
7 0
6 0
^ 6 0 3
I 4 0
3 0
2 0
1 0
t
1 1 1 1 1 1
< 1
1 I 1
1 1
1 1 1 1
I I
1 t 1
c
I
}
1
( 1
I i 1
1 (
1 1
1
• UoP n i
• M . I . T ( 2 )
• UoP(3)
• M . I . T ( 4 )
0 .1 0 . 2 0 .6 1 2 6
Packet Los* (%)
1 0 2 0 6 0

Fig 4.1.8(j) The Final Listening Tests at UoP
A Graph of User Acceptibility(%) against Speech Packet Loss(<yo) and Speech Parcel Size using the SPD Algorithm developed at UoP. [See Annex 1 for details of the Tests]
\
137

B F 4 1 8 J . X L S
Rfl4.1.8(j)
Lwteninq T e f mt UoP employing the SPO Algorithm [See Annex I for rtatifc]
A Graph of User Acceptibility<%) against Speech Packet Loss Rate(%) for Listening Tests using the Speech Packet Duplication (SPD) Algorithm developed at UoP
Packet Speech Parcel Size loss(%)
10 20 5 0 100 2 0 0 100 100 100 100 100 99 100 100
0.1 100 100 100 100 100 100 100 99 0.2 100 100 100 100 100 100 98 9 9
9 8 97 94 8 4 8 0 68 57 20
0 .2 100 100 100 99 99 99 0.5 100 98 98 100 99 99
100 100 98 100 98 98 981 98^
100 99 100 99 99 97 94 10O 100 100 99 38
10 100 99 98 95 91 82 76 20 99 95 90 85 80 70 67 50 59 49 42 39 37 35 30
Listening Tests at UoP using SPD Algorithm
i
90 100
60 70 50 60 40 5 0
• 30 4 0
20 30 10 20
Packet Loea Rate(%) Size (byte« )
Conclusions
Of the methodologies currently available, Pitch Waveform Replication [Ref28] gives a lost packet ratio of 9.4% for a 70% User-Acceptability rating using a speech packet size of 128 bytes, whereas the Speech Parcel Duplication algorithm developed at UoP supports a lost packet ratio of 11% for the same User Acceptability rating with 160 byte speech parcels.
The use of 160 byte speech parcel size in the above mentioned Listening Tests at UoP is appropriate to LAN transmission as the optimum speech parcel size to support commercial quality real-time speech transmission (with a reasonable screen refresh rate) is between 80 and 160 bytes, as discussed earlier in this thesis in Section 4,1.4.
Further discussions on this aspect of the research woric conducted at UoP are developed in Section 4.3, the Conclusions to this chapter.
The next section describes the listening Tests canied out by the author o f this thesis in conjunction with BTRL stafiF at Martlesham, UK
4.2 TESTS CONDUCTED AT BTRL. MARTLESHAM. UK.
As a result of initial approaches made by Mr Peter See and Mr Ian Gallagher, both of BTRL, following the presentation of the paper specified in Ref 53 at the lEE Conference on Trivate Switching Systems and Networks*, the author of this thesis applied for, and was awarded, a Short-Term Research Fellowship by BTRL. The thrust of the research to be carried out at BTRUs Research Labs at Martlesham, Ipswich, over the period 6th July 1989 to 18th August 1989, was to conduct subjective tests on the effect of packet loss on real-time speech when transmitted over a packet switched system, using BTRIJs sophisticated subjective testing facility, and hence confirm some of the results obtained at UoP as reported in Ref 51-to-57.
Due to the important nature of the results analysis, BTRL agreed to extend the Research Fellowship to 7th September 1989.
4.2.1 Aims and Reasons For These Investigations A new generation of information networks being offered, mainly by computer manufacturers, are 'packet switched' as opposed to the more conventional 'circuit switched' systems offered by Telecommunication Providers (PTTs). BT's concern over the possible ability of these new networks to carry real-time speech, and hence act as a possible competitor in the speech transmission market, had prompted these investigations into the operational capabilities of LANs.
138
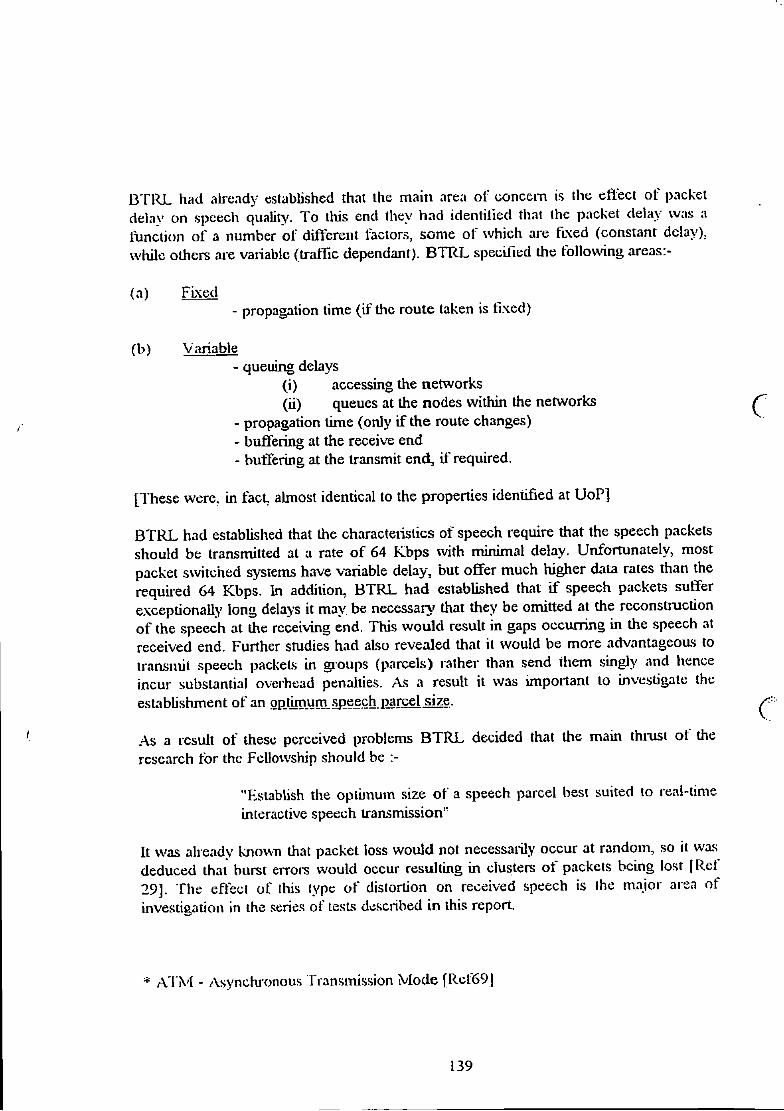
BTllL had aheady established thai ihe main area of concem is the elYect of packet delay on speech quality. To tliis end Ihey had idenlilied thai Ihe packet delay was a liinction of a number of different factors, some of which ai-e ftxed (constant delay), while others are vanabic (traffic dependant). BTRL specified the foilo\\ang areas:-
(a) FLxed - propagation time (if the route taken is fixed)
(b) Variable - queuing delays
(i) accessing the networks (ii) queues at the nodes within the networks
- propagation time (only if the route changes) ^ - buffering at the receive end - buffering at the transmit end, if required.
[These were, in fact almost identical to the properties identified at UoP]
BTRL had established that the characteiislics of speech require that the speech packets should be transmitted at a rate of 64 Kbps with minimal delay. Unfortunately, most packet switched systems have variable delay, but ofifer much higher data rates than the requiied 64 Kbps. In addition, BTRL had established that i f speech packets suffer exceptionally long delays it may be necessarx' that they be omitted at the rcconsimction of the speech at the receiving end. This would result in gaps occurring in the speech at received end. Further studies had also revealed that it would be more advantageous to transmit speech packets in gioups (parcels) rather than send them singly and hence incur substantial overhead penalties. As a result it was important to investigate the establishment of an optimum speech parcel size.
As a result of these perceived problems BTRL decided that the main thrust of the research for the Fellowship should be :-
'*F,stablish the optimum size of a speech parcel best suited to real-time interactive speech transmission"
It was alieady known that packet loss would not necessaiily occur at random, so it was deduced that burst eiTors would occur resulting in clusters of packets being lost [Ref 29]. The eflecl of this lype of distortion on received speech is Ihe major area of investigation in the scenes of tests described in this report.
ATN'l - Asynchronous Transmission Mode fRcl^9|
139

Test iVlethodologies
BTRJ^ have an international reputation for their experii.se in subjective testing stimulated originally by the excellent work carried out by D.L.Richards [ReflSj in the early 1970s. The facilities now available at B1RL Martlesham rank with the best in the worid.
Due to the complex nature of the procedures at BTRL, it was decided to fu"st conduct listening tests, as it was felt that to embark immediately on the conversational tests would introduce too many variables, in terms of speakers (male/female), listeners (male/female), speech levels, packet clustering and loss rate, for a sensible results analysis in the time available. As a result, the number of variables that required investigation are listed below :-
(a) Packet Clustering (b) Packet Loss Rate (c) Received Level (d) Male.^emale Talkers
It is usual to employ a technique called the Analysis of Variance to analyse subjective tests. In brief, it is important to establish that the results contain a correlation ('significance') only between those variables where it is expected i.e. between User-Acceptabilit\^ and Packet Loss Rate, Clustering levels and Received I.^vels. and not between unconnected variables i.e. Female Talkers and Male Talkers, say. As can be seen, it is important to establish the credibility of the testing procedures by removing any inconsistencies - these can be identitied (if they exist) by the Signiljcance_Te ^ ^ reported on in the next section.
To say that an interaction/indi\adual contribution is 'significant' means that there is less than a 5% chance that the occunence was due to experimental error. A 'highly significant' rating indicates a less than 1% chance of the occurrence being due to experimental error.
A statistical tool for camming out Sigi\ificance Tests is the Latin Square, litis technique is also described comprehensively in the fijil BTRJ.. Fellowship Report. The basic reason for using the Latin Square is to randomise the testing procedures, i.e. thoroughly 'mL\' all the different rest condition, so that any nuisance factors/experimental erroi-s can then be readily identified in Ihe Significance Tests. Due to the number of conditions needed to be covered, and given the number of diifereni variables that had been identified for the listening tests, it was found (hat the basic Latin Square was inadequate for the intended puiposc. As a result, the basic Latin Square was enhanced lo fonn a Gracco-Latin Scmarc. w hich was capable of providing a sulTicient number of condiiions io cover all the test conditions demanded. The anay
140
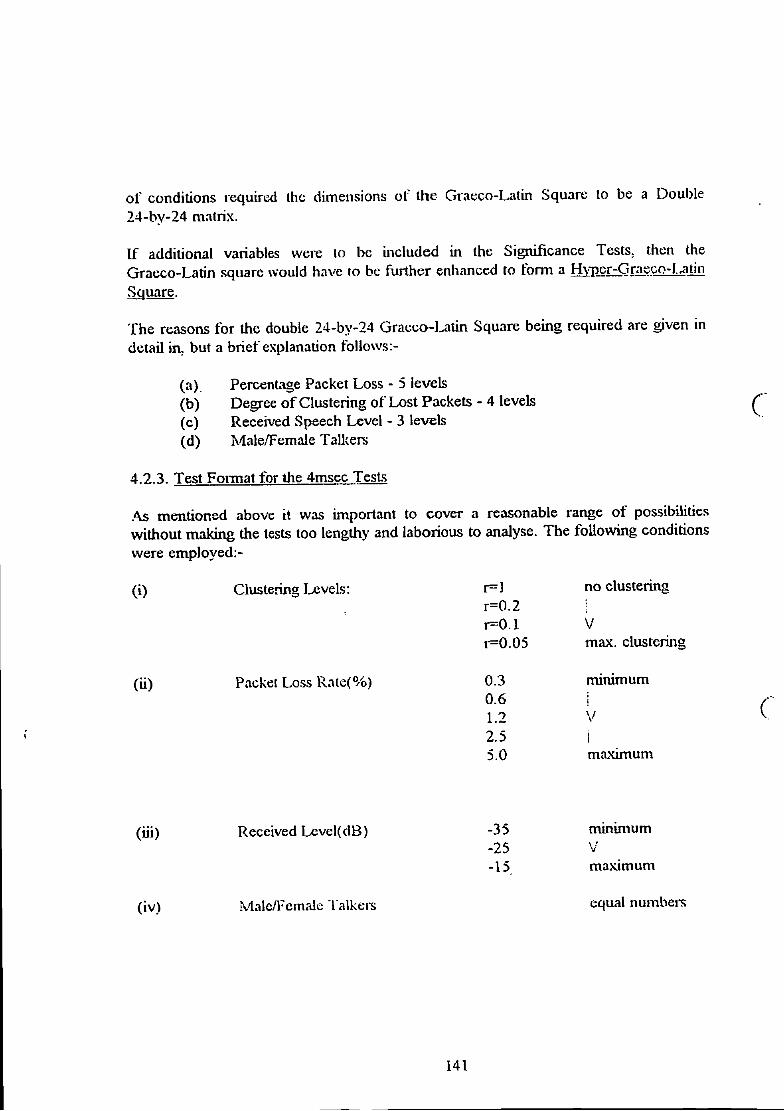
of conditions required the dimensions of the Graeco-Latin Square to be a Double 24-by-24 matrix.
If additional variables were lo be included in the Significance Tests, then the Graeco-I_^tin square would have to be further enhanced to form a Hypcr-Graeco-Latin Square.
The reasons for the double 24-by-24 Graeco-l^tin Square being required are given in detail in. but a brief explanation follows:-
(a) Percentage Packet Loss - 5 levels (b) Degree of Clustering of Lost Packets - 4 levels (c) Received Speech Level - 3 levels (d) Male/Female Tallcers
C
4.2.3. Test Format for the 4msec Tests
As mentioned above it was important to cover a reasonable range of possibilities without making the tests too lengthy and laborious to analyse. The following conditions were employed:-
(0 Clustering levels: r=I r=0.2 r=-O.I 1-0.05
no clustering
V max. clustering
(ii) Packet Loss Rate(%) 0.3 0.6 1.2 2.5 5.0
mimmum
maxmium
(iii) Received Lcvel(dB) •35 •25 15
minunum V maximum
(iv) Vlale/Female Talkers equal numbei-s
141

With reference lo (i) and (ii), 20 dilYcrenl conditions are required. Four extra conditions were added to provide:-
(a) a sUitistical link to some earlier tests conducted at BTRL
or
(b) four 'control conditions'.
The number of different conditions so far required has increased to 24.
As three listening levels have been specified, as recommended by the CCITT [Ref83] for such tests, the number of conditions now required is 72.
It is also recommended that both male and female talkers are employed in the testing piocedure, thus the number of different conditions increases to 144.
Because of the dimensions of the Graeco-Latin square (24-by-24), it was convenient to use 24 listeners (subjects).
The total 4msec test requirements therefore involved;-
24 subjects listening lo ,48 lest conditions covering an equal number of both male and female talkers using 3 different speech levels lor 4 difl^rcnt clustering levels at 5 different packet loss rates, with a range of different sentences of 7sec duration being employed so as avoid boredom.
Method of Operation
Each of the subjects were asked to listen to the 48 different test condition, die order being dictated by the format of the Graeco-Latin. in two sessions (each of 24), in the specially designed Listening Chambers at the Speech Test Centie. The environjnent within a Lislening Chamber is caretully controlled such that:-
(a) all extraneous noise is excluded, and only those sounds which are under control of the tester are admitted,
(b) the acoustics of the chamber are designed to prevent any reverberation, unless required. Again this is under Ihe conu ol of the lesier.
Having listened so a sentence, each subject was asked lo evaluate the quality of the speech on a three point scale by pressing one of three buttons on a consul (Vote-box') in front of ihem, as shown belovv:-
142

(A) OBJECTIONABLE - 4 POfNTS
( B ) D ? : T E C T A B L E - B U T N O T OBJECnONABLE - 2 P O I N T S
(C) N O T DETECTABLE - 0 P O I N T S
The reason for this points system is due solely to the construction of the Vote-box' used to score the opinions, and has no other significance^ - values 2. 1, 0 could also have been employed.
As indicated in the Test Methodologies*, the order in which the test conditions are fed ^ to the subject is dictated by the Graeco-Latin square which ensures that no subject listens to the same unique set of conditioas more than once, and provides sufficient randomness to enable the i*esults produced to be subjected to 'Analysis by Variance' so as to assess their validity by use of'Significance Tests'.
The test conditions mentioned above were played through a conventional telephone handset having first been digitised using a 16-bit linear PCM encoding and decoding process. The reason for emplo>'ing the 16-bil linear PCM process, as opposed to the 8-bit 'companded' technique nomally used in telephone systems, is to minimise the quantisation noise. All the tests were stored and played back using a recording-studio-quality Digital .Audio Tape (DAT) system, so as to further minimise any distortion due to the speech processing aspects of the lest not normally found in a tj'pical telephone connection over the PSTN.
4.2.4. Results of the 4msec Tests
The results reported for the Analysis of Variance emplo)' the Arcsine Transform. The reason for the use of this transform is to linearise the results for ease of use in Significance Tests. Other transforms are available for this puri>ose i.e. Logistic, Probit, and Bliss, however, for this paiticular t>'pe of test the /\xcsine transform is usually employed [Ret^3].
The tables of results are available for:-
1 Proportion Detecting distortion in Male Speech for 3 levels. Proportion Detecting distortion in Female Speech for 3 levels.
2 Proportion Objecting io distortion in Male Speech for 3 levels. Proportion Qbiectiog to distortion in Female Speech for 3 levels.
143

4.2.5. Analysis of Results for the 4niscc Tests
From the tabular results Scatter Plots have been deiivcd and are al.so shown in the above section, for the following:-
(i) iviale Speaker - Delecting Distortion (3 levels) (ii) Female Speaker - Detecting Distortion (3 levels) (iii) Male Speaker - Objecting to Distortion (3 levels) (iv) Female Speaker - Objecting to Distortion (3 levels)
Unfortunately the Significance Tests indicate that a problem exists in both the areas of Detectability and Objectionability. The explanation is as foUows:-
(a) DETECT.^BILIT^'
From the results of the 4msec packet tests a 3rd order interaction [Male/Female * Level * Packet Loss * Clustering] was found. The implication of diis result fiom the significance tests indicates that there is unexpected interaction between each of theses properties, in addition lo their independent contributions. This means that their properties are not independently additive (i.e. a lack of simple dependencies).
As a result of this finding the equation required to satisfy this relationship now becomes extremely complex because of tjie third order interaction, rather than the relatively simple first order interaction expected. There would, in fact, be so many terms to cover all the possible combinations (of the order of 20) that the equation ceases to be meaningful, and liule would be gained from its production.
Further consideration established that more experimenlid data was required on the 'detcctabilit>'' aspects of these tests before any meaningfiil equations, and hence the curves, can be obtained for the purpose of predicting user acceptabilit>'.
(b) OBJECTlONABlUn-
Tlie inconsLstencies with tliese tests were not so serious as those indicated above. ITie conditions are listed below:-
l . First Order Tcims (i) Male/Female * Clustering - signilicani
and
(ii) Packet I^ss * Clustering - .significant
These results were ;is expcclcd
144

2. Individual Items Male/Temale - signilicani
These results wei e not expected
The Male/Female term gave cause for concern and fiirther checks were required to establish the validity of the data. As the time available on the Reseai'ch Fellowship was limited it was decided to produce some statistics on the user-acceptability for 4msec packets ibr the various levels of Clustering employed. Unfortunately the results generated indicated inconsistencies which were rendered them mireliable.
It was felt that should the Male/Female teim be included then a meaningful equation relating the remaining 'significant' and 'highly significant' terms could be produced in the following format:-
(4 Individual Itemsi¥)+(Male/Female*Clustei-ing)+ G acket Loss*Clusieiing)+Constant
Where U = [Male/l 'emale*Level*Clustering*Packet Loss]
The equation produced from these tests did not, in reality, generate any meaningful predictions as to the level of objectionability scored by the subjects under test.
The lack of consistency in tlie results obtained (indicated by the failure of the Significance Tests) was of considerable concern as the source of the problem was not immediately obvious. In addition, the algorithms being employed in this tests (4msec) were also to be employed in the Imsec tests, thus throwing the hole programme into doubt.
4.2.6. Conclusions on the 4msec Tests
Tlie results to these tests were veiy disappointing concerning the trouble that had been taken to establLsh statistical independence of the variables being investigated. I he graph above provides only a loose indication of tiie user- acceptability for 4sec packets under the conditions specified. Considerable lime was spent in tiying to establish the flaw in the testing procedure by:-
(a) examining the test algorithms and
(b) .sci-utinising the method of analysing the results.
This investigation considerably delayed the progiamme. to such an extent that it was decided not to embark on the 1 msec until the problems had been resolved.
c
145

Certain enors were found in the algorithms, so the 4msec tests were repeated, but inconsistencies still existed. At this point it was decided not to go ahead with the 1msec tests.
4.3 OVERALL CONCLUSIONS CONCERNING THE SUBJECTIVE TESTS CONDUC FED AT BOTH UoP AND BTRL.
The basic aim of these two activities was to firstly establish subjectively the level of packet loss that could be tolerated, in terms of percentage lost packets, and then investigate existing methodologies, and develop new techniques, for reducing the efifect of speech packet loss on the quality of the received speech. This research work was conducted at UoP using the Speech Processor X I designed and built in the laboratories in the School of Electronic, Communication, and Electrical Engineering.
The second activity was to investigate how these results were related to the speech parcel size, particularly in the presence of clusteiing. This research activity was carried out in the Speech Research Centre at BTRL, Martlesham and UoP. In the former case some interesting results were obtained fi-om the new methodologies, in particular the Speech Packet Duplication technique (SPD) developed at UoP, whose performance compared favourable with that of the Pitch Waveform Replication technique (PWR)-[Ref28] used currently as the 'bench mark'. Both techniques gave 70% user-acceptabilit>' ratings of approximately 10% packet loss, however, the SPD technique was marginally better, at 11% and lends itself to LAN technology far more readily than does the PWR technique exploiting ther large packet structures available on both MAP and TOP systems.
Although sophisticated facilities for the detailed study of speech parcel size and clustering were not available at UoP, successfiil attempts were made at obtaining 'ballpark' figures for the SPD, as a prelude to the research to be carried out at BTRL. Results indicated that parcel sizes up to 440 speech packets could be employed with reasonable user-acceptabilit>'. The effects of clustering were more marked for smaller parcel sizes of typically 2,4,and 6msec than for the 50msec parcels containing 400+ speech packets - for a given overall lost packet percentage.
However, as indicated iit Section 4.1.4, the optbtmm size for a speech parcel is between 80 and 160 bytes, given that:-
a) . the Speech Packet Duplication (SPD) Algorithm developed at UoP necessitates the doubling of the speech byte size (from 80 to 160, or 160 to 320 bytes),
and b) , a reasonable screen refresh rate limits the speech parcel size to no
greater than 160 bytes.
146

Tlie second stage of the rescaich activities staged at BTIIL, were less successful, as indicated in Section 4.2. above, due to the failure of the Significance Tests (unexpected relationships between uncormected variables under test), BTRL had agreed to redo the tests on the 4msec speech parcels, and then advise the author of this report on the outcome of the 1 msec tests, following the conclusion of the Research Fellowship. This agreement was not fulfilled because, under the severe staff cuts initiated in BT as a result of the economic recession in 1990, the research group dealing with speech research was disbanded.
Although no tangible results were produced at BTRL, coiisiderable expeitise was gained into the methodologies required for rigorous subjective testing, e.g. of the use of Analysis of Variance, Significance Testing, Graeco-Latin and Hyper Graeco-Latin ^ Squares.
End of Chapter 4
(
147

CHAPTER 5
CONCLUSIONS
148
CHAPTER 5
5. CONCLUSIONS
As a result of the research carried out it has been established that real-time interactive speech can be successfully transmitted over LANs employed in a commercial/industrial environment provided that certain well defined engineering criteria have been satisfied.
Provided that the following criteria have been satisfied then the proposed system will provide an enhanced communication facility both on existing networks and newly installed configurations. The advantages obtained fi-ora enhanced communication facilities are that it will enable scare commodities like engineering expertise to be employed more efficiently. ^
Eariier research work carried out on the effect on speech of packet loss, conducted by Dunlop & Raohid [Ref 24], Jayant & Christensen [Ref 25] Croodman et al [Ref 27] and Wasem et al [Ref 28] investigated packet loss for only fixed packet sizes and with little regard for data traf&c considerations. This ihcsis addresses all the issues relating to the practical implementation of real time interactive speech on both existing and newly installed networks informs of:-
a range of speech packet sizes (still under consideration by the CCIR & CCnT), a range of algorithms for enhancing speech quality both passive and active, delay criteria necessary for sound engineering guidelines
The basis for the engineering criteria mentioned above has been the research carried out in the pursuance of this Phd project. In the initial stages of the investigations it was important to identify the crucial factors that were likely to prohibit the successfiil transmission of real-time speech over LANs in a commercial^dustrial envirorunent The early sections in Chapter 2 describes the type of networks that were being used, and then defines their operational characteristics, and compares these factors with the requirements for real-time speech transmission. A brief resume is given below.
5.1 INTRODUCTION
It is current practice to provide two completely separate and distinct networks to support information flow in a commercial envtroiunent; they are>
(a) Local Area Network (LAN) for the transmission of data and control information,
and
149

(b) Pnvate Auiomatic Branch Exchange (PABX) for the interconnection of telephones within the company, and connection to the Public Switched Telephone Network (PSTN) for the transmission of real time interactive speech.
Given that the costs of providing, reconfiguring and maintaining both networks represents a significant portion of most company I.T. budgets, any methods for combining both the speech and data onto a single network resulting in significant savings in materials and manpower is worthy of close consideration. These economies are obtainable for the following reasons:-
(i) reduction in cabling costs on initial installation on reconfiguration due to accommodation changes
(ii) reduction in management costs current practice is for the LANs to be often managed separately fi-om the telephony system for historical reasons - as both I.T. systems they should thus be under that department.
(iii) reduction in hardware provision for telephony the establishment of a real time interactive speech facility on every workstation will eventually ob\aate the need for a PABX to handle internal telecommunications resulting in a considerable saving.
(iv) reduction in time spent travelling to/attending meetings savings will be made in the travel budget increased cost-effectiveness of staff (less time spent in transit)
Appendix IV provides detailed costings for the provision, management and maintenance of a BT iSDX 300 PABX installed inl994, as follows:-
The installation cost for 300 extensions and 30 exchange lines is = £68,500.
The annual costs of managing and maintaining such an installation = £19,800.
It has been established that although the cost of implementing tfte interactive speech facility will be £200 per PC, in terms of the hardware and software modifications required, this figure will be relatively small compared to the short, medium and the long term savings listed i f need for a ftill PABX could be obviated.
150

In addition, a major advantage of adding an interactive speech capability to each workstation on a LAN, allied to a common screen refresh facility, is that it provides an extremely powerful communication medium for design, development and maintenance particularly in a manufacturing envirorunent This enhanced interactive information system has yet to be fully exploited by IT companies currently in the marketplace.
Current practice is for company personnel to discuss design alterations or changes in manufacturing procedures by recourse to meetings, telephone conversations, or the exchange of data by facsimile/electronic mail. It is proposed that a single common network with the appropriate software would be able to support a truly interactive information system such that two users wishing to exchange ideas could conununicate verbally (by means of a handset attached) to exchange graphic and text information screen to screen, ^• limited only by screen refresh speed. ^
This Thesis has outlined the problems invohred in implementing real time interactive speech on LANs designed for use in a commercial^dustrial envirormient, and proposes strategies for minimising certain difficulties and obviating others, to produce a reasonable quality of speech over the common network This is the first step towards providing a fully integrated speech and data network - "the interactive information system".
5.2 NETWORKS FOR COMMERCE AND INDUSTRY
The LANs currently employed in the above mentioned environment fall into two main categories, they are:-
(a) Those to support Automated Manufacture Deterministic - Token Passing Bus
(b) Those to support Office Automation stochastic (non deterministic) - CSMA/CD
The main difference between (a) and (b) is that automated manufacturing processes are usually 'time-critical' in that event-control must be carried out within a given 'time window' or the system is rendered inoperable. Data transfer rates are normally low on these networks. In contrast, Office Automation requirements are for the transfer of large amounts of data (file transfers) at high data rates, but the applications being run are not normally time-critical.
As these two classes of networks have evolved, their capabilities have reflected the requirements of the market place.
151

The non-deterministic requirements of the Automated Office environment have resulted in the adoption of the Canier Sense Multiple Access/Collision Detection (CSMA/CD) mode of operation as a standard for LANs in this area.
As mentioned above, the lime-critical nature of the automated manufacturing environment has necessitated the rejection of CSMA/CD LAN in favour of the more deterministic type networks, i.e. Token Passing Bus where worst case access times to the network can be determined.
Not unexpectedly, the two different environments have caused the development of two distinctly different protocol stacks to support their separate applications, i.e.
(a) Automated Office LANs CSMA/CD with Technical Office Protocols (TOP)
(b) Automated Manufacture Token Passing Bus with the Manufacturii^ Automation Protocol (MAP) - current version 3.0
5.3 INTEGRATON OF SPEECH AND DATA ON LANs
Before discussing in detail the research carried out, and the results obtained, it is instructive to firstly compare the nature of the two types of signals to be carried by a common LAN, and then discuss the characteristics of both CSMA/CD and Token Passing Bus in the light of the former comparison, this is covered in detail in Section 2.3.
Data:
When data transfer is occurring over a LAN large blocks (1526 bytes) are transmitted at a time at high speed (-lOMBits/sec)
Delays in accessing the LAN are not normally of importance unless time critical applications are being run in a manufacturing environment
Very low error rates are important as the receivers are, by and large, unintelligent. As a result sophisticated error detection and correction algorithms are employed at the price of additional overhead - this is a crucial issue
152

Speech:
Once digitised, the information must be transmitted at 64 Kbits/sec (algorithms for reducing the bit rate are available) on a regular basis (8 bits every 125 isecs)
Delays in accessing the LAN must be kept to an absolute minimum, as must any other delays • this Ls a crucial issue
While error rates are important, they do not have the same significance as in the case of data because human users are able to interpolate for distortion and/or easily ask for retransmission (pardon!)
From the above comparison it can be seen that the characteristics for the two types of information are very dissimilar. However, the two crucial issues are:
(1) Delays over the LAN must be kept to an absolute minimum for the successful transmission of real time interactive speech, typically less than 200 msec loop delay.
and
(2) The error rate must be minimal for control and data trafi&c typically I in 10*.
As previously mentioned, sophisticated error detection and correction algorithms are already in place for both LANs mentioned in the form of Frame Check Sequences (FCS) and Cyclic Redundancy Codes (CRC). It is therefore assumed that (2) above does not pose a particular problem. Unfortunately this sentiment does not apply to (1), which will now be discussed in more detail
The delay issue is the main focus of research in this area.
5.4 DELAY ON LANS
Chapter 3 is directed to the characterisation and quantification of delays in LANs. Delays on local area networks have only recently become a major concern due to the development of time-critical applications, into which categoiy real-time interactive speech falls. These delays can be categorised as follows in terms of the time taken to :-
(a) hiitialty digitise the information to be transmitted across the LAN Initial Processing Delays
(b) Gain access to the LAN Access Delays
153

(c) Transmit the infomalion across the LAN Transmission delays
(d) Buffer the incoming signal at the receive-end Receive-end delays
For (a), (c) and (d) the statistics of the delays encountered are such that they are nominally constant, in addition, the actual values are small compared to (b).
With Access Delays, the figures obtained are a fimction of the type of network employed, i.e.
Deterministic (Token Passing) - a fixed worst case value
Non Deterministic (CSMA/CD) - infinitely long, theoretically
The latter case provides the reason why time-critical applications, like automated manufacturing, have rejected CSMA/CD as a LAN in favour of Token Passing Bus. In an attempt to minimise delays, as stated earlier, increased processing speeds due to improvements in chip design [12] have already provided significant reductions, however, the main and crucial issue remains that of access delays in CSMA/CD LANs employed in an Automated Office environment.
Arguments have been proposed that, as the Token Passing Bus is predominant on the 'shop floor' in a manufacturing environment, the transmission of real time interactive speech over such a network will pose little problems provided traffic levels remain within acceptable levels. Contrary to this is the fact that to enable true integration of the complete manufactuiing process information in all its forms must be fi-eely transferable between the design office and the shop floor - thus making it very necessary to overcome the access delay problems on CSMA/CD LANs, and any bridge/router/gateway linking it with the Token Passing LANs on the shop floor.
5.5 STRAIEGIES FOR MINIMISING THE EFFECT OF THE DELAYS ON LANs
There are a number of strategies for minimising the effect of access delays on LANs, they are:-
(a) Employ special protocols for time critical application which ensure vety rapid access to the LAN
(b) Given that some delays are inevitable, make special arrangements to reconstitute that part of the signal that has been lost due to a "delay hit" - or at least reduce the subjective effect of a lost packet(s).
154

Taking (a) first, a number of compressed protocol stacks have been suggested to reduce processing time and hence access time. A typical example of this approach is Miiu-MAP which employs only three layers of the 7-Iayer ISO stack. Research is currently being conducted into a similar modification to Technical Office Protocol, to produce a mini-TOP equivalent However, as a large installed base of CSMA/CD LANs already exist using TOP, the approach favoured is to first establish the maximum acceptable delays for the time-critical application - speech in this case - then apportion the delays over the LAN(s) so as not to exceed the maximum figure. Further details of this approach are given later in this conclusion.
As referred to in (b), the result of long delays in accessing a LAN is the loss of parts of the speech in a particular direction. The amount of loss is a function of the length of the delay sufTered. Earlier research work [Ref 52] has proposed maximum figures for both ^ end-to-end and loop delays. For the subjective measurements carried out in [Ref 52] and [Ref 51] a maximum loop delay figure of between 200 and 250 msecs proved to be acceptable for 70% of those tested. Research into the apportiorunent of this delay [Ref 53] in terms of 'go* and Yetum' directions of speech transmission provided no definite recortmiendation other than the sum of the two delays must be less than 200-250 msecs.
5.6 INVESTIGATION INTO CHARACTERISTICS OF DELAY HITS
Delays can be categorised into two main areas, they are:-
(a) Fixed Delays (b) Variable Delays
(a) Fixed Delay
The figure of 200-250 msec is a fixed delay which should not be exceeded i f reasonable quality of speech is to be maintained. This figure can be used in design calculations to buffer the speech packets at the receive end so as to effectively "smooth out" any delay irregularities. Section 4.1.5 contains details of the test carried out to establish the figures quoted above.
(b) Variable Delay
The fixed delay figure mentioned above is obviously important, but not all systems provide buffering at the receive end. As a result it is more important to investigate the statistical characteristics of delay hits/packet loss [Ref 54 + 55). Research at BTRL^ [8] in conjunction with University of Plymouth^ has identified several factors which irlQuence the effect of speech packet loss, they are:-
155
(1) Packet Size (2) Percentage Packet Loss (3) Clustering (grouping) of Lost Packets
The following sections contain discussions on, and recommendations for, the above mentioned factors in terms of the transmission of real time interactive speech.
Details of the rigorous subjective tests carried out to establish the figure stated below are given in Section 4.1.6, 7 and 8.
5.8 PACKET SIZE
During the initial analogue to digital conversion process speech on one channel is sampled at 8000 time per second, and each sample amplitude is then converted into a 8 bit byte for transmissioiL Each speech byte is 8 bits long and they are transmitted at the rate of 8000 bytes per second making the channel bit rate 64,000 bits per second, or 8 bit per byte every 125 psec.
Because LAN packet structure are such that the data block is typically 1526 bytes in length it has been proposed that the speech bytes be collected together in packets [Ref 53] parcels [Ref 55], inserted in the data block, and transmitted en block.
There are obvious advantages to this approach in that:-
(a) The LAN's iitformation fi-ame is being used more efficiently (b) Delays can be reduced (c) Both data bytes and speech bytes can be combined in the same data block -
particulariy advantageous for the combined speech and vision facility mentioned in the Introduction (Integrated Information System)
However there are disadvantages in that should a delay-hit occur on a data ftame containing large numbers of speech bytes then considerable distortion would occur in the received speech. Tests [Ref 54 and 55] have shown that losses of up to 40 msecs of speech in one hit can be tolerated provided they are infrequent This figure represents the loss of 320 consecutive speech bytes which is approximately equivalent to a phoneme (-40 msec).
Although this loss of speech would appear to be catastrophic it has been found [Ref 55] that the bram m the human receiver has the ability to "contextuallv interpolate" for thP
BTRL - B r i c i a h Telecom Research Labs Martlesham Heach, I p s w i c h
UOP - U n i v c r a i c y o £ Plymouch. Plymouth Devon
156

missing speech particularly in convers«^tions related to one topic area with a limited vocabulary'i.e. design of a p.c.b. (say).
As discussions on the design problems in an industrial environment fall into this category (limited vocabulary) it has been found that conversations will be tolerant of delay hits of up to 40 msec, provided they are infiequent, |one parcel lost in 100.(1 in 10*2)].
5.8 PERCENTAGE PACKET LOSS
In the previous section reference was made to the fi-equency of packet loss. Digital systems are normally categorised in terms of their error rate i.e. the number of bits lost per second. In relating this figure of merit to percentage packet loss it is important to appreciate its ^ relationship to both packet size and clustering. It is usual to talk in terms of error rate of one bit lost in 10* or 1 in 10 for digital transmission systems - in terms of percentage packet loss this is very low indeed. Tests conducted at BTRL [Ref22], MTT^ [Ref 25 & 21] and UoP [Ref 54] have indicated that packet losses of the order of 1.0% are subjectively acceptable for real-time interactive speech systems due to the contextual interpolation mentioned eariier, but without the use of any algorithms to improve speech quality.
5.9 CLUSTERING
In the previous sections packet, size and percentage packet loss have been discussed, without recourse to a phenomenon known as clustering.
Clusteiing of lost packets has been investigated by BTRL and UoP with a view to establishing a performance rating. Research cairied out at UoP indicates that as traffic levels increase on LANs, particularly CSMA/CD types, above about 30% of the maximum r design bit rate (10 Mbps) then delays occur much more frequently. However, the stucture of the CSMA/CD Irame encourages the clustering together of a number of consecutive speech fi"ames to form a speech parcel, in the interests of transmission efficiency. The loss of a complete frame due to a delay hit would therefore result in a number of consecutive speech packets being lost.
From these findings it is clear that the establishment of a strategy was required for minimising the effect on speech ciuality of a number of consecutive speech packets being lost, for a given speech packet loss rate,. A number of such strategies have been proposed and will be discussed in the following section.
MIT - Massachuscccs I n s t i t u t e of Technology, Cfltnhridae, MA.
157

5.10 STRATEGIES FOR MINIMISmG SPEECH LOSS DUE TO CLUSTERING
Methods currently being employed/investigated can be divided into two basic groups, they are:-
(a) Those techniques which attempt to reduce the subjective effect of the discontinuity in the speech
(b) Those techniques which attempt to replace the speech that has been lost when a delay hit occurs
Considering (a) initially, listed below are those techniques which are currently being employed:
Zero/silence substitution linear interpolation across the gap Injection of white noise into the gap for the duration of discontinuity Smooth out phase discontinuities at the begirming and end of the lost packet Repeat last packet(s)
For category (b), there are:-
One and Two Sided Pattern matching Pitch Waveform Replication [Ref 28]
Subjective tests carried out on both categories by Wasim et al [Ref 28] indicated that the Pitch Waveform Replication method was the most effective for minimising the effect of lost packets. As mentioned previously, the acceptable packet loss rate is normally l%-2%. However, with the Pitch Waveform Replication technique the packet loss rate can be increased to 9.6% for 128 byte parcels with no further degradation in speech quality. The price to be paid for this improvement is in the complexity of the terminals in terms of both storage and the digital signal processing capability.
Work carried out recently at UoP [Ref 55] has indicated that further improvements in speech quality can be achieved by a novel method of using 100% redundancy but not retransmission (which is usual, but not feasible or real time speech). In the technique investigated each speech parcel (of *n* bytes where 'n' is an even number) is divided in two equal parts. The first half of the speech parcel containing n/2 bytes is placed in preceding speech packet (N - 1)**" while the latter half is inserted in the following packet (N + 1)*. The N * packet contains the N*'' speech packet in addition to half of the (N - 1)* packet and half of the (N + I ) * packet. It should be recalled that the Data Block size is veiy large in LANs (typically 1526 Bytes) thus providing ample capacity for this technique, in addition to the screen data. Should the N*** packet be lost by a delay hit then provided the (N - 1)*
158

and the (N + 1)* packets have been received then the contents of the N* packet can be reconstituted. Details of this approach are given in Section 4.1.8. Results from tests conducted at UoP using the SPD algorithm indicate that a lost packet rate of 1 1 % can be tolerated for a User Acceptability ratio of 70%. This compares with 9.6 % for the PWR technique developed at M.I.T. There are severe processing problems with this approach at present, but investigations are continuing into its feasibility and tolerance of clustering.
5.11 SPEECH PARCEL SIZE CONSIDERATIONS
The aim of this research was to establish that both real-time speech and data could be combined on the same LAN (CSMA/CD) and hence obviate the need for a PABX. The ^ research conducted so far indicates that this is possible i f the LAN is operated at a traffic level which is below 30% of its designed maximum. The above statement can be added that a speech parcel size of 160 bytes must be delivered every 10 msec, i f the Speech Parcel Duplication algorithm developed at UoP is to be implemented, [for details see Section 4.1.8].
When the CSMA/CD header of 26 bytes is added to the 160 speech parcel bytes, there still remains 1340bytes of the original 1526bytes. As a result there remains a considerable capacity for data transfer - and in particular screen refresh data.
Calculations show that as Super VGA PC screen requires 480,000 pixels for complete screen refresh. I f a CSMA/CD frame containing 1340 bytes is delivered every 10 msec, this is equivalent to 1.34Mbytes/sec giving approximately 3 complete screen refreshes per second, which is adequate for most industrial/commercial applications.
( It should be pointed out that the above figures are 'worst-case' because:- *
- it is anticipated that CSMA/CD frames will be delivered more frequentiy than once every 100msec,
and - that a complete screen change is often not required, and that with the addition of a
software package that detects only the changes to the picture, then the screen refresh rate could be speeded up considerably.
A number of speech packet sizes are under consideration by both the telecommunications industry and the computer industry both of whom have vested interests in the standards eventually agreed. The telecommunications fraternity prefer relatively small packet sizes so as to minimise process times and the effect of lost packets (the smaller the packet that is lost the easier it is to replace/mask) Le. 1,2,4,8,16 msec using 8 bit bytes which will fit easily into the ISDN^ information frame.
159
In complete contrast the computing industry favour much larger bytes which will be compatible with the LAN data frames which are typically 1526 bytes in length - thus representing a maximum of 188 msecs of speech. In practice, a data frame would contain both data and speech but the motivation for larger frames is transmission efficiency given that overheads can be large.
The underlying problem is ihe conflict of interest beUveen the two industries in that the telecommunication industry is, by and large, a disciple of the "circuit switched" fi-atemity, whereas the computing industr>' believe only in "packet switching".
5.12 CONCLUDING REMARKS
As discussed in Chapter 1, there are difficulties in transmitting date and speech on both PABXs and LANs. It has been shown in Chapter 2 that considerable advantages can be obtained in both cost reduction and improved manufacturing performance if both voice and data can be transmitted over the same network - thus providing multi-media facilities.
Although combined voice and data faciUlies are achievable in the laboratory (also offered on ICUs one-per-desk instrument - but with very limited fiinctionality), research has revealed that no operational recommendations for the design and implementation of such a family of LANs have been developed.
As a result of the research carried out at the University of Plymouth and BTRL by the author of this thesis, speech and data can be combined on the same L A N provided the following criteria are met:-
(1) The traffic on the TOP LAN (CSMA/CD) must be less than 30% of the maximum - Chapter 4, Section 4.1.8.
(2) The worst case access time on the MAP network must be less than 10 msec (traffic limitation) - Chapter 4, Section 4.1.1.
(3) Debys through an individual Router/Bridge/Gateway linking the LANs must be limited to 10 msecs - Chapter 4, Section 4.L7.
(4) The overall loop delay from telephone handset to telephone handset must be less than 200 msec (250 msec at the verj' maximum) - Chapter 4 Section 4.2.7.
(5) Speech Packet Size should be limited to 160 bytes when using the Speech Packet Duplication algorithm developed at UoP - although this may be
Incegcaced S e r v i c e s D i g i t a l Hecwork 0 B . T .
160
increased even fnilher depending upon the effectiveness of the Neural-Net algorithm cuirent under investigation at UoP - Chapter 6
(6) I f the intention is to transfer screen data with the real-time speech then a compromise has to be reached between the speech parcel size, LAN data frame delivery rate, and the number of bytes devoted to screen refresh.
(6) Reduce all fixed delays to an absolute minimum - Chapter 5 Section 5.6.
(7) Use compressed protocol stacks to obtain fast access to LANs - Chapter 5 Section 5.6.
(8) Employ especially deseed protocols to give access to frames containing speech packets - Chapter 5 Section 5.11.
(9) By installing real-time speech facilities on a LAN it is possible to make the following savings in a company of -300 employees :-
* £68,000 on installation costs
* £19,800 per annum on maintenance and Management. - See Appendix TV.
End of Chapter 5
161

CHAPTER 6
FURTHER RESEARCH
162

Artificial Intelligence techniques should be reserved for n-step packet prediction or interpolation, where no adequate conventional technique
exists. Packet prediction techniques should consist of either large scale neural netwoilcs capable of predicting the whole packet in a single operation, or frequency domain based genetic algorithms.
Further research into tiie expert system or rule induction based AI techniques could well be very fruitfixl.
End of Chapter 6
165

CHAPTER 7
ANNEXES
ANNEX I
* EXPLANATION of the METHODOLOGY employed in the USTENING TESTS CONDUCTED at UoP.
ANNEX n
EXPLANATION of the METHODOLOGY employed in the CONVERSATIONAL TESTS CONDUCTED at UoP.
166

ANNEX I
EXPLANATION of the METHODOLOGY employed in the LISTENING TESTS CONDUCTED at UoP.
Contents:-
* Fig 4.1.4(b) - Variable Delay - No Attempt to Reorder Packets
* Fig 4.L4(c) - " " - Packets Reordered
* Fig 4.1.4(d) - " " - Standard Deviation
* Fig 4.1.4(f) - User Acceptability (%) v Speech Packet Size (bytes) V Packet Loss Rate (%) using Zero Infill Algorithm.
* Fig 4. L4G) - User Acceptability (%) v Speech Packet Size (bytes) V Packet Loss Rate (%) using Speech Packet Duplication Algorthm (UoP).
167

TEST METHODOLOGY FOR LISTENING TESTS AT UOP.
VARIABLR DF.r,AY - NO ATTEMPT TO l ^ v n ^ r . . . cpF.ECH P A n i ^ K T .
Fig 4.L4rh^
The Table below shows the results from testing 100 subjects a mix of male ,nH female, usmg 14 different delay conditions, wi* each condSonrtiS^out 10
Subjects were asked to vote as to there opimon of the circuit quality in relation to a typical telephone conversation, for each delay condition.
To simplify proceedures the subjects voted either:-
ACCEPTABLE / OBJECTIONABLE
and were given 10 sees to vote for each condition.
USER ACCEPTABILITY (%) AVERAGE DELAY (WR^A 100 0 99 0.1 97 0.2 73 0.3 89 0.5 80 0.7 70 1 30 2 15 3 1 5 0 5 0 6 0 7 0 10
168
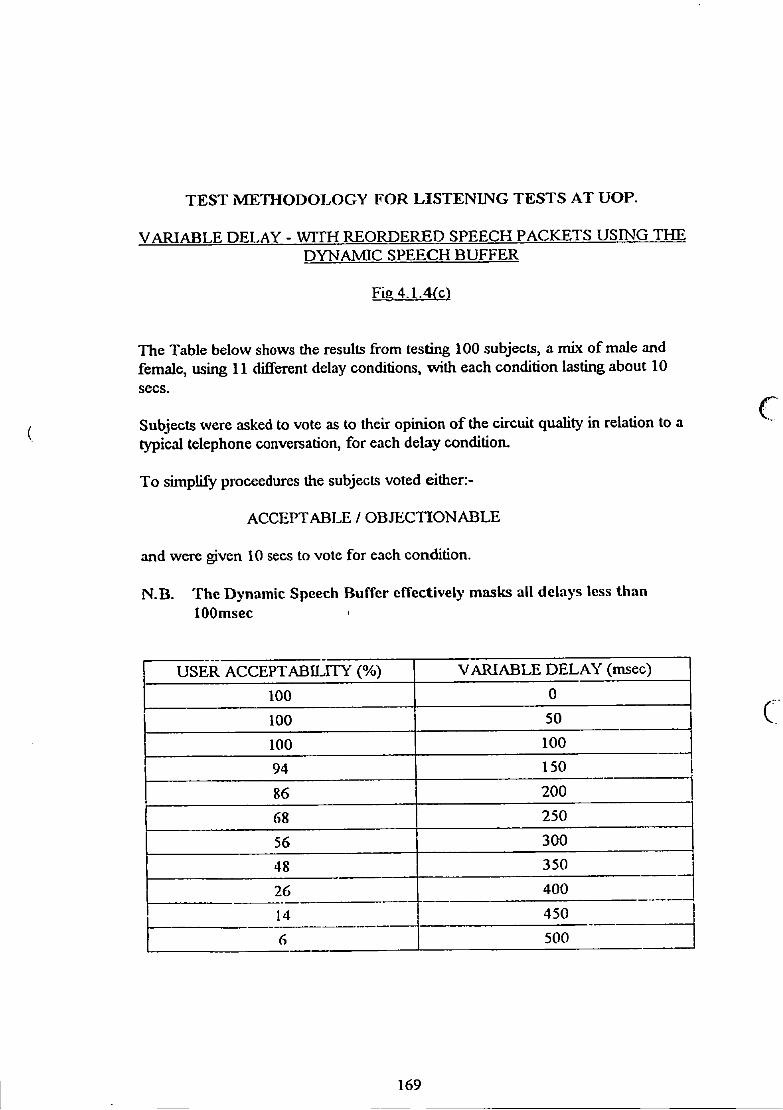
TEST METHODOLOGY FOR LISTENING TESTS AT UOP.
VARIABLE DELAY - WITH REORDERED SPEECH PACKETS USING THE DYNAMIC SPEECH BUFFER
Fig 4.1.4(c)
The Table below shows the results from testing 100 subjects, a mix of male and female, using 11 different delay conditions, with each condition lasting about 10 sees.
Subjects were asked to vote as to their opinion of the circuit quality in relation to a typical telephone conversation, for each delay condition.
To simplify proceedures the subjects voted either:-
ACCEPTABLE / OBJECTIONABLE
and were given 10 sees to vote for each condition.
N.B. The Dynamic Speech Buffer effectively masks all delays less than 100msec
USER ACCEPTABD.ITY (%) VARIABLE DELAY (msec)
100 0
100 50
100 100 94 150
86 200
68 250
56 300
48 350
26 400 14 450 6 500
169

TEST METHODOLOGY FOR LISTENING TESTS AT UOP.
USER ACCEPTABILITY FOR DIFFERING STANDARD DEVIATIONS OF SPEECH PACKET DELAY ABOUT A MEAN OF 15% GREATER THAN
THE MINIMUM
Fig4.L4(d)
The Table below shows the results from testing 100 subjects, a mix of male and female, using 11 different delay conditions, with each condition lasting about 10 sees.
Subjects were asked to vote as to their opinion of the circuit quality in relation to a typical telephone conversation, for each delay condition.
To simplify proceedures the subjects voted either:-
ACCEPTABLE / OBJECTIONABLE
and were given 10 sees to vote for each condition.
STANDARD DEVIATION (msec) USER ACCEPTABILITY (%) 0 100 10 94 20 93 30 88 40 80 50 52 60 24 70 12 80 6 90 4
170

TEST ME'raODOLOGY FOR LISTENING TESTS AT UOP.
USER ACCEPTABIIJTY (%) AGAINST SPEECH PARCEL SIZE fbvtes^ AND SPEECH PACKET LOSS CVo) USING THE ZERO INFILL ALGORITHM
Fig4.1.4<f)
The Table below shows the results from testing 100 subjects, ( a mix of male and female), using 10 different packet loss conditions, and 9 different speech parcel sizes with each condition lasting about 10 sees - giving 90 different test conditions.
Subjects were asked to vote as to their opinion of the circuit quality in relation to a typical telephone conversation, for each delay condition.
To simplify procedures the subjects voted etther:-
ACCEPTABLE / OBJECnONABLE
and were given 10 sees to vote for each condition.
< SPEECH PARCEL SIZE (bytes) > PL(%) 1 2 5 10 20 50 100| 200 500
0 100 100 99 100 100 100 99 100 100
0.1 100 99 100 100 99 100 99 99 95
0.2 97 96 95 93 89 85 81 77 72
0.5 89 85 88 75 70 65 58 50 40
1 78 74 66 60 50 40 30 20 10
2 66 61 44 36 24 14 10 7 5
5 47 36 19 10 7 5 2 1 0
10 33 11 3 1 1 0 0 0 0
20 11 2 1 0 0 0 0 0 0
! 50 0 0 0 0 0 0 0 0 0
c
171
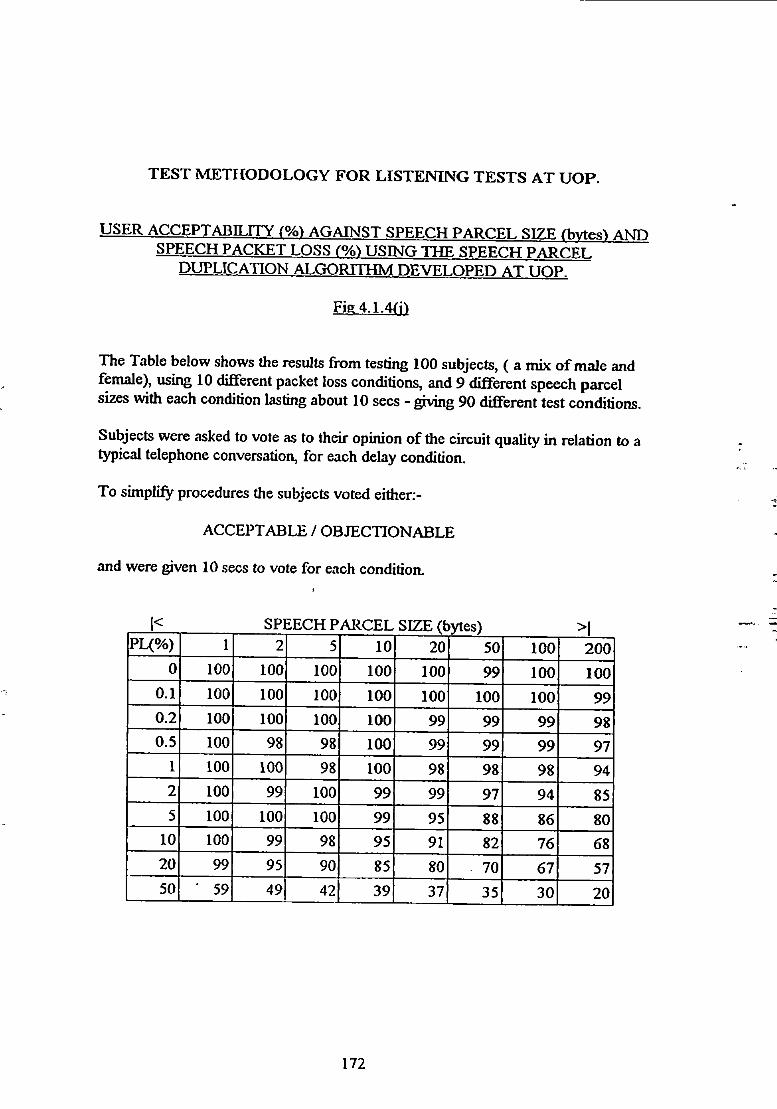
TEST METHODOLOGY FOR LISTENING TESTS AT UOP.
USER ACCEPTABILITY (%> AGAINST SPEECH PARCEL SIZE (bytes) AND SPEECH PACKET LOSS USING THE SPEECH PARCEL
DUPLICATION ALGORITHM DEVELOPED AT UOP.
Fig4.1.4(i>
The Table below shows the results from testing 100 subjects, ( a mix of male and female), using 10 dififerent packet loss conditions, and 9 different speech parcel sizes with each condition lasting about 10 sees - giving 90 different test conditions.
Subjects were asked to vote as to their opinion of the circuit quality in relation to a typical telephone conversation, for each delay condition.
To simplify procedures the subjects voted either:-
ACCEPTABLE / OBJECTIONABLE
and were given 10 sees to vote for each condition.
PL(%) 1 2 5 10 20 50 100 200 0 100 100 100 100 100 99 100 100
0.1 100 100 100 100 100 100 100 99 0.2 100 100 100 100 99 99 99 98 0.5 100 98 98 100 99 99 99 97
1 100 100 98 100 98 98 98 94 2 100 99 100 99 99 97 94 85 5 100 100 100 99 95 88 86 80
10 100 99 98 95 91 82 76 68 20 99 95 90 85 80 70 67 57 50 • 59 49 42 39 37 35 30 20
172
ANNEX I I
EXPLANATION of the METHODOLOGY employed in the CONVERSATIONAL TESTS CONDUCTED at UoP.
Contents:
Fig 4.1.5 (a) - Fixed Loop Delay
Fig 4.1.5 (b) - Fixed Loop Delay for various Go/Return Ratios.
Fig 4.1.6 (b) - Variable Delay
c
173

TEST METHODOLOGY FOR CONVERSATIONAL TESTS AT UOP.
FIXED LOOP DFT .AY Fig4.1.5ra)
The Table below shows the results from testing 100 pairs of subjects, a nux of male and female, using 17 different delay conditions, with each condition lasting about 30 sees.
Both subjects were asked to vote independently as to their opinion of the circuit quality in relation to a typical telephone conversation, for each delay condition.
To simplify procedures the subjects voted either:-
ACCEPTABLE / OBJECTIONABLE
and were given 10 sees to vote.
1 USER ACCEPTABELFTY (%) LOOP DELAY (FDCED) (msec) 100 0 100 25 98 50 96 75 95 100 90 125 86 150 76 175 68 200 58 225 43 250 34 275 22 30 15 325 9 350 4 375 1 400
174

TEST METHODOLOGY FOR CONVERSATIONAL TESTS AT UOP.
FIXED LOOP DELAY FOR VARIOUS GO/RETURN RATIOS
Fig 4.1.5(b')
The Table below shows the results from testing 100 pairs of subjects, ( a nux of male and female), using 6 different delay conditions, and 8 different Go/Return Ratios with each condition lasting about 30 sees - giving 48 different test conditions.
Both subjects were asked to vote independently as to their opinion of the circuit quality in relation to a typical telephone conversation, for each delay condition.
To simplify procedures the subjects voted either:-
ACCEPTABLE / OBJECTIONABLE
and were given 10 sees to vote for each condition.
1< Fixed Loop Delay Values (msec > l Go/Return 0 50 lOO 150 200 250
1:1 100 100 94 84 70 44
1:2 100 100 94 84 70 42
1:3 100 100 92 84 70 44
1:4 100 100 94 83 70 42
1:5 100 99 90 82 68 42
1:6 100 96 89 80 66 40
1:7 100 90 82 74 58 34
1:8 100 80 72 62 48 18
c
175

TEST METHODOLOGY FOR CONVERSATIONAL TESTS AT UOP.
VARIABLE DELAY WITH REORDERED PACKETS USING BUFFER Fig 4.1.6rb^
The Table below shows the results from testing 100 pairs of subjects, ( a mix of male and female), using 9 different average delay conditions.
Both subjects were asked to vote independently as to their opinion of the circuit quality in relation to a typical telephone conversation, for each delay condition.
To simplify procedures the subjects voted either:-
ACCEPTABLE / OBJECTIONABLE
and were given 10 sees to vote for each condition.
N.B. These tests were found extremely difficult to successfully conduct as when they were repeated some subjects voted completely differently.
User Acceptability (%) Average Delay (msec) 100 0 100 40 100 80 99 100 98 120 88 160 70 200 44 240 25 280
176

CHAPTER 8
APPENDICES
APPENDIX I Complete Circuit Diagram for Phase 1 of the Listening Tests at UoP. c
APPENDIX n Complete Circuit Diagram for Phase 2 of the Listening Tests at UoP.
APPENDIX UI Block Diagrams for Phases 1 and 2 of the UoP Speech Processor XI.
APPENDIX IV Cost/Benefit Analysis.
177
AI>PENDIX I
COMPLETE C m C U I T DIAGRAM FQK PHASE-1 OF THE LISTENTNO TESTS AT UOP.
178

s a c ^oi?eL B
CO Z7O0 J L H H I L ± /o\/ ^Jt ^Af-
6C3zy
cSiDtrrOffS A
TO &
r£rrjtUA/A7Ma < / ^ / T - ^ » Z / - cK/j^iP}^ 7000
£ 5
1 • I P^/urtr/z
BBC mOIiCL 3
& S/T WAL
a "IS' A/at a e
0rAS Cj'^cu/r
o//>f ^ ^ / o ' ^ M - ^^^/eP^
• — T " ' i . _ x Z - : . : > ' ^ —
••• ii^- V'! - ' ••••• z .
C&7. J, r~ I
VOLJ
17% ( 0

C// Z7O0
— - I I fZf^
j—li wJj^ -ajo^faal r W - - - J
DOU 17*1
sac ^oveL B
A
S y ret
£j
^ z r « e A/
' -TO A
r ~ • J + f -: fiU 7<r/Z. • 1 1
TtF 3/
0 I
L
' r SSOJc/i^ etc AcuZ. ^AJS fi/US/Z. /e..r^'^
•TO &
4 -
_ . I % 5. i _ •Of /do
&
i i Y
H^Wi^ - Kd-^ ^A^dJfO> l^^d^ _ y / w i / a : ^ ^ 5/rf*l-^<- <w^A.«u c j o - j

APPENDIX n
COMPLETE CIRCUIT DIAGI^AM FOR PHASE-2 OF THE LISTENING TESTS AT UOP.
179

APPENDIX I I I
BLOCK DIAGRAMS FOR PHASES 1 and 2 OF THE UOP SPEECH PROCESSOR X I
c
180

PHASE - 1
Investigation into the subjective effect of speech samples beinc randomly delayed, and the speech reconstituted with no attempt having been made to reorder the packets.
T E L E P H O N E A
D E L A Y G E N E R A T O R
A /
/ D
D E L A Y G E N E R A T O R •
A /
/ D
HYBRID
S W I T C H E D C A P A C I T O R F I L T E R . ( L O W - P A S S )
SWITCHED CAPACITOR F I L T E R (LOW-PASS)
CHIP Z N 4i39
DUAL VIA INTERF A C E UNIT
DUAL VIA INTERF A C E UNIT
B B C - B (1)
DUAL VIA INTERF A C E UNIT
1 MHZ B U S B B C - B (1)
DUAL VIA INTERF A C E UNIT
B B C - B (1)
DUAL VIA INTERF A C E UNIT
S W I T C H E D C A P A C I T O R Fl L T E R
( L O W - P A S S )
350 KHZ OSCILLATOR FOR FILTERS
± S W I T C H E D . CAPACITOR F I L T E R ( L O W - P A S S )
DELAY
GENERATOR A / DELAY
GENERATOR >
A /
A - D POD
DUAL
INTER 1 MHZ BU3B B C B(2 ) FACE
HYBRID
TELEPHOI
R U I I M p c ; 9 5 - 8 - 8 7

P H A S E - 2
Investigation into the subjective effect of speech samples beini randomly delayed, the speech is then reconstructed following th rexijrding o f th^^ packets which hav been delayed by an amount exceeding an arbitrary fixed maximum delay value.
T E L E P H O N E A
HYBRID
S W I T C H E D C A P A C I T O R F I L T E R ( L O W - P A S S )
SWITCHED CAPACITOR F I L T E R (LOW-PASS)
S T A T I S T I C A L D E L A Y G E N E R A T O R
A X / D
• • > S T A T I S T I C A L D E L A Y G E N E R A T O R
> A X / D
f$—
CB2 ^
U S E R P O R T
B B C
U S E R P O R T
B B C
D U A L 1 MHZ B U S
• i INTER F A C E
n 4 U N I T
A - D -POD
S W I T C H E D C A P A C I T O R Fl L T E R .
( L O W - P A S S )
350 KHZ OSCILLATOR FOR FILTERS
D E L A Y
G E N E R A T O R
A / — ^ D E L A Y
G E N E R A T O R >
A /
A - D POD
DUAL
INTER-
S W I T C H E D . C A P A C I T O R F I L T E R ( L O W - P A S S )
1 MHZ BUS B B C B(2)
HYBRID
T E L E P H

03Q /
usr/Z floU
a S/TS / y j ^ -•'WJ^
A/t>t, t^/A U 9 f f T *
sac 3
T ^ ' M 7
\ \/ <
1/ ' \ \
I ' I
! H .
5 o 00
mmmmN n n
S . A 4 r ^ tf/Ttf MO/SC etTA/'-A
3BC ^

APPENDIX IV
COST/BENEFIT ANALYSIS
181

APPENDIX IV
COST/BENEFIT ANALYSIS
IV. 1 INTRODUCTION
As one of the basic motivations for this PhD was to obviate the need for both a P ABX and a LAN in a commercial/industrial environment and hence enable significant savings to be made in IT costs, this appendix indicates typical economies that result fi'om reducing the reliance on a PABX in favour of a LAN.
IV.2 BASIS for ANALYSIS
It was decided to investigate the costs of equipping a high-tech SME# of about 300 -400 employees with both a PABX and LAN for:-
* 300 Telephone Extensions and an Exchange (switch) * LAN to support 300 PCs wit networidng facilities,
as would be current the policy in most SMEs.
In addition, cost are included for>
(a) . the separate management of the two networks, and
(b) . maintenance contracts for both the networks.
It was hoped to include reconfiguration costs but it has been impossible to obtain meaningful reconfiguration costs. It is a fact that reconfiguration cost are approximately double for two IT networks.
IV.3 TELECOMMUNICATION COSTS
IV.3.1. PABX Installation - BT iSDX 300
BTs current cabling charge is £75 per telephone socket in addition to the cost of the switch (telephone exchange).
For 'Palace Court' modernisation, the following equipment was purchased;-
(i) 300 extension sockets and cabling = £22,500
(ii) PABX Switch = £40,000

(iii) 300 Telephone Devices = £ 6,000 £68.500
rv 3.2 Management Costs
A typical telephone installation requires one member of the administrative staff to oversee general operations, typical costs:-
salary £10,000 pa, therefore with 50% on-costs the annual costs = £15.000
IV 3.3 Maintenance Costs
BTs maintenance charges for maintaining an iSDX 300 is>
£6 per extension, thus for 300 extensions = £1,800
£100 per Direct Exchange Line, for 30 lines = £3.000 £4,800
Summary of Telecommunication Costs
Installation-£68.500
Annual Charges - £4,800 ( .
N.B. The above figures were supplied by Mrs Joy Pateman of Administrative Services, University of Plymouth - January 1994.
IV 4 COMPUTING COSTS
IV 4.1. The Networking of Cookworthy Building (UoP)
- 430 Cormection Points to a LAN
- Optical Fibre Backbone linking the Hubs
- Twisted Pair connection from Hubs to PC connection points Total £70.000

IV 4.2 Management/Maintenance
IT networics are often maintained and managed by on-site technical stafif - £20,000pa
N.B. Information provided by Mr Brian Harry of Computer Service, UoP, January 1994,
End of Appendix IV
m

CHAPTER 9
REFERENCES
185

REFERENCES
1. DEWDNEY.A.K 'Computer Revelations' Scientific America, pp 16-23, July 1983.
2. YOUNG.P Tower of Speech - History of Standard Telephones and Cables 1883-1983. George Allen & Unwin 1983. ISBN 0-04-382039-5.
3. SHOCH.J.F & HUPP.J.A* 'Measured Performance of an Ethernet Lx)cal Network' Conununications of the ACM. Vol.23, No. 12, December 1980, pp711-721. •Xerox Palo Alto Research Centre. California, USA.
4. RODD.G.M* & DERAVI.F 'Communication Systems for Industrial Automation' Prentice Hall 1989. ISBN 0-13-152372-4. *Prof Institute for Industrial Information Technology, University of Wales. Swansea. Wales, UK.
5. DTI Award for 'Industrial Innovation' to B.M.LINES £30,000 grant to investigate flexibility in automated manufacturing using LANs - in conjunction with industrial partner Sealan, Exeter. UK. 1989-1991.
). CATTERMOLE.K* Principles of Pulse Code Modulation. Iliffe Books Ltd. 1969. *Prof of Telecommunications Systems. University of Essex, Colchester. Essex. UK (retired).
CCITT (1985) DIGITAL NETWORKS/TRANSMISSION SYSTEMS & MULTIPLEXING EQUIPMENT. Red Book Vol I I I - Fascicle III.3, Recommendation G703-G956.
1. CCITT (1988) DIGITAL NETWORKS/TRANSMISSION SYSTEMS & MULTIPLEXING EQUIPMENT.
Red Book Vol I I I - Fascicle III.3. Reconunendation G821.
TOBAGI.F.A & HUNT.V.B 'Performance Analysis of Carrier Sense Multiple Access with Collision Detection.' Proc. of the Local Area Communications Network Symposium. Boston. Massachusetts. USA. May 1979.

21. GRUBER.J.G* 'Delay Related Issues in Integrated Voice and Data Networks' IEEE Tras. on Comms., Vol Conim-29, June 1981. pp786-800. * Bell-Northem Research Labs-Advanced Switching Dept-Ontario, Canada.
22. VOELCKER.R 'Integrated Multiservice Communication Networks' lEE Colloquium on Multi-Service Networks, London. UK, 22nd Nov.. 1988. pp 3/l-to-3/4.
23. FLOODJ.E* & TUCKER.R.C.K 'The Advantages of Packet Switched Speech' Proc. of'Telecommunications' lEE Conference, York University, York, UK-, 1988. pp325 - 330. * Prof of Telecommunication, Aston University, Birmingham, UK.
24. DUNLOP.J & RASHID.M.A* 'Speech Transmission Capacity of Standard Ethernet Systems' Journal of lERE. Vol.55. No.3. ppll9-122. March 1985. *Dept. of Electrical & Electronic Engineering, University of Strathclyde. Glasgow, Scotland, UK.
25. JAYANT.N & CHRISTENSEN.S.W* 'Effects of Packet Loss in Waveform Coded Speech and the Improvements due to Odd-Even Sample Interpolation Procedures.' IEEE Trans, on CommS., Vol Com-29, No 2. Feb 1981. Bell Labs, Acoustic Research Dept., Murray Hi l l . New Jersey, USA.
26. MALGARIS.B & SCHWARTZ.M* 'Performance Evaluation of a Variable Frame Multiplexer for Integrated Networks' 0 IEEE Trans, on Comms.. Vol ConMns.29. No.6, June 1981. - * * Dept. Electrical Engineering & Computer Science, Colombia University, New York. USA.
27. GOODMAN.D*. LOCKHART.G.B. WASEM.O.J. & WAI CHOONG WONG. •Waveform Substitution Techniques for Recovering Missing Speech Segments in Packet Voice Communications' IEEE Trans, on Acoustics, Speech and Signal Processing. Vol.ASSP-34. No.6. December 1986, ppl44G-1447. *AT&T Bell Labs - Holmdel - New Jersey, USA.

36. MUSSERJ.M. THEN TANG LIN, & TREDEAU.F.P* 'Packet-Voice Performance on CSMA-CD Local Area Networks/ International Symposium on Subscriber Loops and Services, pp40-44, Toronto. Canada. GTE Telenet Technology Centre. GTE Labs, Waltham, MA, USA.
37. GROVES.I.S* 'Speech Transmission Design for Electronic Telephones' BT Engineering Journal. Vol.5, 1987. pp266-272. *BT Research Labs, Martlesham, Suffolk, UK.
38. NAGASAWA.M. AOKI.M. YOSHIDA.Y, & KATO.M 'Role of Packet Switched Networks in Future Telecommunication Networks' Proc. International Conference on Computer Communications, Sydney. Australia, pp637-642. *NTT Musashino Labs. Tokyo. Japan.
39. NIZNKA.A* 'Cost-Benefit Analysis for Local Integrated Facsimile/Data/Voice Packet Communications networks.' IEEE Trans, on Comms., Vol.Com.30, No . l , Jan. 1982. ppl9-27. *Dept. Electrical Engineering. University of Pittsburgh. Pittsburgh, PA, USA.
40. HOSHI.M* 'Local Network Area Size Optimisation' IEEE Trans, on Comms.. Vol-Comm.33. No.3, March 1985. ppl99-202. *NTT. Musashino Labs. Tokyo, Japan.
41. AURTURS.E & STUCK.B* 'Bounding Mean Throughput Rate and Mean Delay in Office Systems' IEEE Trans, on Comms.. Vol.Com.30. N o l . Jan 1982. ppl2-18. *MIT Cambridge, Massachusetts, USA.
42. NUTT.G.T & BAYER.D.L* 'Performance of CSMA/CD Networks under Combined Voice and Data Loads.' IEEE Trans, on Comms.. Vol.Com.30. No l . Jan 1982. *BelI Research Labs. Murray Hil l . New Jersey. USA.
43. CAMBELI^GRANT.I.R* 'Open Systems Applications Layer Standards for Text and Office Systems.* lERE Journal. Vol.56. No.6/7. June/July 1986. pp223- 226. *ICL Bracknell. Berkshire, UK.

52. LINES.B.M* 'A Model for Assessing Subjectively the Effect of Delaying Packets in a Packet Switched Network.* Proc. European Conference on 'Speech Technology', University of Edinburgh. Scotland, UK. 2A September 1987. Vol.2. ppl27-130. •Author of this Thesis.
53. LINES.B.M* 'A Model for Optimising the Size of Speech Packets for use on a Packet Switched Networks Carrying Real-Time Interactive Speech.' lEE Colloquium on 'Speech Processing', Savoy Place, London, UK, 19 Jan. 1988. pp.9/1-9/3. •Author of this Thesis.
53. LINES.B.M* 'A Model for Assess the Ability of an Office LAN, Employing the Technical Office Protocol(TOP), to Carry Interactive Speech while Heavily Loaded with Data Traffic.' Proc. lEE International Conference on Private Switching Systems and Networks.', Savoy Place, London. UK. 21-23 June 1988, pp. 190-195. •Author of this Thesis.
54. LINES.B.M* & Prof.D.HUGHES# 'Issues Affecting the Transmission of Real-Time Interactive Speech on MAP/TOP Local Area Networks in a Computer Integrated Manufacturing Environment.' Proc. lERE International Conference on 'Integrating Information and Material Flow - Factory 2000', Churchill College, Cambridge, UK. 31 Aug.-2 Sept 1988, pp.311-317. •Author of this Thesis. ^Professor of Computer Integrated Manufacturing at Polytechnic Southwest. Plymouth, UK.
56. LINES.B.M* 'Assessment of the Ability of an Office Local Area Network,employing TOP to carry Interactive Speech while Heavily Loaded with Data Traf f ic ' Proc. lEE Second National Conference on 'Telecommunications'. University of York, York. UK. 2-5 . April 1989, pp.349-351. •Author of this Thesis
57. LINES.B.M* & Prof. D Hughes^ 'Performance Criteria for the Transmission of Real-Time Interactive Speech over LANs Employing both MAP and TOP in a CIM Environment.' Proc. lEE Second International Conference on 'Integrating Information and Material Flow - Factory 2001'. Churchill College, Cambridge. UK. 10-12 July 1990. pp.71-75. •Author of this Thesis, ff See [54].
66. WALTERS.A.G* 'Integrating Networks: A Case for Packets.' lEE Colloquium on 'Integrated Multiservice Communication Networks' Savoy Place. London. UK. 21 November. 1988. pp. 1/1-1/4. *University of Essex, Colchester, Essex. UK.
67. PRATT.C.D* 'Integration of Packet and Circuit Switching in the 1990s' lEE Colloquium on 'Integrated Multiservice Communication Networks' Savoy Place, London. UK. 21 November, 1988, pp.2/1.2/6. *BT Research Labs, MarUesham. Ipswich. Suffolk, UK.
68. VOELCKER.R & CROW J* 'Subjective Effects of Transmitting Speech Over Packet Networks.' lEE Colloquium on 'Integrated Multiservice Communication Networks' Savoy Place. London, UK, 21 November, 1988, pp.3/1-3/4. *BT Research Labs, Mardesham. Ipswich. Suffolk, UK.
69. GALLAGHER.I* 'Asynchronous Transmission Mode - Customer Access.' lEE Colloquium on 'Integrated Multiservice Communication Networks' Savoy Place, London, UK, 21 November. 1988. pp.7/1-7/6. *BT Research Labs. Martlesham. Ipswich, Suffolk. UK.
70. PROCTOR.R.J* 'Evolutionary Strategies from PSTN to IBCN' lEE Colloquium on 'Integrated Multiservice Communication Networks' Savoy Place, London. UK, 21 November. 1988. pp.8/1-8/5. •Switching Networks Design Centre. GEC-Plessey Telecommunications, Poole, Dorset. UK.
71. OOI.S. WATSON.G* & SKELLERN.D# 'A Prototype Gbit/s Multi-Service Network.' lEE Colloquium on 'Integrated Multiservice Communication Networks' Savoy Place. London. UK, 21 November. 1988. pp.9/1-9/4. •Information System Centre, Hewlett-Packard Labs. Bristol. UK. ^University of Sydney, Australia.
72. CULLEN. A* 'LAN Bridging via Intermediate Networks' lEE Colloquium 'The Interconnection of LANs'.Savoy Place. London. UK. 18th May 1990. pp. 1/1-1/3. *GEC Research. Hirst Research Centre. Wembley. Herts. UK.

80. VOELCHER.R* 'Subjective Effects of Transmitting Speech over Packet Switched Networks.' BTRL Project Report No. 389 April 1989.
81. C C m Recommendations Vol.V, Supplement No.2, Melbourne, Australia, 1988 - Blue Book. ^Methods used for Assessing Telephony Transmission Performance'.
82. WARD.K* 'The BT Telecommunications Network', Supplement to British Telecommunications Journal, Vol 8, Part 1, April 1989.
83. CCnr STUDY GROUP XH - Recommendation G281
84. JACKSON.N.S Introduction to Expert Systems* 2nd Edition, Addison and Wesley, 1990.
85. JAYANT.N.S and NOLL.P. T)igital Coding of Waveforms - Principles and Applications to Speech and Video'. Prentice-Hall, 1984.
86. GOLDBERG.D.E. 'Genetic Algorithms - In Search of Optimisation and Machine Learning'. Addison and Wesley, 1989.
87. HAYES, W P et al Journal of IEEE 'Solid State Circuits' VoI.SC-90, October 1985, pp998-604.
88. LINES. B.M. & Prof.HUGHES. D. "The Integration of Real-Time Interactive Speech with Data on a LAN - a step towards 'multi-media' in a CIM Environment". lEE Colloquim Professional Groups ElO and E7. BEE. Savoy Place, London, UK, 14 May 1992.
89. LINES, B.M. & Prof HUGHES, D. 'The use of Neural Networks to improve the quality of Real-Time Interactive Speech on LANs carry data in a CIM Environment'. Proceedings of the IEEE 3rd International Conference on Integration, Information and Material Flow.
c

90. RUMEI.HAR, D.E. HINTON, G.E. 7 KcCELLAN, J.L. •A Framework for PDP' - 1986. Volume 1.
91. BUX. W. Tx)cal Area Subnetworks: A Performance Comparison* IEEE Trans. Comm. Vol. Comm - 29 ppl46 - 1473 Oct 1981.
End of Chapter 9

CliAPTER 10
ACKNOWLEDGEMENTS
c
198

I would like to take this opportunity to sincerely thank the following people:-
Professor David Hughes for his guidance and supervision through the project,
Mr Mike Fraser for his help in constructing the Speech Processor X I ,
BTRL for their support in sponsoring the Research Fellowship Award and providing research facilities at Martlesham,
Professor P D Pearce for constant encouragement throughout the research project, providing valuable comments on the thesis, and the use of facilities within the Department of Computing for the siting of the Sealan network,
Mrs Diane Rees for patiently typing and formatting the thesis so expertly.
Professor Barry Plumb for the support received from the School of Electronic Communication and Electrical Engineering,
Dr Chris Hindle for his assistance in setting up the Sealan Network in the Department of Computing.
. End of Chapter 10
199