PhD Thesis: Modeling Trust to Improve Human-Robot Interaction
255
Transcript of PhD Thesis: Modeling Trust to Improve Human-Robot Interaction


Abstract
Throughout the history of automation, there have been numerous accidents attributed
to the inappropriate use of automated systems. Over-reliance and under-reliance on
automation are well documented problems in fields where automation has been em-
ployed for a long time, such as factories and aviation. Research has shown that one of
the key factors that influence an operator’s reliance on automated systems is his or her
trust of the system. Several factors, including risk, workload, and task difficulty have
been found to influence an operator’s trust of an automated system. With a model of
trust based upon these factors, it is possible to design automated systems that foster
well-calibrated trust and thereby prevent the misuse of automation.
Over the past decade, robot systems have become more commonplace and increas-
ingly autonomous. With the increased use of robot systems in multiple application
domains, models of trust and operator behavior for human-robot interaction (HRI)
must be created now in order to avoid some of the problems encountered by other
automation domains in the past. Since traditional automation domains and HRI are
significantly different, we reexamine trust and control allocation (operator’s usage of
autonomous behaviors) as it relates to robots with autonomous capabilities in order to
discover the relevant factors in HRI.
This dissertation examines existing work in traditional automation that is relevant
to HRI and, based on that information, builds an experimental methodology to closely
mimic real world remote robot teleoperation tasks. We also present results from multiple
experiments examining the relationship between the different factors being investigated
with respect to trust and control allocation. Based on these results, a model for hu-
man interaction with remote robots for teleoperation (HARRT) is proposed and design
guidelines to help improve overall performance are presented based on the model.
ii

Acknowledgements
I would also like to thank my committee members Dr. Holly Yanco, Dr.
Aaron Steinfeld, and Dr. Jill Drury. Their valuable insights on the subject
and introspective comments played a significant role in not only improving
my dissertation, but also in making me a better researcher. In particular
I would like to thank my advisor Dr. Holly Yanco for her guidance and
patience throughout this long process. This dissertation would not have been
the same without her help. I was a↵orded a lot of autonomy with respect
to this dissertation and that made the entire journey an enjoyable learning
experience. She has not only been an excellent mentor but also a principled
human being from whom I have learned much.
This dissertation would not have been possible without help from a lot of
people from the Robotics Lab. Members of the lab helped me with running
experiments, provided constructive criticism whenever I needed it, and were
always there when I needed help. In particular, I would like to thank Kate
Tsui, Misha Medvedev, and Dan Brooks for not only their help but also their
support through out the process.
I would also like to thank the National Science Foundation (IIS-0905228)
for supporting the research presented in this dissertation. I would also like
to thank my parents for their support and patience through this process.

Contents
1 Introduction 1
1.1 Research Focus . . . . . . . . . . . . . . . . . . . . . . . . . . . . . . . 3
1.2 Problem Statement . . . . . . . . . . . . . . . . . . . . . . . . . . . . . 4
1.3 Approach . . . . . . . . . . . . . . . . . . . . . . . . . . . . . . . . . . 5
1.4 Thesis Statement and Research Goal . . . . . . . . . . . . . . . . . . . 6
1.5 Contributions . . . . . . . . . . . . . . . . . . . . . . . . . . . . . . . . 7
1.6 Organization . . . . . . . . . . . . . . . . . . . . . . . . . . . . . . . . 7
2 Background 9
2.1 Trust Models . . . . . . . . . . . . . . . . . . . . . . . . . . . . . . . . 15
2.2 Trust in HRI . . . . . . . . . . . . . . . . . . . . . . . . . . . . . . . . 18
3 Initial Surveys 22
3.1 Participants . . . . . . . . . . . . . . . . . . . . . . . . . . . . . . . . . 23
3.2 Questionnaire . . . . . . . . . . . . . . . . . . . . . . . . . . . . . . . . 24
3.3 Results and Discussion . . . . . . . . . . . . . . . . . . . . . . . . . . . 27
3.3.1 Preference for More Manual Control (Expert Users) . . . . . . . 27
3.3.2 Preference for Autonomy Modes (Novice Users) . . . . . . . . . 28
3.3.3 Non-sequential Control Allocation Strategy . . . . . . . . . . . . 29
iii
3.3.4 Positivity Bias . . . . . . . . . . . . . . . . . . . . . . . . . . . . 29
3.3.5 Factors that Influence Trust . . . . . . . . . . . . . . . . . . . . 30
4 Expanded List of Factors for Novice Users 33
4.1 Questionnaire . . . . . . . . . . . . . . . . . . . . . . . . . . . . . . . . 34
4.2 Results and Discussion . . . . . . . . . . . . . . . . . . . . . . . . . . . 35
4.2.1 Top Five Factors Influencing Trust in HRI . . . . . . . . . . . . 35
4.2.2 Perceived Risk . . . . . . . . . . . . . . . . . . . . . . . . . . . 37
4.2.3 Performance Measures . . . . . . . . . . . . . . . . . . . . . . . 38
4.2.4 Trust Ratings . . . . . . . . . . . . . . . . . . . . . . . . . . . . 39
5 Experimental Methodology 43
5.1 Robot . . . . . . . . . . . . . . . . . . . . . . . . . . . . . . . . . . . . 46
5.2 Test Course . . . . . . . . . . . . . . . . . . . . . . . . . . . . . . . . . 47
5.2.1 Path Labels . . . . . . . . . . . . . . . . . . . . . . . . . . . . . 48
5.2.2 Victim Tags . . . . . . . . . . . . . . . . . . . . . . . . . . . . . 49
5.3 Autonomy Modes . . . . . . . . . . . . . . . . . . . . . . . . . . . . . . 50
5.4 User Input . . . . . . . . . . . . . . . . . . . . . . . . . . . . . . . . . . 51
5.5 Task . . . . . . . . . . . . . . . . . . . . . . . . . . . . . . . . . . . . . 52
5.6 Compensation . . . . . . . . . . . . . . . . . . . . . . . . . . . . . . . . 53
5.7 Questionnaires . . . . . . . . . . . . . . . . . . . . . . . . . . . . . . . 54
5.8 Procedure . . . . . . . . . . . . . . . . . . . . . . . . . . . . . . . . . . 55
5.9 Experiment Design . . . . . . . . . . . . . . . . . . . . . . . . . . . . . 57
6 Baseline Reliability Experiment 58
6.1 Results and Discussions . . . . . . . . . . . . . . . . . . . . . . . . . . 58
iv

6.1.1 Positivity Bias . . . . . . . . . . . . . . . . . . . . . . . . . . . . 59
6.1.2 Effect of Trust . . . . . . . . . . . . . . . . . . . . . . . . . . . . 59
6.1.3 Effect on Control Allocation . . . . . . . . . . . . . . . . . . . . 61
6.1.4 Use of Autonomy During Periods of Unreliability . . . . . . . . 63
6.1.5 Subjective Ratings . . . . . . . . . . . . . . . . . . . . . . . . . 64
6.1.6 Familiarity Bias . . . . . . . . . . . . . . . . . . . . . . . . . . . 65
6.1.7 Predicting Trust . . . . . . . . . . . . . . . . . . . . . . . . . . 66
7 Influence of Low Situation Awareness on Trust 68
7.1 Methodology . . . . . . . . . . . . . . . . . . . . . . . . . . . . . . . . 69
7.2 Results and Discussions . . . . . . . . . . . . . . . . . . . . . . . . . . 71
7.2.1 Effect on Trust . . . . . . . . . . . . . . . . . . . . . . . . . . . 71
7.2.2 Effect on Control Allocation . . . . . . . . . . . . . . . . . . . . 72
7.3 Performance . . . . . . . . . . . . . . . . . . . . . . . . . . . . . . . . . 73
7.3.1 Hits . . . . . . . . . . . . . . . . . . . . . . . . . . . . . . . . . 73
7.3.2 Time . . . . . . . . . . . . . . . . . . . . . . . . . . . . . . . . . 74
7.3.3 Wrong Turns . . . . . . . . . . . . . . . . . . . . . . . . . . . . 74
7.4 Subjective Ratings . . . . . . . . . . . . . . . . . . . . . . . . . . . . . 74
7.5 Conclusions . . . . . . . . . . . . . . . . . . . . . . . . . . . . . . . . . 77
8 Measuring Real-Time Trust 78
8.1 Secondary Task . . . . . . . . . . . . . . . . . . . . . . . . . . . . . . . 79
8.2 Real-Time Trust . . . . . . . . . . . . . . . . . . . . . . . . . . . . . . 80
8.3 Updated Reliability Conditions . . . . . . . . . . . . . . . . . . . . . . 82
8.4 Compensation . . . . . . . . . . . . . . . . . . . . . . . . . . . . . . . . 84
8.5 Results and Discussion . . . . . . . . . . . . . . . . . . . . . . . . . . . 84
v

8.5.1 Effect on Trust . . . . . . . . . . . . . . . . . . . . . . . . . . . 85
8.5.2 Effect on Control Allocation . . . . . . . . . . . . . . . . . . . . 86
8.5.3 Performance . . . . . . . . . . . . . . . . . . . . . . . . . . . . . 87
8.5.4 Subjective Ratings . . . . . . . . . . . . . . . . . . . . . . . . . 89
9 Impact of Feedback 90
9.1 Methodology . . . . . . . . . . . . . . . . . . . . . . . . . . . . . . . . 91
9.1.1 Modifications for the Feedback Condition . . . . . . . . . . . . . 91
9.2 Results and Discussion . . . . . . . . . . . . . . . . . . . . . . . . . . . 93
9.2.1 Effect on Trust . . . . . . . . . . . . . . . . . . . . . . . . . . . 93
9.2.2 Effect on Control Allocation . . . . . . . . . . . . . . . . . . . . 96
9.2.3 Performance . . . . . . . . . . . . . . . . . . . . . . . . . . . . . 97
9.2.4 Effect of Feedback . . . . . . . . . . . . . . . . . . . . . . . . . 98
10 Reduced Task Difficulty 100
10.1 Results and Discussion . . . . . . . . . . . . . . . . . . . . . . . . . . . 100
10.1.1 Effect on Trust . . . . . . . . . . . . . . . . . . . . . . . . . . . 102
10.1.2 Effect on Control Allocation . . . . . . . . . . . . . . . . . . . . 102
10.1.3 Performance . . . . . . . . . . . . . . . . . . . . . . . . . . . . . 104
10.1.4 Subjective Ratings . . . . . . . . . . . . . . . . . . . . . . . . . 104
11 Long Term Interaction 107
11.1 Methodology . . . . . . . . . . . . . . . . . . . . . . . . . . . . . . . . 107
11.1.1 Compensation . . . . . . . . . . . . . . . . . . . . . . . . . . . . 108
11.1.2 Questionnaires . . . . . . . . . . . . . . . . . . . . . . . . . . . 109
11.1.3 Participants . . . . . . . . . . . . . . . . . . . . . . . . . . . . . 109
vi

11.2 Effect on Trust . . . . . . . . . . . . . . . . . . . . . . . . . . . . . . . 110
11.2.1 Muir . . . . . . . . . . . . . . . . . . . . . . . . . . . . . . . . . 110
11.2.2 Area Under the Trust Curve (AUTC) . . . . . . . . . . . . . . . 112
11.3 Effect on Control Allocation . . . . . . . . . . . . . . . . . . . . . . . . 113
11.3.1 Mode switches . . . . . . . . . . . . . . . . . . . . . . . . . . . . 113
11.3.2 Control Allocation Strategy . . . . . . . . . . . . . . . . . . . . 114
11.4 Performance . . . . . . . . . . . . . . . . . . . . . . . . . . . . . . . . . 115
11.4.1 Hits . . . . . . . . . . . . . . . . . . . . . . . . . . . . . . . . . 115
11.4.2 Time . . . . . . . . . . . . . . . . . . . . . . . . . . . . . . . . . 116
11.4.3 Wrong Turns . . . . . . . . . . . . . . . . . . . . . . . . . . . . 117
11.5 Subjective Ratings . . . . . . . . . . . . . . . . . . . . . . . . . . . . . 118
11.5.1 Workload . . . . . . . . . . . . . . . . . . . . . . . . . . . . . . 118
11.5.2 Robot’s Performance Rating . . . . . . . . . . . . . . . . . . . . 120
11.5.3 Self Performance Rating . . . . . . . . . . . . . . . . . . . . . . 121
11.5.4 Perceived Risk . . . . . . . . . . . . . . . . . . . . . . . . . . . 122
11.6 Conclusions . . . . . . . . . . . . . . . . . . . . . . . . . . . . . . . . . 123
12 Combined Results 125
12.1 Demographics . . . . . . . . . . . . . . . . . . . . . . . . . . . . . . . . 126
12.1.1 Prior Experience . . . . . . . . . . . . . . . . . . . . . . . . . . 126
12.1.2 Risk Attitude . . . . . . . . . . . . . . . . . . . . . . . . . . . . 127
12.2 Effect on Trust . . . . . . . . . . . . . . . . . . . . . . . . . . . . . . . 127
12.3 Effect on Control Allocation . . . . . . . . . . . . . . . . . . . . . . . . 129
12.3.1 Inappropriate Mode Switches . . . . . . . . . . . . . . . . . . . 131
12.3.1.1 Inappropriate Switches to RA . . . . . . . . . . . . . . 131
vii

12.3.1.2 Inappropriate Switches to FA . . . . . . . . . . . . . . 131
12.3.1.3 Total Inappropriate Switches . . . . . . . . . . . . . . 132
12.3.2 Control Allocation Strategy . . . . . . . . . . . . . . . . . . . . 133
12.4 Performance . . . . . . . . . . . . . . . . . . . . . . . . . . . . . . . . . 134
12.4.1 Hits . . . . . . . . . . . . . . . . . . . . . . . . . . . . . . . . . 134
12.4.2 Time . . . . . . . . . . . . . . . . . . . . . . . . . . . . . . . . . 135
12.4.3 Wrong Turns . . . . . . . . . . . . . . . . . . . . . . . . . . . . 136
12.4.4 Automation Errors (AER) . . . . . . . . . . . . . . . . . . . . . 136
12.4.5 Manual Errors (MER) . . . . . . . . . . . . . . . . . . . . . . . 137
12.4.6 Automation Errors vs Manual Errors . . . . . . . . . . . . . . . 137
12.5 Subjective Ratings . . . . . . . . . . . . . . . . . . . . . . . . . . . . . 138
12.5.1 Self Performance . . . . . . . . . . . . . . . . . . . . . . . . . . 138
12.5.2 Robot Performance . . . . . . . . . . . . . . . . . . . . . . . . . 139
12.5.3 Robot Performance vs Self Performance . . . . . . . . . . . . . 139
12.5.4 Perceived Risk . . . . . . . . . . . . . . . . . . . . . . . . . . . 140
12.5.5 Workload . . . . . . . . . . . . . . . . . . . . . . . . . . . . . . 141
12.6 Conclusions . . . . . . . . . . . . . . . . . . . . . . . . . . . . . . . . . 142
13 Factors that Influence Operator Behavior 143
13.1 Demographics . . . . . . . . . . . . . . . . . . . . . . . . . . . . . . . . 145
13.1.1 Prior Experience . . . . . . . . . . . . . . . . . . . . . . . . . . 145
13.1.2 Risk Attitude . . . . . . . . . . . . . . . . . . . . . . . . . . . . 146
13.2 Trust . . . . . . . . . . . . . . . . . . . . . . . . . . . . . . . . . . . . . 147
13.2.1 Age . . . . . . . . . . . . . . . . . . . . . . . . . . . . . . . . . 147
13.2.2 Risk Attitude . . . . . . . . . . . . . . . . . . . . . . . . . . . . 148
viii
13.3 Control Allocation . . . . . . . . . . . . . . . . . . . . . . . . . . . . . 149
13.3.1 Mode Switches . . . . . . . . . . . . . . . . . . . . . . . . . . . 149
13.3.2 Control Allocation Strategy . . . . . . . . . . . . . . . . . . . . 149
13.4 Performance . . . . . . . . . . . . . . . . . . . . . . . . . . . . . . . . . 150
13.5 Subjective Ratings . . . . . . . . . . . . . . . . . . . . . . . . . . . . . 151
13.6 Modeling Operator Behavior . . . . . . . . . . . . . . . . . . . . . . . . 152
14 Model and Guidelines 159
14.1 Reducing Situation Awareness (SA) . . . . . . . . . . . . . . . . . . . . 159
14.1.1 Qualitative Model . . . . . . . . . . . . . . . . . . . . . . . . . . 160
14.2 Providing Feedback . . . . . . . . . . . . . . . . . . . . . . . . . . . . . 162
14.2.1 Qualitative Model . . . . . . . . . . . . . . . . . . . . . . . . . . 162
14.3 Reducing Task Difficulty . . . . . . . . . . . . . . . . . . . . . . . . . . 164
14.3.1 Qualitative Model . . . . . . . . . . . . . . . . . . . . . . . . . . 164
14.4 Long Term Interaction . . . . . . . . . . . . . . . . . . . . . . . . . . . 166
14.4.1 Qualitative Model . . . . . . . . . . . . . . . . . . . . . . . . . . 167
14.5 Impact of Timing of Periods of Low Reliability . . . . . . . . . . . . . . 168
14.6 Impact of Age . . . . . . . . . . . . . . . . . . . . . . . . . . . . . . . . 168
15 Conclusions and Future Work 171
15.1 Contributions . . . . . . . . . . . . . . . . . . . . . . . . . . . . . . . . 173
15.2 Limitations of Research . . . . . . . . . . . . . . . . . . . . . . . . . . . 176
15.3 Future Work . . . . . . . . . . . . . . . . . . . . . . . . . . . . . . . . . 177
15.3.1 Additional Factors for Experimentation . . . . . . . . . . . . . . 178
15.3.2 HARRT Model . . . . . . . . . . . . . . . . . . . . . . . . . . . 178
15.3.3 Measuring Real-time Performance . . . . . . . . . . . . . . . . . 179
ix

15.3.4 Investigating Different Domains . . . . . . . . . . . . . . . . . . 179
15.3.5 Increasing Robustness in Interactions . . . . . . . . . . . . . . . 180
15.4 Summary . . . . . . . . . . . . . . . . . . . . . . . . . . . . . . . . . . 181
Appendices 196
A Initial Survey 197
A.1 Participant Information . . . . . . . . . . . . . . . . . . . . . . . . . . 197
A.2 Factors Influencing Trust . . . . . . . . . . . . . . . . . . . . . . . . . . 198
A.3 Thorough Search in an Unstructured Environment . . . . . . . . . . . . 198
A.4 Hasty Search in a Structured Environment . . . . . . . . . . . . . . . . 200
A.5 Generic Task . . . . . . . . . . . . . . . . . . . . . . . . . . . . . . . . 201
A.6 Factors Influencing Trust . . . . . . . . . . . . . . . . . . . . . . . . . . 202
B Expanded Survey 203
B.1 Participant Information . . . . . . . . . . . . . . . . . . . . . . . . . . 203
B.2 Assumptions about Robots . . . . . . . . . . . . . . . . . . . . . . . . . 204
B.3 Factors Influencing Trust . . . . . . . . . . . . . . . . . . . . . . . . . . 205
B.4 Video Questionnaire . . . . . . . . . . . . . . . . . . . . . . . . . . . . 207
C Questionnaires used with Experiments 210
C.1 Pre-experiment Questionnaire . . . . . . . . . . . . . . . . . . . . . . . 210
C.1.1 Demographic Information . . . . . . . . . . . . . . . . . . . . . 210
C.1.2 Current Technology Use . . . . . . . . . . . . . . . . . . . . . . 211
C.1.3 General Personality . . . . . . . . . . . . . . . . . . . . . . . . . 212
C.1.4 General Technology Attitudes . . . . . . . . . . . . . . . . . . . 213
C.2 Post-run Questionnaires . . . . . . . . . . . . . . . . . . . . . . . . . . 215
x
C.2.1 Workload TLX . . . . . . . . . . . . . . . . . . . . . . . . . . . 215
C.2.2 Jian (Trust) . . . . . . . . . . . . . . . . . . . . . . . . . . . . . 215
C.2.3 Muir (Trust) . . . . . . . . . . . . . . . . . . . . . . . . . . . . . 216
C.2.4 Miscellaneous . . . . . . . . . . . . . . . . . . . . . . . . . . . . 217
C.2.5 SA (SAGAT; [Endsley, 1988]) . . . . . . . . . . . . . . . . . . . 217
C.3 Post-experiment questionnaire . . . . . . . . . . . . . . . . . . . . . . . 219
D Additional Analysis 220
D.1 Regression Analysis . . . . . . . . . . . . . . . . . . . . . . . . . . . . . 220
D.2 Real-Time Trust Graphs . . . . . . . . . . . . . . . . . . . . . . . . . . 222
D.3 Normalized Control Allocation . . . . . . . . . . . . . . . . . . . . . . . 230
xi

List of Figures
2.1 The duty of appropriate trust as hypothesized by Sheridan and Verplank
(from [Sheridan, 1978]). . . . . . . . . . . . . . . . . . . . . . . . . . . 12
2.2 The model of operator reliance on automation hypothesized by Riley
(from [Riley, 1996]). Solid lines indicate relationships that have been
verified and the dashed lines indicate hypothesized relationships. . . . . 13
2.3 The model of trust created by Lee and Moray (from [Lee and Moray,
1991]). . . . . . . . . . . . . . . . . . . . . . . . . . . . . . . . . . . . . 14
5.1 The robot (ATRVJr) used for the experiments. . . . . . . . . . . . . . . 46
5.2 The course used for the experiments. . . . . . . . . . . . . . . . . . . . 48
5.3 The user interface (left) and the gamepad (right) used to control the robot. 51
5.4 The different reliability configurations. . . . . . . . . . . . . . . . . . . 56
6.1 Impact of reliability on trust (higher number indicates more trust). . . 60
6.2 Impact of reliability on mode switching. . . . . . . . . . . . . . . . . . 61
6.3 Autonomy return by exposure to low reliability. . . . . . . . . . . . . . 63
6.4 Impact of reliability on self assessment ratings. . . . . . . . . . . . . . . 65
xii

7.1 The interface used in the dynamic reliability experiment (DR) is shown
on the left. The interface on the right, designed for the low situation
awareness experiment (LSA), reduced the operator’s situation awareness
by removing the crosshairs indicating the current pan and tilt of the
camera and by providing less accurate distance information around the
robot. . . . . . . . . . . . . . . . . . . . . . . . . . . . . . . . . . . . . 70
7.2 Control allocation strategy for DR and LSA experiments across reliability
conditions, ±1 st. error. . . . . . . . . . . . . . . . . . . . . . . . . . . 73
7.3 Workload for DR and LSA experiments across reliability conditions. . . 75
7.4 Self-performance and robot’s performance ratings for DR and LSA ex-
periments across reliability conditions. . . . . . . . . . . . . . . . . . . 76
8.1 The user interface used to control the robot for the RT experiments. . . 79
8.2 The gamepad used by the participants to control the robot and provide
feedback about their change in trust. . . . . . . . . . . . . . . . . . . . 81
8.3 Trust prompt indicators (from left): a red circle with a black border
prompting the participants to indicate their change in trust, showing
that the participant indicated an increase in trust, showing that the par-
ticipant indicated a decrease in trust, and showing that the participant
indicated no change in trust. . . . . . . . . . . . . . . . . . . . . . . . . 82
8.4 Reliability conditions for the new experiments. . . . . . . . . . . . . . . 83
8.5 Left: Muir trust across the different reliability conditions. Right: AUTC
values across the different reliability conditions. . . . . . . . . . . . . . 85
8.6 The evolution of trust. The graph shows the average real-time trust
ratings for the two groups. . . . . . . . . . . . . . . . . . . . . . . . . 85
xiii

8.7 Left: autonomy mode switches across the different reliability conditions.
Right: the control allocation strategy across the different reliability con-
ditions. . . . . . . . . . . . . . . . . . . . . . . . . . . . . . . . . . . . . 86
8.8 The performance metics across the different reliability conditions. Left
to right: Hits, run time, and wrong turns. . . . . . . . . . . . . . . . . 87
8.9 The subjective ratings for robot’s performance, self performance, and
perceived risk across the different reliability conditions. . . . . . . . . . 88
9.1 The user interface used for the Feedback experiment. The emoticon used
to indicate high confidence in the robot’s sensors is shown below the rear
view video. . . . . . . . . . . . . . . . . . . . . . . . . . . . . . . . . . 92
9.2 Semantic and non-semantic indicators. The icons for semantic feedback
had yellow backgrounds. The high confidence icon for non-semantic
feedback had a green background and the low confidence icon for non-
semantic feedback had a pink background. . . . . . . . . . . . . . . . . 93
9.3 The evolution of trust. The graph shows the average real-time trust
ratings for the two groups. . . . . . . . . . . . . . . . . . . . . . . . . 94
9.4 Left: Muir trust ratings for both experiments across all reliability condi-
tions. Right: Muir trust ratings for both experiments across all reliability
conditions. The mean values are shown along with ± 1 standard error. 95
9.5 Left: Autonomy mode switches for both experiments across all reliabil-
ity conditions. Right: control allocation strategy for both experiments
across all reliability conditions. . . . . . . . . . . . . . . . . . . . . . . 96
9.6 Left to right: hits, run time, and wrong turns for both experiments across
all reliability conditions. . . . . . . . . . . . . . . . . . . . . . . . . . . 97
xiv

10.1 The course with the narrow gates used for the RD experiment. . . . . . 101
10.2 Left: Muir trust ratings for RD and RT experiments across the different
reliability conditions. Right: AUTC values for RD and RT experiments
across the different reliability conditions. . . . . . . . . . . . . . . . . . 102
10.3 Left: Control allocation for RD and RT experiments. Right: Autonomy
mode switches for RD and RT experiments. . . . . . . . . . . . . . . . 103
10.4 Top: Performance differences between RT and TD. Left to right: hits,
time, and wrong turns. Bottom: Subjective differences between RT and
TD. Left to right: robot’s performance rating, self performance rating,
and perceived risk. . . . . . . . . . . . . . . . . . . . . . . . . . . . . . 105
11.1 Muir trust across sessions for both participant groups. . . . . . . . . . . 111
11.2 AUTC trust across sessions for both participant groups. . . . . . . . . . 112
11.3 Left: Mode switches. Right: Control allocation strategy. . . . . . . . . 114
11.4 Left: Hits. Center: Time. Right: Wrong turns. . . . . . . . . . . . . . . 117
11.5 Top left: Robot’s performance rating. Top right: Self performance rat-
ing. Bottom left: Perceived risk. Bottom right: Workload. . . . . . . . 119
12.1 The age and gender of participants across experiments. . . . . . . . . . 126
12.2 Left: Muir trust for the different experiments. Right: Muir trust across
the different reliability conditions. . . . . . . . . . . . . . . . . . . . . . 128
12.3 Left: AUTC trust for the different experiments. Right: AUTC trust
across the different reliability conditions. . . . . . . . . . . . . . . . . . 129
12.4 Left: Mode switches for the different experiments. Right: Mode switches
across the different reliability conditions. . . . . . . . . . . . . . . . . . 130
xv
12.5 Left: Inappropriate mode switches for the different experiments. Right:
Inappropriate mode switches across the different reliability conditions. . 130
12.6 Left: Control allocation strategy for the different experiments. Right:
Control allocation strategy across the different reliability conditions. . . 133
12.7 Left: Hits and wrong turns for the different experiments. Right: Hits
and wrong turns across the different reliability conditions. . . . . . . . 134
12.8 Left: Run time for the different experiments. Right: Run time across
the different reliability conditions. . . . . . . . . . . . . . . . . . . . . . 135
12.9 Left: Automation errors (AER) and manual errors (MER) for the differ-
ent experiments. Right: AER and MER across the different reliability
conditions. . . . . . . . . . . . . . . . . . . . . . . . . . . . . . . . . . . 137
12.10Left: Subjective ratings for the different experiments. Right: Subjective
ratings across the different reliability conditions. . . . . . . . . . . . . . 139
12.11Left: Relationship between perceived risk and robot’s performance rat-
ing. Right: Relationship between perceived risk and robot’s performance
rating. . . . . . . . . . . . . . . . . . . . . . . . . . . . . . . . . . . . . 140
12.12Left: Workload for the different experiments. Right: Workload across
the different reliability conditions. . . . . . . . . . . . . . . . . . . . . . 141
13.1 (Top) Left to right: Relationship between age and prior experience with
robot, radio-controlled cars, first-person shooter games, and real-time
strategy games. (Bottom) Left to right: Relationship between age and
risk attitude questions RQ1, RQ2, RQ3, and RQ4. . . . . . . . . . . . . 145
13.2 Left: Relationship between age and Muir trust. Right: Relationship
between age and AUTC. . . . . . . . . . . . . . . . . . . . . . . . . . . 147
xvi

13.3 Left to right: Relationship between age and control allocation strategy,
autonomy mode switches, and gates passed in RA mode. . . . . . . . . 148
13.4 (Top) Left to right: Relationship between age and hits, time, and wrong
turns. (Bottom) Left to right: Relationship between age and AER and
MER. . . . . . . . . . . . . . . . . . . . . . . . . . . . . . . . . . . . . 150
13.5 Left to right: Relationship between age and self performance rating,
robot’s performance rating, perceived risk, and workload. . . . . . . . . 151
13.6 Results of correlation analysis between data collected using all the met-
rics. The correlation values between the row attribute and the column
attribute are shown in boxes. Only significant correlations with r� |0.3|
are shown. Shades of green and red indicate positive and negative cor-
relations, with a darker shade indicating a stronger correlation. . . . . . 153
13.7 The significant correlations between age and other attributes. . . . . . 154
13.8 The significant correlations between workload and other attributes. . . 154
13.9 The significant correlations between task accuracy (wrong turns) and
other attributes. . . . . . . . . . . . . . . . . . . . . . . . . . . . . . . . 155
13.10The significant correlations between trust (Muir) and other attributes. . 156
xvii
13.11A detailed hypothesized model for human interaction with remote robots
for teleoperation (HARRT). This model is based on the correlation data
shown in Figure 13.6, but was created by only showing relationships that
have a causal relationship. The number next to edges represent signif-
icant correlation values as percentages. Numbers with an underscore
indicate a negative correlation and numbers without an underscore indi-
cate a positive correlation. The directed edges represent proposed causal
relationships between factors, with the factor next to the arrowhead be-
ing influenced when the other factor changes. . . . . . . . . . . . . . . . 158
14.1 The impact of reducing situation awareness (SA) on different factors. All
of the effects shown are based on significant differences between the Low
Situation Awareness (LSA) and Dynamic Reliability (DR) experiments. 160
14.2 The impact of providing feedback on different factors. All of the effects
shown are based on significant differences between the Feedback (F) and
Real-Time Trust (RT) experiments. . . . . . . . . . . . . . . . . . . . . 162
14.3 The impact of reducing task difficulty on different factors. All of the
effects shown are based on significant differences between the Reduced
Difficulty (RD) and RT experiments. . . . . . . . . . . . . . . . . . . . 165
14.4 The impact of familiarity with robots on different factors. All of the
effects shown are based on significant differences between the two par-
ticipant groups in the Long Term (LT) experiment. . . . . . . . . . . . 166
xviii

14.5 The original human and autonomous remote robot teleoperation (HARRT)
model augmented with the sub-models derived in this chapter. The or-
ange or blue arrow indicate an inverse relationship or a proportional
relationship respectively. . . . . . . . . . . . . . . . . . . . . . . . . . . 170
D.1 Real-time trust data for the different reliability conditions from the RT,
F, RD and LT experiments. . . . . . . . . . . . . . . . . . . . . . . . . 222
D.2 Real-time trust data for the RT, F, RD and LT experiments. . . . . . . 223
D.3 Real-time trust data for the different reliability conditions from the RT
experiment. . . . . . . . . . . . . . . . . . . . . . . . . . . . . . . . . . 224
D.4 Real-time trust data for the different reliability conditions from the LT
experiment. . . . . . . . . . . . . . . . . . . . . . . . . . . . . . . . . . 225
D.5 Real-time trust data for the different reliability conditions from the F
experiment. . . . . . . . . . . . . . . . . . . . . . . . . . . . . . . . . . 226
D.6 Real-time trust data for the different reliability conditions from the RD
experiment. . . . . . . . . . . . . . . . . . . . . . . . . . . . . . . . . . 227
D.7 Top: Real-time trust data for the different reliability conditions from
all of the experiments. Bottom: Real-time trust data from all of the
experiments. . . . . . . . . . . . . . . . . . . . . . . . . . . . . . . . . . 228
D.8 Top to bottom: Real-time trust data for the different reliability condi-
tions from the RT, D, RD, and LT experiments. . . . . . . . . . . . . . 229
D.9 Control allocation for all the experiments calculated as a percent value
to allow comparison between the two experimental setup with different
length maps. . . . . . . . . . . . . . . . . . . . . . . . . . . . . . . . . . 230
xix

List of Tables
3.1 Autonomy modes ranked by expert and novice users in S1:Expert and
S1:Novice respectively. . . . . . . . . . . . . . . . . . . . . . . . . . . . 27
3.2 Autonomy mode ranks for hasty search (H) and thorough search (T)
ranked by expert and novice users. Cells with an asterisk indicate the
result was statistically significant (p <0.05 using the Wilcoxon matched-
pairs signed-ranks test). The ‘>’ sign indicates the that autonomy mode
to the left of the sign was preferred more than the autonomy mode to
the right of the sign. . . . . . . . . . . . . . . . . . . . . . . . . . . . . 28
3.3 Trust factors ranked by expert and novice users in S1:Expert and S1:Novice
respectively. . . . . . . . . . . . . . . . . . . . . . . . . . . . . . . . . . 30
3.4 Factor ranks for expert (E) and novice (N) users. Cells with an aster-
isk indicate the result was statistically significant (p <0.05 using the
Wilcoxon matched-pairs signed-ranks test). The ‘>’ sign indicates the
that trust factor to the left of the sign was ranked to be more important
that the trust factor to the right of the sign. . . . . . . . . . . . . . . . 31
xx

4.1 The top five factors selected by the participants in different sections of
Survey S2. The numbers indicate the percentage of participants that
ranked the factor to be in the top five. Highlighted rows were ranked as
top five for at least of one the survey sections. The superscripts show
ranks based on the number of participants selecting the factor for that
section of the survey. . . . . . . . . . . . . . . . . . . . . . . . . . . . . 36
4.2 Performance ratings by participants in Survey S2 (1=poor, 7=excellent).
The significant differences are presented in Table 4.4. . . . . . . . . . . 37
4.3 Trust ratings by participants in S2. The rating scale for Muir’s question
was 0 to 100 (low to high) and for Jian’s questionnaire was 1 to 7 (strongly
agree to strongly disagree). . . . . . . . . . . . . . . . . . . . . . . . . . 38
4.4 The results from the two tailed unpaired t-tests for the robot’s perfor-
mance ratings from Table 4.2. . . . . . . . . . . . . . . . . . . . . . . . 40
5.1 System classifications from [Moray and Inagaki, 1999]. . . . . . . . . . 44
5.2 Task classifications from [Moray and Inagaki, 1999]. . . . . . . . . . . . 44
5.3 Classification of experimental platforms based on the taxonomy adapted
from [Moray and Inagaki, 1999]. . . . . . . . . . . . . . . . . . . . . . . 45
5.4 The count of experimental setups grouped by system and task classification. 46
6.1 Backwards stepwise regression results for Muir trust ratings . . . . . . 67
11.1 The significant results from this LT experiment. The significant results
across sessions where only session 1 values were found to be different from
other sessions are not presented. The ‘<’ sign indicates that the value
was significantly lower for FR than NFR and ‘>’ indicates the opposite. 124
xxi
13.1 Correlation of different variables with age and the risk attitude questions
(RQ1 - RQ4). A single ‘*’ indicates that the p value was between 0.05
and 0.01. A ‘**’ indicates that the p values was less than 0.01. . . . . . 144
15.1 A list of all the guidelines proposed in Chapter 14 and their impact on
different aspects of the system. . . . . . . . . . . . . . . . . . . . . . . 176
D.1 Results of backwards stepwise linear regression for the control allocation
strategy. The top row represents the experiments and the R2 values
from the regression. The last column presents result of performing the
regression on all of the experiments with real-time trust. The estimates
for each of the factors are shown in the rows. A single asterisk indicates
that the p value for the estimate was between 0.05 and 0.01 and two
asterisks indicate that the p value was less than 0.01. . . . . . . . . . . 220
D.2 Results of backwards stepwise linear regression for Muir trust. The top
row represents the experiments and the R2 values from the regression.
The last column presents result of performing the regression on all of the
experiments with real-time trust. The estimates for each of the factors
are shown in the rows. A single asterisk indicates that the p value for
the estimate was between 0.05 and 0.01 and two asterisks indicate that
the p value was less than 0.01. . . . . . . . . . . . . . . . . . . . . . . . 221
xxii

Chapter 1
Introduction
Parasuraman and Riley define automation as “the execution by a machine agent (usually
a computer) of a function that was previously carried out by a human” [Parasuraman
and Riley, 1997]. Increases in autonomous capabilities of machines are sometimes seen
as a double edged sword, especially in the human factors community [Boehm-Davis
et al., 1983]. While the use of automation can help to ameliorate some problems that
are caused by manual control, it can also create a different set of problems, including
loss of skill and complacency [Boehm-Davis et al., 1983,Endsley and Kiris, 1995,Sarter
et al., 1997, Wickens and Xu, 2002, Norman, 1990] and these inevitably impact how
operators interact with the automated system. The key issue, however, is the over-
reliance or the under-reliance on automation. One of the known contributing factors to
improper reliance on automation is trust (e.g., [Muir, 1989,Lee and Moray, 1994]).
While it is difficult to conclusively state the root cause, over-reliance or under-
reliance on automated systems due to miscalibrated trust can often be inferred in inci-
dent reports from the aviation industry. For example:
“In December 1995, the crew of an American Airlines Boeing 757, descending
1

through a mountain valey toward Cali, Columbia, attempted to route the aircraft
toward their destination by entering into the flight management system (FMS)
a substring of the code for a CaZi navigational beacon. The computer’s stored
database of navigational beacons contained two very similar codes. One code
denoted the beacon near Cali, which was several dozen miles ahead of the airplane.
The other code corresponded to a beacon at the Bogota airport, several dozen
miles behind the airplane. Presented by the FMS with a list of nearby beacons
matching the entered substring, the crew initiated an over-learned behavior and
selected the computer’s first presented alternative; unfortunately, the FMS had
presented the Bogota beacon first. The flight management computer dutifully
began turning the aircraft toward Bogota. Shortly after this, the aircraft crashed
into the side of a mountain, killing 151 passengers and 8 crew” [Phillips, 1999].
Researchers have investigated factors that influence trust and ultimately reliance on
automated systems [Muir, 1989,Lee and Moray, 1994,Riley, 1996] in order to prevent
such accidents and improve the performance of automated systems.
Just like the gradual increase in the number of automated plants and autopilots a
few decades ago, the number of robots in use is currently on the rise. Approximately 2.2
million consumer service robots were sold in 2010, an increase of 35% over 2009 [IFR,
2011]. There is a desire for robots to be more autonomous, especially in domains like
the military and search and rescue, where there is a push to have fewer operators con-
trol more robots [Lin, 2008]. Robots with autonomous behaviors are not as capable
as some of the automated systems used in traditional automation. For example, auto-
pilot systems can control the plane from take-off to landing, whereas the state of the
practice in domains like urban search and rescue is teleoperation [Burke et al., 2004a].
Also, there are other key differences between traditional automation and robotics (e.g.,
2

reliability and autonomous capability); however, autonomous robots, much like tradi-
tional automated systems, face the same problems of inappropriate operator reliance
on automation [Baker and Yanco, 2004]. Hence, it is important to visit the issue of
appropriate automation usage in robotics sooner rather than later. While there is some
research that examines an operator’s trust of robots [Freedy et al., 2007], it is very
cursory. There does not exist a comprehensive model of trust in robotics.
1.1 Research Focus
Robotics encompasses a very wide range of domains ranging from medicine (e.g., [In-
tuitive Surgical, 2012], [Intouch Health, 2012]) to space (e.g., [Lovchik and Diftler,
1999], [Hirzinger et al., 1994]) to consumer (e.g., [VGO Communications, 2012], [Tsui
et al., 2011a]) to military (e.g., [iRobot, 2012], [Chen, 2009]). The human-robot inter-
action (HRI) involved in these domains also differs greatly, so it is important to narrow
down the domain for which research must be conducted. For the research presented in
this thesis, we selected the remote robot teleoperation (RRT) task, specifically due to
the high level of difficulty and the relatively low situation awareness. These differences
make RRT one of the more difficult domains in HRI and also presents a stark contrast
when compared to the typical human-automation interaction (HAI) systems that are
commonly used for research. While this domain selection will limit the generalizability
of this thesis, it will, however, examine an important domain.
3
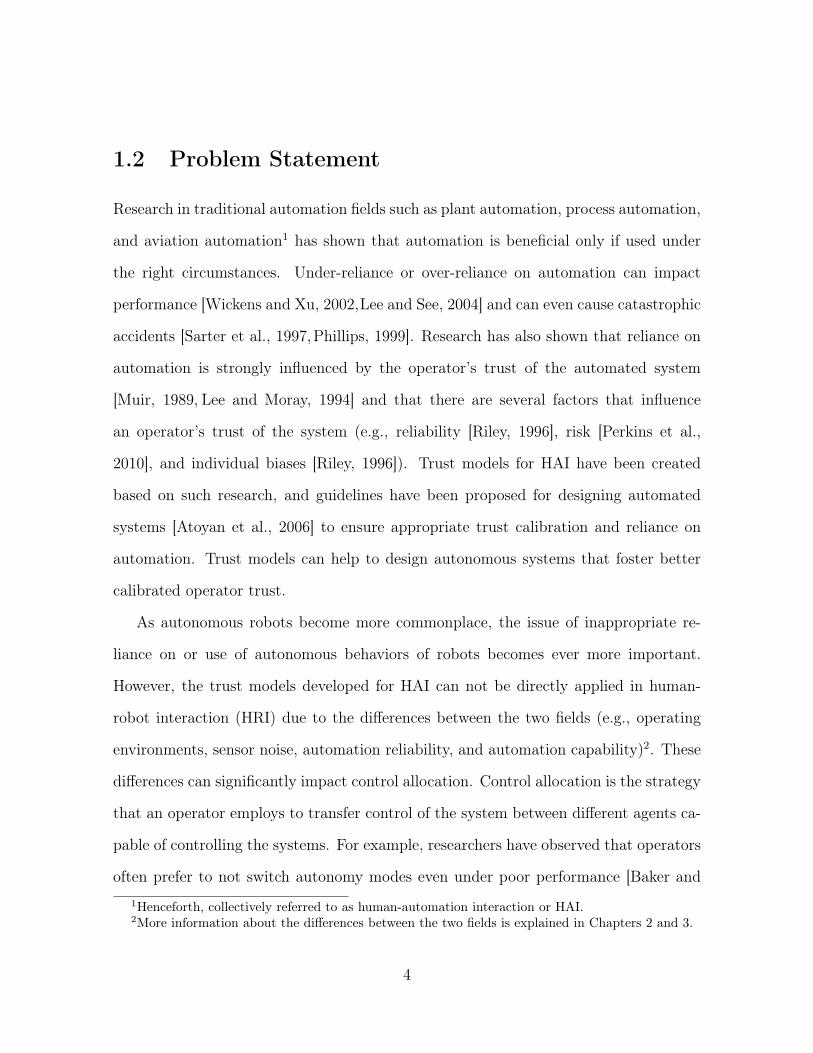
1.2 Problem Statement
Research in traditional automation fields such as plant automation, process automation,
and aviation automation1 has shown that automation is beneficial only if used under
the right circumstances. Under-reliance or over-reliance on automation can impact
performance [Wickens and Xu, 2002,Lee and See, 2004] and can even cause catastrophic
accidents [Sarter et al., 1997,Phillips, 1999]. Research has also shown that reliance on
automation is strongly influenced by the operator’s trust of the automated system
[Muir, 1989, Lee and Moray, 1994] and that there are several factors that influence
an operator’s trust of the system (e.g., reliability [Riley, 1996], risk [Perkins et al.,
2010], and individual biases [Riley, 1996]). Trust models for HAI have been created
based on such research, and guidelines have been proposed for designing automated
systems [Atoyan et al., 2006] to ensure appropriate trust calibration and reliance on
automation. Trust models can help to design autonomous systems that foster better
calibrated operator trust.
As autonomous robots become more commonplace, the issue of inappropriate re-
liance on or use of autonomous behaviors of robots becomes ever more important.
However, the trust models developed for HAI can not be directly applied in human-
robot interaction (HRI) due to the differences between the two fields (e.g., operating
environments, sensor noise, automation reliability, and automation capability)2. These
differences can significantly impact control allocation. Control allocation is the strategy
that an operator employs to transfer control of the system between different agents ca-
pable of controlling the systems. For example, researchers have observed that operators
often prefer to not switch autonomy modes even under poor performance [Baker and1Henceforth, collectively referred to as human-automation interaction or HAI.2More information about the differences between the two fields is explained in Chapters 2 and 3.
4
Yanco, 2004], thereby making the task of designing autonomous behaviors for robots
more challenging. Such a problem can be further compounded by the fact that robots
can operate under varying levels of autonomy [Bruemmer et al., 2002,Desai and Yanco,
2005] rather than the usual two levels typically observed in HAI. These differences
between HAI and HRI necessitate validating the relationship of existing factors that
influence trust and investigating other potential factors that can impact operator trust
and control allocation in HRI.
This research investigated characteristics that distinguish HRI from HAI and their
influence on operator trust and on an operator’s decision to allocate control of the
robot to the autonomous behaviors with the ultimate goal of better understanding the
different factors at play to be able to better design robots for HRI.
1.3 Approach
The work presented in this thesis has been conducted in two parts. The first part
involved creating a list of factors that could potentially influence an operator’s trust
of the robot. This step was accomplished by collecting information from existing HAI
literature on operator trust and literature on HRI that can highlight potentially im-
portant factors. Additional insight was gained by posing typical scenarios in a survey
to expert and novice users. Information combined from these sources provides a list of
potential factors. A second survey based on these factors was conducted to examine
the relative importance of those factors. A set of factors based on these surveys were
selected to be experimentally validated as part of the second part of the research.
Contrary to most experimental methodologies used to investigate trust in HAI
(e.g., [Muir, 1989, Lee and Moray, 1994]) and HRI (e.g., [Freedy et al., 2007]), this
5

research used a real robot that was remotely operated by participants. Unlike most
prior experiments conducted [Dzindolet et al., 2003, Riley, 1996, Muir, 1989], where
only one factor was examined at a time, we used multiple factors to closely replicate
real world systems. For example, Bliss and Acton conducted a series of experiments,
each with a different level of reliability [Bliss and Acton, 2003]. Such experiments pro-
vide useful insight on how reliability influences trust; however, they do not represent
real world systems where there can be multiple factors at play simultaneously. Hence,
for this research, the experiments had varying reliability levels under which the different
factors were examined. Such a methodology better resembles real world systems where
reliability is not always constant; hence the data should help to provide a better un-
derstanding of operator trust and control allocation. Once the influence of prominent
factors was examined, a model of human interaction with an autonomous remote robot
for teleoperation (HARRT) was developed based on the data collected.
1.4 Thesis Statement and Research Goal
The primary goal of this thesis was to create a better understanding of the different
factors that impact operator trust and control allocation while interacting with an au-
tonomous remote robot. We also wanted to investigate how certain attributes central to
remote robot teleoperation (e.g., situation awareness, workload, task difficulty) impact
operator behavior. By observing the variations in the different factors and how they
affect operator trust and control allocation strategy, a model of operator interaction
specifically for teleoperation of an autonomous remote robot has been constructed and
is used to create a set of guidelines that can improve the overall system performance.
6

1.5 Contributions
The contributions of this thesis are as follows:
• A methodology for measuring real-time trust that can be utilized in other exper-
iments by researchers.
• The area under the trust curve (AUTC) metric that allows for quantification and
comparison of real-time trust.
• A metric to measure an operator’s control allocation strategy relative to the ideal
strategy.
• The importance of timing of periods of reliability drops on operator interaction.
• The consistency in operator behavior over long term interaction.
• The impact of familiarity with robots.
• The impact of different factors (dynamic reliability, situation awareness, reduced
task difficulty, and feedback) on trust and control allocation.
• Design guidelines to improve human interaction with remote autonomous robots.
• The human interaction with remote robots for teleoperation (HARRT) model.
1.6 Organization
The thesis is organized as follows. Chapter 2 details existing research relevant to trust
and control allocation in human-automation interaction and human-robot interaction.
Chapter 3 presents results from the first survey that investigate different factors that
7

might be relevant to expert and novice participants. Based on this list of factors, Chap-
ter 4 examines how participants rank them. Based on the results of these surveys, the
experimental methodology is finalized and presented in Chapter 5. Chapter 6 presents
the results of the baseline experiment. These results are then compared with the results
from the low situation awareness experiment presented in Chapter 7. Based on the data
collected from these two experiments, the need to modify the experimental methodol-
ogy to measure real-time trust was observed. Hence, Chapter 8 presents details about
the new experimental methodology and the new baseline study conducted with that
methodology. The results of that new baseline study are then compared with the data
from studies examining the impact of providing feedback (Chapter 9), reducing task dif-
ficulty (Chapter 10), and long term interaction (Chapter 11). Chapter 12 presents the
combined results from all the experiments to show trends that are observed across all of
the experiments and the differences between the experiments. Finally, Chapter 13 looks
at the relationship between the different factors that influence operator behavior and
performance and describes the HARRT model. Chapter 14 merges the effects observed
in the different experiments with the HARRT model and provides a set of guidelines
that can help improve human interaction with robots and overall performance.
8

Chapter 2
Background
The past couple of decades have seen an increase in the number of robots and the trend
is still continuing. According to a survey, 2.2 million domestic service robots were sold
in 2010 and the number is expected to rise to 14.4 million for 2011 to 2014 [IFR, 2011].
Not only are the number of robots being used increasing, but also the domains that use
robots. For example, autonomous cars or self-driving cars have been successfully tested
on US roads and have driven over 300,000 miles autonomously [Google Cars, 2011a,
Dellaert and Thorpe, 1998]. Telepresence robots in the medical industry is another
example of a new application domain for robots [Michaud et al., 2007,Tsui et al., 2011b].
There is also a push to introduce or add additional autonomous capabilities for these
robots. For example, the Foster-Miller TALON robots used in the military are now
capable of navigating to a specified destination using GPS and the unmanned aerial
vehicles (UAVs) deployed by the military are also becoming more autonomous [Lin,
2008].
Utilizing autonomous capabilities can provide different benefits such as reduced
time, workload, and cost. However, existing research in the field in plant automation,
9

industrial automation, aviation automation, etc., highlights the need to exercise caution
while designing autonomous robots. Research in HAI shows that an operator’s trust
of the autonomous system is crucial to its use, disuse, or abuse [Parasuraman and
Riley, 1997]. This chapter discusses research in HAI that is relevant to HRI and also
briefly highlights some of the differences between HAI and HRI that necessitate further
investigation of trust in HRI.
There can be different motivations to add autonomous capabilities; however, the
overall goal is to achieve improved efficiency by reducing time, reducing financial costs,
lowering risk, etc. For example, one of the goals of the autonomous car is to reduce the
potential of an accident [Google Cars, 2011b]. A similar set of reasons was a motivating
factor to add autonomous capabilities to plants, planes, industrial manufacturing, etc.
However, the end results of adding autonomous capabilities was not always as expected.
There have been several incidents in HAI that have resulted from an inappropriate use
of automation [Sarter et al., 1997]. Apart from such incidents, research in HAI also
shows that adding autonomous capabilities does not always provide an increase in
efficiency. The problem stems from the fact that, when systems or subsystems become
autonomous, the operators that were formerly responsible for manually controlling those
systems get relegated to the position of supervisors. Hence, such systems are often called
supervisory control systems.
In supervisory control systems, the operators perform the duty of monitoring and
typically only take over control when the autonomous system fails or encounters a
situation that it is not designed to handle. A supervisory role leads to two key problems:
loss of skill over time [Boehm-Davis et al., 1983] and the loss of vigilance over time in
a monitoring capacity [Endsley and Kiris, 1995,Parasuraman, 1986]. Due to these two
reasons, when operators are forced to take over manual control they might not be able
10

to successfully control the system. The following quote by a pilot training manager
helps to highlight the issue [Boehm-Davis et al., 1983]:
“Having been actively involved in all areas of this training, one disturbing side
effect of automation has appeared, i.e. a tendency to breed inactivity or compla-
cency.
For example, good conscientious First Officers (above average) with as little as 8-9
months on the highly sophisticated and automated L-1011s have displayed this
inactivity or complacency on reverting to the B-707 for initial command training.
This problem has caused us to review and increase our command training time for
such First Officers. In fact we have doubled the allotted en route training time.”
Apart from these issues, another significant issue of control allocation arises with
supervisory control systems. Control allocation is the strategy that an operator em-
ploys to transfer control of the system between different agents capable of controlling
the systems. In the simplest and the most often observed case, the agents involved
would be the autonomous control program and the operator. Control allocation is not
only crucial in achieving optimal performance but also in preventing accidents. There
have been several documented cases of accidents due to poor control allocation by the
operators [Sarter et al., 1997,Boehm-Davis et al., 1983]. Optimizing the performance
of a supervisory control system not only involves improving the performance of the au-
tonomy, but also ensuring appropriate control allocation. To ensure appropriate control
allocation, it is important to examine the process involved in control allocation.
Sheridan and Verplank were among the first researchers to mention trust as an
important factor for control allocation [Sheridan, 1978]. According to Sheridan and
Verplank, one of the duties of the operator was to maintain an appropriate trust of
11

Figure 2.1: The duty of appropriate trust as hypothesized by Sheridan and Verplank(from [Sheridan, 1978]).
the automated system (Figure 2.1). However, the first researcher to investigate the
importance of trust on control allocation was Muir [Muir, 1989]. According to Muir,
control allocation was directly proportional to trust: i.e., the more trust the operator
had on a system, the more likely he/she was to rely on it and vice versa. If the operator’s
trust of the automated system is not well calibrated then it can lead to abuse (over-
reliance) or disuse (under-reliance) on automation. Since this model of trust was first
proposed, significant research has been done that indicates the presence of other factors
that influence control allocation either directly or indirectly via the operator’s trust of
the automated system. Some of the factors that are known to influence trust or have
been hypothesized to influence trust are explained in brief below and are also shown in
12
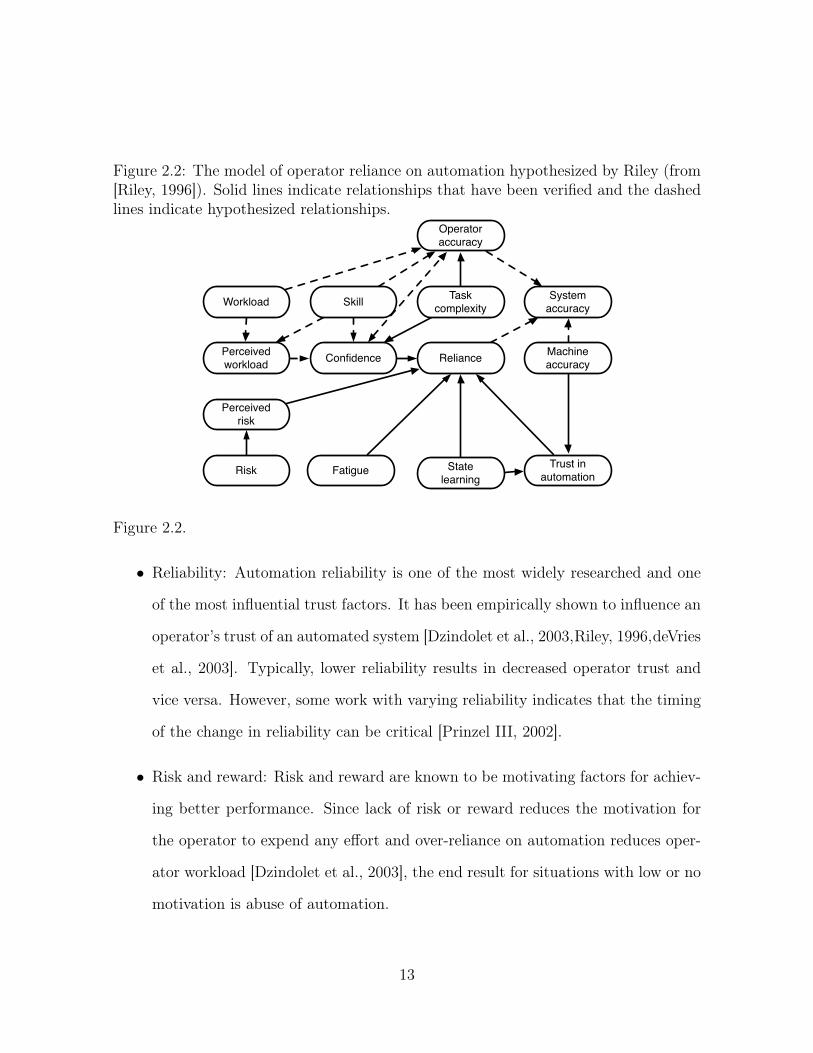
Figure 2.2: The model of operator reliance on automation hypothesized by Riley (from[Riley, 1996]). Solid lines indicate relationships that have been verified and the dashedlines indicate hypothesized relationships.
Operator accuracy
Workload Task complexity
System accuracy
Machine accuracy
Trust in automation
State learning
Risk
Perceived risk
Fatigue
RelianceConfidence
Skill
Perceived workload
Figure 2.2.
• Reliability: Automation reliability is one of the most widely researched and one
of the most influential trust factors. It has been empirically shown to influence an
operator’s trust of an automated system [Dzindolet et al., 2003,Riley, 1996,deVries
et al., 2003]. Typically, lower reliability results in decreased operator trust and
vice versa. However, some work with varying reliability indicates that the timing
of the change in reliability can be critical [Prinzel III, 2002].
• Risk and reward: Risk and reward are known to be motivating factors for achiev-
ing better performance. Since lack of risk or reward reduces the motivation for
the operator to expend any effort and over-reliance on automation reduces oper-
ator workload [Dzindolet et al., 2003], the end result for situations with low or no
motivation is abuse of automation.
13

Figure 2.3: The model of trust created by Lee and Moray (from [Lee and Moray, 1991]).
• Self-confidence: Lee and Moray found that control allocation would not always
follow the change in trust [Moray and Inagaki, 1999]. Upon further investigation,
they found that control allocation is dependent on the difference between the
operator’s trust of the system and their own self-confidence to control the system
under manual control. Based on further investigation, they created the model
shown in Figure 2.3.
• Positivity bias: The concept of positivity bias in HAI research was first proposed
by Dzindolet et al. [2003].They borrowed from the social psychology literature,
which points to a tendency of people to initially trust other people in the absence
of information. Dzindolet et al. showed the existence of positivity bias in HAI
through their experiments. The theory of positivity bias in the context of control
allocation implies that novice operators would initially tend to trust automation.
• Inertia: Researchers observed that when trust or self-confidence change, it is not
immediately followed by a corresponding change in control allocation [Moray and
Inagaki, 1999]. This delay in changing can be referred to as inertia. Such inertia in
autonomous systems can be potentially dangerous, even when the operator’s trust
is well calibrated. Hence, this is an important factor that warrants investigation
14
to help design systems with as little inertia as possible.
• Experience: In an experiment conducted with commercial pilots and undergradu-
ate students, Riley found that the control allocation strategy of both populations
was almost similar with one exception [Riley, 1996]: pilots relied on automation
more than the students did. He hypothesized that the pilots’ experience with
autopilot systems might have resulted in a higher degree of automation usage.
Similar results were found in this thesis when participants familiar with robots
relied more on automation than those participants not familiar with robots (Chap-
ter 11).
• Lag: Riley hypothesized that lag would be a potential factor that could influence
control allocation [Riley, 1996]. If there is a significant amount of lag between the
operator providing an input to the system and the system providing feedback to
that effect, the cognitive work required to control the system increases. This in-
creased cognitive load can potentially cause the operator to rely on the automated
system more.
2.1 Trust Models
In the process of investigating factors that might influence operator’s trust and control
allocation strategy, researchers have modeled operator trust on automated systems
(e.g., [Farrell and Lewandowsky, 2000,Muir, 1987,Lee and Moray, 1992b,Cohen et al.,
1998,Riley, 1996,Moray et al., 2000]). Over a period of two decades different types of
model have been created. Moray and Inagaki classified trust models into five categories
and explain the pros and cons of the different types of models in brief: regression
15

models, time series models, qualitative models, argument based probabilistic models,
and neural net models [Moray and Inagaki, 1999].
Regression models help identify independent variables that influence the dependent
variable (in most cases trust). These models not only identify the independent variables
but also provide information about the relationship (directly proportional or inversely
proportional) between each of the independent variables and the dependent variable and
the relative impact of that independent variable with respect to that of other variables.
The model presented in Section 6.1.7 is an example of a regression model. These
models, however, cannot model the dynamic variances in the development of trust and
hence must be used only when appropriate (e.g., simply identifying factors that impact
operator trust). Regression models can be used to identify factors that impact trust but
do not significantly vary during interaction with an automated system, and, based on
this information, appropriate steps can be taken to optimize overall performance. This
information can potentially be provided to the automated system to allow it to better
adapt to each operator. Regression models have been utilized by other researchers [Lee,
1992,Lee and Moray, 1992b,Muir, 1989].
Time series models can be used to model the dynamic relationship between trust
and the independent variables. However, doing so requires prior knowledge of the
factors that impact operator trust. Lee and Moray [1992b] used a regression model
to initially identify factors and then used a time series model (Autoregressive moving
average model ARMAV) to investigate the development of operator trust. The time
series trust model by Lee and Moray is shown in Figure 2.3. Through that model, Lee
and Moray found that the control allocation depends on prior use of the automated
system and individual biases, along with trust and self-confidence. Using a time series
model requires a large enough data set that can be discretized into individual events.
16

For example, in the experiment conducted by Lee and Moray, each participant operated
the system for a total of four hours, which included twenty eight individual trials (each
six minutes long). Qualitative data was collected at the end of each run which might
have had had a faulty system throughout the run. Unlike most other types of models,
time series model can be used online to predict future trust and control allocation and
perhaps initiate corrective action if needed. However, to our knowledge no such models
exist.
In qualitative models, the researchers establish relationships between different fac-
tors based on quantitative data, qualitative data, and their own observations. As
Moray and Inagaki [1999] point out, such models can provide valuable insight into how
trust, control allocation, and other factors interact. A model of trust partly based on
the human-human model of trust developed by Muir [1989] and the model of human-
automation interaction by Riley [1994] are two well established qualitative models.
Given the heuristic nature of these models they cannot be used to make precise predic-
tions about trust and control allocation; however, they can and often have been used to
create a set of guidelines or recommendations for automation designers and operators
(e.g., [Muir, 1987] and [Chen, 2009]).
Farrell and Lewandowsky [2000] trained a neural net to model operator’s control
allocation strategy and be able to predict future actions by the operator. The model
based on connectionist principles was called CONAUT. Their model received digitized
information as sets of 10 bits for each of the three tasks. Using that model, the authors
predicted that operator complacency can be eliminated by cycling between automatic
and manual control. While such models can accurately model trust and control alloca-
tion strategies, they require large data sets. Due to the very nature of neural networks,
it is not feasible to extract any meaningful explanation about how the model works.
17

Based on existing research in HAI, it is prudent to visit the topic of control allo-
cation and trust in human-robot interaction (HRI). Understanding trust in HRI can
help in designing autonomous robots that foster well calibrated trust and help improve
performance.
2.2 Trust in HRI
HRI is a diverse field that spans from medical robots to military robots. While it would
be ideal to create a model of trust that generalizes to all of HRI, for this thesis it is
important to narrow the scope of the research because we hypothesize that the appli-
cation domain is a significant factor in the trust model. Various taxonomies have been
defined for HRI [Dudek et al., 1993,Yanco and Drury, 2004]. One such taxonomy for
robots defines the system type by their task [Yanco and Drury, 2004]. Another possi-
ble classification for robots is their operating environment: ground, aerial, and marine
robots. The scope of this research in this thesis is limited to remotely controlled un-
manned ground robots that are designed for non-social tasks. Unmanned ground robots
represent a significant number of robots being developed and hence the contributions
of this thesis should impact a significant number of application domains within HRI.
Several application domains within the realm of unmanned ground robots are classi-
fied as mobile robots (e.g., factory robots [Kiva Systems, 2011,CasePick Systems, 2011],
consumer robots [Roomba, 2011,Neato Robotics, 2011], and autonomous cars [Google
Cars, 2011a,Dellaert and Thorpe, 1998]). However, one of the more difficult domains
is urban search and rescue (USAR). USAR robots typically operate in highly unstruc-
tured environments [Burke et al., 2004b], involve a significant amount of risk (to the
robot, operating environment, and the victims), and are remotely operated. These fac-
18
tors that make operating USAR robots difficult also make USAR the ideal candidate
for examining different factors that influence trust in HRI.
Along with the models of operator reliance on automation [Riley, 1996], the models
of trust, the list of known factors, and the impact of these factors on operator trust have
been well researched in HAI (e.g., [Muir, 1989,Moray and Inagaki, 1999,Dzindolet et al.,
2001]). However, the automated systems used for research in HAI and in real world
applications differ from the typical autonomous robot systems in HRI and therefore
necessitate investigating trust models in HRI. Some of the key differences between
typical HAI systems and HRI, along with unique characteristics of HRI relevant to
operator trust, are explained in brief below:
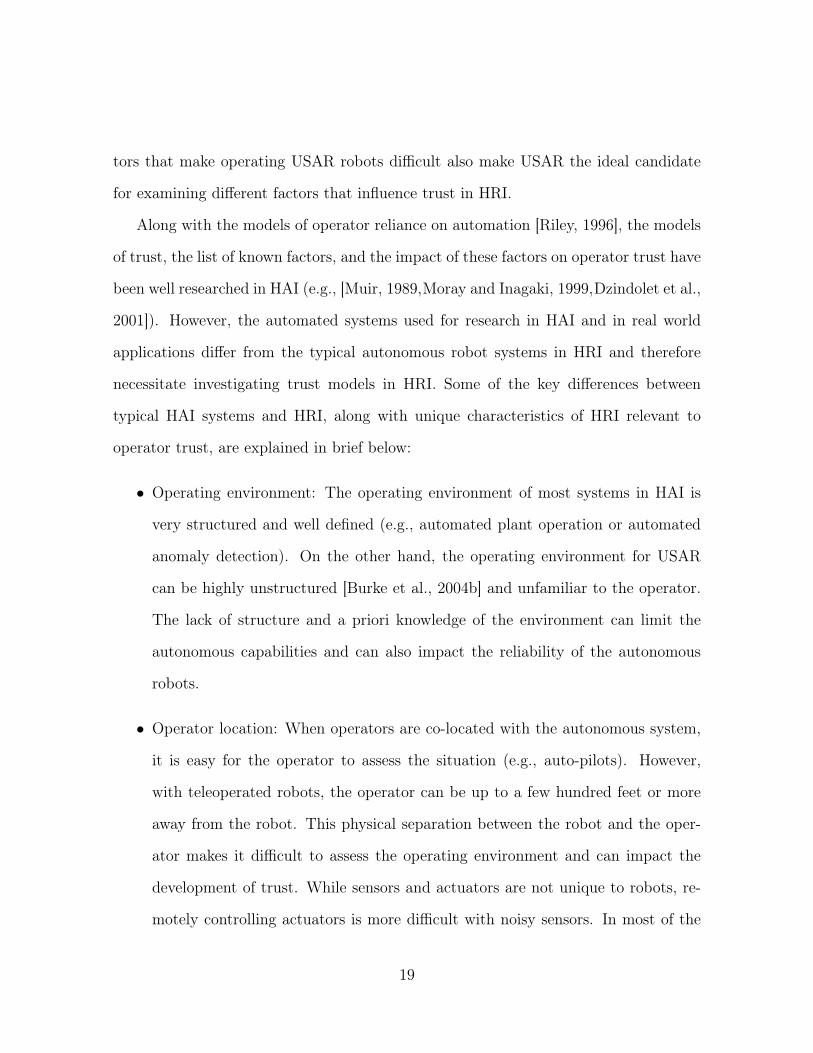
• Operating environment: The operating environment of most systems in HAI is
very structured and well defined (e.g., automated plant operation or automated
anomaly detection). On the other hand, the operating environment for USAR
can be highly unstructured [Burke et al., 2004b] and unfamiliar to the operator.
The lack of structure and a priori knowledge of the environment can limit the
autonomous capabilities and can also impact the reliability of the autonomous
robots.
• Operator location: When operators are co-located with the autonomous system,
it is easy for the operator to assess the situation (e.g., auto-pilots). However,
with teleoperated robots, the operator can be up to a few hundred feet or more
away from the robot. This physical separation between the robot and the oper-
ator makes it difficult to assess the operating environment and can impact the
development of trust. While sensors and actuators are not unique to robots, re-
motely controlling actuators is more difficult with noisy sensors. In most of the
19

experimental methodologies used in HAI, noisy sensors are not used and hence
their impact on automation or the operator are not investigated.
• Risk: The level of risk involved in HAI domains varies widely, ranging from
negligible (e.g., automated decision aids [Madhani et al., 2002, Dzindolet et al.,
2001]) to extremely high (e.g., autopilots, nuclear plants). However, the research
that does exist mostly involves low risk scenarios [Muir, 1989,Riley, 1996,Sanchez,
2006]. In contrast, domains like USAR carry a significant amount of risk that the
operator needs to understand and manage accordingly.
• Lag: Unlike HAI, where the input to the system and the feedback from system
is immediate, the delay in sending information to the robot and receiving in-
formation from the robot can vary based on the distance to the robot and the
communication channel. This delay, ranging from a few hundred milliseconds to
several minutes (e.g., in the case of the Mars rovers) can make teleoperating a
robot incredibly difficult, forcing the operator to rely more on the autonomous
behaviors of the robot.
• Levels of autonomy: Automated systems typically studied in HAI operate at one
of two levels of autonomy on the far ends of the spectrum (i.e., completely manual
control or fully automated). In HRI, robots can often be operated at varying levels
of autonomy (e.g., [Bruemmer et al., 2002,Desai and Yanco, 2005]).
• Reliability: Due to the nature of noisy and often failure prone sensors used in
robotics, the reliability of automated behaviors that rely on those sensors is of-
ten lower than typically high reliability levels used for HAI research [Dixon and
Wickens, 2006,Bliss and Acton, 2003,Dixon and Wickens, 2006].
20
• Cognitive overload: Teleoperating a remote robot can be a cognitively demanding
task. Such demands can impact other tasks that need to be carried out simulta-
neously. Cognitive load can also result in operators ceasing to switch autonomy
modes [Baker and Yanco, 2004].
Along with these differences, the experimental methodology used for most of HAI
research have either been abstract systems, micro-worlds, or low fidelity simulations
[Moray and Inagaki, 1999]. These setups cannot be used to investigate the subtle ef-
fects of different characteristics listed above. Hence, a real-world experimental scenario
will be used to examine trust in HRI. Chapter 5 explains the details of the experimental
methodology along with the different factors that will be examined and a motivation
for examining them.
21
Chapter 3
Initial Surveys
Before starting the robot experiments to identify the influences of different trust factors,
we decided to seek input from subject matter experts and novice users. To this end, we
conducted an online survey (S1:Expert) to investigate how the different factors influence
trust for expert users. We also wanted to investigate how expert users would initially
interact with an autonomous robot system in a domain they were familiar with.
As mentioned before, for unmanned ground robots, urban search and rescue (USAR)
is one of the more challenging domains because it is highly unstructured and often has
an unknown operating environment. These factors also make USAR very different from
traditional automation scenarios. Hence we selected USAR as the application domain
for this survey. We classified expert users as people trained in USAR with significant1
exposure to robots.
Human automation interaction research has shown that different groups of people
have different biases which cause them to interact differently with automation [Lee and
Moray, 1991, Singh et al., 1993,Riley, 1996]. To see if novice users would be different1Nine out of the ten participants reported having at least 10 hours of experience controlling robots.
22
from expert users in the USAR domain, we conducted a larger survey (S1:Novice) based
on the initial survey questions used for expert users (S1:Expert).
3.1 Participants
Expert users: We directly emailed potential participants the link to the survey and
received a total of 10 responses. All 10 of the participants satisfied our criteria for
expert users, with all of the participants reporting extensive knowledge of USAR and
use of robots. Nine participants reported having at least four years of USAR or other
types of emergency response experience, with an average of 10.7 years (SD=6.9). One
participant reported having no formal training, however, mentioned “experience working
with USAR personnel during robot response exercises.” Nine participants reported
having at least 10 hours of experience controlling robots, with five reporting more than
50 hours of experience. The average age of the participants was 42.6 years (SD=11.3).
Seven participants were male, and three were female. While ten participants is not
a large sample, there are very few people in the USAR community with experience
operating robots.
Novice users: For the survey with novice users we recruited participants through
Mechanical Turk [Turk, 2009]. We received 203 responses. The average age of the
participants was 29.9 years (SD=9.7); 46% of the participants were male and 54%
percent were female.
23

3.2 Questionnaire
The questionnaire for expert users was organized into five sections. In section 1, we
asked participants questions regarding demographics, USAR, and robot experience. In
section 2, we asked the participants to list all of the factors that they thought would
influence their trust of a robot. In sections 3 and 4, we described two scenarios, listed
below; these scenarios were written with the assistance of an expert in USAR and
robots. The full version of the questionnaires can be found in Appendix A.
Hasty search (H): An explosion has occurred in a manufacturing plant. Your task
is to search for people injured by the blast in an adjacent office building. It has
been reported that hazardous materials may be present in the now demolished
manufacturing plant. The office building appears to be structurally sound, but
engineers have decided that a robot should do the initial primary (or hasty) search
of the office. Although the robot can navigate the building safely, only you can
perform the task of identifying injured people using the cameras and sensors on
the robot. You will be controlling the robot from a safe location outside the office
building. You have 30 minutes to complete your search and report your findings
to your search team manager.
Thorough search (T): A major earthquake has occurred in a large metropolitan
area on a week day in the mid-morning. You have responded to a small grocery
store that has collapsed and there are reports of survivors inside. The building
is concrete construction and rescue personnel have identified an entry point large
enough to get a robot through. The structure is highly unstable and aftershocks
are occurring at irregular intervals. The safety manager and engineers have de-
termined that the robot is the only safe option for reconnaissance at this time.
24

Your task is to perform a very thorough search of the first floor of the store for
injured people. Although the robot can navigate the building safely, only you can
perform the task of identifying injured people using the cameras and sensors on
the robot. You will be controlling the robot from a safe location outside the store.
There are presently no time constraints.
The participants were asked to search for people using a robot that could be operated
in one of the following modes:
• Manual mode (m1)2: You will have complete control of the robot. The robot will
not prevent you from driving into objects.
• Safe mode (m2): You will be able to drive the robot wherever you want, and the
control software (automation) will safely stop before hitting objects.
• Shared mode (m3): You will be able to drive the robot wherever you want, but
automation will share control and attempt to steer the robot away from objects
and not let the robot hit objects.
• Waypoint mode (m4): You can set waypoints, and the robot will follow those
without the need for further control from you.
• Goal mode (m5): You select an area that you would like the robot to search, and
it will automatically plan a route through the world and ensure that maximum
coverage is achieved.
After presenting each search scenario, the participants were asked to state the order in
which they would use the different autonomy levels. We hypothesized that the ordering2The superscripts indicate the level of autonomy. m1 represents the mode with the least amount
of autonomy and m5 represents the mode with the most.
25

of autonomy levels would reflect the participants’ initial biases. The two scenarios were
not counter-balanced since an ordering effect was not expected with expert users.
In Section 5, the participants were asked to rank the following factors based on
how influential they thought the factors would be to their trust of the robot: error
by automation (Er), risk involved in the operation (Rs), reward involved in the oper-
ation (Rw), system failure (Sf), interface used to control the robot (I), lag (L), and
stress/mood (S). Apart from lag and the interface to control the robot, the influence
of other factors on trust and control allocation has been extensively investigated in the
field of human automation interaction. We added interface (I) to control the robot and
lag (L) since they are crucial to successfully operating a robot and have usually not
been considered in human automation interaction research.
The survey administered to novice users was similar to the survey administered to
the expert users with one exception. It had an additional section with one question:
Generic task scenario: There exists a hypothetical task that can only be performed
through a robot. The robot can be operated in one of two modes: (1) Manual
mode, where you will have complete control over the robot, or (2) Automatic
mode, where the robot will operate itself.
Based only on this information, the participants were asked to select one of the two
modes. The Hasty search and Thorough search scenarios were counter-balanced for
novice users. The ordering of the two search scenarios and the Generic task section was
also counter-balanced, resulting in four versions of the survey. Two versions had the
Generic task section before the Hasty search and Thorough search scenarios and two
after.
26

Table 3.1: Autonomy modes ranked by expert and novice users in S1:Expert andS1:Novice respectively.
Hasty Search Thorough SearchExpert Novice Expert Novicemode mode mode mode
Autonomy modes rank rank rank rankManual mode m1 1 5 1 5
Safe mode m2 2 2 2 2Shared mode m3 1 3 1 3
Waypoint mode m4 3 4 4 4Goal mode m5 5 1 5 5
3.3 Results and Discussion
3.3.1 Preference for More Manual Control (Expert Users)
Table 3.1 shows the autonomous mode preferences for expert users in both search
scenarios. The Wilcoxon matched-pairs signed-ranks test was used to determine which
autonomy mode rankings were significantly different from each other. The results are
shown in Table 3.2. For both search scenarios, expert users indicated that they would
prefer goal (m5) mode last, only after using manual (m1), safe (m2), and shared (m3)
modes (p<0.05 for all; ZHasty = 25.0, 27.5, and 25.5; ZThorough = 23.5, 27.5, and 25.5
respectively).
The result indicates that expert users exhibit an initial distrust towards higher
levels of automation and would opt for manual control. Such an initial bias against
automation use can lead the operators to not fully explore the autonomous system’s
capabilities and limitations and can result in incorrect calibration of their trust of the
robots, potentially resulting in disuse of the autonomous features of the robots. A
similar bias was also observed in a study involving expert users controlling robots for
a simulated USAR task [Micire, 2010]. Six expert users spent more time controlling
27

Table 3.2: Autonomy mode ranks for hasty search (H) and thorough search (T) rankedby expert and novice users. Cells with an asterisk indicate the result was statisticallysignificant (p <0.05 using the Wilcoxon matched-pairs signed-ranks test). The ‘>’ signindicates the that autonomy mode to the left of the sign was preferred more than theautonomy mode to the right of the sign.
Safe Shared Waypoint GoalExpert Novice Expert Novice Expert Novice Expert Novice
Manual (H) m1> m2 m2 > m1* m1 = m3 m3 > m1 m1 > m4 m4 > m1 m1 > m5* m5 > m1
Manual (T) m1 > m2 m2 > m1* m1 = m3 m3 > m1 m1 > m4 m4 > m1* m1 > m5* m1 = m5
Safe (H) m3 > m2 m2 > m3* m2 > m4 m2 > m4* m2 > m5* m5 > m2*Safe (T) m3 > m2 m2 > m3* m2 > m4 m2 > m4* m2 > m5* m2 > m5*
Shared (H) m3 > m4 m3 > m4* m3 > m5* m5 > m3
Shared (T) m3 > m4 m3 > m4* m3 > m5* m3 > m5*Waypoint (H) m4 > m5* m5 > m4*Waypoint (T) m4 > m5 m4 > m5
the robot in manual mode (x̄=71.5%, SD=32.8) than safe mode (x̄=20.5%, SD=31.4,
t(11)=-2.92, p=0.014) or shared mode (x̄=7.97%, SD=21.16, t(11)=-4.85, p<0.0005;
using a two tailed paired t-test).
3.3.2 Preference for Autonomy Modes (Novice Users)
The data in Table 3.1 shows that novice users preferred to use safe (m2) mode before
manual (m1), shared (m3), and waypoint (m4) modes for both search scenarios (p<0.05
for all; ZHasty = -4144.0, 2288.0, and 4656.5; ZThorough = -4601.5, 3344.0, and 5740.5
respectively). They also preferred shared (m3) mode over waypoint (m4) mode for both
scenarios (p<0.05 for both scenarios; ZHasty = 3485.5; ZThorough = 4054.0). This data
shows that novice users exhibited a bias towards the lower autonomy levels; however,
unlike expert users, novice users preferred manual (m1) mode the least for both search
scenarios. Such subtle differences in biases and their influence on control allocation have
not been investigated by the human automation interaction field, in large part due to
the fact that the systems used only operate in one of two modes (fully autonomous or
fully manual). The data also validates the existence of differences in bias and control
28
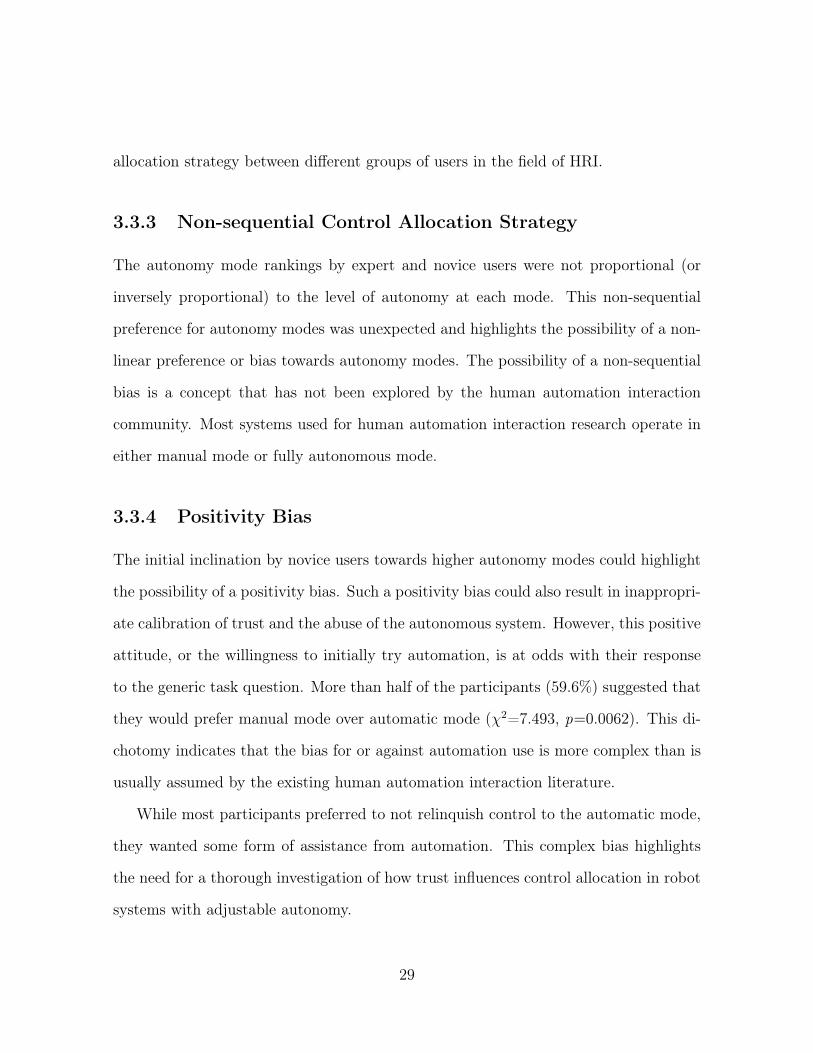
allocation strategy between different groups of users in the field of HRI.
3.3.3 Non-sequential Control Allocation Strategy
The autonomy mode rankings by expert and novice users were not proportional (or
inversely proportional) to the level of autonomy at each mode. This non-sequential
preference for autonomy modes was unexpected and highlights the possibility of a non-
linear preference or bias towards autonomy modes. The possibility of a non-sequential
bias is a concept that has not been explored by the human automation interaction
community. Most systems used for human automation interaction research operate in
either manual mode or fully autonomous mode.
3.3.4 Positivity Bias
The initial inclination by novice users towards higher autonomy modes could highlight
the possibility of a positivity bias. Such a positivity bias could also result in inappropri-
ate calibration of trust and the abuse of the autonomous system. However, this positive
attitude, or the willingness to initially try automation, is at odds with their response
to the generic task question. More than half of the participants (59.6%) suggested that
they would prefer manual mode over automatic mode (�2=7.493, p=0.0062). This di-
chotomy indicates that the bias for or against automation use is more complex than is
usually assumed by the existing human automation interaction literature.
While most participants preferred to not relinquish control to the automatic mode,
they wanted some form of assistance from automation. This complex bias highlights
the need for a thorough investigation of how trust influences control allocation in robot
systems with adjustable autonomy.
29
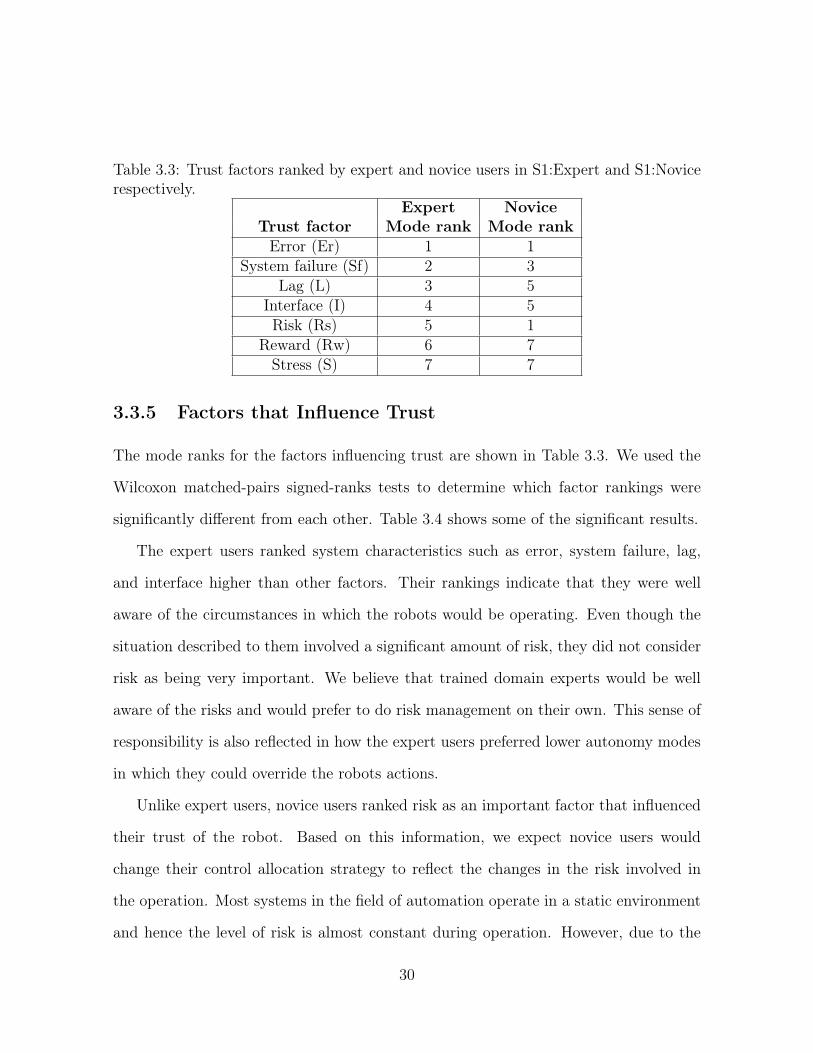
Table 3.3: Trust factors ranked by expert and novice users in S1:Expert and S1:Novicerespectively.
Expert NoviceTrust factor Mode rank Mode rank
Error (Er) 1 1System failure (Sf) 2 3
Lag (L) 3 5Interface (I) 4 5Risk (Rs) 5 1
Reward (Rw) 6 7Stress (S) 7 7
3.3.5 Factors that Influence Trust
The mode ranks for the factors influencing trust are shown in Table 3.3. We used the
Wilcoxon matched-pairs signed-ranks tests to determine which factor rankings were
significantly different from each other. Table 3.4 shows some of the significant results.
The expert users ranked system characteristics such as error, system failure, lag,
and interface higher than other factors. Their rankings indicate that they were well
aware of the circumstances in which the robots would be operating. Even though the
situation described to them involved a significant amount of risk, they did not consider
risk as being very important. We believe that trained domain experts would be well
aware of the risks and would prefer to do risk management on their own. This sense of
responsibility is also reflected in how the expert users preferred lower autonomy modes
in which they could override the robots actions.
Unlike expert users, novice users ranked risk as an important factor that influenced
their trust of the robot. Based on this information, we expect novice users would
change their control allocation strategy to reflect the changes in the risk involved in
the operation. Most systems in the field of automation operate in a static environment
and hence the level of risk is almost constant during operation. However, due to the
30

Tabl
e3.
4:Fa
ctor
rank
sfor
expe
rt(E
)and
novi
ce(N
)use
rs.
Cel
lsw
ithan
aste
risk
indi
cate
the
resu
ltw
asst
atist
ical
lysig
nific
ant(
p<
0.05
usin
gth
eW
ilcox
onm
atch
ed-p
airs
signe
d-ra
nks
test
).T
he‘>
’sig
nin
dica
tes
the
that
trus
tfac
tor
toth
ele
ftof
the
sign
was
rank
edto
bem
ore
impo
rtan
tth
atth
etr
ust
fact
orto
the
right
ofth
esig
n.R
isk
Rew
ards
Syst
emfa
ilure
Inte
rfac
eLag
Stre
ss/M
ood
Err
or(E
)er
ror
>ri
sk⇤
erro
r>
rew
ard⇤
erro
r>
sys.
failu
reer
ror
<in
terf
ace
erro
r>
lag
erro
r>
stre
ss⇤
Err
or(N
)er
ror
=ri
sk⇤
erro
r>
rew
ard⇤
erro
r>
sys.
failu
re⇤
erro
r>
inte
rfac
e⇤er
ror
>la
g⇤er
ror
>st
ress
⇤
Ris
k(E
)ri
sk>
rew
ard
sys.
failu
re>
risk
inte
rfac
e>
risk
lag
>ri
skri
sk>
stre
ssR
isk
(N)
risk
>re
war
d⇤ri
sk>
sys.
failu
re⇤
risk
>in
terf
ace⇤
risk
>la
g⇤ri
sk>
stre
ss⇤
Rew
ard
(E)
sys.
failu
re>
rew
ard⇤
inte
rfac
e>
rew
ard
lag
>re
war
d⇤re
war
d>
stre
ssR
ewar
d(N
)sy
s.fa
ilure
>re
war
d⇤in
terf
ace
>re
war
dla
g>
rew
ard⇤
rew
ard
=st
ress
⇤
Sys.
failu
re(E
)sy
s.fa
ilure
>in
terf
ace
sys.
failu
re>
lag
sys.
failu
re>
stre
ssSy
s.fa
ilure
(N)
sys.
failu
re>
inte
rfac
e⇤sy
s.fa
ilure
>la
g⇤sy
s.fa
ilure
>st
ress
⇤
Inte
rfac
e(E
)la
g>
inte
rfac
ein
terf
ace
>st
ress
⇤
Inte
rfac
e(N
)in
terf
ace
=la
g⇤in
terf
ace
>st
ress
⇤
Lag
(E)
lag
>st
ress
⇤
Lag
(N)
lag
>st
ress
⇤
31

dynamic operating environments in which the robots operate, the risk can dramatically
change thereby strongly influencing control allocation.
32

Chapter 4
Expanded List of Factors for Novice
Users
The results from the S1:Novice survey in Chapter 3 and the Wizard of OZ (WoZ) study
from [Desai et al., 2012b] suggest that perceived risk, like damage or costs associated
with hitting objects, is an important factor for novice users. Hence, the goal of this
survey was to determine which factors novice users would rate as the most important
in situations demonstrating a span of implied risk. We created the following six short
video clips:
• NP-H: http://www.youtube.com/watch?v=1bAubp3sejg
• NP-L: http://www.youtube.com/watch?v=m30HOo528Xo
• P-H: http://www.youtube.com/watch?v=ISLqFPOnOKc
• P-L: http://www.youtube.com/watch?v=ZQxOL4C8jh8
• S-L: http://www.youtube.com/watch?v=SRBz5epnjIA
33

• S-H: http://www.youtube.com/watch?v=D9iI1rdIPsU
The video clips were classified into three types: clips with people in them (P), clips
with no people in them (NP), and clips showing a simulated robot (S). To compare and
contrast the effect of performance, each type had two versions: low performance (L)
and high performance (H). In the low performance versions, the robot hit objects in the
environment and did not have a straight trajectory. In the high performance versions,
the robot had smooth movements and did not hit objects.
We also compiled a new list of sixteen factors that can influence trust in HRI by
including factors listed in the free responses from S1:Expert and S1:Novice surveys.
These factors are listed in Table 4.1.
4.1 Questionnaire
The survey had six sections and was administered using Amazon’s Mechanical Turk.
Section 1 had the same set of demographic questions as S1:Expert and S1:Novice. In
section 2 of the survey, we asked the participants to select the top five factors that
would influence their trust of a robot system from the list of sixteen. Each of the four
remaining sections had a link to a video showing the two performance levels (H, L) for
two of the three video types (P, NP, and S). After each video, the participants were
presented with Jian’s trust scales [Jian et al., 2000a], Muir’s trust scales [Muir, 1989],
and the same ranking question about the factors asked in section 2 of this survey. We
also asked them to rate the robot’s performance and how well they thought they would
perform, if operating the robot under the same circumstances. We counter-balanced the
three types of videos the participants watched (P, NP, or S), the sequence of videos, and
the initial performance levels (H, L) that they were shown, resulting in twelve different
34

versions of the survey. We recruited 40 participants per survey and received a total of
386 valid responses. A sample questionnaire can be found in Appendix B. To provide
a consistent nomenclature, this survey will be referred to as survey S2 in this thesis.
4.2 Results and Discussion
4.2.1 Top Five Factors Influencing Trust in HRI
Research done in the automation domain has shown reliability to be an important factor
(e.g., [Dixon and Wickens, 2006,Dzindolet et al., 2003,Moray et al., 2000,Wickens and
Xu, 2002]). We found similar results for the robotics domain, with more participants
ranking reliability in the top five than any other factor for all scenarios (P-H, P-L,
NP-H, NP-L, S-H, and S-L). Table 4.1 presents the top five factors selected by the
participants across the different scenarios. A Chi square test for all the factors in each
of the six pairings showed significant values p<0.0001 (the last row of Table 4.1 has the
results of the test).
Trust in the engineer that built the system, which was a factor identified in the two
prior surveys, was in the top five for all pairings. To our knowledge, this factor has not
been previously considered by researchers. We speculate that, from the participant’s
perspective, this selection indicates uncertainty or unfamiliarity with the technology.
It is also likely that people are biased by years of pop culture where a company rolls
out a dangerous robot due to lack of competence or nefarious reasons. While this issue
is relevant in robotics it is not a common meme in pop culture for regular automa-
tion. Hence, familiarity with the organization or team that designed the system could
potentially help better calibrate trust by extension or proxy.
The other three factors rated in the top five were predictability, system failures (e.g.,
35

Tabl
e4.
1:T
heto
pfiv
efa
ctor
sse
lect
edby
the
part
icip
ants
indi
ffere
ntse
ctio
nsof
Surv
eyS2
.T
henu
mbe
rsin
dica
teth
epe
rcen
tage
ofpa
rtic
ipan
tsth
atra
nked
the
fact
orto
bein
the
top
five.
Hig
hlig
hted
row
sw
ere
rank
edas
top
five
for
atle
ast
ofon
eth
esu
rvey
sect
ions
.T
hesu
pers
crip
tssh
owra
nks
base
don
the
num
ber
ofpa
rtic
ipan
tsse
lect
ing
the
fact
orfo
rth
atse
ctio
nof
the
surv
ey.
Prio
rPe
ople
No
peop
leSi
mul
atio
nFa
ctor
sH
LH
LH
LR
elia
bilit
y74
174
172
168
168
176
174
1
Pre
dict
abili
ty44
556
257
251
352
356
256
2
Trus
tin
engi
neer
sth
atde
signe
dth
ero
bot
522
523
503
532
532
453
483
Tech
nica
lcap
abili
ties
ofth
ero
bot
493
464
444
434
434
444
444
Syst
emfa
ilure
(e.g
.,fa
iling
sens
ors,
light
s,et
c.)
3938
4038
540
539
539
5
Risk
invo
lved
inth
eop
erat
ion
464
395
415
3435
3334
Err
orby
auto
mat
ion
2019
1819
1820
21R
ewar
din
volv
edin
the
oper
atio
n9
66
57
75
Inte
rfac
eus
edto
cont
rolt
hero
bot
3221
2332
2730
35La
g(d
elay
betw
een
send
ing
com
man
dsan
dth
ero
bot
resp
ondi
ngto
them
)22
2019
2326
2430
Stre
ss3
56
43
45
Trai
ning
2931
3031
2933
30Si
tuat
ion
awar
enes
s(kn
owin
gw
hati
shap
peni
ngar
ound
the
robo
t)23
2833
3031
3028
Past
expe
rienc
ew
ithth
ero
bot
2935
3332
3436
33Si
zeof
the
robo
t11
1314
1817
1110
Spee
dof
the
robo
t17
1615
1918
1521
p<0.
0001
,DO
F=
15,�
2=
635.
841
4.1
398.
542
5.6
435.
836
9.5
380.
7
36

Table 4.2: Performance ratings by participants in Survey S2 (1=poor, 7=excellent).The significant differences are presented in Table 4.4.
Performance scenario Robot Their expectedperformance
x̄ (SD) x̄ (SD)
People High 5.05 (1.86) 4.56 (1.77)Low 2.93 (1.89) 3.75(1.95)
No people High 5.47 (1.4) 4.73 (1.69)Low 2.46 (1.5) 3.72 (1.86)
Simulation High 5.72 (1.44) 5.31 (1.58)Low 4.15 (1.85) 4.55 (1.73)
failing sensors, lights, etc.), and technical capabilities. The selection of predictability
is consistent with automation research, where similarities between the mental models
of the system and the system behavior result in high trust. Since system failures
contribute to reliability and predictability, it is not surprising to find this factor also in
the top five. However, the issue of technical capabilities has not previously been found
in the automation literature; a contributing factor may be that the term “robots” covers
many different types while the systems studied in automation are narrowly defined. We
also speculate that pop culture might have influenced this factors, since pop culture
is replete with robots which fail at tasks they were not designed to do (e.g., [Cooper,
2012]).
4.2.2 Perceived Risk
Prior to seeing any videos, participants were asked to select the top five factors they
thought would influence their trust of robots most. We wanted to see if participants
would rate factors differently after being introduced to the scenarios. Table 4.1 shows
how the participants rated the factors initially and after viewing each scenarios. Before
viewing the videos, 46% of the participants selected risk to be in the top five factors.
37
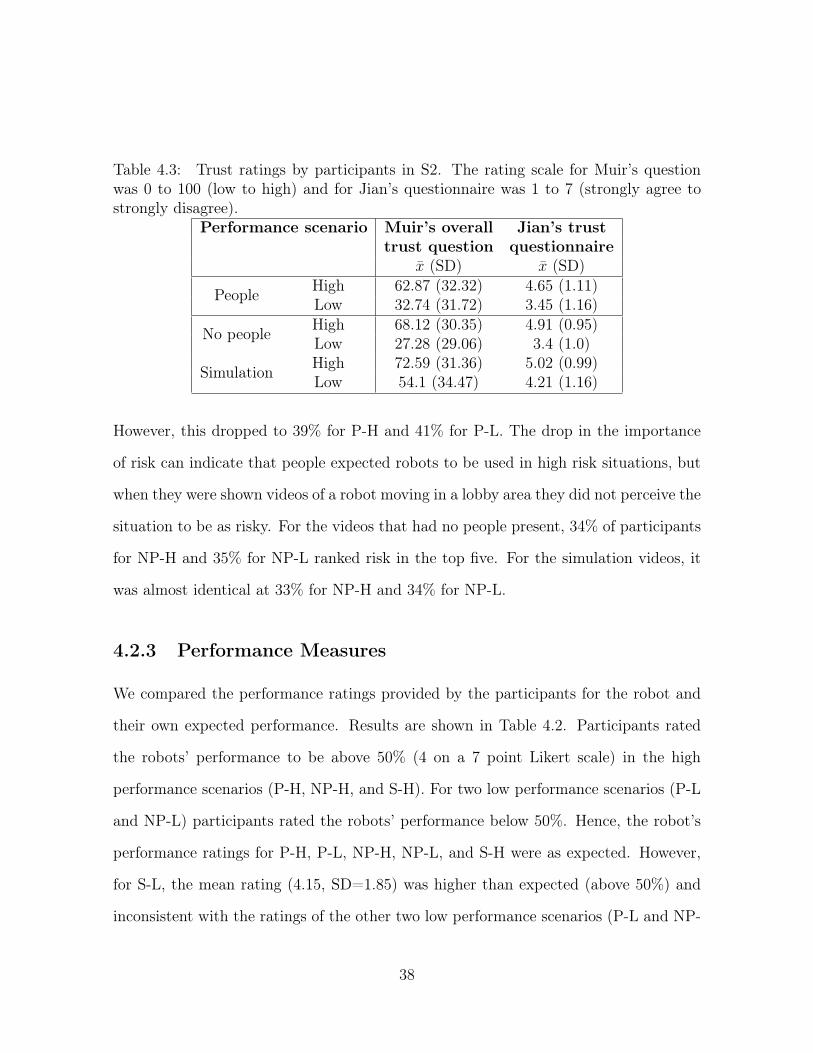
Table 4.3: Trust ratings by participants in S2. The rating scale for Muir’s questionwas 0 to 100 (low to high) and for Jian’s questionnaire was 1 to 7 (strongly agree tostrongly disagree).
Performance scenario Muir’s overall Jian’s trusttrust question questionnaire
x̄ (SD) x̄ (SD)
People High 62.87 (32.32) 4.65 (1.11)Low 32.74 (31.72) 3.45 (1.16)
No people High 68.12 (30.35) 4.91 (0.95)Low 27.28 (29.06) 3.4 (1.0)
Simulation High 72.59 (31.36) 5.02 (0.99)Low 54.1 (34.47) 4.21 (1.16)
However, this dropped to 39% for P-H and 41% for P-L. The drop in the importance
of risk can indicate that people expected robots to be used in high risk situations, but
when they were shown videos of a robot moving in a lobby area they did not perceive the
situation to be as risky. For the videos that had no people present, 34% of participants
for NP-H and 35% for NP-L ranked risk in the top five. For the simulation videos, it
was almost identical at 33% for NP-H and 34% for NP-L.
4.2.3 Performance Measures
We compared the performance ratings provided by the participants for the robot and
their own expected performance. Results are shown in Table 4.2. Participants rated
the robots’ performance to be above 50% (4 on a 7 point Likert scale) in the high
performance scenarios (P-H, NP-H, and S-H). For two low performance scenarios (P-L
and NP-L) participants rated the robots’ performance below 50%. Hence, the robot’s
performance ratings for P-H, P-L, NP-H, NP-L, and S-H were as expected. However,
for S-L, the mean rating (4.15, SD=1.85) was higher than expected (above 50%) and
inconsistent with the ratings of the other two low performance scenarios (P-L and NP-
38
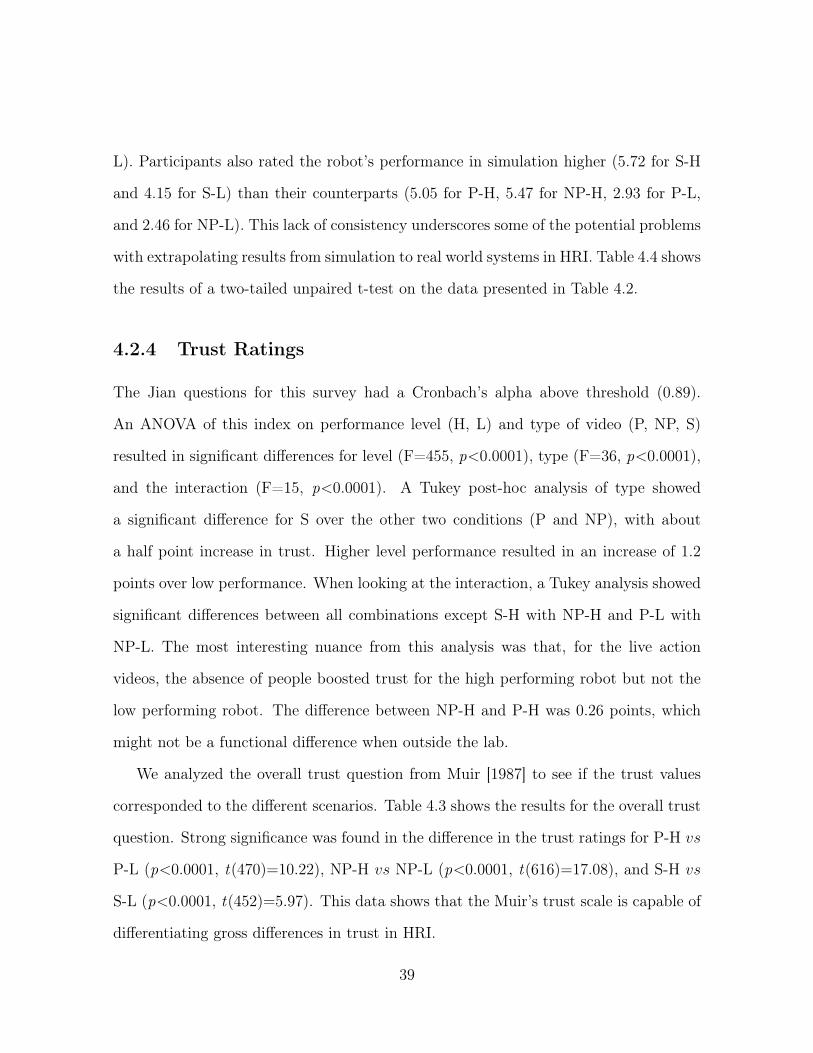
L). Participants also rated the robot’s performance in simulation higher (5.72 for S-H
and 4.15 for S-L) than their counterparts (5.05 for P-H, 5.47 for NP-H, 2.93 for P-L,
and 2.46 for NP-L). This lack of consistency underscores some of the potential problems
with extrapolating results from simulation to real world systems in HRI. Table 4.4 shows
the results of a two-tailed unpaired t-test on the data presented in Table 4.2.
4.2.4 Trust Ratings
The Jian questions for this survey had a Cronbach’s alpha above threshold (0.89).
An ANOVA of this index on performance level (H, L) and type of video (P, NP, S)
resulted in significant differences for level (F=455, p<0.0001), type (F=36, p<0.0001),
and the interaction (F=15, p<0.0001). A Tukey post-hoc analysis of type showed
a significant difference for S over the other two conditions (P and NP), with about
a half point increase in trust. Higher level performance resulted in an increase of 1.2
points over low performance. When looking at the interaction, a Tukey analysis showed
significant differences between all combinations except S-H with NP-H and P-L with
NP-L. The most interesting nuance from this analysis was that, for the live action
videos, the absence of people boosted trust for the high performing robot but not the
low performing robot. The difference between NP-H and P-H was 0.26 points, which
might not be a functional difference when outside the lab.
We analyzed the overall trust question from Muir [1987] to see if the trust values
corresponded to the different scenarios. Table 4.3 shows the results for the overall trust
question. Strong significance was found in the difference in the trust ratings for P-H vs
P-L (p<0.0001, t(470)=10.22), NP-H vs NP-L (p<0.0001, t(616)=17.08), and S-H vs
S-L (p<0.0001, t(452)=5.97). This data shows that the Muir’s trust scale is capable of
differentiating gross differences in trust in HRI.
39

Table 4.4: The results from the two tailed unpaired t-tests for the robot’s performanceratings from Table 4.2.
Scenario P-L NP-H NP-L S-H S-LP-H 0.0001 0.0035 n/a 0.0001 n/aP-L - n/a 0.0021 n/a 0.0001
NP-H - - 0.0001 0.0441 n/aNP-L - - - n/a 0.0001S-H - - - - 0.0001
We also found a significant difference in the performance rating for P-H vs NP-H,
and P-L vs NP-L (Table 4.4), indicating that the participants observed the differences
between the two scenarios. Since risk was rated as being important, we expected
the presence or absence of people in the two sets of scenarios would influence risk
and ultimately the trust. However, a strong significant difference in trust ratings was
not observed for P-H vs NP-H (p=0.0523, t(543)=1.94) and P-L vs NP-L (p=0.0372,
t(543)=2.08). The lack of distinction between the scenarios with people and without
people shows that the overall trust rating scale is not well suited to discerning subtle
changes in trust when the perceived risk is mild, demonstrating that other methods
are needed for HRI. Since this research was conducted, new trust measures specifically
geared for HRI have been created [Yagoda, 2011] that can be used in future research.
Together, both sets of surveys (S1 and S2) show how risk, automation performance,
and trust are intertwined in HRI. Expert robot operators surveyed on issues related
to the use of automation and factors that affect trust showed a bias towards manual
control and trust factors central to robot performance (e.g., errors, lag, etc). The
experts’ low interest in factors like risk, reward, and stress, combined with the manual
bias, suggest they internalized the importance of risk and viewed risk management as
their responsibility.
While expert users highlighted factors that align with automation performance and
40

had a bias towards manual control, novice users in the WoZ study [Desai et al., 2012b]
showed no change in trust as a result of automation performance level or manual vs.
automated mode. Likewise, there was no correlation between trust and interventions
during errors while the robot was automated. These findings suggest that a key element
was missing. Open ended survey comments regarding important trust factors included
items like safety and indirect representations of robot quality. These factors, taken
with the minimal risk of damage during the study, suggest that risk should have been a
more prominent characteristic in the experiment. This argument is reinforced by survey
findings from novices who completed the survey given to experts. The big difference
between experts and novices was that novices viewed risk as a top-tier factor. Unlike
expert users, novice users also showed a noticeable bias towards automation.
Survey S2 placed special attention on risk along with other factors that were sug-
gested by users from the previous surveys. Of the top five factors selected by the users,
some were expected based on prior research in automation: reliability, system failure,
and predictability. The rankings of trust in engineers and technical capabilities were
unexpected, but not surprising given the lack of details about the robot system and
years of robot pop culture. The influence of the different scenarios on risk and trust
was something not previously observed in the automation literature, but very relevant
to HRI.
Data from this survey also shows that while there are a handful of factors that are
very influential, the magnitude of their influence is dynamic. In most human automation
interaction (HAI) test platforms, factors like risk and situation awareness do not change
during the course of an experiment. The dynamic properties of the robot, the operating
environment, and their influence on trust factors, at the very least suggest that the trust
models from HAI must be revised and adapted for HRI.
41

One important nuance between the WoZ experiment [Desai et al., 2012b] and S2 is
situation awareness. The videos shown to the users in the survey provided an almost
complete perspective of the situation, something not easily available in the real world.
However, in the WoZ study, the participants were provided a video from the robot’s
perspective; we hypothesize that the reduction in situation awareness reduces the ability
to assess the risk of the current situation. While this reduced risk assessment ability does
not reduce the importance of risk, it highlights the importance of situation awareness.
Since the WoZ study involved remote robot operation, the participants might not have
had good situation awareness, which could have lowered their perception of risk.
From a high level, the apparently strong influence of risk, and how it is managed by
robot operators, is a key difference between trust in traditional automation and HRI.
While existing instruments are a good starting point, they need to be adapted and used
in conjunction with methods that incorporate factors relevant to HRI like risk, lag, and
interfaces.
42

Chapter 5
Experimental Methodology
From Chapter 2, it is clear that the experimental methodology is crucial in examin-
ing trust, especially for a domain like USAR. Unlike typical HAI experiments, USAR
has an unstructured and often unknown operating environment, making it particularly
challenging to teleoperate a robot. This section describes the methodology that will be
used for all the experiments conducted as part of this research (Chapter 6 and 7). The
motivations for decisions behind the different aspects of the scenario are also explained,
starting with the most important decision regarding the test platform1.
Moray and Inagaki [1999] are of the opinion that results obtained by using simulated
systems are less likely to be applicable to real systems and results obtained from mi-
croworld systems even less so. Table 5.1 lists four types of testbeds based on Moray and
Inagaki’s classification of experimental methodology used for examining trust. Moray
and Inagaki also classified the experimental platforms based on the type of task (Table
5.2). Using these two taxonomies we classified some of the existing research involving
operator trust (Table 5.3 and 5.4), and while it does not cover the entire literature, it1Portions of this chapter appear in [Desai et al., 2012a].
43

Type of system being investigated AbbreviationField studies of real or simulated systems such as aircraft or indus-trial plant. REAL
Simulators which provide high fidelity physical and dynamic copiesof real systems, such as those used in aviation and nuclear powerplant training.
SIM
Microworlds which resemble real systems and include closed loopcoupling of humans and automated control in real time, involvingsimulated physical causality, but are not in general simulations ofany real system.
MICROWORLD
Arbitrary lab tasks which may not have any control element, andwhose structure is arbitrary, designed simply to provide an exper-imental environment for making behavioral measurements. No re-alistic coupling or causality is involved.
ARBITRARY
Table 5.1: System classifications from [Moray and Inagaki, 1999].
Task description AbbreviationContinuous closed loop systems with slow dynamics CLSD
Continuous closed loop systems with fast dynamics CLFD
Continuous closed loop discrete systems CLDS
Open loop cognitive decision making aids OLCA
Table 5.2: Task classifications from [Moray and Inagaki, 1999].
highlights the fact that most of the focus has been on microworld systems and some on
arbitrary systems. Through these systems, researchers have obtained important results
and valuable insight into an operator’s trust of automated systems, but we hypothesize
that these results will not transfer well to the real robot domain. Since the correlation
between data obtained from simulated systems and real systems in unknown in HRI,
we decided to opt for a real world remotely teleoperated robot system to accurately
model trust in HRI and specifically for USAR. According to Moray and Inagaki’s [1999]
system and task classification our system would be a ‘REAL’ system with continuous
closed loop with fast dynamics ‘CLDF’.
44

Citation Task Systemtype type
A Connectionist Model of Complacency and Adaptive Recovery Under Au-tomation [Farrell and Lewandowsky, 2000] CLFD Microworld
A Model for Predicting Human Trust in Automation Systems [Khasawnehet al., 2003] OLCA Microworld
A Study of Real-time Human Decision-making using a Plant Simulator [Bain-bridge et al., 1968] CLSD Microworld
Adaptive automation, trust, and self-confidence in fault management of time-critical tasks. [Moray et al., 2000] CLSD Microworld
Assessment of operator trust in and utilization of automated decision-aids un-der different framing conditions [Bisantz and Seong, 2001] OLCA Microworld
Automation Failures on Tasks Easily Performed by Operators Undermine Trustin Automated Aids [Madhavan et al., 2006] OLCA Arbitrary
Automation reliability in unmanned aerial vehicle control a reliance compliancemodel of automation dependence in high workload [Dixon and Wickens, 2006] CLFD Microworld
Factors that affect trust and reliance on an automated aid [Sanchez, 2006] CLFD Microworld
Operator reliance on automation theory [Riley, 1996] OLCA Arbitrary
Operators’ trust in and use of automatic controllers in a supervisory processcontrol task [Muir, 1989] CLSD Microworld
The dynamics of trust: comparing humans to automation [Lewandowsky et al.,2000] CLSD Microworld
The role of trust in automation reliance [Dzindolet et al., 2003] OLCA Arbitrary
Trust control strategies and allocation of function in human-machine systems[Lee and Moray, 1992b] CLSD Microworld
Trust, self-confidence and supervisory control in a process control simulation[Lee and Moray, 1991] CLSD Microworld
Trust, self-confidence, and operators’ adaptation to automation [Lee andMoray, 1994] CLSD Microworld
Type of automation failure: the effects on trust and reliance in automation[Johnson et al., 2004] CLFD Microworld
The effects of errors on system trust, self-confidence, and the allocation ofcontrol in route planning [deVries et al., 2003] OLCA Microworld
Under reliance on the decision aid a difference in calibration and attributionbetween self and aid [van Dongen and van Maanen, 2006] OLCA Arbitrary
Performance consequences of automation induced complacency [Parasuramanet al., 1993] CLFD Microworld
Measurement of human trust in a hybrid inspection for varying error patterns[Madhani et al., 2002] OLCA Microworld
Not all trust is created equal dispositional and history based trust in humanautomation interactions [Merritt and Ilgen, 2008] OLCA Arbitrary
Table 5.3: Classification of experimental platforms based on the taxonomy adaptedfrom [Moray and Inagaki, 1999].
45

Real Simulation Mircoworld ArbitraryCLSDCLFD 5CLDS 7OLCA 4 5
Table 5.4: The count of experimental setups grouped by system and task classification.
Figure 5.1: The robot (ATRVJr) used for the experiments.
5.1 Robot
The robot used for all the experiments is an ATRVJr platform from iRobot (Figure
5.1). The ARTVJr has differential drive or tank steering and a wide array of sensors.
46

These sensors include a front facing SICK LMS-200 laser range finder that can scan 180
degrees, a rear facing Hokuyo URG-04LX laser range finder with a field of view of 240
degrees, a Directed Perception PTU-D46-17 pan-tilt unit with a Sony XC-999 camera
mounted on it, and a rear facing Canon VC-C4 camera mounted on the back of the
robot. The robot also has a 3.0 GHz Intel Core2Duo processor with 4GB of memory
and runs Ubuntu 8.04. The robot also has a 802.11n radio capable of operating on both
the 2.4GHz and 5.0GHz range. The client code to control the robot is written in C++
using Player [Gerkey et al., 2003] and compiled using GCC.
5.2 Test Course
Figure 5.2 shows the course created for these experiments. The course is approximately
60 feet long and has 5 obstacles (boxes) placed about 9 feet from each other. The width
of the course is 8 feet. The clearance on either side of the boxes is 3 feet, and the robot
is approximately 26 inches wide. Therefore the clearance on either side of the boxes
makes it non-trivial to drive. The course has moderate foot traffic.
The robot starts and ends each run at the same location. For each run, the par-
ticipants have to follow a preset path. Since we expected five runs, we designed five
different paths (also referred to as maps) based on the following criteria:
• The length of each map must be the same (⇠200 feet).
• The number of u-turns in a map must be the same (3 u-turns).
• The number of transitions from the left side of the course to the right and vice
versa must be the same (3 transitions).
Since the maps were similar in difficulty and length they were not counter-balanced.
47

Figure 5.2: The course used for the experiments.
Instead, the maps were selected based on a randomly generated sequence. A sample
map is shown in green in Figure 5.2.
5.2.1 Path Labels
Each box in the course had text labels to provide navigational information to the
participants. Text labels were placed on top of the boxes to indicate the path ahead.
Since the boxes were wide, similar labels were placed on both edges of the face as
shown in Figure 5.2, to make it easy for the participants to read the labels as they go
past the boxes. The labels indicated one of three directions ‘left’, ‘right’, or ‘uturn’.
These directions were padded with additional characters to prevent the participants
from recognizing the label without reading them.
Two sets of labels were necessary to prevent the participants from driving in an
infinite loop. Figure 5.2 shows the two types of labels that were used. The labels with
white background (referred to as white labels) were followed for the first half of the
entire length and then the labels with black background (referred to as black labels)
for the second half. The transition from following the white labels to black labels was
indicated to the participants via the UI. When the participants were supposed to follow
48
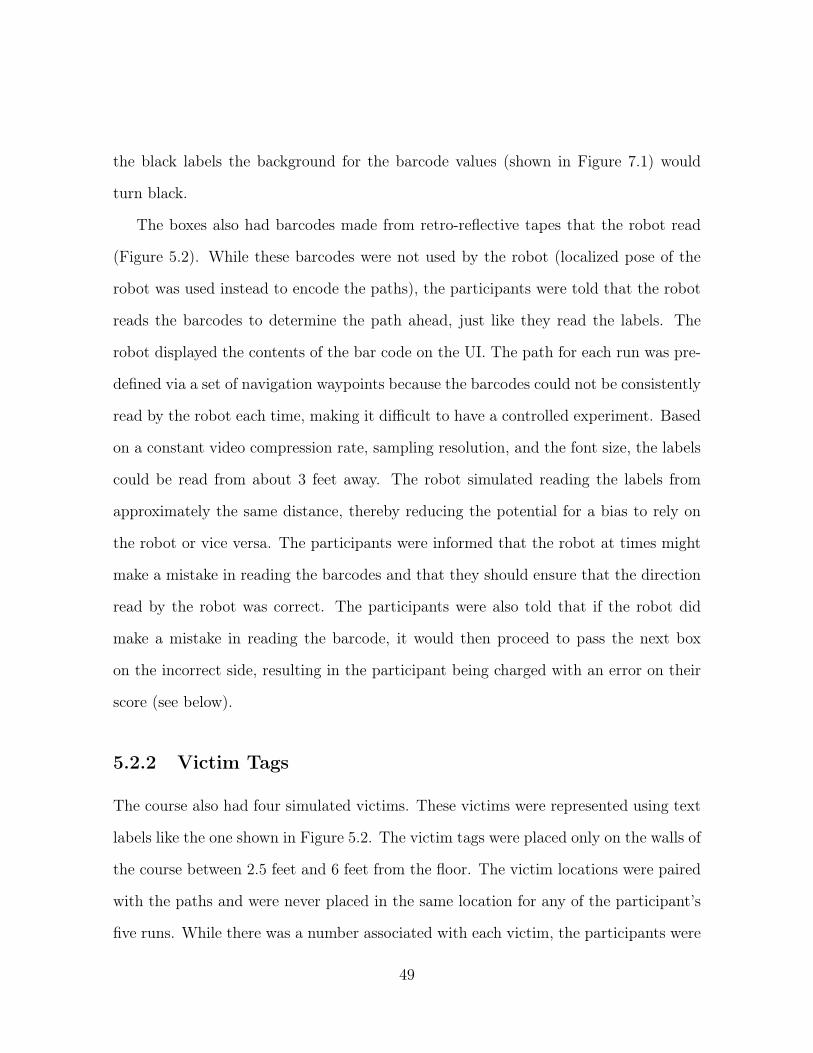
the black labels the background for the barcode values (shown in Figure 7.1) would
turn black.
The boxes also had barcodes made from retro-reflective tapes that the robot read
(Figure 5.2). While these barcodes were not used by the robot (localized pose of the
robot was used instead to encode the paths), the participants were told that the robot
reads the barcodes to determine the path ahead, just like they read the labels. The
robot displayed the contents of the bar code on the UI. The path for each run was pre-
defined via a set of navigation waypoints because the barcodes could not be consistently
read by the robot each time, making it difficult to have a controlled experiment. Based
on a constant video compression rate, sampling resolution, and the font size, the labels
could be read from about 3 feet away. The robot simulated reading the labels from
approximately the same distance, thereby reducing the potential for a bias to rely on
the robot or vice versa. The participants were informed that the robot at times might
make a mistake in reading the barcodes and that they should ensure that the direction
read by the robot was correct. The participants were also told that if the robot did
make a mistake in reading the barcode, it would then proceed to pass the next box
on the incorrect side, resulting in the participant being charged with an error on their
score (see below).
5.2.2 Victim Tags
The course also had four simulated victims. These victims were represented using text
labels like the one shown in Figure 5.2. The victim tags were placed only on the walls of
the course between 2.5 feet and 6 feet from the floor. The victim locations were paired
with the paths and were never placed in the same location for any of the participant’s
five runs. While there was a number associated with each victim, the participants were
49

told to ignore the number while reporting the victims. Whenever participants found a
new victim, they were told to inform the experimenter that they have found a victim.
They were explicitly instructed to only report victims not reported previously. The
experimenter noted down information about victims reported by the participants and
also kept track of unique victims identified.
5.3 Autonomy Modes
Almost all of the research in HAI has focused on two autonomy modes on the far
ends of the spectrum. In accordance with existing research we decided to provide the
participants with two autonomy modes. One of those autonomy modes was at the high
end of the autonomy spectrum. Rather than selecting the second autonomy mode to be
manual teleoperation mode we decided to opt for a similar autonomy mode where the
robot would assist the participants. The key reason was to always keep the participant
informed about the robot’s behavior, something that would not be possible with a
pure manual teleoperation mode. The participants can operate the robot in one of two
autonomy modes: robot assisted mode or fully autonomous mode. The participants
were free to select either mode and could switch between them as many times as they
wanted. They were also told that there were no benefits or penalties for selecting either
mode. When each run was started, no autonomy mode was selected by default, thereby
requiring the participants to make an explicit selection. The maximum speed at which
the robot moved was the same in both modes and was restricted to approximately 0.41
feet per second. These configurations ensured that the performance of both autonomy
modes was similar.
In the fully autonomous mode, the robot ignored the participant’s input and fol-
50
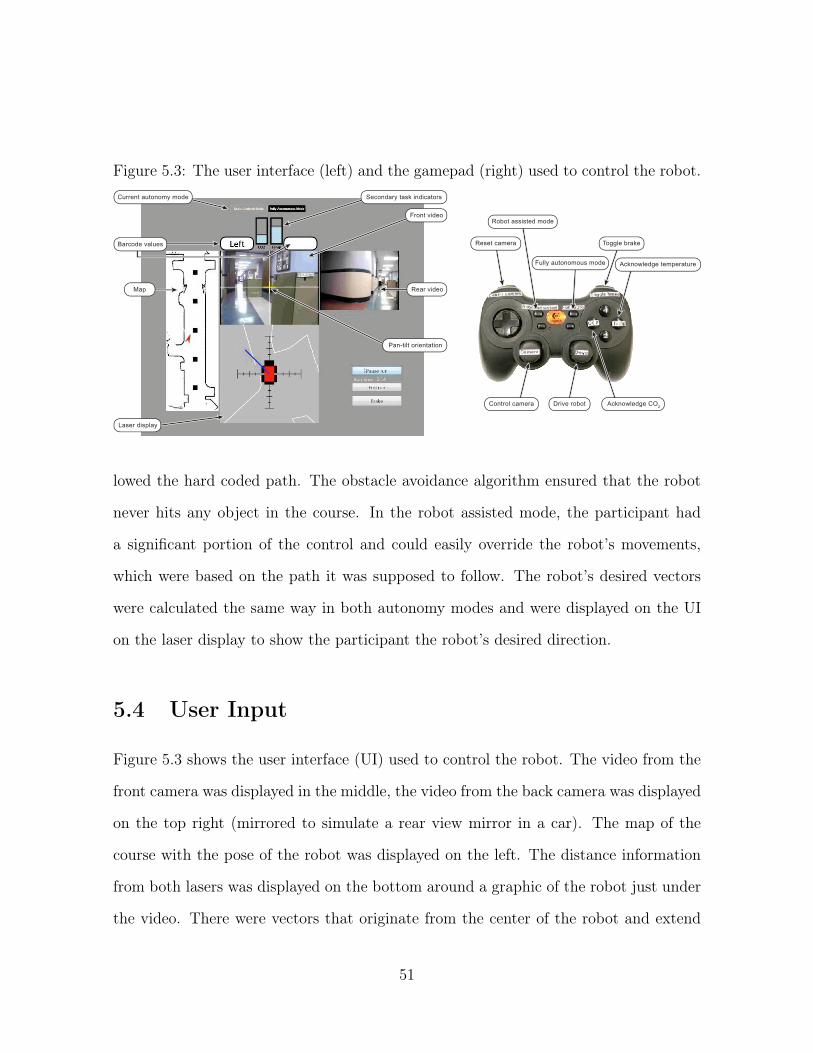
Figure 5.3: The user interface (left) and the gamepad (right) used to control the robot.
lowed the hard coded path. The obstacle avoidance algorithm ensured that the robot
never hits any object in the course. In the robot assisted mode, the participant had
a significant portion of the control and could easily override the robot’s movements,
which were based on the path it was supposed to follow. The robot’s desired vectors
were calculated the same way in both autonomy modes and were displayed on the UI
on the laser display to show the participant the robot’s desired direction.
5.4 User Input
Figure 5.3 shows the user interface (UI) used to control the robot. The video from the
front camera was displayed in the middle, the video from the back camera was displayed
on the top right (mirrored to simulate a rear view mirror in a car). The map of the
course with the pose of the robot was displayed on the left. The distance information
from both lasers was displayed on the bottom around a graphic of the robot just under
the video. There were vectors that originate from the center of the robot and extend
51
out. These vectors indicated the current magnitude and orientation of the participant’s
input via the gamepad and the robot’s desired velocity. The participant’s vector was
displayed in light gray and the robot’s vector was displayed in blue.
The participants provided input using the gamepad shown in Figure 5.3. Partici-
pants could drive the robot, control the pan tilt unit for the front camera, select the
autonomy modes, turn the brakes on or off, recenter the camera, and acknowledge the
secondary tasks.
5.5 Task
The participants were asked to drive the robot as quickly as they could along a specified
path, while searching for victims, not hitting objects in the course, and responding to
the secondary tasks. To create additional workload, simulated sensors for CO2 and
temperature were used. The participants were not told that the sensors were not real.
They were also told that the robot’s performance was not influenced in any way by
changes in temperature and CO2. The values from the sensors were displayed on the UI
(Figure 5.3), which the participants were asked to monitor. Participants were asked to
acknowledge high CO2 and temperature values by pressing the corresponding buttons
on the gamepad. The values were considered high when their values are above the
threshold lines on the secondary task indicators (Figure 5.3); values over the threshold
were indicated by changing the color of the bars from light blue to red, to assist the
participants in recognizing the change. The level of workload was varied by changing
the frequency with which the values cross the threshold. The simulated sampling rate
for the sensors was kept steady.
52
5.6 Compensation
Using higher levels of automation can reduce workload and hence is desirable, especially
under heavy workload from other tasks. To prevent participants from using high levels
of autonomy all the time, regardless of the autonomous system’s performance, it is
typical to introduce some amount of risk. Hence, in line with similar studies (e.g., [Riley,
1996,Lee and Moray, 1992a,Dzindolet et al., 2002]), the compensation was based in part
on the overall performance. The participants could select a gift card to a local restaurant
or Amazon.com. The maximum amount that the participants could earn was $30. Base
compensation was $10. Another $10 was based on the average performance of 5 runs.
The last $10 was based on the average time needed to compete the 5 runs, provided
that the performance on those runs was high enough.
The performance for each run was based on multiple factors, with different weights
for each of these factors predetermined. The participants are told there was a significant
penalty for passing a box on the incorrect side, regardless of the autonomy mode. If the
participants passed a box on the wrong side, they were heavily penalized (20 points per
box). In addition to the loss of score, participants were told that time would be added
based on the the number of wrong turns they took, but the specific penalties were not
revealed. For the first box passed on the wrong side, no additional time was added,
to allow participants to realize that the reliability of the system had dropped. For
the second incorrect pass, 60 seconds were added, with an additional 120 seconds for
the third and an additional 240 for the fourth, continuing with a cumulative increase.
Finding the victims was also an important task, so 10 points were deducted for each
53

victim missed. Equation 5.1 was used to calculate the score for each run.
Score =100� 20⇥|incorrectPasses|� 10⇥|victimsMissed|
� 5⇥|pushes|� 2⇥|bumps|� |scrapes|
� secondaryTaskScore/2 (5.1)
The scoring formula was not revealed to participants, although they were told about
the factors that influence their score. The score for each run was bounded between 0
and 100. If the score was 50 or more, the participants were eligible for a time bonus;
if they completed the runs in under 11:45 minutes average, they receive an additional
$10. If they had a score of 50 or more and took between 11:45 and 15 minutes, they
received a $5 bonus. Participants were told about this interdependence between score
and time, which was designed to prevent participants from quickly running through the
course, ignoring the tasks, while also providing a significant motivation to perform the
task quickly.
At the end of each run, the score was calculated and the participants were informed
about the amount of compensation that could be received based only on that run.
At the end of five runs, the average compensation was calculated and given to the
participant.
5.7 Questionnaires
There were three sets of questionnaires. The pre-experiment questionnaire was ad-
ministered after the participants signed the consent form; it focused on demographic
information (i.e., age, familiarity with technology similar to robot user interfaces, ten-
54
dency towards risky behavior, etc). The post-run questionnaire was administered im-
mediately after each run; participants were asked to rate their performance, the robot’s
performance, and the likelihood of not receiving their milestone payment. Participants
were also asked to fill out previously validated trust surveys, referred to in this the-
sis as Muir [Muir, 1989] and Jian [Jian et al., 2000b], and a TLX questionnaire after
each run. After the last post-run questionnaire, the post-experiment questionnaire was
administered, which included questions about wanting to use the robot again and its
performance. The questionnaires administered are provided in Appendix C.
5.8 Procedure
After participants signed the informed consent form, they were given an overview of
the robot system and the task to be performed. Then, participants were asked to drive
the robot through the trial course in fully autonomous mode. The experimenter guided
the participants during this process, by explaining the controls and helping with tasks
if necessary. The trial course was half the length of the test course. Once participants
finished the first trial run, they were asked to drive the robot again through the same
course in the robot assisted mode. Since there were multiple tasks that participants
needed to perform, we decided to first show them the fully autonomous mode, as that
would be a less overwhelming experience. Once the participants finished the second
trial run, they were asked to fill out the post-run questionnaire. While the data from
this questionnaire was not used, it allowed participants to familiarize themselves with
it and also helped to reinforce some of the aspects of the run that they needed to
remember.
After the two trial runs, the participants were asked to drive the robot for five more
55

Figure 5.4: The different reliability configurations.
Low
High
Low
High
Low
High
Low
High
Location on course
Rel
iabi
lity
Reliability A
Reliability B
Reliability C
Reliability D
runs. In each run, a different map was used. During these runs the reliability of robot
autonomy was either held high throughout the run or was changed. Figure 5.4 shows
the four different reliability configurations that were used. The changes in reliability
were triggered when the robot passed specific points in the course. These locations
were equal in length and there were no overlaps. For all four patterns, the robot always
started with high reliability. The length of each low reliability span was about one third
56
the length of the entire course. Using different dynamic patterns for reliability allowed
us to investigate how participants responded to a drop in reliability at different stages
and how the changes influenced control allocation. Every participant started with a
baseline run under full reliability (Reliability A in Figure 5.4). Then, the four reliability
profiles were counter-balanced for the remaining four runs.
Part of the research presented here including the data analysis was conducted at
Carnegie Mellon University (CMU) by Dr. Aaron Steinfeld and his research team
(Marynel Vázquez, Sofia Gadea-Omelchenko, Christian Bruggeman). The sections that
are conducted at CMU are indicated as such. The experimental methodology, including
the robot, the software running on the robot, and the course structure, are similar to
the one described above.
5.9 Experiment Design
The methodology explained in this chapter was utilized for all of the experiments. Since
multiple factors (e.g., reliability, situation awareness, among others unknown as of now)
needed to be investigated, it was not feasible to design a within subjects experiment.
Hence, a between subjects experiment was designed. The overall concept was to conduct
multiple experiments, each with two independent variables (e.g., reliability, situation
awareness, task complexity). The dependent variables were the operator’s trust and
the control allocation strategy. To discern the influence of reliability and other factors
being investigated, a baseline experiment with dynamic reliability (DR) as the only
independent variable was conducted first (Chapter 6). Data from that experiment was
used as a baseline for comparison with data from other experiments (e.g., Chapter 7).
57

Chapter 6
Baseline Reliability Experiment
In this research, the influence of all the factors was examined using a system where
the reliability is dynamic. However, to differentiate the effects of reliability on trust
and control allocation from that of the other factors being examined simultaneously, it
was important to independently examine the influence of reliability on operator trust
in HRI. Hence, in this experiment, the only independent variable was reliability.1
6.1 Results and Discussions
For the baseline experiment, the experimental methodology used was exactly as de-
scribed in Chapter 5. A similar methodology was also used at CMU and the results
reported here include the data from the 12 participants at CMU. While 12 participants
were run at CMU and 12 at UML, there were consistent behaviors across the sites
related to reliability and autonomy switching, so this data is reported in aggregate.
There were some site differences in terms of the trust scales used, which are discussed
below.1Portions of this chapter appear in [Desai et al., 2012a]
58

Unless noted, data from the practice and baseline runs were not included in the
analyses. No practice effects (run order) and map effects were found, suggesting that
the counter-balancing and map designs were adequate.
6.1.1 Positivity Bias
We found that 13 participants started all four runs by switching into the fully au-
tonomous mode and 17 participants started run 1 in the fully autonomous mode. Of
the 96 total runs, participants initially opted to start in full autonomy for 65 of them.
The breakdown for the individual runs was: run1 = 17, run2 = 15, run3 = 17, and run4
= 16, which is remarkably stable. The participants’ willingness to initially trust the
robot indicates the possibility of a positivity bias. These findings are consistent with
the findings of [Dzindolet et al., 2003] where they found that, given little experience or
information about an automated decision aid, people were willing to trust it.
6.1.2 Effect of Trust
The two trust survey methods (Muir, Jian) were highly correlated with each other (r =
0.84, p < 0.0001) suggesting either can be used for such experiments in the future. In
the analysis in later sections, we have elected to standardize on Muir due to its shorter
length.
The Muir and Jian post-run trust surveys were examined with REML (REstricted
or REsidual Maximum Likelihood) [Harville, 1977] on the effects of Site (CMU, UML),
Reliability (A, B, C, D), and Participants as a random effect and nested by Site. In both
cases, there were significant differences for Site and Reliability, but not the interaction.
UML trust responses were significantly higher than CMU for Muir, F (3) = 9.7 p <
59

2
4
5
7
8
A B C D
Mea
n re
spon
se
Reliability
Reliability N Rows Trust Jian (1-7 scale)Trust Muir (1-10 scale)Std Err(Trust Jian)Std Err(Trust Muir)A 24 4.857638889 6.75 0.266583583 0.42188758B 24 4.524305556 6.34375 0.26926007 0.459109808C 24 4.319444444 5.885416667 0.227592124 0.468911003D 24 4.211805556 5.927083333 0.24706302 0.423890059
1
3.25
5.5
7.75
10
A B C D
Mea
n R
espo
nse
Reliability
Trust Jian (1-7 scale)Trust Muir (1-10 scale)
2
4
5
7
8
A B C D
Trust Jian (1-7 scale)Trust Muir (1-10 scale)
Figure 6.1: Impact of reliability on trust (higher number indicates more trust).
0.01, and Jian, F (3) = 9.7 p < 0.01. Student’s t post hoc tests of Reliability on Muir,
F (3) = 2.6 p = 0.059, and Jian, F (3) = 3.0 p < 0.05, showed Reliability A as being
significantly higher than Reliability C and Reliability D for both metrics (Figure 6.1).
These nearly identical results for Muir and Jian reinforce the earlier finding that using
just one approach is appropriate in the future.
These results mean that trust is highest in high reliability runs (A); slightly reduced
in runs with low reliability at the beginning of the run and high at the end (B); and
more reduced for runs where reliability was low in the middle or end of the runs (C and
D). This result indicates that timing is important for trust – drops in reliability after a
period of good performance are more harmful than early failures. Whether this is due to
memory recency or a breakage in the participant’s mental model of robot performance
is uncertain. Additional research needs to be conducted to investigate these results.
60

0
2
4
5
7
A B C DReliability
Mea
n au
tono
my
mod
e sw
itche
d (#
)
Figure 6.2: Impact of reliability on mode switching.
The influence of Site on trust survey results is likely due to UML’s population being
slightly younger (mean of 7 years younger) and more predisposed towards risky behav-
ior (0.66 higher on a set of 7-point self-rating scales; question 10 of the demographic
questionnaire in Appendix C). Significance tests for both demographic features were
close, but not statistically significantly different. However, their combined effect may
have produced this Site effect.
6.1.3 Effect on Control Allocation
To obtain a high-level view, we performed a Restricted Maximum Likelihood (REML)
analysis of how many times participants switched autonomy level within a run on the
effects of Site (CMU, UML), Reliability (A, B, C, D), and Participants as a random
effect and nested by Site. This analysis resulted in a significant difference only for
61

Reliability, F (3) = 4.7 p < 0.01, where a Student’s t post hoc revealed participants
switched considerably more within Reliability C, as compared to Reliability A and D
(Figure 6.2). Likewise, Reliability B was higher than Reliability A.
Of the 24 participants, five did not switch autonomy levels during any of their
runs, regardless of the reliability profiles. Two of these participants stayed in robot
assisted mode for all of their runs, two stayed in the fully autonomous mode, and one
participant used robot assisted mode for all but one run. Participants were binned
into three behavior groups: FullAuto, Mixed, and MostlyRobotAssisted. Sample sizes
for these groups were imbalanced and too small for statistical analysis (2, 19, and 3,
respectively), but there were several clear trends. The MostlyRobotAssisted group run
times were noticeably slower, and the FullAuto rated their own performance low in
comparison to the other two groups. There was a general trend of lower trust on the
Muir questions as autonomy use increased across the three groups (see Familiarity bias
below).
Of the 19 participants in the Mixed behavior category, nine did not change their
autonomy level during the baseline run, which was held constant at high reliability (3 in
robot assisted mode, 6 in autonomous). In the second run with high reliability, eleven
did not change their autonomy level (1 in robot assisted, 10 in autonomous). Seven of
these participants overlapped, meaning that during the high reliability runs, all but six
participants did not change their autonomy mode in at least one of those runs.
In contrast, during the runs with changing reliability, all Mixed participants switched
autonomy modes in at least one of the other three variable reliability conditions. Also,
14 of the 19 participants switched autonomy modes in all three of the variable reliability
conditions (B, C, and D). This data indicates that participants recognized they were
operating under dynamic reliability and adjusted their control allocation accordingly.
62

Switch CMU,1 CMU,3 CMU,8 UML,11 UML,3 UML,5 UML,71 55.65 6.48 143.66 18.07 103.33 32.4 15.092 4.98 32.63 8.75 8.1 83.91 49.62 50.59
0
37.5
75
112.5
150
1 2
Sw
itch
back
to a
uton
omy
(sec
)
Exposure to reliability drop
CMU,1CMU,3CMU,8UML,11UML,3UML,5UML,7
0
38
75
113
150
1 2
Switc
h ba
ck to
aut
onom
y (s
econ
ds)
Exposure to reliability drop
CMU,1 CMU,3 CMU,8UML,11 UML,3 UML,5UML,7
Figure 6.3: Autonomy return by exposure to low reliability.
It also indicates that participants recognized the risk of decreased compensation and
tried to optimize the allocation strategy to obtain maximum compensation. To further
investigate how the participants used autonomy, we analyzed the participants’ behavior
during periods of low reliability.
6.1.4 Use of Autonomy During Periods of Unreliability
To examine behavior during low reliability, we focused on the scenario where partici-
pants entered a low reliability window during autonomy use. This window corresponded
to the point at which reliability decreased (t0) to when it increased (t1). By defini-
tion, runs with reliability A were not included, as reliability did not decrease during
those runs. For the 17 participants who switched during this window, the mean use of
autonomy during low reliability was 30 percent.
A total of 15 participants switched from autonomy to robot assisted mode after t0
63

and from robot assisted mode to autonomy after t1. This behavior was constrained
to Reliability B and Reliability C (7 and 8 participants respectively); we conjecture
that participants did not have enough time to recover from the reliability drop in
Reliability D, where the drop occurred near the end of the run. Within this group, the
mean switching time after the reliability drop at t0 was 16.6 seconds (SD = 13.1). The
return to autonomy after reliability improved at t1 occurred a mean of 39.0 seconds later
(SD = 41.0). A one tailed t-test, t(14) = 2.04 p < 0.05) confirmed that participants
waited longer to switch back to autonomy than switching away from autonomy. While
only marginally statistically significant (one tailed, t(13) = 1.73, p < 0.1), there were
strong indications that participants switched away from autonomy at t0 twice as slowly
for Reliability C than Reliability B (means 22 and 11 seconds respectively). However,
there were no differences between Reliability C and Reliability B for switching back to
autonomy at t1.
Of these 15 participants, seven returned to the fully autonomous mode at t1 for
both the Reliability B and Reliability C conditions. Four of these seven switched back
to autonomy faster on their second exposure to a reliability change, while the rest
switched back more slowly (Figure 6.3). This results suggests that repeated exposure
to changing reliability impacts the speed at which people switch back to autonomy,
although we do not possess enough evidence to determine what causes this behavior.
6.1.5 Subjective Ratings
ANOVA analysis of participant ratings of robot performance across reliability levels
were inconclusive, F(3, 92) = 1.09 p = 0.36. However, participants did respond differ-
ently for ratings of their own performance, F(3, 92) = 3.4 p < 0.05, and were marginally
significant on the risk of not receiving a milestone payment F(3, 92) = 2.2 p < 0.1. Stu-
64

Reliability N Rows Rating of Self Performance Rating of Robot Performance (1=Poor; 7=Excellent)Risk Not Receiving Milestone Payment Std Err(Rate Self Performance (1=Poor; 7=Excellent))Std Err(Rate Robot Performance (1=Poor; 7=Excellent))Std Err(Risk Not Receiving MilestonePayment (1=Very low; 10=Very high))A 24 5.58333333333333 6.291666667 4.375 0.329232015160682 0.164616007580341 0.610335201320565B 24 4.16666666666667 6.083333333 6 0.344031231028093 0.207789144332459 0.507194614336148C 24 4.5 6.041666667 6.20833333333333 0.294883912309794 0.212636713623674 0.521213629275938D 24 4.79166666666667 6.458333333 5.625 0.350874511336053 0.14718575794891 0.560836913441208
Rating of Self Performance Risk Not Receiving Milestone Payment
1
3.25
5.5
7.75
10
A B C D
Mea
n R
espo
nse
Reliability3
4
6
7
8
A B C D
Mea
n re
spon
se
Reliability
Rating of Self PerformanceRisk Not Receiving Milestone Payment
Figure 6.4: Impact of reliability on self assessment ratings.
dent’s t post hoc analyses showed a higher rating of self performance and better odds of
receiving the milestone payment for reliability A, as compared to C and B, in both mea-
sures (Figure 6.4). Assessment of self performance was also sensitive when examining
trust, with a significant correlation to Muir (r = 0.43, p < 0.0001).
As has been seen in some of our prior experiments, participants were moderately
accurate in their assessment of milestone performance. Ratings of risk of not being paid
the extra money were inversely correlated with actual payment (r = �0.58, p < 0.01).
6.1.6 Familiarity Bias
The protocol was intentionally designed to promote use of autonomy. As expected,
higher use of autonomy was correlated with better performance on finding more victims
(r = 0.30, p < 0.01) and faster route completion time (r = �0.51, p < 0.0001). These
65

results suggest that general use of autonomy had a perceptible, beneficial impact on
the task.
As mentioned, prior work shows that increased use of autonomy with positive per-
formance outcomes leads to higher trust (e.g., [Lee and Moray, 1992a]). However, the
Muir post-run trust ratings and the percentage of time spent in full autonomy were
inversely correlated (r = �0.20, p < 0.05). This fact, combined with the results above,
suggest that overall familiarity is less powerful than scenario factors.
6.1.7 Predicting Trust
An important question for human-robot interaction is whether trust can be predicted.
To examine this question, Muir trust ratings were examined in the context of cogni-
tive load (TLX) [Hart and Staveland, 1988], how many victims a participant found,
secondary task performance, payment (i.e., overall performance), number of switches
between autonomy and robot assisted modes, a collection of demographic features, and
the three post-run assessment ratings. A backwards stepwise regression on these in-
dependent measures accurately predicted Muir ratings (R2 = 0.84). Significant results
showed that higher trust was predicted by low cognitive load, poor victim performance,
lower payment, lower expected payment, high ratings of self performance, younger age,
and high risk tendencies (Table 6.1). Note that autonomy switching, secondary task
performance, ratings of robot performance, and percentage of time using full autonomy
do not predict trust. These results suggest that trust is heavily tied to factors with
semantic association to risk and personal feelings about performance, rather than robot
performance.
66

Table 6.1: Backwards stepwise regression results for Muir trust ratingsEffect Estimate pCognitive load (TLX) -0.33 < 0.01Victims found -1.58 < 0.01Payment (performance) -0.22 < 0.01Tendencies towards risky behavior 0.65 < 0.01Risk of not receiving milestone payment 0.28 < 0.05Participant age -0.05 < 0.1Self performance rating 0.50 < 0.1Robot performance rating removed xExperience with robot-like UIs removed xAutonomy switches removed xTechnology demographics removed xSecondary task performance removed xPercent autonomy removed xMap time removed x
67

Chapter 7
Influence of Low Situation Awareness
on Trust
While reliability is considered to be a significant influence on control allocation, there
are other factors such as complacency, trust, workload, and user interface design that
also influence the use of automation. For example, Wickens et al. [Wickens et al., 2000]
highlight the importance of user interfaces in automated systems and, according to
Atoyan et al. [Atoyan et al., 2006], interface design plays an important role in influ-
encing users’ trust in automation. While user interfaces used in industrial and aviation
automation are important, robot interfaces exert significant influence on remote robot
operation [Keyes, 2007], including a person’s use, misuse or disuse of robot autonomy
levels.
When teleoperating a remote robot, the operator is not co-located with the robot.
The operator must rely on the user interface to attain adequate situation awareness to
safely perform the task. The user interface is especially important in situations where
the operating environment is dynamic and unknown. Burke et al. [Burke et al., 2004b]
68
determined that teleoperating a robot is common in application domains where robots
operate in unstructured or high risk environments. Hence the user interface is especially
important for these application domains.
Since Endsley [Endsley, 1988] defined situation awareness, significant work has been
done by researchers to examine the influence of situation awareness on performance in
supervisory control systems (e.g., [Dorneich et al., 2010,Cummings, 2004,Parasuraman
et al., 2009]). The interaction of situation awareness and workload with automation has
also been highlighted by Parasuraman et al. [Parasuraman et al., 2008]. There is also a
need for attaining better situation awareness in human-robot interaction (e.g., [Woods
et al., 2004,Chen and Thropp, 2007]).
To investigate the influence of low situation awareness on control allocation in a real
robot system with variable reliability under high workloads, we conducted an experi-
ment similar to the dynamic reliability (DR) experiment explained in Chapter 6. In this
experiment the user interface was modified slightly to reduce the operator’s situation
awareness. We hypothesized that operators would have to trust and rely on the robot
autonomy more compared to the DR experiment due to lowered situation awareness.
We also hypothesized that due to poor situation awareness the operators would switch
out of robot assisted mode faster after reliability increased when compared to the DR
experiment.This experiment is referred to as the low situation awareness experiment
(LSA).
7.1 Methodology
In this experiment, participants experienced the same four reliability conditions as
the DR experiment (Figure 5.4), but with an interface designed to provide reduced
69

situation awareness compared to the DR experiment. The data from the experiments
conducted at CMU for the DR experiment is not used for analysis with data from the
LSA experiment. The participants for both experiments were approximately of the
same age range [DR=23.5 (6.4), LSA=28.08 (9.8), p=0.2, t(21)=1.29 (unpaired two
tailed t-test)].
Figure 7.1: The interface used in the dynamic reliability experiment (DR) is shownon the left. The interface on the right, designed for the low situation awareness ex-periment (LSA), reduced the operator’s situation awareness by removing the crosshairsindicating the current pan and tilt of the camera and by providing less accurate distanceinformation around the robot.
The methodology used for this experiment was similar to the one used for the DR
experiment. The only difference was in the user interface (UI) that was modified slightly
to reduce the operator’s situation awareness. Figure 7.1 shows the user interface (UI)
used to control the robot. In LSA, three modifications to the UI were made. The first
was that the pan-tilt indicators that had been provided on the main video window in
DR were removed in LSA. For the second, the simulated sonar information (produced
by taking laser readings at specified locations and use that value for the “sonar cone”
70
reading) replaced the more accurate laser range data provided in DR. Finally, the laser
display in DR rotated in accordance with the pan value of the front camera, but this
feature was disabled in the LSA interface: the robot always faced straight.
7.2 Results and Discussions
As planned, the altered user interface led to a noticeable difference in situation aware-
ness. Participant responses to questions testing situation awareness (SAGAT; Section
C.2.5) showed better results for the DR experiment when compared to the LSA exper-
iment, t(96)=-2.9 p < 0.01.
The objective performance and trust questionaire data were examined with REML
(REstricted or REsidual Maximum Likelihood) [Harville, 1977] on the effects of Exper-
iment (DR, LSA), Reliability (A, B, C, D), and Participants as a random effect and
nested by Experiment. Where appropriate, a Student’s t post hoc was used to identify
significant differences within effects. Of these, the highlights were as follows:
7.2.1 Effect on Trust
A two-way ANOVA showed a significant effect for Experiment, F (1,139)=5.50, p<0.05.
No significant effect was found for Reliability, F (3,139)=1.32, p=0.27 or the interaction,
F (3,139)=0.14, p=0.93. Trust was significantly higher in LSA (µ=7.03, �=2.02) than
DR (µ=6.14, �=2.22). This analysis shows that participants trusted the system more
when their situation awareness was lowered. We suspect this might be due to the forced
reliance on the fully autonomous mode.
71

7.2.2 Effect on Control Allocation
To examine how much the participants relied on the fully autonomous mode in both
experiments we conducted a two-way ANOVA. The results of the analysis showed sig-
nificant effects for Experiment, F (1,135)=4.22, p<0.05. No significant effect was found
for Reliability, F (3,135)=2.37, p=0.07 or the interaction, F (3,135)=0.20, p=0.89. Par-
ticipants relied significantly more on the fully autonomous (FA) mode in LSA (µ=9.74,
�=3.37) than in DR (µ=8.20, �=4.74). This data indicates that participants did rely
more on the FA mode when their situation awareness was lowered.
We also wanted to examine if there was an increase in the autonomy mode switches
due to lower SA. A two-way ANOVA showed a significant effect for Reliability, F (3,136)
=7.39, p<0.01. No significant effect was found for Experiment, F (1,136)=2.78, p=0.09
or the interaction, F (3,136)=1.51, p=0.21. A post hoc Tukey’s HSD test showed that
there were significantly less autonomy mode switches in Reliability A (µ=2.47, �=3.39)
compared to Reliability B (µ=6.05, �=6.27, p<0.01) and Reliability C (µ=7.50, �=6.13,
p<0.01). While the difference between DR and LSA was only marginally significant, it
did show that participants in LSA had more mode switches. This data indicates that,
since the participants were forced to rely more on the FA mode, they might have been
more vigilant and hence switched modes more often. We suspect the higher autonomy
mode switches might also have led to a better control allocation strategy.
To examine the control allocation strategy we conducted a two-way ANOVA. The re-
sults of the analysis showed a significant effect for Experiment, F (1,135)=7.08, p<0.01.
No significant effect was found for Reliability, F (3,135)=0.78, p=.050 or the interac-
tion, F (3,135)=0.10, p=0.95. Control allocation strategy was significantly better in
LSA (µ=10.85, �=3.07) than DR (µ=9.21, �=3.60) (Figure 7.2). This analysis shows
that participants in LSA made better (more appropriate) use of the autonomous modes
72

0
2
4
6
8
10
12
14
Gat
es w
ith a
ppro
pria
te C
A
DR
LSA
DR
LSA
DR
LSA
DR
LSA
A B C D
Experiments within Reliability
Figure 7.2: Control allocation strategy for DR and LSA experiments across reliabilityconditions, ±1 st. error.
compared.
7.3 Performance
We analyzed the performance by looking at three metrics; the number of hits, the time
taken to finish the task, and the number of wrong turns.
7.3.1 Hits
A two-way ANOVA showed no significant effects for Reliability, F (3,136)=1.37, p=0.25,
Experiment, F (1,136)=0.22, p=0.63, or the interaction, F (3,136)=0.66, p=0.57. This
data shows that a drop in SA did not result in an increase in hits as expected. We
suspect this was the case because of higher reliance on FA mode, during which there
were no hits.
73

7.3.2 Time
A two-way ANOVA showed significant effects for Reliability, F (3,136)=6.37, p>0.01,
Experiment, F (3,136)=9.05, p>0.01, or the interaction, F (3,136)=3.45, p>0.01. Par-
ticipants in LSA took significantly more time (µ=687, �=153) than participants in DR
(µ=626, �=102). A post hoc Tukey’s HSD test for Reliability showed that partici-
pants took less time in Reliability A (µ=593, �=92) then Reliability B (µ=677, �=151,
p<0.01) and Reliability C (µ=678, �=126, p<0.01). This data matches our expectation
that participants would need more time to perform their task when SA drops.
7.3.3 Wrong Turns
A two-way ANOVA showed significant a effect for Reliability, F (3,136)=11.95, p>0.01.
No significant effect was found for Experiment, F (1,136)=0.16, p=0.68 or the inter-
action, F (3,136)=0.03, p=0.99. A post hoc Tukey’s HSD test showed that there
were fewer wrong turns in Reliability A (µ=0.08, �=0.28) than Reliability B (µ=2.05,
�=1.67, p<0.01), Reliability C (µ=1.61, �=1.55, p<0.01), and Reliability D (µ=1.86,
�=1.69, p<0.01). This data indicates that even though participants in LSA had a
better control allocation strategy they did not show an improvement in the number of
wrong turns. We suspect this because they had a higher number of wrong turns in the
robot assisted (RA) mode due to the lowered SA and higher workload.
7.4 Subjective Ratings
To investigate the impact on workload we conducted a two-way ANOVA (Figure 7.3).
The results showed significant effects for Reliability, F (3,136)=3.69, p>0.05 and Ex-
periment, F (1,136)=8.09, p>0.01. No significant effect was observed for the interac-
74
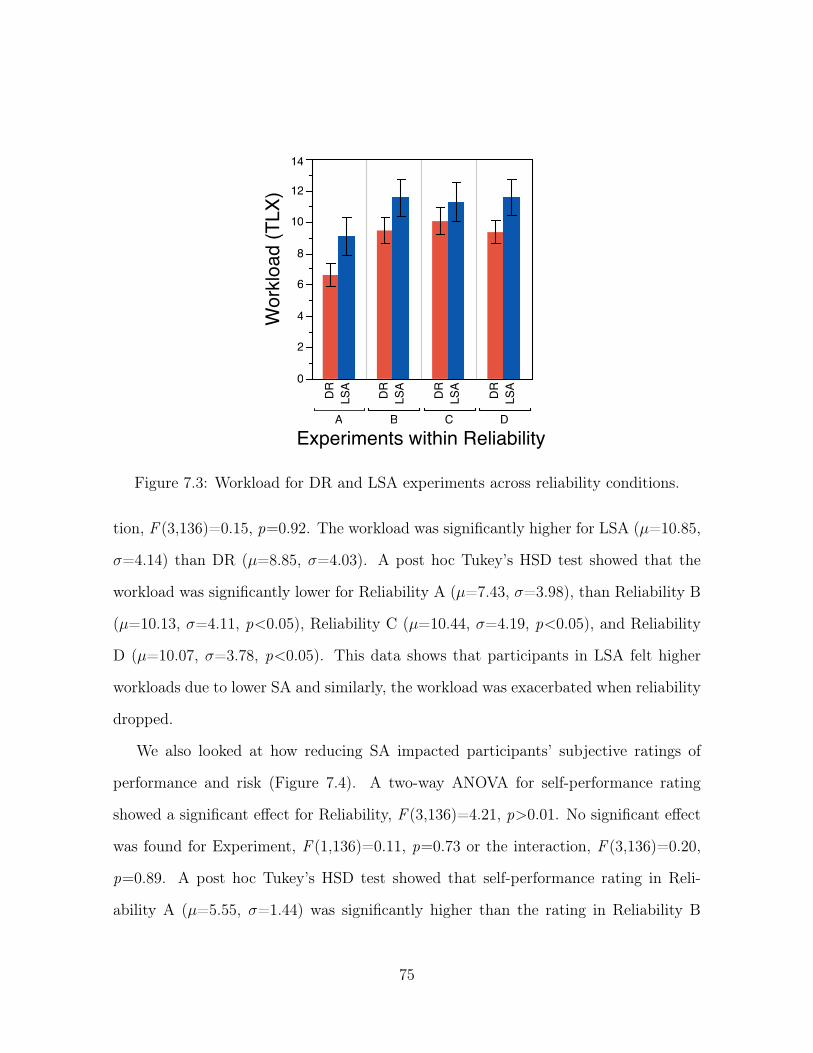
0
2
4
6
8
10
12
14
Wor
kloa
d (T
LX)
DR
LSA
DR
LSA
DR
LSA
DR
LSA
A B C D
Experiments within Reliability
Figure 7.3: Workload for DR and LSA experiments across reliability conditions.
tion, F (3,136)=0.15, p=0.92. The workload was significantly higher for LSA (µ=10.85,
�=4.14) than DR (µ=8.85, �=4.03). A post hoc Tukey’s HSD test showed that the
workload was significantly lower for Reliability A (µ=7.43, �=3.98), than Reliability B
(µ=10.13, �=4.11, p<0.05), Reliability C (µ=10.44, �=4.19, p<0.05), and Reliability
D (µ=10.07, �=3.78, p<0.05). This data shows that participants in LSA felt higher
workloads due to lower SA and similarly, the workload was exacerbated when reliability
dropped.
We also looked at how reducing SA impacted participants’ subjective ratings of
performance and risk (Figure 7.4). A two-way ANOVA for self-performance rating
showed a significant effect for Reliability, F (3,136)=4.21, p>0.01. No significant effect
was found for Experiment, F (1,136)=0.11, p=0.73 or the interaction, F (3,136)=0.20,
p=0.89. A post hoc Tukey’s HSD test showed that self-performance rating in Reli-
ability A (µ=5.55, �=1.44) was significantly higher than the rating in Reliability B
75

0
1
2
3
4
5
6
7
Perfo
rman
ce ra
ting
DR
LSA
DR
LSA
DR
LSA
DR
LSA
A B C D
Experiments within Reliability
Self performanceRobot’s performance
Figure 7.4: Self-performance and robot’s performance ratings for DR and LSA experi-ments across reliability conditions.
(µ=4.19, �=1.70, p<0.01) and marginally higher than Reliability C (µ=4.52, �=1.42,
p=0.06) and Reliability D (µ=4.63, �=1.67, p=0.06). This data shows that reducing
SA did not impact their self-performance rating, but they did blame themselves for
poor performance when reliability dropped.
A two-way ANOVA for the robot’s performance rating showed a significant effect
for Experiment, F (1,136)=6.02, p>0.05. No significant effect was found for Reliabil-
ity, F (3,136)=0.56, p=0.63 or the interaction, F (3,136)=0.50, p=0.67. The robot’s
performance rating was significantly lower in LSA (µ=5.77, �=1.22) compared to DR
(µ=6.21, �=0.90). This data indicates that participants could have blamed the robot
for providing poor SA.
A two-way ANOVA for perceived risk showed no significant effects for Experi-
ment, F (1,136)=1.59, p=0.20, Reliability, F (3,136)=2.57, p=0.05, or the interaction,
76

F (3,136)=0.08, p=0.96.
7.5 Conclusions
As expected, the drop in LSA led to more reliance on autonomy; however, it did not
result in better performance. While the amount of time needed increased due to the
lower SA, especially during the robot assisted mode, there was no difference in hits or
wrong turns. We suspect that since participants drove more in FA mode in LSA, the
number of hits did not increase. Also, as expected there was an increase in the workload.
We expected the workload to increase in LSA because the participants would have to
work harder to maintain sufficient SA. We found an increase in trust and suspect that
was due to the increased reliance on the FA mode. However, it is surprising to find that
the robot’s performance rating decreased in LSA. We suspect the participants blamed
the robot for the poor SA provided via the user interface.
All of these findings demonstrate the importance of situation awareness for remote
robot tasks, even when the robot has autonomous capabilities. In real world situations,
it is very likely that autonomous systems will experience periods of reduced reliability.
Providing operators with the means to build up the best situation awareness possible
will improve their use of the robot system.
77
Chapter 8
Measuring Real-Time Trust
Chapter 6 examined the impact of changing reliability on an operator’s trust and con-
trol allocation strategy. The data from the baseline dynamic reliability experiment
(DR) and the low situation awareness (LSA) experiment has shown that failures of
autonomous behaviors altered operator behavior. However, the two key limitations of
the experimental methodology were the inability to examine how trust evolved during
a participant’s interaction with a remote robot system and how trust was impacted by
robot failures at different points in the interaction. To investigate the evolution of trust
and the impact of varying reliability on real-time trust, the experimental methodology
was modified. As with the DR and LSA experiments, all of the remaining experiments
in this thesis are performed under dynamic reliability. This chapter describes the new
experimental setup used for the real-time trust (RT) experiment.
The experimental setup for measuring real-time trust was similar to that used for
the DR and LSA experiments. No modifications were made to the robot or the auton-
omy modes. However, minor modifications were made to the user interface (UI), the
secondary tasks were simplified while making them more consistent, and the reliability
78
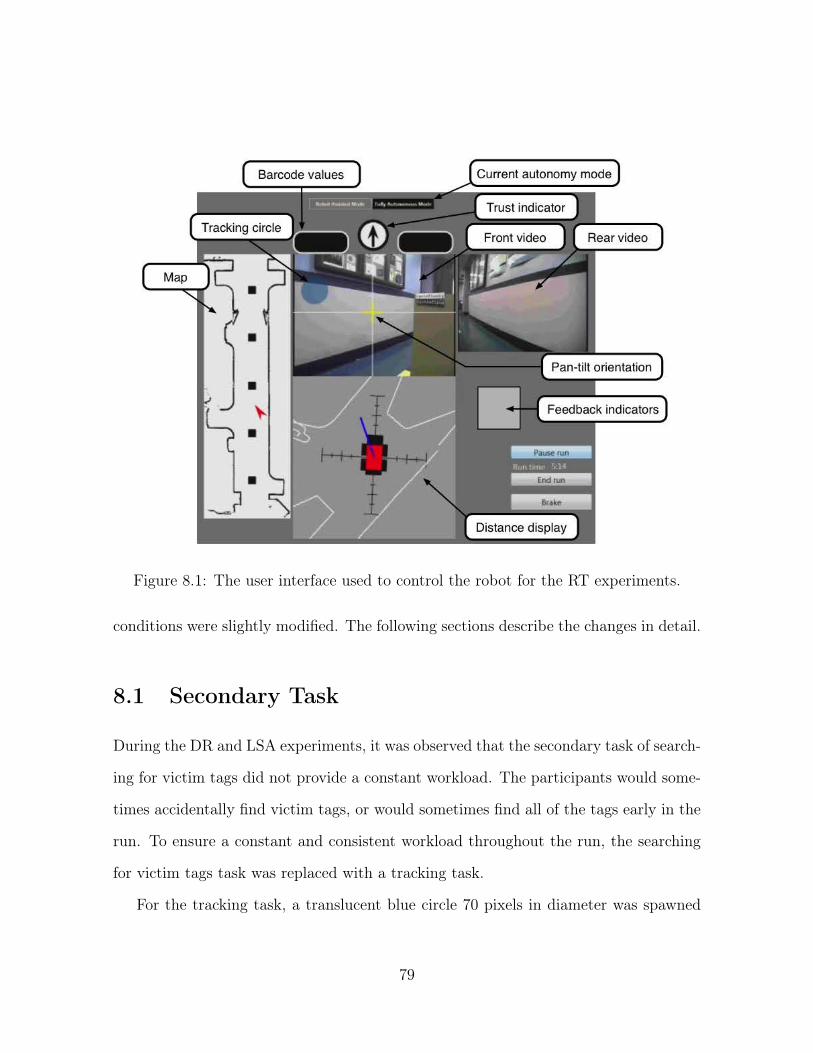
Figure 8.1: The user interface used to control the robot for the RT experiments.
conditions were slightly modified. The following sections describe the changes in detail.
8.1 Secondary Task
During the DR and LSA experiments, it was observed that the secondary task of search-
ing for victim tags did not provide a constant workload. The participants would some-
times accidentally find victim tags, or would sometimes find all of the tags early in the
run. To ensure a constant and consistent workload throughout the run, the searching
for victim tags task was replaced with a tracking task.
For the tracking task, a translucent blue circle 70 pixels in diameter was spawned
79

entirely within the confines of the video screen every 35 seconds. The location on
the screen was selected based on the following two criteria: it was placed a constant
distance away from the position of the yellow crosshairs and in a random direction,
while ensuring that the blue circle would remain entirely within the video screen.
When the tracking circle (shown in Figure 8.1) appeared on the video screen, par-
ticipants were asked to acknowledge it by moving the yellow crosshairs over it. The
blue circle disappeared when the crosshairs overlapped the circle, indicating that the
task was acknowledged. The circle would remain on the video screen until it was ac-
knowledged or a new one was spawned. Since a new circle was created at a regular
interval and at a fixed distance away from the crosshairs, the workload was regular and
consistent. The circle was intentionally selected to be translucent and blue to make
it harder to detect on the video screen. The difficulty of detecting the blue circle was
mentioned by several participants. They mentioned that the color of the circle should
be changed and that it should not be translucent since it was hard to detect. To prevent
overwhelming the participants, the sensor gauges and the victim tag identification task
were discarded. Hence, the sensor gauges were removed from the UI.
8.2 Real-Time Trust
Trust questionnaires, such as the Muir questionnaire [Muir, 1989], only provide infor-
mation about the participant’s trust of the robot at the end of each run. In order to
examine how a participant’s trust of the robot is immediately impacted by changes
in reliability, participants were asked to respond to real-time trust prompts during the
runs. At each prompt, participants were instructed to indicate if their trust of the robot
had increased, decreased, or not changed, by pressing buttons on the gamepad (Figure
80
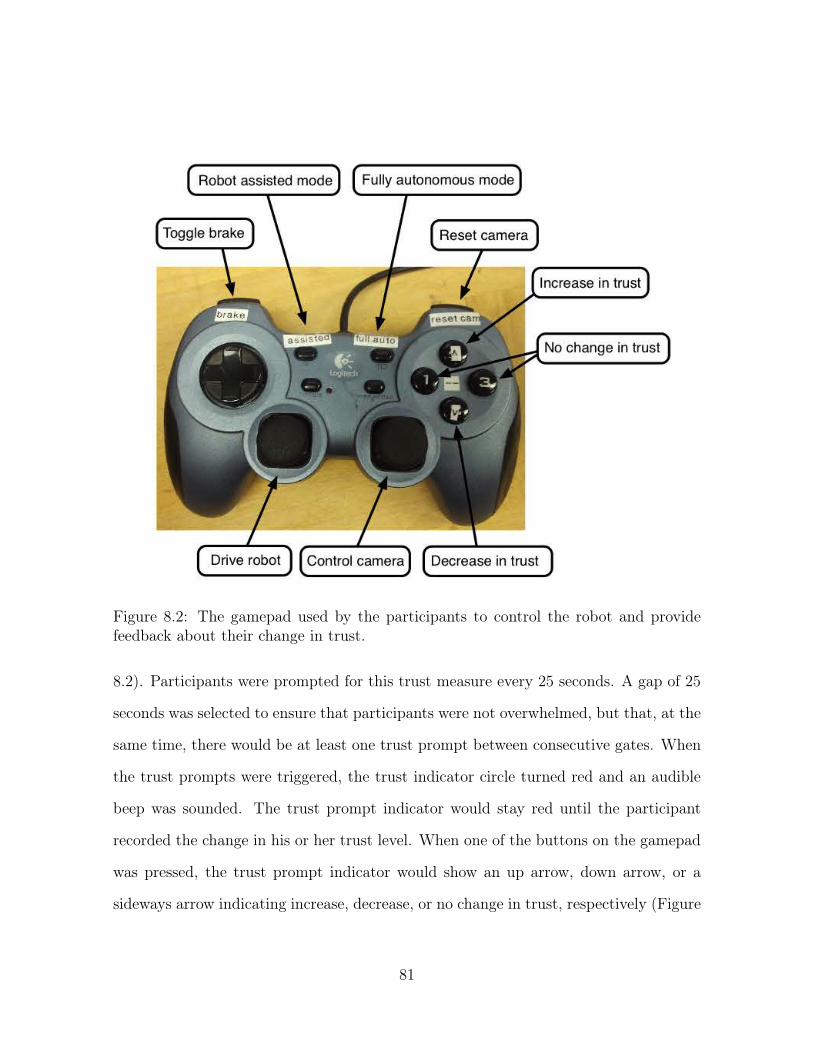
Figure 8.2: The gamepad used by the participants to control the robot and providefeedback about their change in trust.
8.2). Participants were prompted for this trust measure every 25 seconds. A gap of 25
seconds was selected to ensure that participants were not overwhelmed, but that, at the
same time, there would be at least one trust prompt between consecutive gates. When
the trust prompts were triggered, the trust indicator circle turned red and an audible
beep was sounded. The trust prompt indicator would stay red until the participant
recorded the change in his or her trust level. When one of the buttons on the gamepad
was pressed, the trust prompt indicator would show an up arrow, down arrow, or a
sideways arrow indicating increase, decrease, or no change in trust, respectively (Figure
81

Figure 8.3: Trust prompt indicators (from left): a red circle with a black border prompt-ing the participants to indicate their change in trust, showing that the participant in-dicated an increase in trust, showing that the participant indicated a decrease in trust,and showing that the participant indicated no change in trust.
8.5). The participants could indicate an increase in trust by pressing the top button on
the gamepad, a decrease in trust by pressing the button on the bottom, and no change
in trust by pressing either of the two buttons in the middle.
8.3 Updated Reliability Conditions
We observed from previous experiments that in Reliability D, the participants did not
have time to recover from the period of low reliability. To ensure that participants had
a period of high reliability during the beginning and the end, we decided not to have
periods of low reliability immediately at the start or the end. To accommodate for this
change, the number of gates in the course was increased. This increase in the length
of the course was accomplished by moving the second u-turn to the first gate, forcing
participants to pass all of the gates four times.
In prior experiments, reliability was low for four consecutive gates. This consecutive
period of low reliability was replaced with two sets of reliability drops, each two gates
long, for Reliability B and D. Reliability C had one period of low reliability that was
four gates long, as in the original experiment. The new reliability patterns are shown
in Figure 8.4.
82

High
LowReliability A
High
Low Reliability B
High
Low Reliability C
High
Low
Location on the course
Reliability D
Figure 8.4: Reliability conditions for the new experiments.
The layout of the course remained the same as previous experiments. However,
the length of all of the maps was extended from 13 gates to 17 gates. The start and
end positions were the same as previous experiments. To ensure that participants still
finished within the 3 hour limit, the speed of the robot was moderately increased.
83

8.4 Compensation
The compensation structure remained similar to the prior experiments. The penalties
for missing the sensor gauges and the victim tags was removed. The participants were
instead penalized for failing to acknowledge the tracking task. They were not, however,
penalized for failing to acknowledge the trust prompts. However, participants were
required to acknowledge at least 90% of the trust prompts to be eligible for the time
bonus.
Apart from these changes, there were only two other minor changes. The Jian trust
questionnaire was removed since it was highly correlated with the Muir trust scale but
took longer to answer. The Cube Comparison Test was also dropped since the data from
that test did not provide any useful data with regards to trust or control allocation,
while taking nearly 10 minutes to answer.
Based on this new setup, an experiment was conducted with 12 participants (referred
to as the RT experiment). Six of the twelve participants were female. Along with the RT
experiment, three other experiments were also conducted (Long Term (LT), Feedback
(F), and Reduced Difficulty (RD)). The description of each, along with data and results
from all of these experiments, are presented in the following chapters.
8.5 Results and Discussion
This section provides the results from the RT experiment. While the analysis is lim-
ited to comparison across Reliability, the later chapters provide detailed comparisons
between experiments.
84
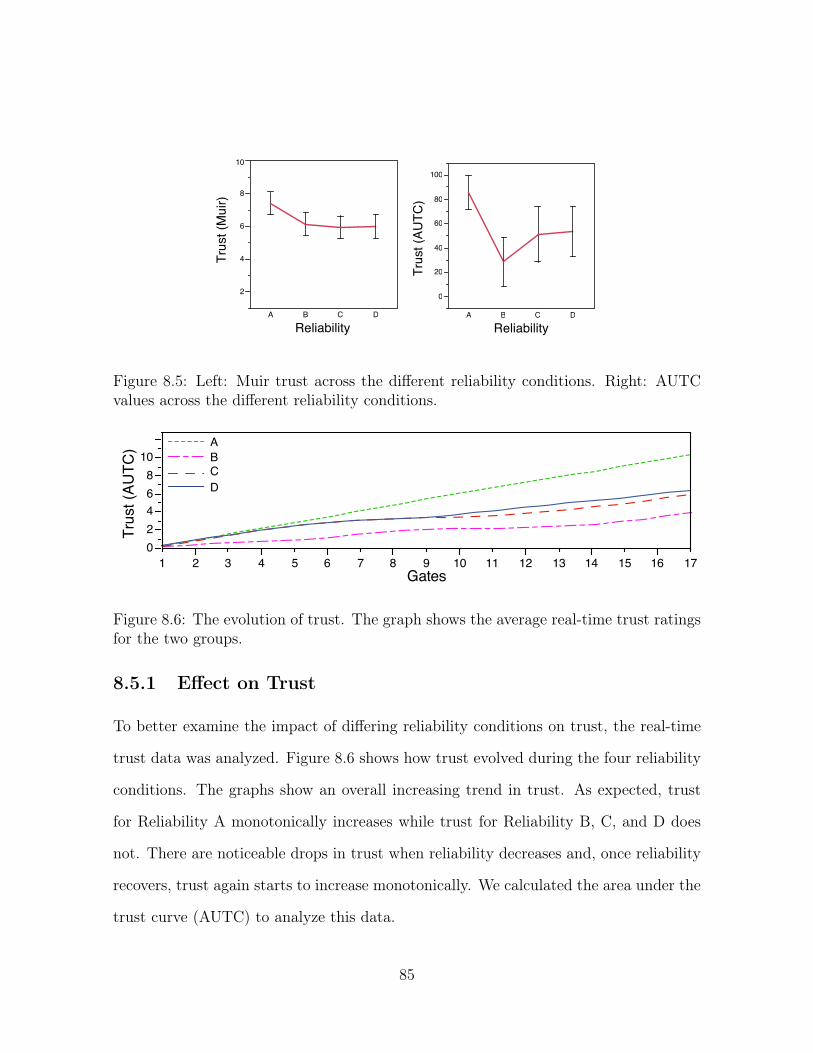
2
4
6
8
10
Trus
t (M
uir)
A B C D
Reliability
0
20
40
60
80
100
Trus
t (AU
TC)
A B C D
Reliability
Figure 8.5: Left: Muir trust across the different reliability conditions. Right: AUTCvalues across the different reliability conditions.
02468
10
1 2 3 4 5 6 7 8 9 10 11 12 13 14 15 16 17Gates
Trus
t (AU
TC)
CD
BA
Figure 8.6: The evolution of trust. The graph shows the average real-time trust ratingsfor the two groups.
8.5.1 Effect on Trust
To better examine the impact of differing reliability conditions on trust, the real-time
trust data was analyzed. Figure 8.6 shows how trust evolved during the four reliability
conditions. The graphs show an overall increasing trend in trust. As expected, trust
for Reliability A monotonically increases while trust for Reliability B, C, and D does
not. There are noticeable drops in trust when reliability decreases and, once reliability
recovers, trust again starts to increase monotonically. We calculated the area under the
trust curve (AUTC) to analyze this data.
85
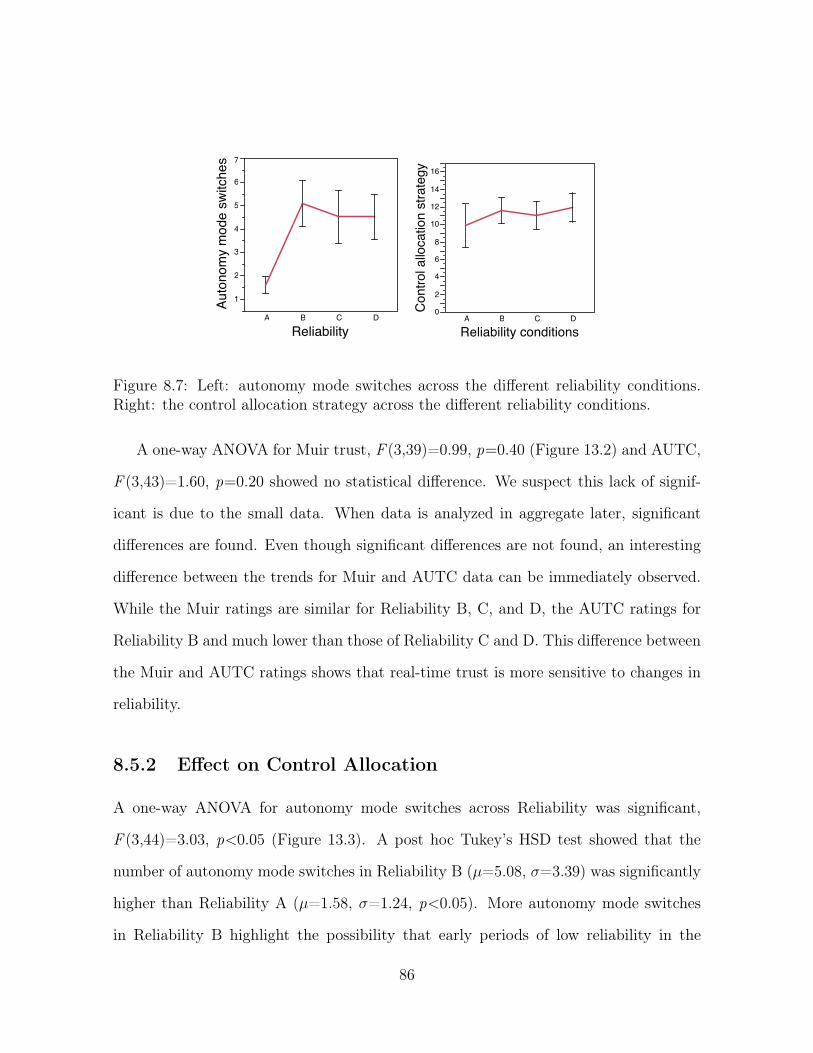
1
2
3
4
5
6
7
Auto
nom
y m
ode
switc
hes
A B C D
Reliability0
2
4
6
8
10
12
14
16
Con
trol a
lloca
tion
stra
tegy
A B C D
Reliability conditions
Figure 8.7: Left: autonomy mode switches across the different reliability conditions.Right: the control allocation strategy across the different reliability conditions.
A one-way ANOVA for Muir trust, F (3,39)=0.99, p=0.40 (Figure 13.2) and AUTC,
F (3,43)=1.60, p=0.20 showed no statistical difference. We suspect this lack of signif-
icant is due to the small data. When data is analyzed in aggregate later, significant
differences are found. Even though significant differences are not found, an interesting
difference between the trends for Muir and AUTC data can be immediately observed.
While the Muir ratings are similar for Reliability B, C, and D, the AUTC ratings for
Reliability B and much lower than those of Reliability C and D. This difference between
the Muir and AUTC ratings shows that real-time trust is more sensitive to changes in
reliability.
8.5.2 Effect on Control Allocation
A one-way ANOVA for autonomy mode switches across Reliability was significant,
F (3,44)=3.03, p<0.05 (Figure 13.3). A post hoc Tukey’s HSD test showed that the
number of autonomy mode switches in Reliability B (µ=5.08, �=3.39) was significantly
higher than Reliability A (µ=1.58, �=1.24, p<0.05). More autonomy mode switches
in Reliability B highlight the possibility that early periods of low reliability in the
86

2
4
6
8
10
12
14
16
18
20
Hits
A B C D
Reliability
0
100
200
300
400
500
600
700
800
Time
A B C D
Reliability
0
0.5
1
1.5
2
2.5
Wro
ng tu
rns
A B C D
Reliability
Figure 8.8: The performance metics across the different reliability conditions. Left toright: Hits, run time, and wrong turns.
interaction can lead to operator confusion. We speculate that the increase in autonomy
mode switches was not to achieve a better control allocation strategy, due to the lack
of a significant difference in the control allocation strategy1, F (3,43)=0.24, p=0.86.
8.5.3 Performance
Performance was measured using three different metrics: the total weighted collisions
(hits), time required to finish a run (time), and the total number of wrong turns for
each run (wrong turns). Since Reliability A had higher reliability throughout the run,
we expected the performance to be better for Reliability A. However, no significant
differences were found for hits, F (3,44)=0.34, p=0.78, time, F (3,44)=0.32, p=0.80,
and wrong turn, F (3,44)=1.82, p=0.15 (Figure 13.4). While the means for performance
metrics were better for Reliability A, the difference was not significant.
We also looked at the number of wrong turns in the robot assisted mode (MER:
manual errors) and the number of wrong turns in the fully autonomous mode (AER:1The control allocation strategy for participants was judged based on the difference between their
control allocation and the ideal control allocation. The ideal strategy resulted in a score of 17 (sincethere were 17 gates).
87
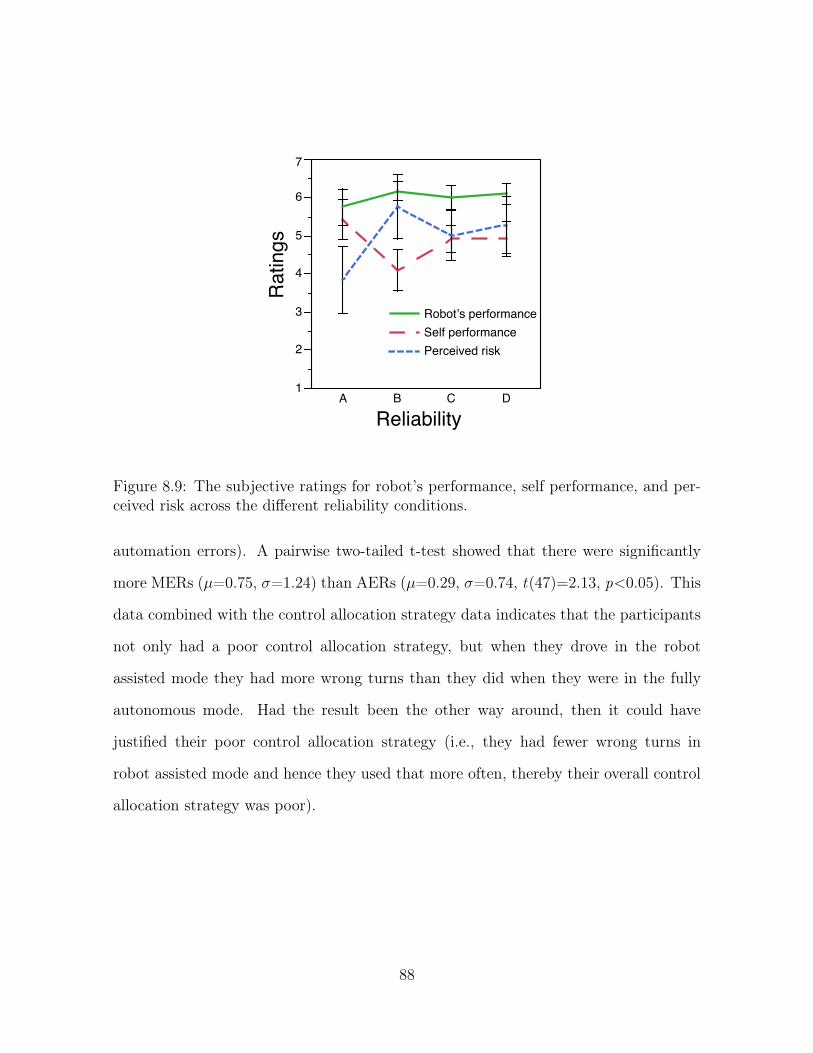
1
2
3
4
5
6
7
Rat
ings
A B C D
Reliability
Robot’s performanceSelf performancePerceived risk
Figure 8.9: The subjective ratings for robot’s performance, self performance, and per-ceived risk across the different reliability conditions.
automation errors). A pairwise two-tailed t-test showed that there were significantly
more MERs (µ=0.75, �=1.24) than AERs (µ=0.29, �=0.74, t(47)=2.13, p<0.05). This
data combined with the control allocation strategy data indicates that the participants
not only had a poor control allocation strategy, but when they drove in the robot
assisted mode they had more wrong turns than they did when they were in the fully
autonomous mode. Had the result been the other way around, then it could have
justified their poor control allocation strategy (i.e., they had fewer wrong turns in
robot assisted mode and hence they used that more often, thereby their overall control
allocation strategy was poor).
88

8.5.4 Subjective Ratings
No significant differences were observed for self performance ratings, F (3,43)=1.36,
p=0.26, robot’s performance ratings, F (3,43)=0.28, p=0.83, and the perceived risk,
F (3,43)=1.09, p=0.36 (Figure 13.5). However, a significant strong negative correlation
was observed between self performance rating and the perceived risk, r=-0.64, p<0.01.
This is similar to the results found for the DR experiments, where participants blamed
themselves for the overall poor performance.
89

Chapter 9
Impact of Feedback1
It is important to understand how trust and control allocation strategies interact with
other factors and impact performance. However, when inadequacies are detected, they
should be addressed to prevent accidents and poor performance. Hence, it is also
important to find means to influence operator trust and control allocation strategy,
should the need arise. Research exists where participants were provided information
about results of past decisions [Dzindolet et al., 2003]; however, to our knowledge, no
research exists that investigates the impact of providing information about the auto-
mated system’s confidence in its own sensors. Therefore, the research team at CMU, led
by Dr. Aaron Steinfeld, conducted experiments to investigate the impact of providing
confidence information on trust and control allocation. This experiment was based on
the RT experiment described in Chapter 8, with only minor modifications to the user
interface described in the next section.
The goal of this experiment was to investigate if operator behavior (trust, control1Parts of this chapter appear is a paper jointly authored with Poornima Kaniarasu, Mikhail
Medvedev, Dr. Aaron Steinfeld and Dr. Holly Yanco [Desai et al., 2013]. Unless explicitly noted,the data analysis was performed at UML.
90
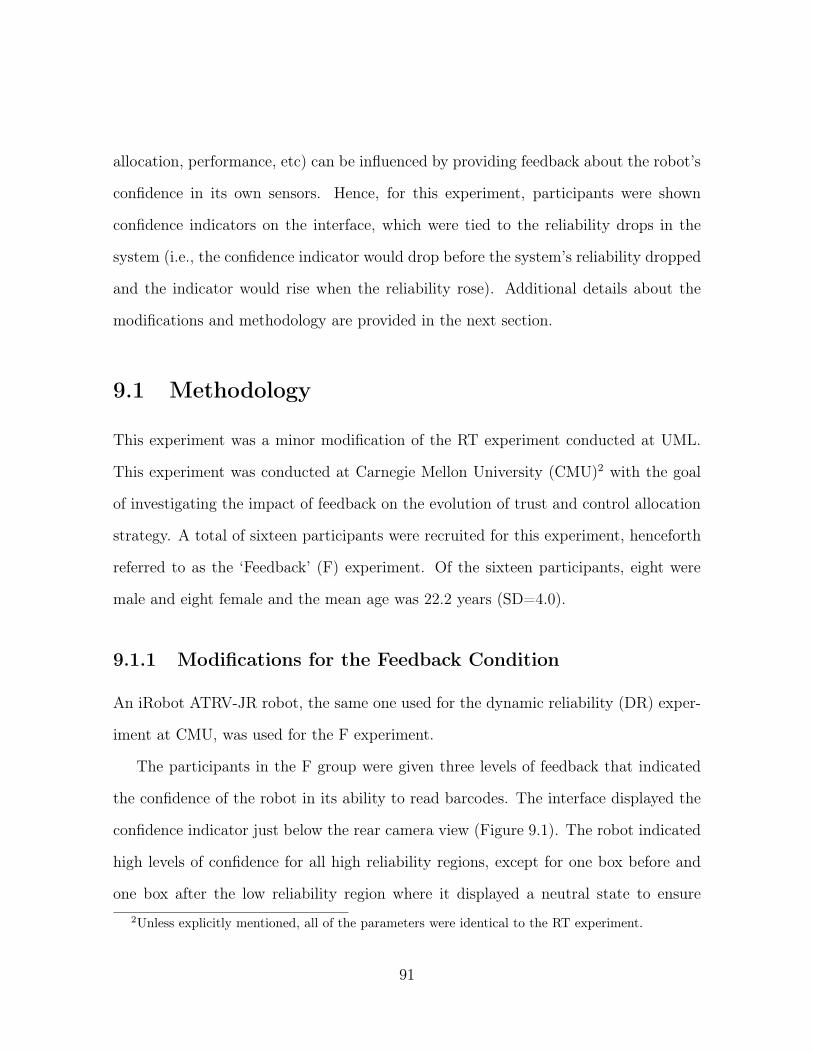
allocation, performance, etc) can be influenced by providing feedback about the robot’s
confidence in its own sensors. Hence, for this experiment, participants were shown
confidence indicators on the interface, which were tied to the reliability drops in the
system (i.e., the confidence indicator would drop before the system’s reliability dropped
and the indicator would rise when the reliability rose). Additional details about the
modifications and methodology are provided in the next section.
9.1 Methodology
This experiment was a minor modification of the RT experiment conducted at UML.
This experiment was conducted at Carnegie Mellon University (CMU)2 with the goal
of investigating the impact of feedback on the evolution of trust and control allocation
strategy. A total of sixteen participants were recruited for this experiment, henceforth
referred to as the ‘Feedback’ (F) experiment. Of the sixteen participants, eight were
male and eight female and the mean age was 22.2 years (SD=4.0).
9.1.1 Modifications for the Feedback Condition
An iRobot ATRV-JR robot, the same one used for the dynamic reliability (DR) exper-
iment at CMU, was used for the F experiment.
The participants in the F group were given three levels of feedback that indicated
the confidence of the robot in its ability to read barcodes. The interface displayed the
confidence indicator just below the rear camera view (Figure 9.1). The robot indicated
high levels of confidence for all high reliability regions, except for one box before and
one box after the low reliability region where it displayed a neutral state to ensure2Unless explicitly mentioned, all of the parameters were identical to the RT experiment.
91

Figure 9.1: The user interface used for the Feedback experiment. The emoticon usedto indicate high confidence in the robot’s sensors is shown below the rear view video.
a gradual transition between the reliability levels. Participants were either provided
semantic feedback (emoticons) or non-semantic feedback (color coded icons). Partici-
pants who experienced semantic feedback (F:S) were shown emoticons to represent the
confidence levels, whereas participants who experienced non-semantic feedback (F:NS)
were shown green, white and pink lights to indicate high, neutral and low level of confi-
dence, respectively. The indicators also had a plus sign for high level and a minus sign
for low level of confidence embedded in the circle (Figure 9.2). The signs were added
to take color-blind participants into consideration.
Apart from minor differences between the RT and F experiments, the underlying
structure for RT and F was similar and similar behavior was observed across both
groups. For this reason, the data is reported in aggregate when appropriate and, when
92

Non-semantic
Semantic
High Neutral
Confidence Level
Low
Figure 9.2: Semantic and non-semantic indicators. The icons for semantic feedbackhad yellow backgrounds. The high confidence icon for non-semantic feedback had agreen background and the low confidence icon for non-semantic feedback had a pinkbackground.
differences between the two were observed, these differences are highlighted. However,
not all of the data and accompanying analyses are presented here, since this chap-
ter focuses solely on the impact of confidence feedback on operator trust and control
allocation strategy. Additional data and analysis is presented in Chapter 12.
9.2 Results and Discussion
Data from the practice and baseline runs were not included in the analyses. We checked
for practice effects (run order) and map effects and did not find any issues. This lack
of significant differences for run and map effect suggests the counterbalancing and map
designs were adequate.
9.2.1 Effect on Trust
Participants were asked to answer the Muir trust questionnaire [Muir, 1989] after each
run. To analyze the impact of reliability drops on participants’ trust of the robot, a
93

Rea
l-tim
e tru
st
0
3
6
9
0
3
6
9
RT
FExperim
ent
1 2 3 4 5 6 7 8 9 10 11 12 13 14 15 16 17Gates
A B C D
B1 B1
C1D1
C1D1
B2C2
B2C2
D2 D2
Figure 9.3: The evolution of trust. The graph shows the average real-time trust ratingsfor the two groups.
two-way ANOVA for trust was conducted. It yielded a significant main effect of Reliabil-
ity, F (3,103)=4.49, p<0.01. However, the main effect of Experiment3, F (1,103)=0.05,
p=0.81 and the interaction of Reliability and Experiment type was not significant,
F (3,103)=0.24, p=0.86. Post hoc comparisons for Reliability using Tukey’s HSD test
indicated that the trust values for Reliability A (µ=7.59, �=1.82) were significantly
higher (higher values indicate more trust) than Reliability B (µ=5.83, �=2.34, p<0.05),
C (µ=5.97, �=2.03, p<0.05), and D (µ=5.79, �=1.95, p<0.05) (Figure 9.4). The data
indicates that the participants’ trust of the robot was higher when the robot operated
reliably and lower when the robot’s reliability dropped during the runs. However, the
Muir trust questionnaire was not able to discern between the different reliability con-
ditions and confirms the findings of our earlier experiments described in Chapters 6, 7,
and 8.
The AUTC data highlights the impact of timing of low reliability periods on trust.3The data from both conditions within the Feedback experiment (semantic and non-semantic feed-
back) are presented in aggregate and no analysis differentiating them is presented in this thesis.
94

0
1
2
3
4
5
6
7
8
Trus
t (M
uir)
F RT F RT F RT F RTA B C D
Experiments within Reliability
0
20
40
60
80
100
120
Trus
t (AU
TC)
F RT F RT F RT F RTA B C D
Experiments within Reliability
Figure 9.4: Left: Muir trust ratings for both experiments across all reliability conditions.Right: Muir trust ratings for both experiments across all reliability conditions. Themean values are shown along with ± 1 standard error.
Figure 9.4 shows the mean AUTC values along with Muir trust values. A two-way
ANOVA for AUTC yielded a significant main effect of Reliability, F (3,99)=5.66, p<0.01;
however, the main effect of Experiment was not significant, F (1,99)=0.54, p=0.46.
The interaction of Reliability and Experiment was also not significant, F (3,99)=0.03,
p=0.99. Post hoc comparison for Reliability using Tukey’s HSD test indicated that the
trust values for Reliability A (µ=92.0, �=45.7) were significantly higher than Reliabil-
ity B (µ=32.7, �=58.7, p<0.01) and C (µ=52.3, �=54.9, p<0.05), but not D (µ=59.8,
�=50.3, p=0.13) (Figure 9.4). This data indicates that real-time trust follows the same
pattern across reliability conditions for both experiments, further validating the exper-
imental methodology used to collect real-time trust data. It also implies that AUTC is
not impacted by feedback.
95
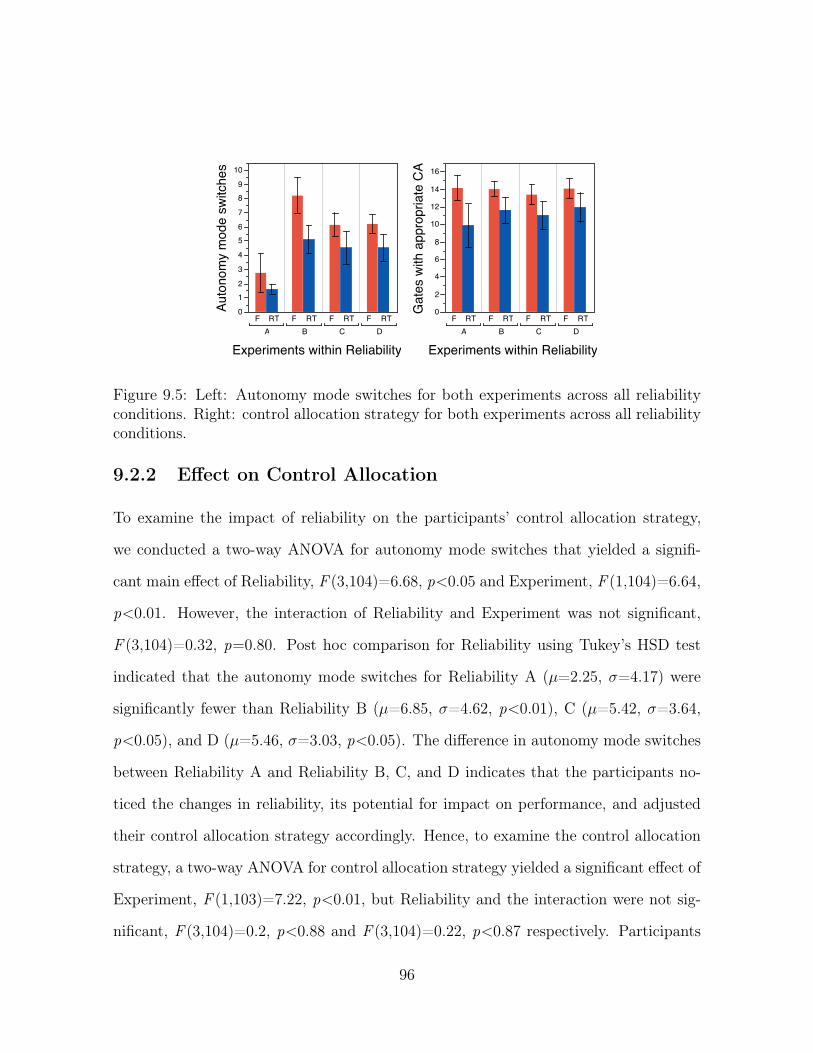
0
1
2
3
4
5
6
7
8
9
10
Auto
nom
y m
ode
switc
hes
F RT F RT F RT F RT A B C D
Experiments within Reliability
0
2
4
6
8
10
12
14
16
Gat
es w
ith a
ppro
pria
te C
A
F RT F RT F RT F RT A B C D
Experiments within Reliability
Figure 9.5: Left: Autonomy mode switches for both experiments across all reliabilityconditions. Right: control allocation strategy for both experiments across all reliabilityconditions.
9.2.2 Effect on Control Allocation
To examine the impact of reliability on the participants’ control allocation strategy,
we conducted a two-way ANOVA for autonomy mode switches that yielded a signifi-
cant main effect of Reliability, F (3,104)=6.68, p<0.05 and Experiment, F (1,104)=6.64,
p<0.01. However, the interaction of Reliability and Experiment was not significant,
F (3,104)=0.32, p=0.80. Post hoc comparison for Reliability using Tukey’s HSD test
indicated that the autonomy mode switches for Reliability A (µ=2.25, �=4.17) were
significantly fewer than Reliability B (µ=6.85, �=4.62, p<0.01), C (µ=5.42, �=3.64,
p<0.05), and D (µ=5.46, �=3.03, p<0.05). The difference in autonomy mode switches
between Reliability A and Reliability B, C, and D indicates that the participants no-
ticed the changes in reliability, its potential for impact on performance, and adjusted
their control allocation strategy accordingly. Hence, to examine the control allocation
strategy, a two-way ANOVA for control allocation strategy yielded a significant effect of
Experiment, F (1,103)=7.22, p<0.01, but Reliability and the interaction were not sig-
nificant, F (3,104)=0.2, p<0.88 and F (3,104)=0.22, p<0.87 respectively. Participants
96
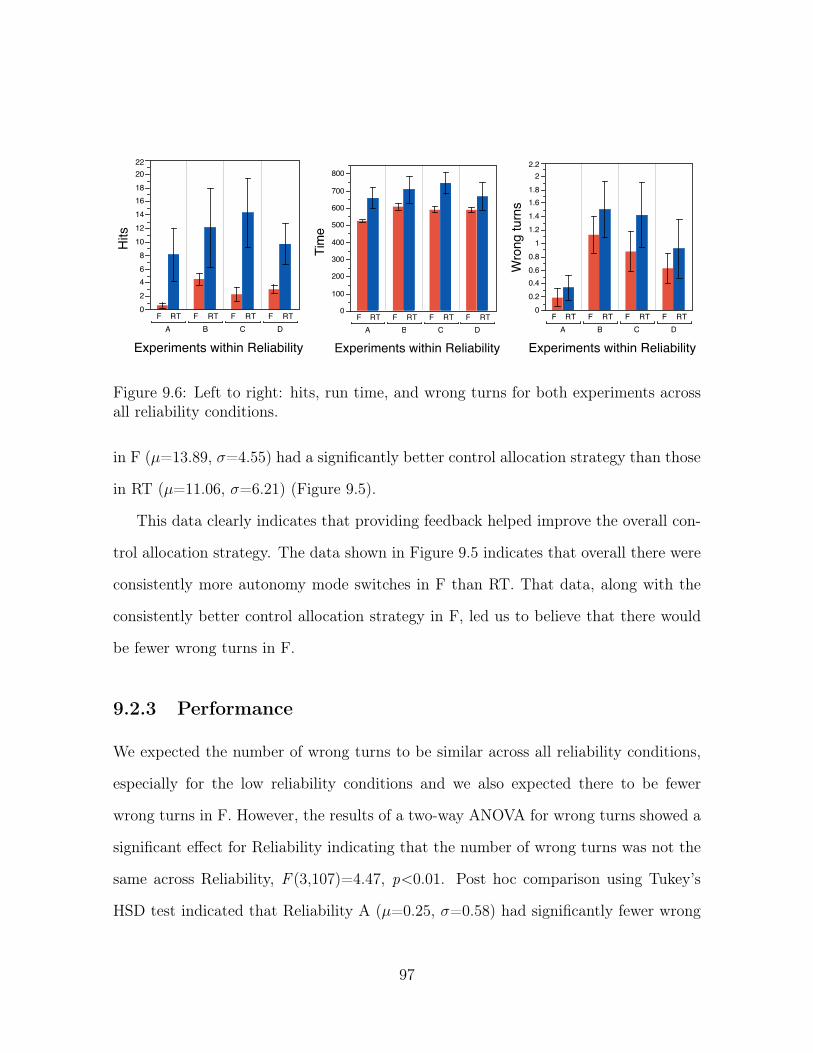
0
2
4
6
8
10
12
14
16
18
20
22
Hits
F RT F RT F RT F RT
A B C D
Experiments within Reliability
0
100
200
300
400
500
600
700
800
Tim
eF RT F RT F RT F RT
A B C D
Experiments within Reliability
0
0.2
0.40.6
0.8
1
1.2
1.4
1.61.8
22.2
Wro
ng tu
rns
F RT F RT F RT F RTA B C D
Experiments within Reliability
Figure 9.6: Left to right: hits, run time, and wrong turns for both experiments acrossall reliability conditions.
in F (µ=13.89, �=4.55) had a significantly better control allocation strategy than those
in RT (µ=11.06, �=6.21) (Figure 9.5).
This data clearly indicates that providing feedback helped improve the overall con-
trol allocation strategy. The data shown in Figure 9.5 indicates that overall there were
consistently more autonomy mode switches in F than RT. That data, along with the
consistently better control allocation strategy in F, led us to believe that there would
be fewer wrong turns in F.
9.2.3 Performance
We expected the number of wrong turns to be similar across all reliability conditions,
especially for the low reliability conditions and we also expected there to be fewer
wrong turns in F. However, the results of a two-way ANOVA for wrong turns showed a
significant effect for Reliability indicating that the number of wrong turns was not the
same across Reliability, F (3,107)=4.47, p<0.01. Post hoc comparison using Tukey’s
HSD test indicated that Reliability A (µ=0.25, �=0.58) had significantly fewer wrong
97

turns than Reliability B (µ=1.28, �=1.24, p<0.01) and C (µ=1.1, �=1.42, p<0.05),
but not D (µ=0.77, �=1.18, p=0.33) (Figure 13.4). The main effect of Experiment and
the interaction between Reliability and Experiment was not significant, F (1,107)=2.34,
p=0.12 and F (3,107)=0.13, p=0.93 respectively.
A two-way ANOVA for time showed a significant main effect for Experiment, F (1,107)
=13.03, p<0.01, but the main effect of Reliability and the interaction between Relia-
bility and Experiment were not significant, F (1,107)=1.17, p=0.32 and F (1,107)=0.29,
p=0.82 respectively (Figure 13.4). A two-way ANOVA for hits showed a significant
main effect for Experiment, F (1,107)=17.38, p<0.01, but the main effect of Relia-
bility and the interaction between Reliability and Experiment were not significant,
F (1,107)=0.85, p=0.46 and F (1,107)=0.35, p=0.78 respectively (Figure 13.4). This
data shows that the overall performance was better for participants in F. Additional
discussion pertaining to these differences is presented in the next section.
9.2.4 Effect of Feedback
As stated at the start of this chapter, we wanted to examine the impact of providing
feedback about the robot’s confidence in its sensors on participants’ trust and control
allocation. The real-time trust data from Section 9.2.1 showed a non-significant effect of
Experiment on AUTC trust. The results from Section 9.2.2 showed a significant effect
of Experiment on control allocation strategy. The results of ANOVA for autonomy
mode switches by Experiment indicated that participants in F (µ=5.81, �=4.63) had
significantly more autonomy mode switches than those in RT (µ=3.91, �=3.33).
Participants who received feedback switched into assisted mode and back signifi-
cantly more to correctly pass gates during low reliability. However, it was also observed
that participants often switched into assisted mode whenever there was a drop in the
98

robot’s confidence, even in high reliability regions when the confidence level changed
from high to neutral. We speculate that these changes were due to participants antic-
ipating a robot failure after seeing the robot’s confidence drop. Overall, this behavior
resulted in fewer wrong turns for F. An unpaired one-tailed t-test was conducted to
verify the effect of Experiment on wrong turns. As expected, the result indicated that
the participants in F (µ=0.7, �=1.00) had fewer wrong turns (marginally significant)
than those in RT (µ=1.06, �=1.42, t(80)=0.41, p=0.08).
Since participants in F were provided with additional information, we expected the
workload for those participants to be higher. An unpaired one tailed t-test showed that
participants in F (µ=3.68, �=118) had significantly higher workload than those in RT
(µ=3.26, �=1.14, t(100)=-1.87, p=0.03).
The feedback experiment when contrasted with the RT experiment shows that infor-
mation about the robot’s confidence can improve control allocation during low reliability
without altering real-time trust levels. However, information should be provided only
when appropriate to avoid unwanted side effects. Therefore, warning users of potential
robot performance drops can be done without negatively impacting trust in the robot.
99
Chapter 10
Reduced Task Difficulty
It is important to investigate how an operator’s trust and control allocation are im-
pacted when a robot’s reliability drops while performing easy tasks. To investigate this
condition, the ‘Reduced Difficulty’ (RD) experiment was conducted, where the diffi-
culty of the task was lowered by reducing the width of the gates, thereby increasing the
clearance on both sides of the gates. The width of the gates was reduced from 0.6m
(24 inches) to 0.2m (8 inches). Since the task was easier to perform in robot assisted
mode, it was expected that the participants would not utilize the fully autonomous
mode as much, especially after a period of low reliability. A decrease in operator trust
was expected with an accompanying decrease in reliance on the fully autonomous mode.
Figure 10.1 shows the course with the narrow gates.
10.1 Results and Discussion
Eleven participants were recruited for the RD experiment. Of the eleven participants,
nine participants were male. The mean age was 29.6 years (SD=7.7). Some of the
100
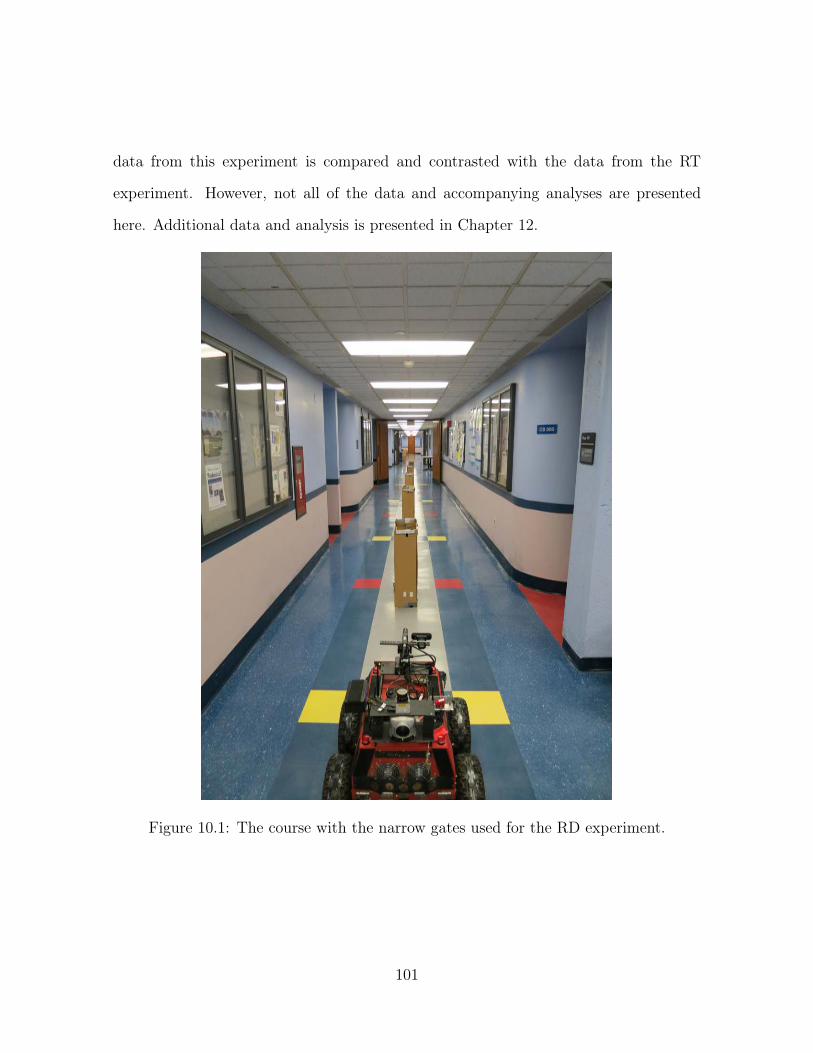
data from this experiment is compared and contrasted with the data from the RT
experiment. However, not all of the data and accompanying analyses are presented
here. Additional data and analysis is presented in Chapter 12.
Figure 10.1: The course with the narrow gates used for the RD experiment.
101
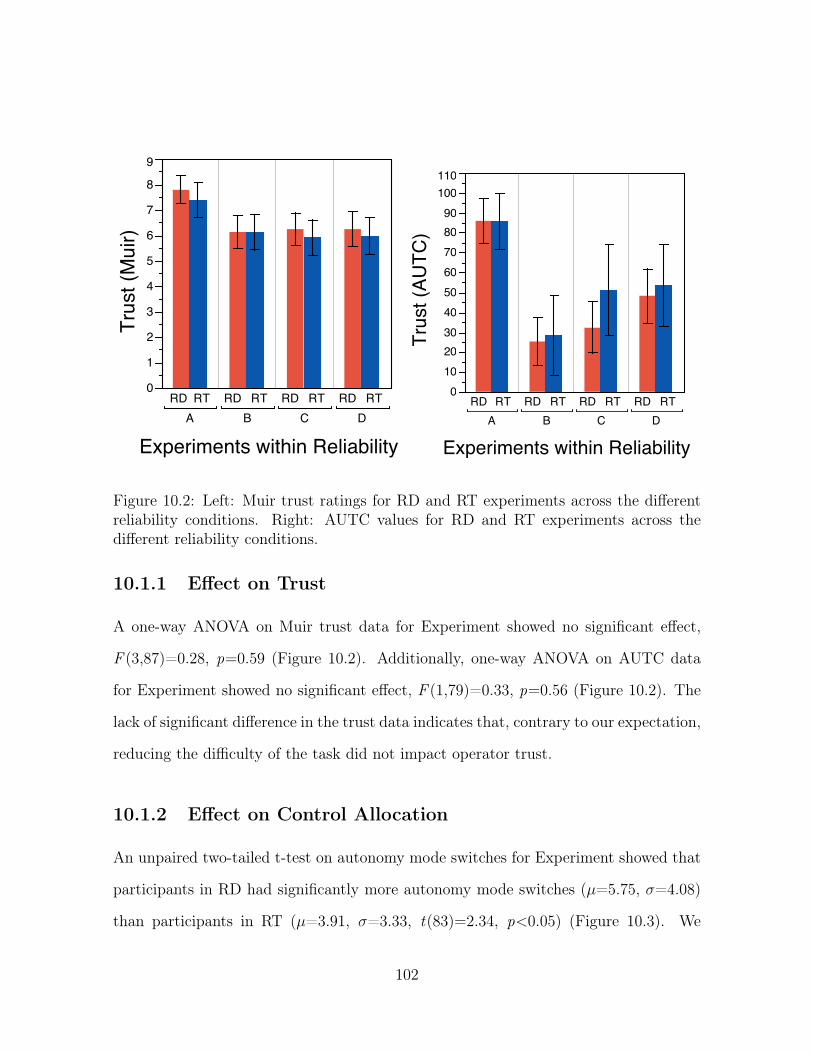
0
1
2
3
4
5
6
7
8
9
Trus
t (M
uir)
RD RT RD RT RD RT RD RTA B C D
Experiments within Reliability
0
10
2030
40
50
60
70
8090
100110
Trus
t (AU
TC)
RD RT RD RT RD RT RD RTA B C D
Experiments within Reliability
Figure 10.2: Left: Muir trust ratings for RD and RT experiments across the differentreliability conditions. Right: AUTC values for RD and RT experiments across thedifferent reliability conditions.
10.1.1 Effect on Trust
A one-way ANOVA on Muir trust data for Experiment showed no significant effect,
F (3,87)=0.28, p=0.59 (Figure 10.2). Additionally, one-way ANOVA on AUTC data
for Experiment showed no significant effect, F (1,79)=0.33, p=0.56 (Figure 10.2). The
lack of significant difference in the trust data indicates that, contrary to our expectation,
reducing the difficulty of the task did not impact operator trust.
10.1.2 Effect on Control Allocation
An unpaired two-tailed t-test on autonomy mode switches for Experiment showed that
participants in RD had significantly more autonomy mode switches (µ=5.75, �=4.08)
than participants in RT (µ=3.91, �=3.33, t(83)=2.34, p<0.05) (Figure 10.3). We
102

0
2
4
6
8
10
12
14
16
Gat
es w
ith a
ppro
pria
te C
A
RD RT RD RT RD RT RD RT A B C D
Experiments within Reliability
0
1
2
3
4
5
6
7
8
910
Mod
e sw
itche
sRD RT RD RT RD RT RD RT
A B C D
Experiments within Reliability
Figure 10.3: Left: Control allocation for RD and RT experiments. Right: Autonomymode switches for RD and RT experiments.
suspect participants in RD switches autonomy modes more often in order to improve
their control allocation strategy (ensure that they were in ideal autonomy mode at
all times), as seen by the improvement in the control allocation strategy in RD. An
unpaired two-tailed t-test for control allocation strategy showed that participants in
RD (µ=13.29, �=5.46) had a better control allocation strategy (marginally significant)
than the participants in RT (µ=11.06, �=6.21, t(88)=1.82, p<0.07) (Figure 10.3). A
post hoc power analysis showed that four more participants would be needed to achieve
statistical significance. The control allocation data indicates that participants in RD
had a better control allocation strategy than those in RT. There was an increase in
autonomy mode switches in order to achieve better control allocation. However, we
suspect that the easier task allowed the operators to switch more and thereby improve
their control allocation strategy.
103

10.1.3 Performance
An unpaired two-tailed t-test for hits showed that participants in RD (µ=2.02, �=2.77)
had significantly fewer hits than participants in RT (µ=11.02, �=15.54, t(50)=-3.94,
p<0.01) (Figure 10.4).
An unpaired two-tailed t-test for time also showed that participants in RD (µ=554.95,
�=54.63) took significantly less time than participants in RT (µ=692.72, �=243.35,
t(52)=-3.81, p<0.01).
An unpaired two-tailed t-test for wrong turns showed that participants in RD
(µ=0.4, �=0.58) had significantly fewer wrong turns than participants in RT (µ=1.04,
�=1.41, t(63)=-2.84, p<0.01).
These results combined together indicate that participants in RD performed signif-
icantly better than those participants in RT due to the reduced difficulty of the task.
10.1.4 Subjective Ratings
Based on the significantly improved performance observed in RD, we expected the
perceived risk to be lower for participants in RD compared to RT. An unpaired one-
tailed t-test showed that participants in RD (µ=4.04, �=2.4) significantly rated their
perceived risk to be lower than those participants in RT (µ=4.95, �=2.7, t(88)=-1.67,
p<0.05) (Figure 10.4).
An unpaired two-tailed t-test for self-performance rating showed that participants
in RD (µ=5.72, �=1.37) rated their performance significantly higher than those in
RT (µ=4.82, �=1.65, t(87)=2.82, p<0.01). An unpaired two-tailed t-test for robot-
performance rating showed no significant difference. This data indicates that the par-
ticipants did not view the robot’s performance to be worse when the task was easier to
104
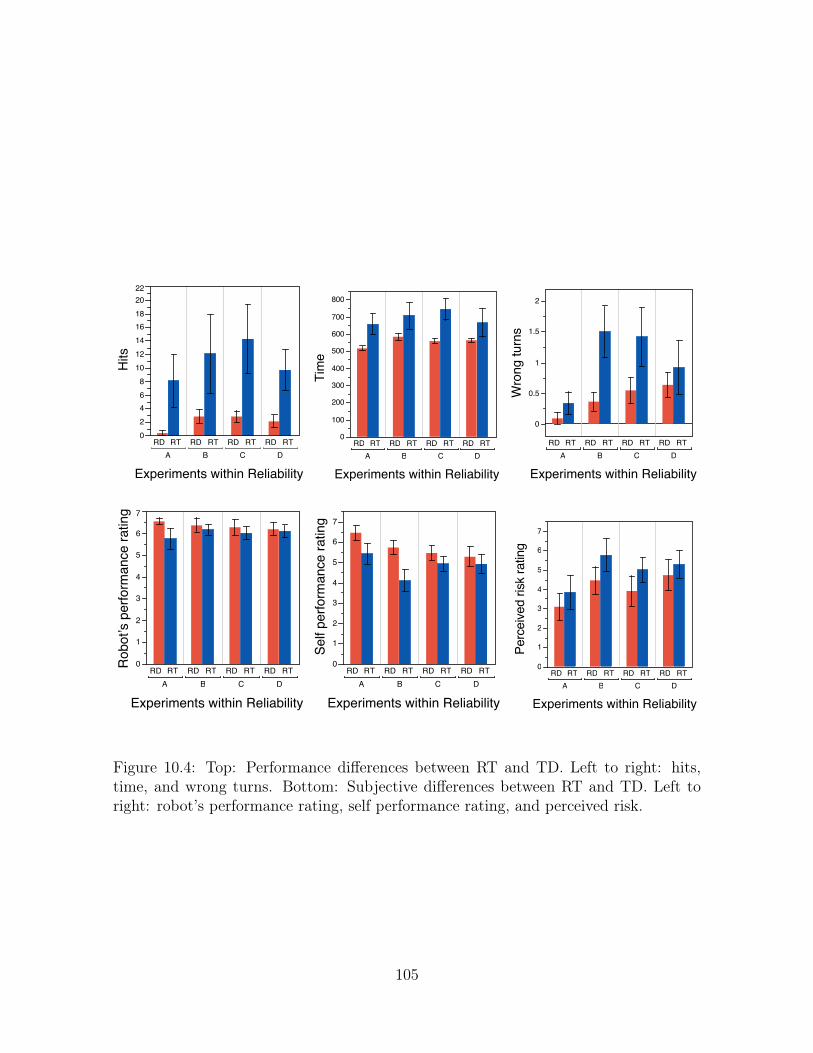
0
2
4
6
8
10
12
14
16
18
20
22
Hits
RD RT RD RT RD RT RD RT
A B C D
Experiments within Reliability
0
100
200
300
400
500
600
700
800
Tim
e
RD RT RD RT RD RT RD RTA B C D
Experiments within Reliability
0
0.5
1
1.5
2
Wro
ng tu
rns
RD RT RD RT RD RT RD RTA B C D
Experiments within Reliability
0
1
2
3
4
5
6
7
Rob
ot’s
per
form
ance
ratin
g
RD RT RD RT RD RT RD RTA B C D
Experiments within Reliability
0
1
2
3
4
5
6
7
Self
perfo
rman
ce ra
ting
RD RT RD RT RD RT RD RTA B C D
Experiments within Reliability
0
1
2
3
4
5
6
7Pe
rcei
ved
risk
ratin
g
RD RT RD RT RD RT RD RTA B C D
Experiments within Reliability
Figure 10.4: Top: Performance differences between RT and TD. Left to right: hits,time, and wrong turns. Bottom: Subjective differences between RT and TD. Left toright: robot’s performance rating, self performance rating, and perceived risk.
105

perform.
The goal of this experiment was to investigate how trust and control allocation
would be impacted when a robot’s reliability drops while performing tasks that are
easy to perform manually. Hence, the RD experiment with an easier teleoperation task
was conducted. A decrease in trust was expected since the participants were expected
to prefer to perform the task on their own, yet no significant difference in trust (Muir
and AUTC) was found. Contrary to the expectation, it was found that participants
in RD had a better control allocation strategy than those in RT, perhaps due to the
significantly more autonomy mode switches observed in RD. It was also found that the
participants in RD rated their own performance to be significantly better than those
in RT and they also assessed the perceived risk to be significantly lower in RD. As
expected, participants in RD performed better. They had significantly fewer hits, took
less time, and had significantly fewer wrong turns than participants in RT. And, while
the workload was lower for RD, the difference was not significant. We suspect the lack
of a significant reduction in workload for RD was due to the offset increase in workload
caused by additional autonomy mode switches to maintain better control allocation
strategy.
106

Chapter 11
Long Term Interaction
The previous chapters shed light on how an operator’s behavior is altered due to the
influence of multiple factors. While these experiments were relatively long compared to
typical experiments in human-automation interaction or even human-robot interaction,
they were not conducted over multiple days. It is often conjectured that an operator’s
interaction over longer periods might evolve and hence could be different from their
initial interaction. To investigate the impact of long term interaction, we conducted
the ‘Long Term’ experiment (LT). This chapter presents details of this experiment along
with some of the data from the experiment.
11.1 Methodology
The LT experiment was based on the RT experiment (i.e., no factors were manipulated
other than the reliability conditions). To increase the duration of interaction, the
experiment was conducted on consecutive business days. We opted for consecutive
days to ensure minimal loss of skill for the participants. A complete experiment with a
107
participant consisted of six sessions, each on a different day.
The first session was similar to the RT experiment. It was three hours long and
consisted of two trial runs and five valid runs. The compensation for the first session
was also similar to that of the RT experiment (a maximum of $30).
The remaining sessions were shorter than the first session, each an hour long. Each
session consisted of three valid runs, two of which were Reliability A and the third run
would consist of either Reliability B, C, or D. The selection of the reliability level for
runs was counter-balanced, as was the ordering of the runs. Before the start of sessions
two through six, participants were asked if they needed a quick tutorial for controlling
the robot. None of the participants requested a tutorial. The need for a tutorial was
also not observed by the experimenter during the experiments.
11.1.1 Compensation
Compensation for sessions two through six was based on the same formula as that of
session one. Since the duration of the interaction was shorter, the total compensation
amount was reduced to $15. At the end of all six sessions, they could have earned
at most $105. To provide additional motivation to the participants for finishing all six
sessions, they were also offered a completion bonus. The completion bonus was given to
participants only if they finished all six sessions. The amount of the completion bonus
was equal to the total compensation they had received until then. Hence, including the
completion bonus, the participants could get up to $210 for the entire experiment.
108

11.1.2 Questionnaires
All six sessions were treated as an experiment, so the participants were asked to fill
out the post-experiment questionnaire at the end of each session. In addition to the
questionnaires, the participants were also asked to fill out all of the post-run question-
naires at the end of all runs. After the sixth session, the participants were asked by the
experimenter if they had noticed any patterns or peculiar behavior, in order to assess
the participants’ understanding of the robot’s behavior and reliability levels.
11.1.3 Participants
Conducting the long term experiments was a very difficult and time consuming task.
Logistics for the experiment presented the main problem. Since the experiment had
to be conducted on consecutive business days, it made finding participants difficult. It
also limited the number of participants that could be run per day. However, since this
was a repeated measures design, only eight participants were recruited. Along with the
impact of experience on operator behavior, we also wanted to investigate:
• If there are differences between participants who are familiar with robots and
those who are not.
• If there are differing trends with experience between participants who are familiar
with robots and those who are not.
Four participants were familiar with robots (FR condition), but were not experienced
with remote robot teleoperation; four participants from the general pool of participants,
not as familiar with robots (NFR condition), were also recruited. The participants in the
NFR conditions were similar to participants recruited for all of the other experiments,
109

where the participants were not working with research robots. The mean age of the
participants was 20.7 years (SD=3.24). The mean age of the participants for the NFR
condition was 19.2 years (SD=0.95) and the mean age of the participants for the FR
condition was 22.25 years (SD=4.19). Of the eight participants, three were female, two
of whom were in the FR condition. Not all of the data and accompanying analyses are
presented in this chapter; additional data and analysis is presented in Chapter 12.
11.2 Effect on Trust
Trust was measured using the post-run questionnaire (Muir trust) and the area under
the trust curve metric (AUTC). The results from these sections are presented below.
For all of the metrics presented in this chapter, data was analyzed to examine if there
was a difference between sessions, a difference between the two participant groups (FR
vs NFR), and any differences between the sessions for the two participant groups.
11.2.1 Muir
To analyze the impact of experience over multiple sessions, a one-way ANOVA on Muir
trust data across Sessions was conducted. It showed no significant effect. We also
conducted an equivalence test between all pairs of Sessions and found no significant
results (� = 1.0), indicating that none of the sessions had statistically equivalent
results. Equivalence tests were conducted to examine if the values remained within
constant (within the specified delta) across sessions.
An unpaired two-tailed t-test for Muir between the two participant groups showed
that NFR participants (µ=8.88, �=0.78) trusted the robot significantly more than the
FR participants (µ=6.26, �=2.18, t(98)=10.03, p<0.01) (Figure 11.1).
110

0
1
2
3
4
5
6
7
8
910
Trus
t (M
uir)
FRN
FR FRN
FR FRN
FR FRN
FR FRN
FR FRN
FR
1 2 3 4 5 6Participant groups across Sessions
Figure 11.1: Muir trust across sessions for both participant groups.
To analyze the impact of experience on the two groups of participants, a one-way
ANOVA on the Muir trust data across Sessions for both groups was conducted. It
showed no significant effect for the FR group. However, the result of the one-way
ANOVA was significant for the NFR group, F (5,72)=3.43, p<0.01. A post hoc Tukey’s
HSD test showed that Muir trust values for Session 1 (µ=8.32, �=0.74) were signifi-
cantly lower than those in Session 4 (µ=9.25, �=0.68, p<0.05) and 6 (µ=9.16, �=0.65,
p<0.05) (Figure 11.1). The difference between Session 1 and other sessions was often
found and is reported in the following sections. However, this difference was primarily
due to the fact that Session 1 had four runs, three of which were in low reliability,
whereas Sessions 2 through 6 only had one run with low reliability.
Interestingly, while the FR group did not show any significant differences, the trust
values for the different sessions were also not found to be statistically equivalent either
(� = 1.0). On the other hand, for the NFR group, the trust values for all pairs of
111
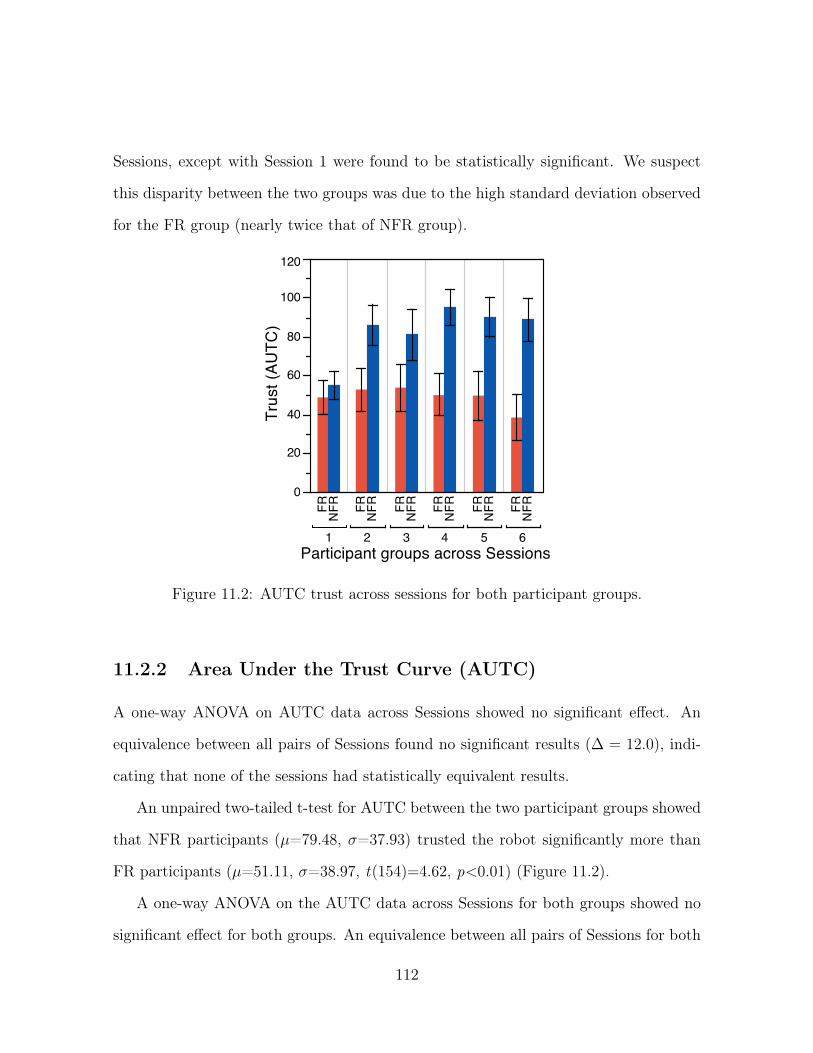
Sessions, except with Session 1 were found to be statistically significant. We suspect
this disparity between the two groups was due to the high standard deviation observed
for the FR group (nearly twice that of NFR group).
0
20
40
60
80
100
120Tr
ust (
AUTC
)
FRN
FR FRN
FR FRN
FR FRN
FR FRN
FR FRN
FR1 2 3 4 5 6
Participant groups across Sessions
Figure 11.2: AUTC trust across sessions for both participant groups.
11.2.2 Area Under the Trust Curve (AUTC)
A one-way ANOVA on AUTC data across Sessions showed no significant effect. An
equivalence between all pairs of Sessions found no significant results (� = 12.0), indi-
cating that none of the sessions had statistically equivalent results.
An unpaired two-tailed t-test for AUTC between the two participant groups showed
that NFR participants (µ=79.48, �=37.93) trusted the robot significantly more than
FR participants (µ=51.11, �=38.97, t(154)=4.62, p<0.01) (Figure 11.2).
A one-way ANOVA on the AUTC data across Sessions for both groups showed no
significant effect for both groups. An equivalence between all pairs of Sessions for both
112

participant groups found no significant results (� = 12.0), indicating that none of the
sessions for both groups of participants had statistically equivalent results.
Similar results were observed for both Muir and AUTC trust values. No difference
was found between Sessions (2-6) when the data from the two participant groups was
analyzed together or separately. The lack of equivalence for most of the analyses in-
dicates that there are minor variations in trust ratings across sessions. This lack of a
difference and equivalence indicates that the trust does not significantly change over an
extended period of interaction, nor does it stay constant, respectively.
11.3 Effect on Control Allocation
Control allocation was analyzed using two metrics: the number of mode switches and
the number of gates passed in the correct autonomy mode (control allocation strategy).
11.3.1 Mode switches
A one-way ANOVA across Sessions showed a significant effect, F (5,151)=2.35, p<0.05.
However, a post hoc Tukey’s HSD test showed no significant difference between sessions.
An equivalence test between all pairs of Sessions found significant results (� = 2.0) for
all pairs of sessions except with Session 1, indicating that the number mode switches
were similar across Sessions two through six.
An unpaired two-tailed t-test between the two participant groups showed that NFR
participants (µ=4.12, �=2.58) had significantly more mode switches than FR partici-
pants (µ=3.15, �=2.13, t(149)=2.58, p<0.05) (Figure 11.3).
A one-way ANOVA on Sessions for both groups showed no significant effect for both
groups. A equivalence test for the FR group showed significant results for all pairs of
113

sessions except with Session 1. A similar equivalence test for the NFR group showed
equivalence between Sessions 2, 4, 5, and 6.
These results show that while there was a significant difference between the partic-
ipants groups, their behavior was consistent over the extended period of interaction.
0
1
2
3
4
5
6
7
Mod
e sw
itche
s
FRN
FR FRN
FR FRN
FR FRN
FR FRN
FR FRN
FR
1 2 3 4 5 6
Participant groups across Sessions
0
2
4
6
8
10
12
14
16
18
Num
ber o
f gat
es w
ith a
ppro
pria
te C
A
FRN
FR FRN
FR FRN
FR FRN
FR FRN
FR FRN
FR
1 2 3 4 5 6
Participant groups across Sessions
Figure 11.3: Left: Mode switches. Right: Control allocation strategy.
11.3.2 Control Allocation Strategy
A one-way ANOVA across Sessions showed no significant effect. An equivalence test
showed significant results (� = 2.0) for all pairs of sessions except with Session 6. The
lack of similarity with Session six was observed because Participants 2 and 8 (both from
the NFR group) drove the robot in robot assisted mode for the last run. When asked
about this behavior, both participants mentioned that this was their last run, so they
wanted to drive the robot on their own.
114

An unpaired two-tailed t-test for control allocation data between the two participant
groups showed that NFR participants (µ=14.97, �=3.12) had a significantly worse con-
trol allocation strategy than FR participants (µ=16.89, �=0.41, t(79)=-5.39, p<0.01)
(Figure 11.3).
A one-way ANOVA on Sessions for both groups showed no significant effect for both
groups. An equivalence test for the FR group showed significant results for all pairs of
Sessions. An equivalence test for the NFR group showed significant results for Sessions
3 vs 1 and Session 5 vs 1. None of the other pairs were significantly equivalent.
Similar to the results of the analysis of the mode switches, the difference between the
participant groups was significant, but the control allocation strategy across sessions
was mostly similar. These results, combined with the mode switches results, indicate
that an operator’s behavior for control allocation does not change over an extended
period of interaction.
11.4 Performance
Participants’ performance was measured using three metrics: the number of hits or
collisions, the time to complete the task, and the number of wrong turns taken. This
section provides details about the analysis of these metrics.
11.4.1 Hits
A one-way ANOVA across Sessions showed no significant effect for hits. An equivalence
test showed significant results (� = 2.0) for all pairs of sessions except with Session 1,
indicating no improvement or decrease in the collisions.
An unpaired two-tailed t-test for hits between the two participant groups showed no
115
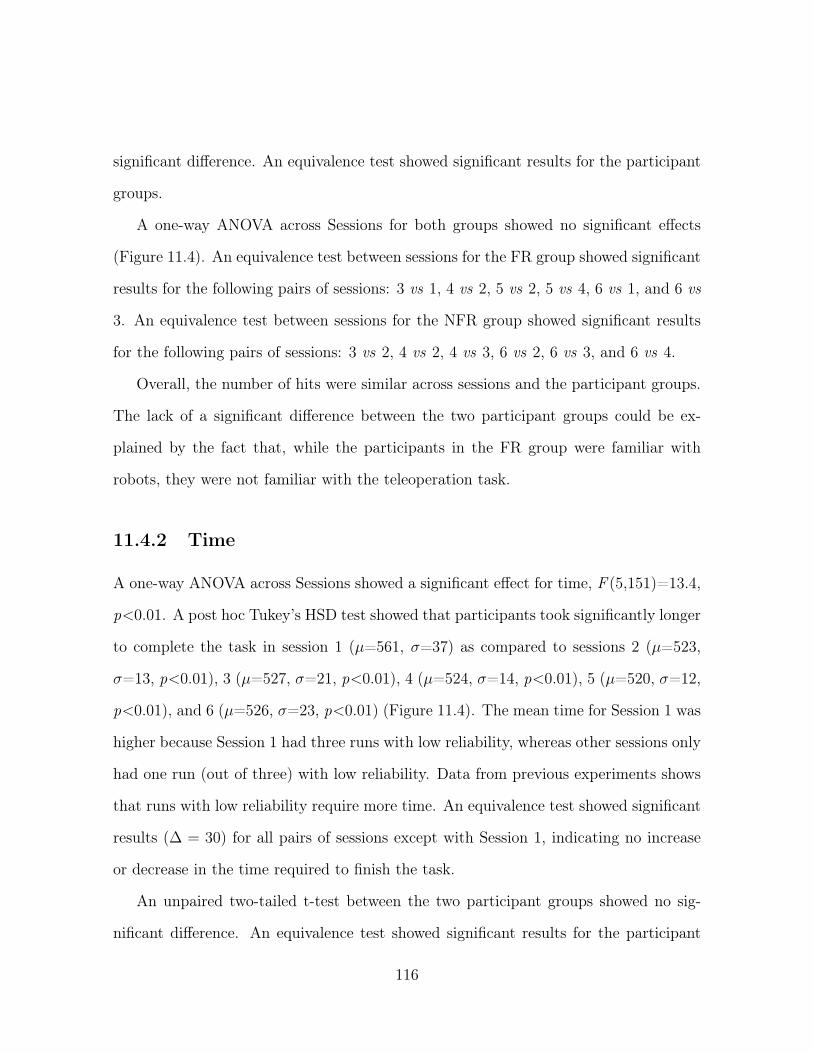
significant difference. An equivalence test showed significant results for the participant
groups.
A one-way ANOVA across Sessions for both groups showed no significant effects
(Figure 11.4). An equivalence test between sessions for the FR group showed significant
results for the following pairs of sessions: 3 vs 1, 4 vs 2, 5 vs 2, 5 vs 4, 6 vs 1, and 6 vs
3. An equivalence test between sessions for the NFR group showed significant results
for the following pairs of sessions: 3 vs 2, 4 vs 2, 4 vs 3, 6 vs 2, 6 vs 3, and 6 vs 4.
Overall, the number of hits were similar across sessions and the participant groups.
The lack of a significant difference between the two participant groups could be ex-
plained by the fact that, while the participants in the FR group were familiar with
robots, they were not familiar with the teleoperation task.
11.4.2 Time
A one-way ANOVA across Sessions showed a significant effect for time, F (5,151)=13.4,
p<0.01. A post hoc Tukey’s HSD test showed that participants took significantly longer
to complete the task in session 1 (µ=561, �=37) as compared to sessions 2 (µ=523,
�=13, p<0.01), 3 (µ=527, �=21, p<0.01), 4 (µ=524, �=14, p<0.01), 5 (µ=520, �=12,
p<0.01), and 6 (µ=526, �=23, p<0.01) (Figure 11.4). The mean time for Session 1 was
higher because Session 1 had three runs with low reliability, whereas other sessions only
had one run (out of three) with low reliability. Data from previous experiments shows
that runs with low reliability require more time. An equivalence test showed significant
results (� = 30) for all pairs of sessions except with Session 1, indicating no increase
or decrease in the time required to finish the task.
An unpaired two-tailed t-test between the two participant groups showed no sig-
nificant difference. An equivalence test showed significant results for the participant
116

groups.
A one-way ANOVA across Sessions for both groups showed significant differences
for both groups and the data resembled the pattern where Session 1 took significantly
more time than the other sessions for both participant groups. An equivalence test
across sessions for both participant group showed significant results (� = 30) for all
pairs of sessions except with Session 1.
Similar to the analysis of hits, the time required to finish the task was similar
between the participant groups as well as across the sessions.
0
1
2
3
Hits
FR
NF
R
FR
NF
R
FR
NF
R
FR
NF
R
FR
NF
R
FR
NF
R
1 2 3 4 5 6
Participant groups across Sessions
0
100
200
300
400
500
600
Tim
e
FRN
FR FRN
FR FRN
FR FRN
FR FRN
FR FRN
FR
1 2 3 4 5 6
Participant groups across Sessions
0
0.1
0.2
0.3
0.4
Wro
ng tu
rns
FRN
FR FRN
FR FRN
FR FRN
FR FRN
FR FRN
FR
1 2 3 4 5 6
Participant groups across Sessions
Figure 11.4: Left: Hits. Center: Time. Right: Wrong turns.
11.4.3 Wrong Turns
A one-way ANOVA across Sessions showed a significant effect for wrong turns, F (5,151)=2.55,
p<0.05. However, a post hoc Tukey’s HSD test showed no significant differences (Fig-
ure 11.4). An equivalence test showed significant results (� = 0.33) for all pairs of
sessions indicating no improvement or decrease in the number of wrong turns.
An unpaired two-tailed t-test between the two participant groups showed no sig-
117

nificant difference. An equivalence test showed significant results for the participant
groups.
A one-way ANOVA across Sessions for both groups showed no significant effect for
the FR group. However, the result of the one-way ANOVA was significant for the
NFR group, F (5,72)=3.05, p<0.05. However, a post hoc Tukey’s HSD test showed no
significant differences.
An equivalence test between sessions for the FR group showed significant results for
all pairs except the following: 3 vs 4, 3 vs 5, and 3 vs 6. An equivalence test between
sessions for the NFR group showed significant results for all pairs except the following:
1 vs 2, 1 vs 3, 1 vs 3, 1 vs 5, 6 vs 1, 6 vs 2, 6 vs 3, 6 vs 4, and 6 vs 5. Essentially,
Sessions 2 through 5 had similar numbers of wrong turns.
Overall, the performance results show no difference between the two groups, indi-
cating that familiarity with robots does not impact performance. Also, the similarity
across Sessions indicates that the performance remains steady over an extended period
of time.
11.5 Subjective Ratings
This section presents an analysis of workload, performance ratings, and perceived risk,
based on data from questionnaires that participants were asked to answer after each
run.
11.5.1 Workload
A one-way ANOVA across Sessions showed a significant effect for workload, F (5,151)=7.23,
p<0.01. A post hoc Tukey’s HSD test showed that workload was significantly higher for
118

0
1
2
3
4
5
6
7
Rob
ot's
per
form
ance
ratin
g
FRN
FR FRN
FR FRN
FR FRN
FR FRN
FR FRN
FR
1 2 3 4 5 6
Participant groups across Sessions
0
1
2
3
4
5
6
7
Self
perfo
rman
ce ra
ting
FRN
FR FRN
FR FRN
FR FRN
FR FRN
FR FRN
FR
1 2 3 4 5 6
Participant groups across Sessions
1
2
3
4
5
6
7
8
9
10
Perc
eive
d ris
k
FRN
FR FRN
FR FRN
FR FRN
FR FRN
FR FRN
FR
1 2 3 4 5 6
Participant groups across Sessions
1
2
3
Wor
kloa
d (T
LX)
FRN
FR FRN
FR FRN
FR FRN
FR FRN
FR FRN
FR
1 2 3 4 5 6
Participant groups across Sessions
Figure 11.5: Top left: Robot’s performance rating. Top right: Self performance rating.Bottom left: Perceived risk. Bottom right: Workload.
119

session 1 (µ=2.45, �=1.02) than for sessions 2 (µ=1.81, �=0.58, p<0.01), 4 (µ=1.63,
�=0.46, p<0.01), 5 (µ=1.61, �=0.45, p<0.01), and 6 (µ=1.60, �=0.38, p<0.01) (Figure
11.5). An equivalence test showed significant results (� = 1.0) for all pairs of sessions
except with Session 1, indicating no increase or decrease in the workload across sessions.
An unpaired two-tailed t-test between the two participant groups showed that NFR
participants (µ=1.77, �=0.6) had a significantly lower workload than FR participants
(µ=2.04, �=0.89, t(136)=-2.26, p<0.05).
A one-way ANOVA across Sessions for both groups showed a significant effect for the
FR Group, F (5,73)=8.1, p<0.01. A post hoc Tukey’s HSD test showed that workload
was significantly higher for session 1 (µ=2.85, �=1.07) than sessions 2 (µ=1.93, �=0.64,
p<0.05), 4 (µ=1.62, �=0.51, p<0.01), 5 (µ=1.5, �=0.34, p<0.01), and 6 (µ=1.55,
�=0.31, p<0.01). No significant effect was found for the NFR group. An equivalence
test between sessions for the FR group showed significant results for all pairs except
the following: 1 vs 2, 1 vs 4, 3 vs 4, 1 vs 5, 3 vs 5, 1 vs 6, and 3 vs 6. An equivalence
test for the NFR group showed significant results for all pairs of sessions.
The analysis shows that participants familiar with robots showed higher workloads
than participants not familiar with robots. Also, while the workload was consistent
across most sessions, there was an unexplained spike in workload for the FR group in
Session 3. Apart from that anomaly, the workload remained consistent across sessions.
11.5.2 Robot’s Performance Rating
A one-way ANOVA across Sessions showed no significant effect for rating of the robot’s
performance. An equivalence test showed significant results (� = 1.0) for all pairs of
sessions.
An unpaired two-tailed t-test between the two participant groups showed that NFR
120
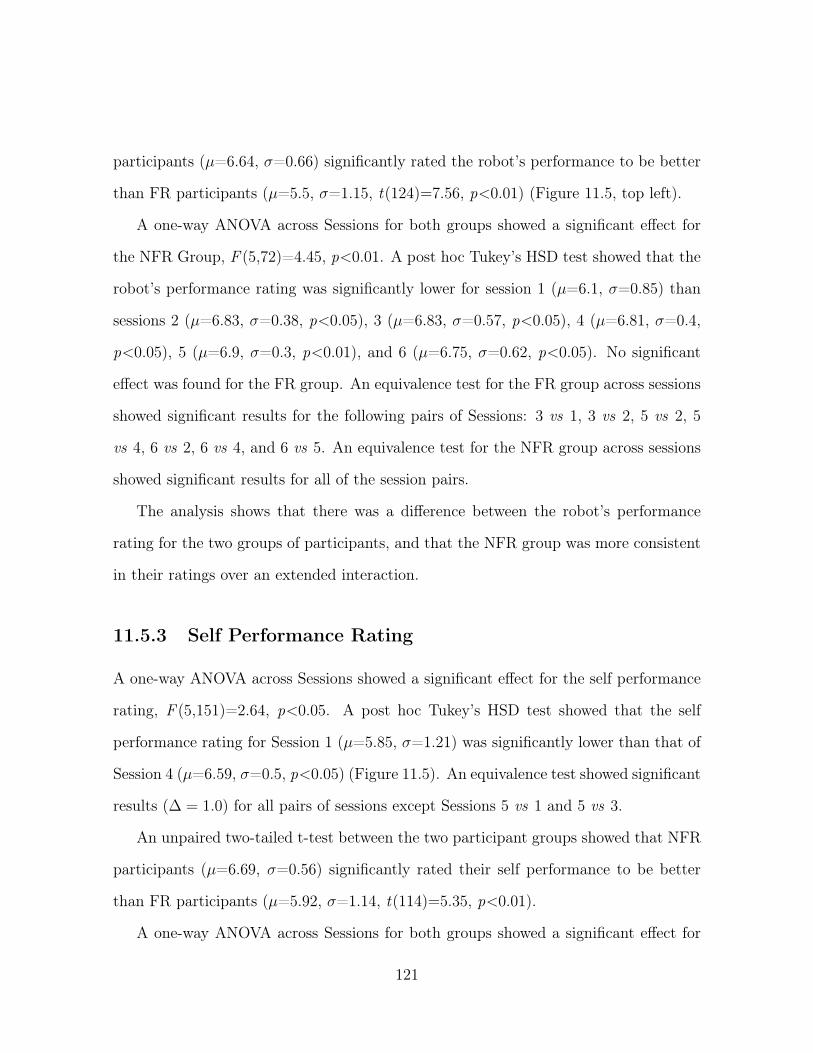
participants (µ=6.64, �=0.66) significantly rated the robot’s performance to be better
than FR participants (µ=5.5, �=1.15, t(124)=7.56, p<0.01) (Figure 11.5, top left).
A one-way ANOVA across Sessions for both groups showed a significant effect for
the NFR Group, F (5,72)=4.45, p<0.01. A post hoc Tukey’s HSD test showed that the
robot’s performance rating was significantly lower for session 1 (µ=6.1, �=0.85) than
sessions 2 (µ=6.83, �=0.38, p<0.05), 3 (µ=6.83, �=0.57, p<0.05), 4 (µ=6.81, �=0.4,
p<0.05), 5 (µ=6.9, �=0.3, p<0.01), and 6 (µ=6.75, �=0.62, p<0.05). No significant
effect was found for the FR group. An equivalence test for the FR group across sessions
showed significant results for the following pairs of Sessions: 3 vs 1, 3 vs 2, 5 vs 2, 5
vs 4, 6 vs 2, 6 vs 4, and 6 vs 5. An equivalence test for the NFR group across sessions
showed significant results for all of the session pairs.
The analysis shows that there was a difference between the robot’s performance
rating for the two groups of participants, and that the NFR group was more consistent
in their ratings over an extended interaction.
11.5.3 Self Performance Rating
A one-way ANOVA across Sessions showed a significant effect for the self performance
rating, F (5,151)=2.64, p<0.05. A post hoc Tukey’s HSD test showed that the self
performance rating for Session 1 (µ=5.85, �=1.21) was significantly lower than that of
Session 4 (µ=6.59, �=0.5, p<0.05) (Figure 11.5). An equivalence test showed significant
results (� = 1.0) for all pairs of sessions except Sessions 5 vs 1 and 5 vs 3.
An unpaired two-tailed t-test between the two participant groups showed that NFR
participants (µ=6.69, �=0.56) significantly rated their self performance to be better
than FR participants (µ=5.92, �=1.14, t(114)=5.35, p<0.01).
A one-way ANOVA across Sessions for both groups showed a significant effect for
121

the NFR Group, F (5,72)=4.13, p<0.01. A post hoc Tukey’s HSD test showed that
the self performance rating was significantly lower for Session 1 (µ=6.25, �=0.78) than
Session 2 (µ=6.83, �=0.38, p<0.05), 3 (µ=6.91, �=0.28, p<0.01), 4 (µ=6.81, �=0.4,
p<0.05), and 5 (µ=6.9, �=0.3, p<0.05). No significant effect was found for the FR
group. An equivalence test for the FR group across sessions showed significant results
for the following pairs of Sessions: 3 vs 1, 4 vs 2, 6 vs 2, and 6 vs 4. An equivalence
test for the NFR group across sessions showed significant results for all of the session
pairs.
The analysis shows that there was a difference between the self performance rating
for the two groups of participants, and that the NFR group was more consistent in
their ratings over an extended interaction. These results are similar to the robot’s
performance ratings presented in the previous section.
11.5.4 Perceived Risk
A one-way ANOVA across Sessions showed a significant effect for perceived risk, F (5,151)=3.94,
p<0.01. A post hoc Tukey’s HSD test showed that the risk for session 1 (µ=3.52,
�=2.14) was significantly higher than that of sessions 4 (µ=1.77, �=1.3, p<0.01) and 5
(µ=1.78, �=1.2, p<0.01) (Figure 11.5). An equivalence test showed significant results
(� = 1.0) for the following pairs of sessions: 3 vs 2, 5 vs 4, and 6 vs 2. This analysis
shows that was some variation between the perceived risk across sessions. No trends in
the data were observed.
An unpaired two-tailed t-test between the two participant groups showed that NFR
participants (µ=1.67, �=1.23) significantly rated the risk to be lower than FR partici-
pants (µ=3.22, �=2.21, t(122)=-5.41, p<0.01).
A one-way ANOVA across Sessions for both groups showed a significant effect for
122
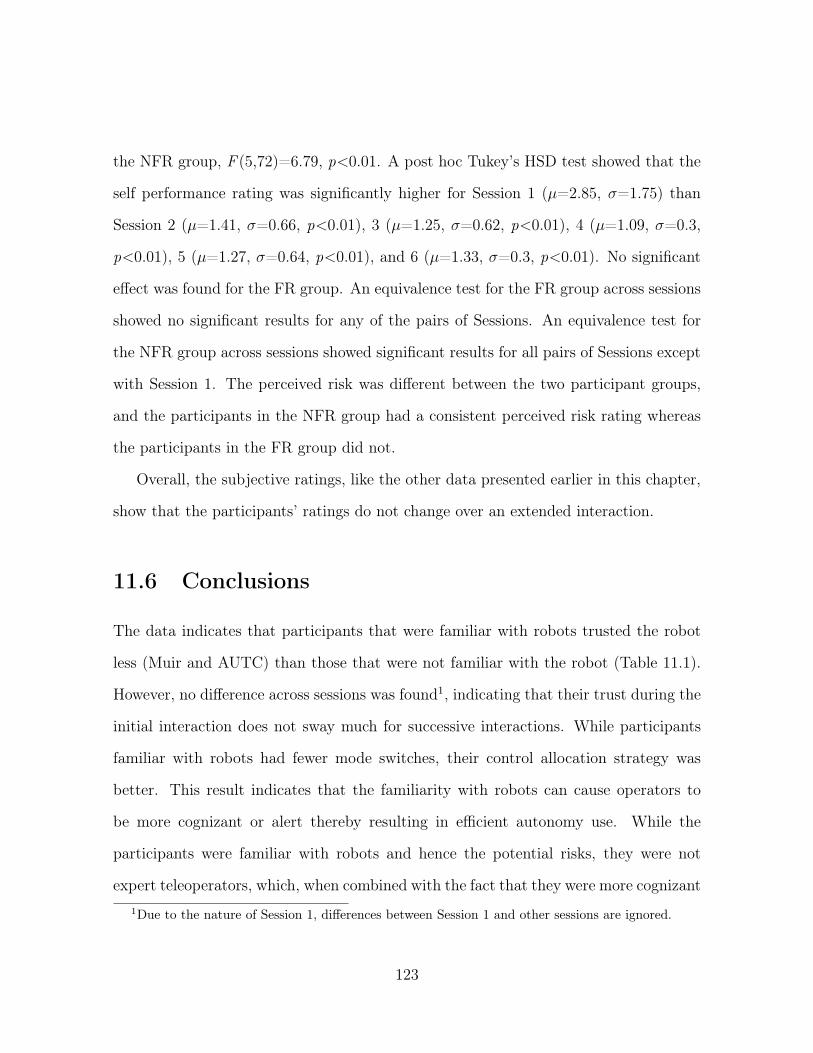
the NFR group, F (5,72)=6.79, p<0.01. A post hoc Tukey’s HSD test showed that the
self performance rating was significantly higher for Session 1 (µ=2.85, �=1.75) than
Session 2 (µ=1.41, �=0.66, p<0.01), 3 (µ=1.25, �=0.62, p<0.01), 4 (µ=1.09, �=0.3,
p<0.01), 5 (µ=1.27, �=0.64, p<0.01), and 6 (µ=1.33, �=0.3, p<0.01). No significant
effect was found for the FR group. An equivalence test for the FR group across sessions
showed no significant results for any of the pairs of Sessions. An equivalence test for
the NFR group across sessions showed significant results for all pairs of Sessions except
with Session 1. The perceived risk was different between the two participant groups,
and the participants in the NFR group had a consistent perceived risk rating whereas
the participants in the FR group did not.
Overall, the subjective ratings, like the other data presented earlier in this chapter,
show that the participants’ ratings do not change over an extended interaction.
11.6 Conclusions
The data indicates that participants that were familiar with robots trusted the robot
less (Muir and AUTC) than those that were not familiar with the robot (Table 11.1).
However, no difference across sessions was found1, indicating that their trust during the
initial interaction does not sway much for successive interactions. While participants
familiar with robots had fewer mode switches, their control allocation strategy was
better. This result indicates that the familiarity with robots can cause operators to
be more cognizant or alert thereby resulting in efficient autonomy use. While the
participants were familiar with robots and hence the potential risks, they were not
expert teleoperators, which, when combined with the fact that they were more cognizant1Due to the nature of Session 1, differences between Session 1 and other sessions are ignored.
123

Between Sessions Between Groups FR sessions NFR sessionsMuir <AUTC <Mode switches <Control Allocation >
HitsTimeWrong turnsTLX >Robot’s performance <Self performance <Risk >
Table 11.1: The significant results from this LT experiment. The significant resultsacross sessions where only session 1 values were found to be different from other sessionsare not presented. The ‘<’ sign indicates that the value was significantly lower for FRthan NFR and ‘>’ indicates the opposite.
of the robot’s performance, led to a higher workload. Participants who were familiar
with robots also judged themselves and the robot more harshly. While differences
between the two groups were observed, no significant difference across sessions was
found, indicating that operator behavior does not significantly change over sustained
discrete interactions in these types of robot operations.
124

Chapter 12
Combined Results
Previous chapters present data from individual experiments and compare them with
the baseline experiment (either DR or RT). In this chapter, the data from the previous
experiments is presented in aggregate1. The data has been analyzed in aggregate to
allow for two distinct set of observations:
• Patterns or differences that are common across all the experiments. This analysis
will be performed across reliability conditions.
• Differences between the LT, F, and RD experiments.
To examine the data based on the two criteria listed above, two-way ANOVAs were
performed on the data, and when significant differences were observed, Tukey’s HSD
test was conducted.1Unless explicitly mentioned, data from the DR and LSA experiments have not been included due
to the differences between the experimental methodologies. As in all of the earlier analyses, data fromthe first run was not included for analysis. The first run was always in high reliability to allow theparticipants to familiarize themselves with the system.
125

0
5
10
15
20
25
30
35
40
45Age
DR LSA RT F RD LT
Experiments0
3
5
8
10
13
DR LSA RT F RD LTGender within Experiments
Cou
nt
FemaleMale
Figure 12.1: The age and gender of participants across experiments.
12.1 Demographics
A total of forty-seven participants were recruited for four experiments. The mean age
was 26.9 years (SD=11.2). Nineteen participants were female, and twenty-eight were
male. The distribution of age and gender across the experiments is shown in Figure
12.1. A one-way ANOVA across experiments showed significant differences in age,
F (3,43)=7.35, p<0.01 (Figure 12.1). A post hoc Tukey’s HSD test showed that partici-
pants in RT (µ=37.4, �=16.32) were significantly older than participants in F (µ=22.2,
�=4.0, p<0.01), LT (µ=20.7, �=3.2, p<0.01), and RD (µ=26.8, �=7.7, p<0.05).
12.1.1 Prior Experience
No statistical difference for prior experience in any of the four categories was found
across experiments. A one-way ANOVA across experiments showed no significant dif-
ferences in robot experience, F (3,43)=0.55, p=0.64, radio-controlled cars, F (3,43)=0.7,
p=0.55, experience with real-time strategy games, F (3,43)=2.1, p=0.1, and first person
126
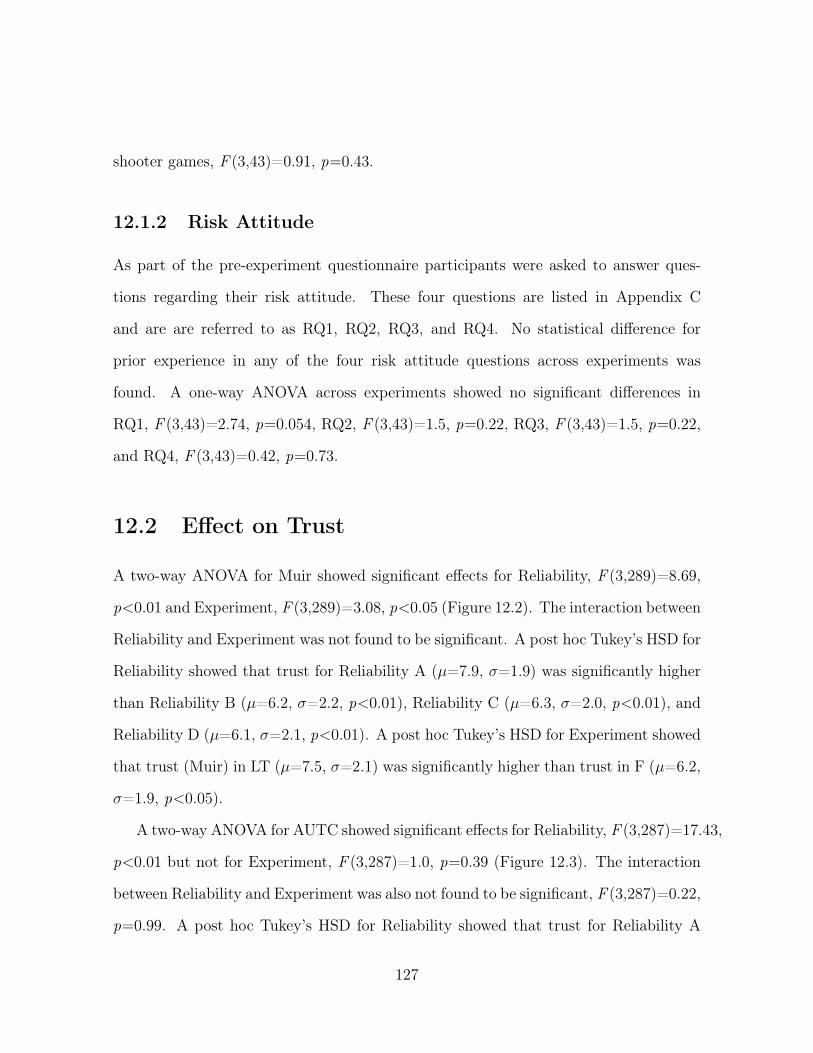
shooter games, F (3,43)=0.91, p=0.43.
12.1.2 Risk Attitude
As part of the pre-experiment questionnaire participants were asked to answer ques-
tions regarding their risk attitude. These four questions are listed in Appendix C
and are are referred to as RQ1, RQ2, RQ3, and RQ4. No statistical difference for
prior experience in any of the four risk attitude questions across experiments was
found. A one-way ANOVA across experiments showed no significant differences in
RQ1, F (3,43)=2.74, p=0.054, RQ2, F (3,43)=1.5, p=0.22, RQ3, F (3,43)=1.5, p=0.22,
and RQ4, F (3,43)=0.42, p=0.73.
12.2 Effect on Trust
A two-way ANOVA for Muir showed significant effects for Reliability, F (3,289)=8.69,
p<0.01 and Experiment, F (3,289)=3.08, p<0.05 (Figure 12.2). The interaction between
Reliability and Experiment was not found to be significant. A post hoc Tukey’s HSD for
Reliability showed that trust for Reliability A (µ=7.9, �=1.9) was significantly higher
than Reliability B (µ=6.2, �=2.2, p<0.01), Reliability C (µ=6.3, �=2.0, p<0.01), and
Reliability D (µ=6.1, �=2.1, p<0.01). A post hoc Tukey’s HSD for Experiment showed
that trust (Muir) in LT (µ=7.5, �=2.1) was significantly higher than trust in F (µ=6.2,
�=1.9, p<0.05).
A two-way ANOVA for AUTC showed significant effects for Reliability, F (3,287)=17.43,
p<0.01 but not for Experiment, F (3,287)=1.0, p=0.39 (Figure 12.3). The interaction
between Reliability and Experiment was also not found to be significant, F (3,287)=0.22,
p=0.99. A post hoc Tukey’s HSD for Reliability showed that trust for Reliability A
127

1
2
3
4
5
6
7
8
9
10
Trus
t (M
uir)
RT F RD LT
Experiments1
2
3
4
5
6
7
8
9
10
Trus
t (M
uir)
A B C D
Reliability conditions
Figure 12.2: Left: Muir trust for the different experiments. Right: Muir trust acrossthe different reliability conditions.
(µ=82.9, �=42.4) was significantly higher than Reliability B (µ=32.2, �=45.8, p<0.01),
Reliability C (µ=47.1, �=45.1, p<0.01), and Reliability D (µ=54.7, �=41.9, p<0.01).
It also showed that trust for Reliability B was significantly higher than trust for Relia-
bility D (p<0.05).
The effect of Reliability is not surprising, since the same trend of high trust for
Reliability A and a similar level for Reliability B, C, and D was found for all the
experiments. However, the AUTC data across reliability is interesting, because, not
only did it show that trust was higher for Reliability A than Reliability B, C, and
D, but also that trust for Reliability D was significantly higher than Reliability B.
This data conclusively shows that indicates that periods of low reliability early in the
interaction result in a significant detrimental effect on operator trust than periods of
low reliability later in the interaction.
128
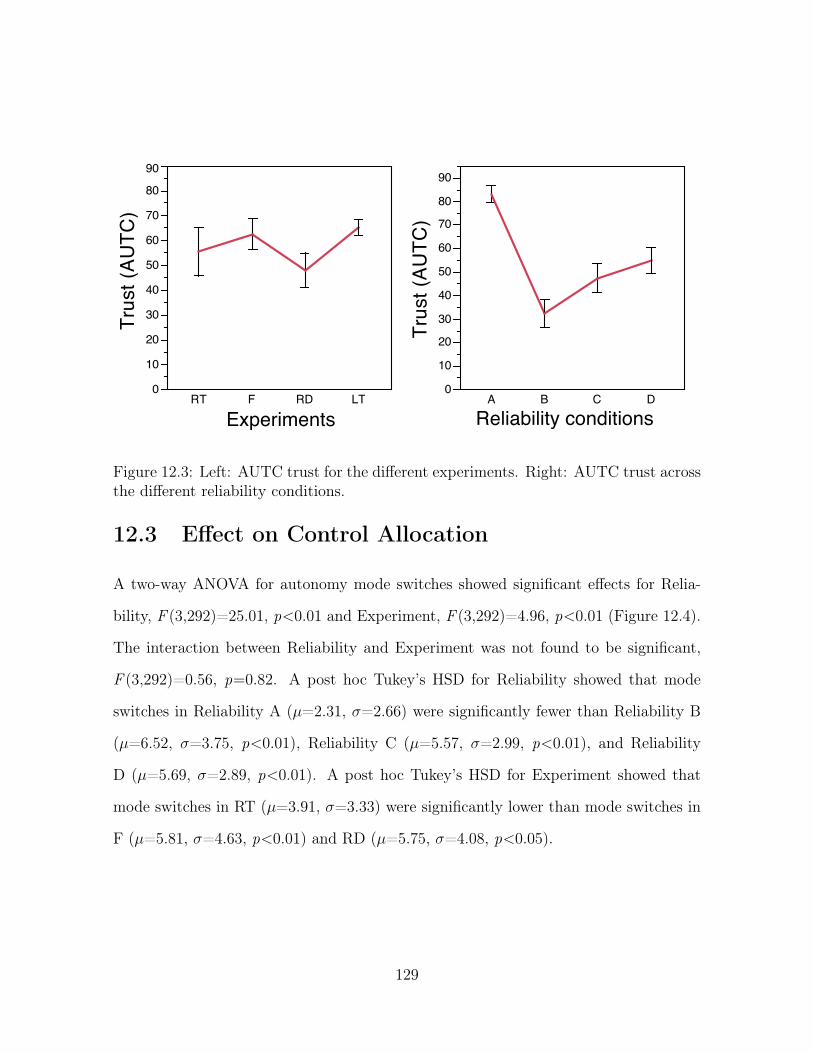
0
10
20
30
40
50
60
70
80
90
Trus
t (AU
TC)
RT F RD LT
Experiments0
10
20
30
40
50
60
70
80
90
Trus
t (AU
TC)
A B C D
Reliability conditions
Figure 12.3: Left: AUTC trust for the different experiments. Right: AUTC trust acrossthe different reliability conditions.
12.3 Effect on Control Allocation
A two-way ANOVA for autonomy mode switches showed significant effects for Relia-
bility, F (3,292)=25.01, p<0.01 and Experiment, F (3,292)=4.96, p<0.01 (Figure 12.4).
The interaction between Reliability and Experiment was not found to be significant,
F (3,292)=0.56, p=0.82. A post hoc Tukey’s HSD for Reliability showed that mode
switches in Reliability A (µ=2.31, �=2.66) were significantly fewer than Reliability B
(µ=6.52, �=3.75, p<0.01), Reliability C (µ=5.57, �=2.99, p<0.01), and Reliability
D (µ=5.69, �=2.89, p<0.01). A post hoc Tukey’s HSD for Experiment showed that
mode switches in RT (µ=3.91, �=3.33) were significantly lower than mode switches in
F (µ=5.81, �=4.63, p<0.01) and RD (µ=5.75, �=4.08, p<0.05).
129
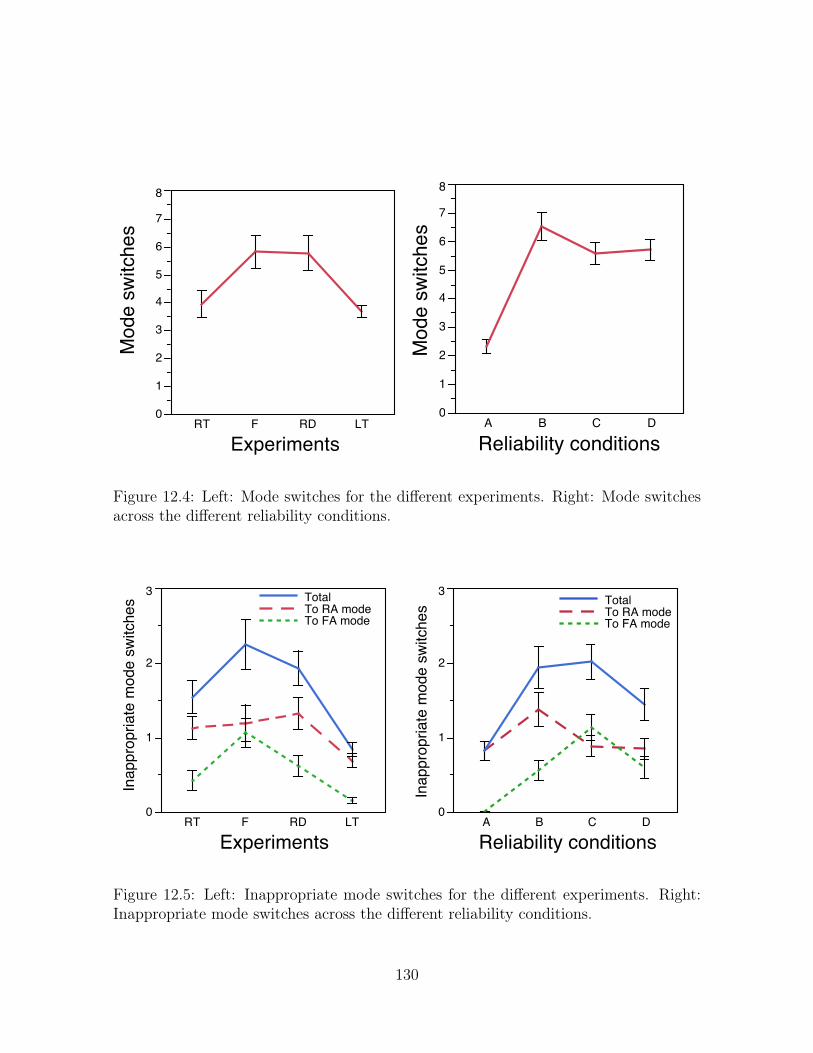
0
1
2
3
4
5
6
7
8
Mod
e sw
itche
s
RT F RD LT
Experiments
0
1
2
3
4
5
6
7
8
Mod
e sw
itche
s A B C D
Reliability conditions
Figure 12.4: Left: Mode switches for the different experiments. Right: Mode switchesacross the different reliability conditions.
0
1
2
3
Inap
prop
riate
mod
e sw
itche
s
RT F RD LT
Experiments
TotalTo RA modeTo FA mode
0
1
2
3
Inap
prop
riate
mod
e sw
itche
s
A B C D
Reliability conditions
TotalTo RA modeTo FA mode
Figure 12.5: Left: Inappropriate mode switches for the different experiments. Right:Inappropriate mode switches across the different reliability conditions.
130

12.3.1 Inappropriate Mode Switches
To better examine how and when participants switched autonomy modes we classi-
fied autonomy mode switches as appropriate and inappropriate. When participants
switched out of the ideal autonomy mode, the autonomy mode switch was considered
to be inappropriate. These inappropriate autonomy mode switches were then classified
as switches into the robot assisted mode or fully autonomous mode. The following
subsections provide statistical analysis for these metrics.
12.3.1.1 Inappropriate Switches to RA
A two-way ANOVA showed a significant effect for Experiment, F (3,292)=3.88, p<0.01.
The effect of Reliability was not significant, F (3,292)=2.51, p=0.058 (Figure 12.5).
The interaction between Reliability and Experiment was not found to be significant,
F (3,292)=1.06, p=0.39. A post hoc Tukey’s HSD for Experiment showed that LT
(µ=0.68, �=1.14) had significantly fewer unnecessary than mode switches to RA than
RD (µ=1.31, �=1.41, p<0.05). The data shows that the number of inappropriate
autonomy mode switches to RA were (marginally significant) more for Reliability B,
indicating that an early period of low reliability caused some confusion leading par-
ticipants to unnecessarily switch out of the robot assisted mode during low reliability
periods.
12.3.1.2 Inappropriate Switches to FA
A two-way ANOVA showed significant effects for Experiment, F (3,292)=12.07, p<0.01
and Reliability, F (3,292)=18.06, p<0.01 (Figure 12.5). The interaction between Re-
liability and Experiment was not found to be significant, F (3,292)=1.72, p=0.08. A
post hoc Tukey’s HSD for Experiment showed that F (µ=1.06, �=1.59) had signifi-
131

cantly more inappropriate mode switches to FA than LT (µ=0.15, �=0.44, p<0.01),
RT (µ=0.41, �=0.91, p<0.01), and RD (µ=0.61, �=0.89, p<0.05). A post hoc Tukey’s
HSD for Reliability showed that Reliability A (µ=0, �=0) had significantly less inap-
propriate mode switches than Reliability B (µ=0.55, �=1.04, p<0.01), Reliability C
(µ=1.13, �=1.33, p<0.01), and Reliability D (µ=0.59, �=1.13, p<0.01). Reliability C
had significantly more inappropriate mode switches than B (p<0.01) and Reliability D
(p<0.01). We suspect the high mode switches in experiment F were due to the grad-
uated feedback provided to the participants, causing them to switch out of the fully
autonomous mode.
12.3.1.3 Total Inappropriate Switches
A two-way ANOVA showed significant effects for Experiment, F (3,292)=10.18, p<0.01
and Reliability, F (3,292)=7.29, p<0.01 (Figure 12.5). The interaction between Relia-
bility and Experiment was not found to be significant, F (3,292)=1.49, p=0.15. A post
hoc Tukey’s HSD for Experiment showed that LT (µ=0.83, �=1.19) had significantly
less unnecessary mode switches than F (µ=2.25, �=2.66, p<0.01) and RD (µ=1.93,
�=1.54, p<0.01). A post hoc Tukey’s HSD for Reliability showed that Reliability A
(µ=0.81, �=1.43) had significantly less unnecessary mode switches than Reliability B
(µ=1.93, �=2.21, p<0.01) and Reliability C (µ=2.01, �=1.83, p<0.01).
Fewer inappropriate autonomy mode switches in LT is not surprising, given the
large proportion of high reliability A runs. However, the interesting result if the lack of
significance between Reliability A and Reliability D. This result along with some other
results in this chapter indicate that when periods of low reliability occur late in the
interaction operators better manage those situations.
132

0
2
4
6
8
10
12
14
16
18
Gat
es
RT F RD LT
Experiments
Gates in RA during high reliabilityGates in FA during low reliabilityGates with appropriate CA
0
2
4
6
8
10
12
14
1618
Gat
es A B C D
Reliability conditions
Figure 12.6: Left: Control allocation strategy for the different experiments. Right:Control allocation strategy across the different reliability conditions.
12.3.2 Control Allocation Strategy
A two-way ANOVA for control allocation strategy showed a significant effect for Experi-
ment, F (3,291)=17.39, p<0.01. The effect of Reliability was not significant, F (3,291)=0.24,
p=0.86 (Figure 13.3). The interaction between Reliability and Experiment was also not
found to be significant, F (3,291)=0.27, p=0.98. A post hoc Tukey’s HSD for Exper-
iment showed that LT (µ=16.03, �=2.26) had a significantly better control allocation
strategy than RD (µ=13.29, �=5.46, p<0.01), RT (µ=11.06, �=6.21, p<0.01), and F
(µ=13.89, �=4.55, p<0.01). F also had a better control allocation strategy than RT
(p<0.01).
The control allocation strategy data analyzed in aggregate shows significant results
that are consistent with the results found in individual experiments (Chapters 9 and
10).
133

0
2
4
6
8
10
12
14
16
RT F RD LT
Experiments
Hits
Wrong turns
0
2
4
6
8
10
12
14
16
A B C D
Reliability conditions
Hits
Wrong turns
Figure 12.7: Left: Hits and wrong turns for the different experiments. Right: Hits andwrong turns across the different reliability conditions.
12.4 Performance
Three metrics were used to evaluate performance. This section presents analyses for
hits, run time, and wrong turns.
12.4.1 Hits
A two-way ANOVA showed a significant effect for Experiment, F (3,291)=26.4, p<0.01.
The effect of Reliability was not significant, F (3,291)=2.3, p=0.07 (Figure 12.7). The
interaction between Reliability and Experiment was also not found to be significant,
F (3,291)=0.71, p=0.69. A post hoc Tukey’s HSD for Experiment showed that RT
(µ=11.02, �=15.54) had a significantly more hits than RD (µ=2.02, �=2.77, p<0.01),
LT (µ=0.76, �=2.36, p<0.01), and F (µ=2.59, �=3.29, p<0.01). These are similar
results those found in Chapters 9 and 10.
134

0
100
200
300
400
500
600
700
Time
RT F RD LT
Experiments0
100
200
300
400
500
600
700
Tim
eA B C D
Reliability conditions
Figure 12.8: Left: Run time for the different experiments. Right: Run time across thedifferent reliability conditions.
12.4.2 Time
A two-way ANOVA showed significant effects for Experiment, F (3,291)=25.57, p<0.01
and Reliability, F (3,291)=3.61, p<0.05 (Figure 12.8). The interaction between Reliabil-
ity and Experiment was not found to be significant, F (3,291)=0.77, p=0.64. A post hoc
Tukey’s HSD for Experiment showed that RT (µ=692, �=243) took significantly more
time than RD (µ=554, �=54, p<0.01), LT (µ=532, �=27, p<0.01), and F (µ=577,
�=65, p<0.01). A post hoc Tukey’s HSD for Reliability showed that A (µ=537, �=77)
took significantly less time than B (µ=601, �=139, p<0.01), and C (µ=592, �=130,
p<0.05). The lack of a significant difference between Reliability A and Reliability D is
interesting and adds credence to the hypothesis that periods of low reliability later in
the run are less detrimental to operator behavior and overall performance.
135

12.4.3 Wrong Turns
A two-way ANOVA showed significant effects for Experiment, F (3,291)=19.79, p<0.01,
Reliability, F (3,291)=8.55, p<0.01, and the interaction between Reliability and Exper-
iment, F (3,291)=2.25, p<0.05 (Figure 12.7). A post hoc Tukey’s HSD for Experi-
ment showed that RT (µ=1.04, �=1.41) had significantly more wrong turns than RD
(µ=0.40, �=0.58, p<0.01) and LT (µ=0.07, �=0.28, p<0.01). LT had fewer wrong
turns than F (µ=0.7, �=1.0, p<0.01). A post hoc Tukey’s HSD for Reliability showed
that A (µ=0.08, �=0.33) had significantly fewer wrong turns than B (µ=0.67, �=1.04,
p<0.01), C (µ=0.65, �=1.12, p<0.01), and D (µ=0.54, �=0.91, p<0.01). The signifi-
cant results reported here are not surprising, since the same results were also found in
previous chapters. However, the interesting result is the lack of significance between
experiments F and RD. We expected F would have fewer wrong turns due to the feed-
back provided, however, there were in fact fewer wrong turns (not significant) in RD.
To examine this further the wrong turns were categorized as automation errors and
manual errors. The next subsections present analyses for those metrics.
12.4.4 Automation Errors (AER)
A two-way ANOVA showed significant effects for Experiment, F (3,291)=4.16, p<0.01
and Reliability, F (3,291)=4.77, p<0.01. The interaction between Reliability and Ex-
periment was not significant, F (3,291)=1.74, p=0.07 (Figure 12.9). A post hoc Tukey’s
HSD for Experiment showed that RT (µ=0.29, �=0.74) had significantly more AERs
than LT (µ=0.02, �=0.19, p<0.05) and F (µ=0.25, �=0.66, p<0.05). A post hoc
Tukey’s HSD for Reliability showed that A (µ=0, �=0) had significantly fewer AERs
than B (µ=0.18, �=0.42, p<0.01) and C (µ=0.29, �=0.71, p<0.01).
136

0.00
0.25
0.50
0.75
1.00
Wro
ng tu
rns
RT F RD LT
Experiments
MERAER
0.00
0.25
0.50
0.75
1.00
Wro
ng tu
rns
A B C D
Reliability conditions
MERAER
Figure 12.9: Left: Automation errors (AER) and manual errors (MER) for the differentexperiments. Right: AER and MER across the different reliability conditions.
12.4.5 Manual Errors (MER)
A two-way ANOVA showed significant effects for Experiment, F (3,291)=13.15, p<0.01,
Reliability, F (3,291)=5.59, p<0.01, and interaction between Reliability and Experi-
ment, F (3,291)=2.47, p<0.01 (Figure 12.9). A post hoc Tukey’s HSD for Experiment
showed that RT (µ=0.75, �=1.24) had significantly more MERs than LT (µ=0.05,
�=0.23, p<0.01) and RD (µ=0.31, �=0.51, p<0.01). F (µ=0.45, �=0.75) had more
MERs than LT (p<0.01). A post hoc Tukey’s HSD for Reliability showed that A
(µ=0.7, �=0.32) had significantly fewer AERs than B (µ=0.55, �=0.95, p<0.01) and
C (µ=0.39, �=0.93, p<0.05).
12.4.6 Automation Errors vs Manual Errors
A pairwise two-tailed t-test showed that there were significantly more MERs (µ=0.28,
�=0.69) than AER (µ=0.13, �=0.48, t(307)=3.19, p<0.01). A pairwise two-tailed
137
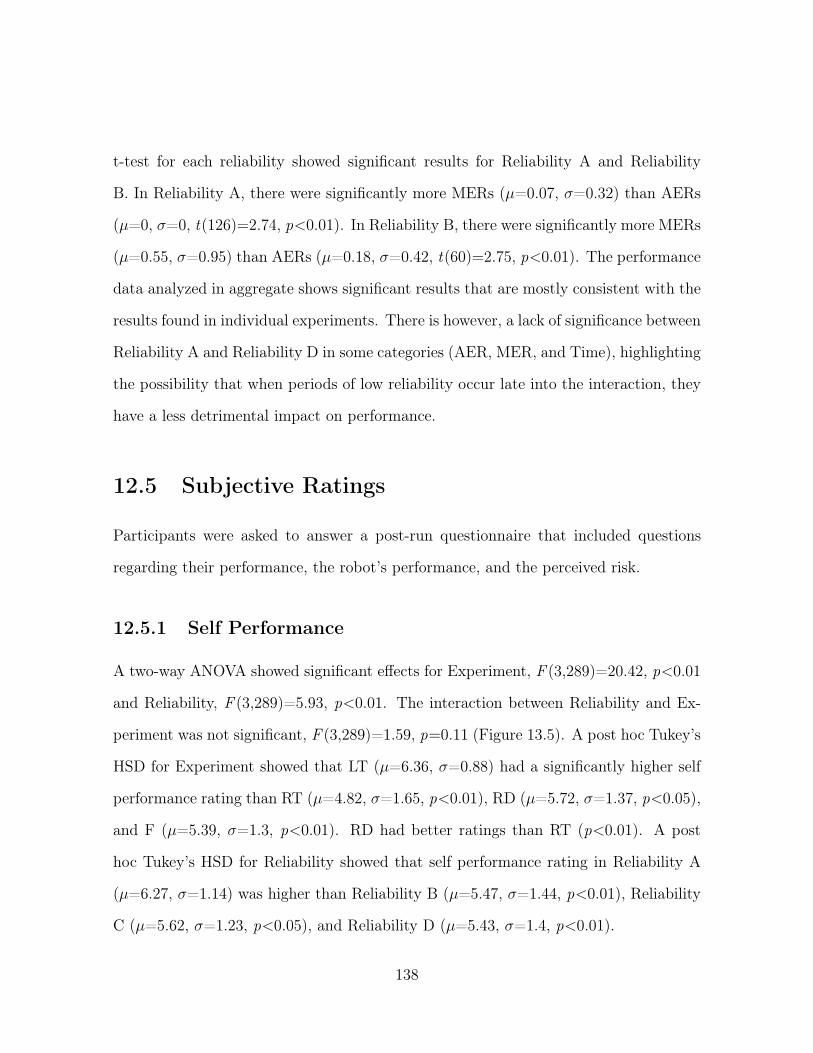
t-test for each reliability showed significant results for Reliability A and Reliability
B. In Reliability A, there were significantly more MERs (µ=0.07, �=0.32) than AERs
(µ=0, �=0, t(126)=2.74, p<0.01). In Reliability B, there were significantly more MERs
(µ=0.55, �=0.95) than AERs (µ=0.18, �=0.42, t(60)=2.75, p<0.01). The performance
data analyzed in aggregate shows significant results that are mostly consistent with the
results found in individual experiments. There is however, a lack of significance between
Reliability A and Reliability D in some categories (AER, MER, and Time), highlighting
the possibility that when periods of low reliability occur late into the interaction, they
have a less detrimental impact on performance.
12.5 Subjective Ratings
Participants were asked to answer a post-run questionnaire that included questions
regarding their performance, the robot’s performance, and the perceived risk.
12.5.1 Self Performance
A two-way ANOVA showed significant effects for Experiment, F (3,289)=20.42, p<0.01
and Reliability, F (3,289)=5.93, p<0.01. The interaction between Reliability and Ex-
periment was not significant, F (3,289)=1.59, p=0.11 (Figure 13.5). A post hoc Tukey’s
HSD for Experiment showed that LT (µ=6.36, �=0.88) had a significantly higher self
performance rating than RT (µ=4.82, �=1.65, p<0.01), RD (µ=5.72, �=1.37, p<0.05),
and F (µ=5.39, �=1.3, p<0.01). RD had better ratings than RT (p<0.01). A post
hoc Tukey’s HSD for Reliability showed that self performance rating in Reliability A
(µ=6.27, �=1.14) was higher than Reliability B (µ=5.47, �=1.44, p<0.01), Reliability
C (µ=5.62, �=1.23, p<0.05), and Reliability D (µ=5.43, �=1.4, p<0.01).
138

1
2
3
4
5
6
7
8
Rat
ings
RT F RD LT
Experiments
Self performanceRobot performance
Perceived risk
1
2
3
4
5
6
7
8
Rat
ings
A B C D
Reliability conditions
Self performanceRobot performance
Perceived risk
Figure 12.10: Left: Subjective ratings for the different experiments. Right: Subjectiveratings across the different reliability conditions.
12.5.2 Robot Performance
A two-way ANOVA showed no significant effects for Experiment, F (3,289)=1.58, p=0.19,
Reliability, F (3,289)=0.24, p=0.86, and the interaction between Reliability and Exper-
iment, F (3,289)=0.46, p=0.89 (Figure 13.5).
12.5.3 Robot Performance vs Self Performance
A pairwise two-tailed t-test showed that the self performance rating (µ=5.83, �=1.32)
was significantly lower than the robot’s performance rating (µ=6.08, �=1.06, t(304)=3.44,
p<0.01). The lower self performance rating shows that participants blamed themselves
more than the robot for poor performance.
139
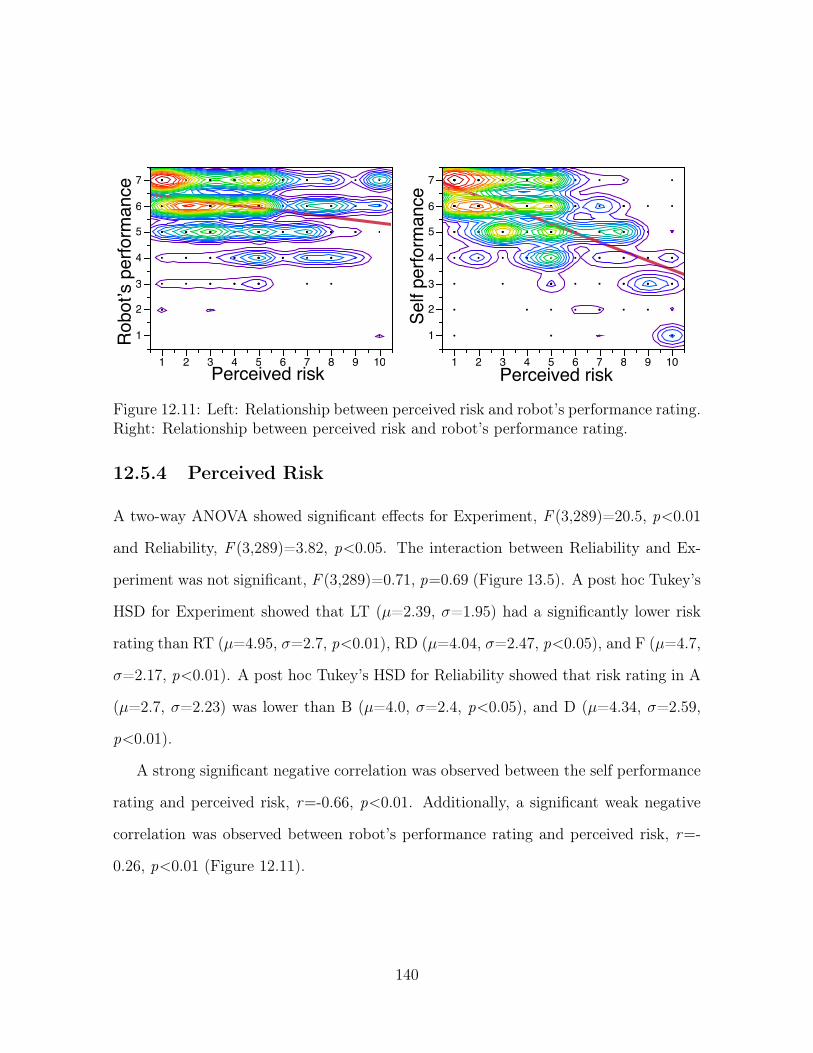
1
2
3
4
5
6
7
Rob
ot’s
per
form
ance
1 2 3 4 5 6 7 8 9 10Perceived risk
1
2
3
4
5
6
7
Self
perfo
rman
ce
1 2 3 4 5 6 7 8 9 10Perceived risk
Figure 12.11: Left: Relationship between perceived risk and robot’s performance rating.Right: Relationship between perceived risk and robot’s performance rating.
12.5.4 Perceived Risk
A two-way ANOVA showed significant effects for Experiment, F (3,289)=20.5, p<0.01
and Reliability, F (3,289)=3.82, p<0.05. The interaction between Reliability and Ex-
periment was not significant, F (3,289)=0.71, p=0.69 (Figure 13.5). A post hoc Tukey’s
HSD for Experiment showed that LT (µ=2.39, �=1.95) had a significantly lower risk
rating than RT (µ=4.95, �=2.7, p<0.01), RD (µ=4.04, �=2.47, p<0.05), and F (µ=4.7,
�=2.17, p<0.01). A post hoc Tukey’s HSD for Reliability showed that risk rating in A
(µ=2.7, �=2.23) was lower than B (µ=4.0, �=2.4, p<0.05), and D (µ=4.34, �=2.59,
p<0.01).
A strong significant negative correlation was observed between the self performance
rating and perceived risk, r=-0.66, p<0.01. Additionally, a significant weak negative
correlation was observed between robot’s performance rating and perceived risk, r=-
0.26, p<0.01 (Figure 12.11).
140

2
4
6
8
10
Wor
kloa
d (T
LX)
RT F RD LT
Experiments
2
4
6
8
10
Wor
kloa
d (T
LX)
A B C D
Reliability conditions
Figure 12.12: Left: Workload for the different experiments. Right: Workload acrossthe different reliability conditions.
12.5.5 Workload
A two-way ANOVA showed significant effects for Experiment, F (3,289)=48.66, p<0.01
and Reliability, F (3,289)=9.12, p<0.01. The interaction between Reliability and Exper-
iment was not significant, F (3,289)=0.39, p=0.93 (Figure 12.12). A post hoc Tukey’s
HSD for Experiment showed that LT (µ=1.87, �=0.71) had a significantly lower work-
load than RT (µ=3.26, �=1.14, p<0.01), RD (µ=2.99, �=1.01, p<0.01), and F (µ=3.67,
�=1.17, p<0.01). Workload for RD was lower than F (p<0.01). A post hoc Tukey’s
HSD for Reliability showed that workload in A (µ=2.01, �=0.92) was significantly lower
than B (µ=3.1, �=1.28, p<0.05), C (µ=3.01, �=1.14, p<0.01), and D (µ=3.04, �=1.12,
p<0.01).
The aggregate subjective data reinforces that initial finding regarding participants
blaming themselves more than the robot. This conclusion is highlighted by the fact
that the self performance rating is lower than the robot’s performance rating and that
141

much stronger negative correlation between perceived risk and self performance rating
than perceived risk and robot’s performance rating.
12.6 Conclusions
The analyses presented in this chapter validates some of the findings previously reported
and also shows some new results. Muir trust scale does not appear to be sensitive to the
changes in trust during an interaction between the different reliability conditions, even
when all of the experiments are considered in aggregate. However, unlike Muir, AUTC
is sensitive to the changes in trust during an interaction due to the real-time collection
of trust data. Not only was trust for Reliability A was higher than Reliability, B, C,
and D, but trust for Reliability D was higher than Reliability B. This is highlighted the
crucial impact of timing of periods of low reliability on operator trust. Similar effects
were also observed in other metrics. For example, no significant difference was observed
in the total number of inappropriate mode switches for Reliability A and Reliability D.
This result supports the hypothesis of impact of timing on periods of reliability drops.
Similarly, the no significant difference between Reliability A and Reliability D was
observed for time and manual errors (MERs). These results indicate the importance of
ensuring a stable and reliable initial interaction with the remote robot every time. If
there is a disruption on reliability early on, that impacts operator behavior and overall
performance.
142
Chapter 13
Factors that Influence Operator
Behavior
The participants recruited for all of the experiments reported in this thesis spanned a
wide range for age, prior experience, and attitudes towards risk. When participants’
behavior was collectively analyzed, it was observed that age showed a strong relation-
ship not only with their behavior, but also with other potential mitigating factors such
as prior experience and risk attitudes. Hence, this chapter looks at the relationship
between operator characteristics (specifically age) and operator behavior in an attempt
to predict behavior and potentially take corrective action if needed. It should be noted
that these relationships and analyses are generalized and thus do not apply to every op-
erator. Instead, they indicate that similar trends or relationships will likely be observed
with a large enough population and could be utilized accordingly.
143
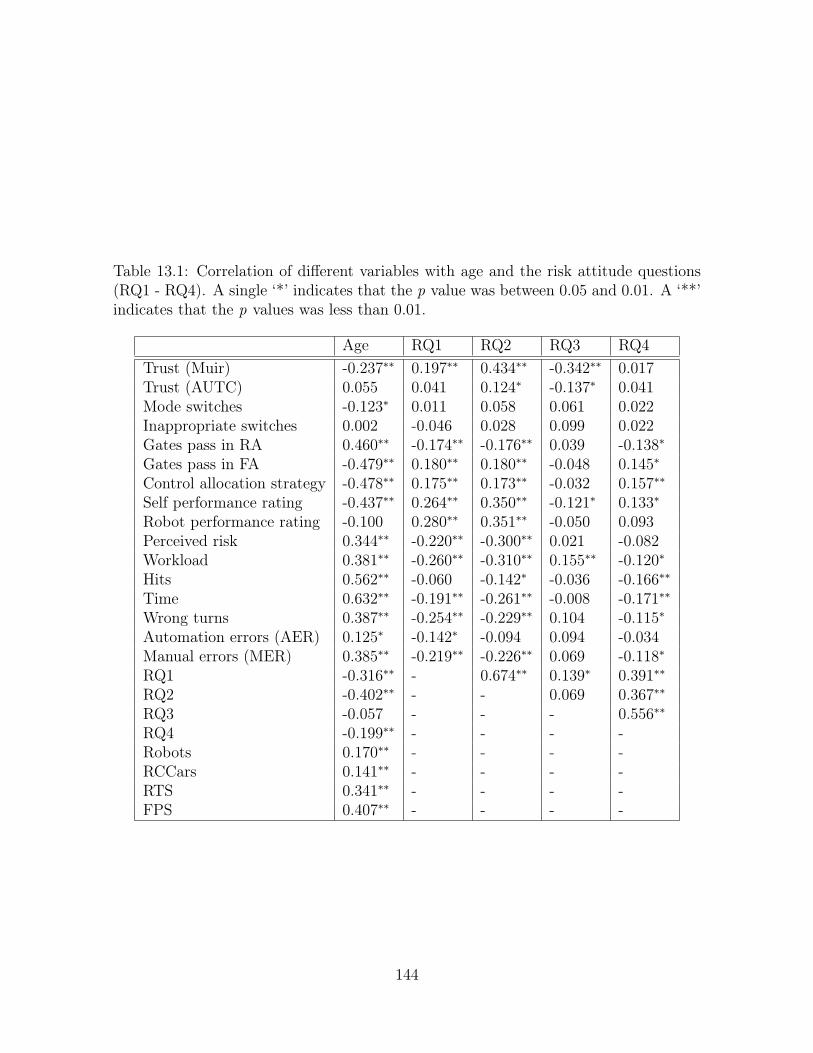
Table 13.1: Correlation of different variables with age and the risk attitude questions(RQ1 - RQ4). A single ‘*’ indicates that the p value was between 0.05 and 0.01. A ‘**’indicates that the p values was less than 0.01.
Age RQ1 RQ2 RQ3 RQ4Trust (Muir) -0.237⇤⇤ 0.197⇤⇤ 0.434⇤⇤ -0.342⇤⇤ 0.017Trust (AUTC) 0.055 0.041 0.124⇤ -0.137⇤ 0.041Mode switches -0.123⇤ 0.011 0.058 0.061 0.022Inappropriate switches 0.002 -0.046 0.028 0.099 0.022Gates pass in RA 0.460⇤⇤ -0.174⇤⇤ -0.176⇤⇤ 0.039 -0.138⇤Gates pass in FA -0.479⇤⇤ 0.180⇤⇤ 0.180⇤⇤ -0.048 0.145⇤Control allocation strategy -0.478⇤⇤ 0.175⇤⇤ 0.173⇤⇤ -0.032 0.157⇤⇤Self performance rating -0.437⇤⇤ 0.264⇤⇤ 0.350⇤⇤ -0.121⇤ 0.133⇤Robot performance rating -0.100 0.280⇤⇤ 0.351⇤⇤ -0.050 0.093Perceived risk 0.344⇤⇤ -0.220⇤⇤ -0.300⇤⇤ 0.021 -0.082Workload 0.381⇤⇤ -0.260⇤⇤ -0.310⇤⇤ 0.155⇤⇤ -0.120⇤Hits 0.562⇤⇤ -0.060 -0.142⇤ -0.036 -0.166⇤⇤Time 0.632⇤⇤ -0.191⇤⇤ -0.261⇤⇤ -0.008 -0.171⇤⇤Wrong turns 0.387⇤⇤ -0.254⇤⇤ -0.229⇤⇤ 0.104 -0.115⇤Automation errors (AER) 0.125⇤ -0.142⇤ -0.094 0.094 -0.034Manual errors (MER) 0.385⇤⇤ -0.219⇤⇤ -0.226⇤⇤ 0.069 -0.118⇤RQ1 -0.316⇤⇤ - 0.674⇤⇤ 0.139⇤ 0.391⇤⇤RQ2 -0.402⇤⇤ - - 0.069 0.367⇤⇤RQ3 -0.057 - - - 0.556⇤⇤RQ4 -0.199⇤⇤ - - - -Robots 0.170⇤⇤ - - - -RCCars 0.141⇤⇤ - - - -RTS 0.341⇤⇤ - - - -FPS 0.407⇤⇤ - - - -
144

13.1 Demographics
As part of the demographic questionnaire the participants were asked to report their
experience with robots and games and also report their attitudes towards risk. This
section describes the relationship between them and age.
1
2
3
4
5
6
7
20 30 40 50 60Age
20 30 40 50 60Age
20 30 40 50 60Age
20 30 40 50 60Age
Robots RC cars FPS games RTS games
20 30 40 50 60Age
1
2
3
4
5
6
20 30 40 50 60Age
20 30 40 50 60Age
20 30 40 50 60Age
RQ1 RQ2 RQ3 RQ4
Figure 13.1: (Top) Left to right: Relationship between age and prior experience withrobot, radio-controlled cars, first-person shooter games, and real-time strategy games.(Bottom) Left to right: Relationship between age and risk attitude questions RQ1,RQ2, RQ3, and RQ4.
13.1.1 Prior Experience
Participants were asked to indicate their prior experience with robots, radio-controlled
cars, real-time strategy games, and first-person shooter games. The responses were
recorded using a seven point Likert scale, with 1 being ‘Strongly agree’ and 7 being
‘Strongly disagree.’ A higher rating indicated less familiarity. As expected, the younger
145
participants were more familiar with all of the four categories. Since video games have
been around for a shorter timespan than robots and radio-controlled cars, there was a
stronger correlation for video games (Table 13.1 and Figure 13.1). These correlations,
while significant at the moment, are expected to change as the population ages. If
designers of autonomy and user interfaces wish to leverage concepts and standards
from the gaming industry, they must provide accommodations for participants who are
not familiar with video games.
13.1.2 Risk Attitude
Participants were asked to indicate their attitudes towards risk using the following
questions [Grasmick et al., 1993]:
• RQ1: I like to test myself every now and them by doing something a little risky
• RQ2: Sometimes I will take a risk just for the fun of it
• RQ3: I sometimes find it exciting to do things for which I might get into trouble
• RQ4: Excitement and adventure are more important to me than security
The responses were recorded using a six point Likert scale, with 1 being ‘Strongly
disagree’ and 6 being ‘Strongly agree’. Hence, a higher rating indicates a tendency to
take more risk and vice versa. As expected, the younger participants were more willing
to take risks. All of the risk questions showed a significant correlation with age, expect
risk question 3 (Table 13.1 and Figure 13.1). Unlike participants’ prior experience with
devices and games, risk attitudes are not expected to change with time over each age
group (i.e., younger generations will always be more likely to take more risk than the
146

older generations). Therefore, the willingness of operators to take risks must be taken
into consideration while designing automated robotic systems.
123456789
10
Trus
t (M
uir)
20 25 30 35 40 45 50 55 60Age
-60-40-20
020406080
100120140
Tru
st (A
UTC
)20 25 30 35 40 45 50 55 60
Age
Figure 13.2: Left: Relationship between age and Muir trust. Right: Relationshipbetween age and AUTC.
13.2 Trust
This section examines the relationship between trust (Muir and AUTC) with age and
risk attitudes. The Muir questionnaire is listed in Appendix C.
13.2.1 Age
Participants were asked to indicate their trust of the robot using the Muir questionnaire.
The responses were recorded using a ten point Likert scale, with 1 being ‘Strongly
disagree’ and 10 being ‘Strongly agree’. A higher rating indicated more trust of the
robot. A significant negative correlation with respect to age was observed (Table 13.1
and Figure 13.2). It indicates that, as operators age, they are less willing to trust the
robot or perhaps that they view the actions of the robot more critically. No significant
correlation with real-time trust using the area under the curve (AUTC) metric was
147

found. This lack of correlation for AUTC and the presence of a significant correlation
with age indicates that the trends in evolution of trust during an interaction are similar
across age; however, the absolute trust is offset by age.
13.2.2 Risk Attitude
We found significant positive correlation with Muir trust and RQ1 and RQ2 and a
significant negative correlation with RQ3. The correlations for RQ1 and RQ2 indicate
that, participants that were willing to take risk also tend to trust the robot more.
This correlation is not surprising given the relationship between age and Muir trust
and age and RQ1 and RQ2. However, the correlation between Muir trust and RQ3 is
unexpected.
Overall, the data indicates that, while risk and age are correlated, the risk attitudes
do interact with other variables (like trust), therefore it is useful to investigate an
operator’s attitude towards risk, rather than simply relying on age as a predictor.
0
2
4
6
8
10
12
14
16
18
Gat
es w
ith a
ppro
pria
te C
A
20 25 30 35 40 45 50 55 60Age
0
2
4
6
8
10
12
14
16
18
Gat
es p
asse
d in
In R
A
20 25 30 35 40 45 50 55 60Age
Figure 13.3: Left to right: Relationship between age and control allocation strategy,autonomy mode switches, and gates passed in RA mode.
148

13.3 Control Allocation
Control allocation was evaluated by examining the number of mode switches, the num-
ber of inappropriate mode switches, and the control allocation strategy (number of
gates passed in the appropriate autonomy mode). This section presents correlations
between these metrics and age and risk attitudes.
13.3.1 Mode Switches
There was a slight significant negative correlation of autonomy mode switches with
age (Table 13.1 and Figure 13.3). However, when the mode switches were analyzed
in detail, no significant correlation was found for inappropriate mode switches to the
robot assisted mode (RA), inappropriate mode switches to the fully autonomous mode
(FA), and total inappropriate mode switches. Similarly, no significant correlations were
found with respect to the risk attitude questions.
13.3.2 Control Allocation Strategy
A significant negative correlation to control allocation strategy was found for age. Also,
a significant positive correlation was found between the number of gates passed in RA
and age. These correlations indicate a certain amount of apprehension or ‘inertia’
[Moray and Inagaki, 1999] in switching autonomy modes that is higher with older
operators. Hence, designers should take these results into account and provide suitable
training, or additional feedback to ensure appropriate control allocation strategy.
149

0
10
20
30
40
50
60
70
Hits
20 25 30 35 40 45 50 55 60
Age
50060070080090010001100120013001400
Time
20 25 30 35 40 45 50 55 60Age
0
1
2
3
4
5
6
Wro
ng tu
rns
20 25 30 35 40 45 50 55 60Age
0
1
2
3
4
AER
20 25 30 35 40 45 50 55 60Age
0
1
2
3
4
5
6
MER
20 25 30 35 40 45 50 55 60Age
Figure 13.4: (Top) Left to right: Relationship between age and hits, time, and wrongturns. (Bottom) Left to right: Relationship between age and AER and MER.
13.4 Performance
A significant positive correlation was observed for hits, time, and wrong turns with
respect to age (Table 13.1 and Figure 13.4). The data also showed a significant positive
correlation between age and AER and MER. However, the correlation between MER
and age was stronger, indicating that older participants were more likely to make a
mistake in the robot assisted mode than in the fully autonomous mode. It also indicates
that older participants fared poorly on the performance metrics; we suspect the poor
performance for older participants could be because of their propensity to keep the
robot in robot assisted mode. While negative relationships between performance and
the risk attitude were found, they were not as strong as the relationship between age
and performance.
The performance data, along with the control allocation data, shows that, as age
150

increases, there is a higher probability of inappropriate control allocation especially
when the performance is poor.
1
2
3
4
5
6
7
Self
perfo
rman
ce ra
ting
20 25 30 35 40 45 50 55 60Age
1
2
3
4
5
6
7
Rob
ot’s
per
form
ance
ratin
g20 25 30 35 40 45 50 55 60
Age
123456789
10
Perc
eive
d ris
k
20 25 30 35 40 45 50 55 60Age
1
2
3
4
5
6
7
Wor
kloa
d (T
LX)
20 25 30 35 40 45 50 55 60Age
Figure 13.5: Left to right: Relationship between age and self performance rating, robot’sperformance rating, perceived risk, and workload.
13.5 Subjective Ratings
A significant negative correlation was observed for self-performance rating and age;
however, no significant correlation was observed for the robot’s performance rating
(Table 13.1 and Figure 13.5). A significant positive correlation was also observed with
age and perceived risk and workload.
151

The subjective data combined together with the performance and control allocation
data indicates that the older participants preferred the robot assisted mode even though
it resulted in higher workload and poor performance. Additionally, older participants
blamed themselves more for poor performance than they did the robot.
While the correlations with age provide valuable insight into the behavior of the
potential operators, it does not explain the cause of those behaviors. Hence, it is only
possible to speculate the potential causal relationships between these factors based on
available data. One such hypothesis presented in the next section.
13.6 Modeling Operator Behavior
It is feasible to hypothesize a model that only looks at the relationship between age, risk
attitudes and data collected from other metrics during the run. However, such a model
would ignore the relationships between other metrics directly (e.g., workload and control
allocation strategy, hits and time). Examining those relationships might help to create
a comprehensive model that highlights the complexities of remote robot teleoperation.
Figure 13.6 shows the results of correlations between all of the different metrics. The
correlation coefficients between the row attribute and the column attribute are shown
for each box. The boxes that do not have a correlation value are correlations that were
either not significant or were weak (r< |0.3|). Shades of green and red indicate positive
and negative correlations, with a darker shade indicating a strong correlation.
Figure 13.6 shows many significant correlations; however, they must be interpreted
with caution. Causations can not be assumed simply due to a correlation and, even
when causations are likely, the direction of causations must be correctly interpreted or
assumed. Since there are seventy one significant correlations that are at least moderate,
152

Gates
in RA-0.98
AER
0.37
-0.44
MER
Muir
Mode
switches
0.46
-0.47
0.38
Age -0.31
RQ1
0.43
-0.40
0.67
-0.34
0.39
0.36
0.55
-0.88
0.88
-0.34
-0.47
CA
Trust
robot0.63
Trust
robots
general
-0.37
0.37
-0.49
0.53
-0.43
0.35
0.30
Self
perf.
0.49
0.35
0.45
0.35
-0.34
0.34
-0.34
0.34
-0.30
-0.64
Risk
0.42
-0.49
0.56
0.56
-0.42
-0.39
Hits
0.51
-0.57
0.57
0.63
-0.48
-0.43
0.87
Time
-0.33
0.57
0.81
0.38
-0.31
-0.54
0.40
0.52
0.53
Path
score
0.44
-0.45
0.39
-0.40
0.38
-0.31
-0.36
0.43
0.41
-0.55
0.63
0.40
0.42
TLX
0.45
AUTC
0.82
0.30
Wrong
switches
Gates
in FA
RQ2
RQ3
RQ4
Robot’s
perf.
Self
perf.
Figure 13.6: Results of correlation analysis between data collected using all the metrics.The correlation values between the row attribute and the column attribute are shownin boxes. Only significant correlations with r� |0.3| are shown. Shades of green and redindicate positive and negative correlations, with a darker shade indicating a strongercorrelation.
they are not listed and individually explained in this thesis. However, Figure 13.11
shows a model that is based on all of these correlations.
The relationship between age and other factors is examined first (Figure 13.7).
The model shows that performance decreases respectively, with an operator’s age. For
153

Age
Time
63
Use of RA
46
Hits
56
TLX
38
Wrong turns
38
RQ2
40
Control allocation strategy
47
Figure 13.7: The significant correlations between age and other attributes.
example, the time required is expected to go up, along with the number of hits and
wrong turns. Therefore it takes longer to finish and the accuracy of the task is lower.
Age also impacts preference for autonomy modes. The older operators are more likely
to opt for lower autonomy levels. The older operators are more sensitive to workload
than younger operators. Finally, age impacts operators’ risk attitudes (i.e., the older
operators are less willing to take risks).
Age
TLX
38
Time
Use of RA
44
Control allocation strategy
40
Wrong turns
42
Manual errors
40
Perceived risk
63
Hits
29 36
Muir
40
Figure 13.8: The significant correlations between workload and other attributes.
Workload is another attribute that influences many factors. According to the model,
workload increases with operators’ age and when operators perform actions under man-
ual control or lower autonomy modes. When workload increases, it has a detrimental
154
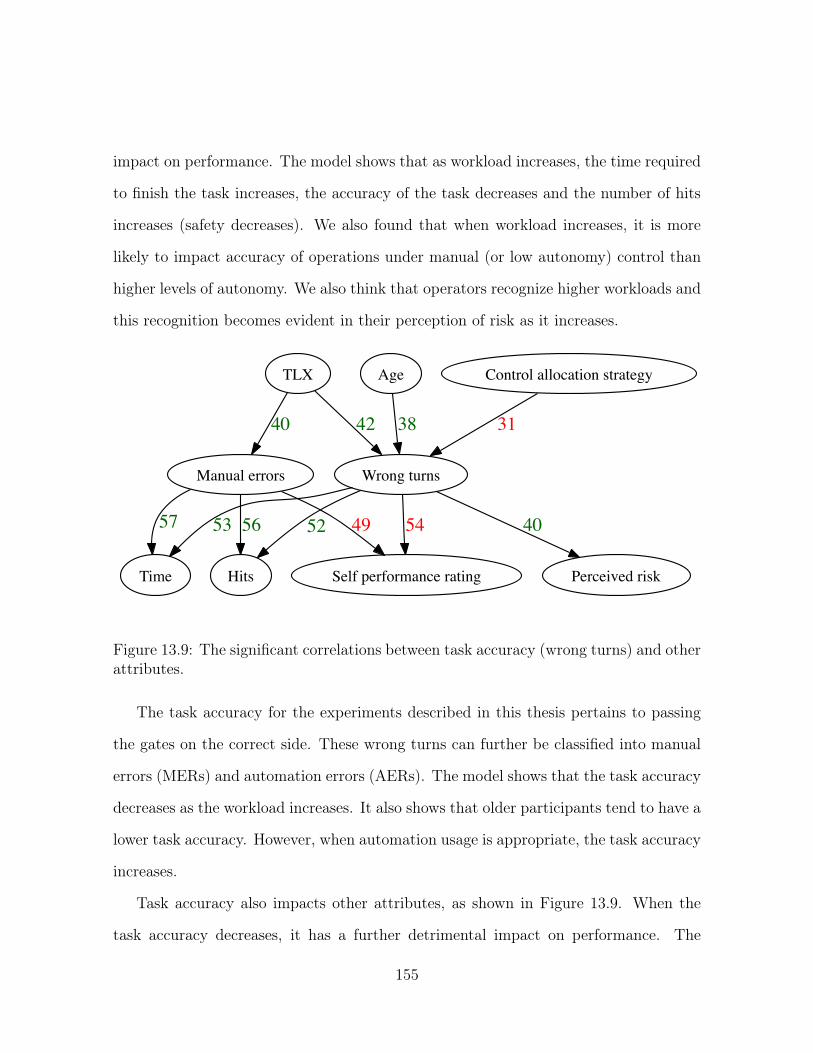
impact on performance. The model shows that as workload increases, the time required
to finish the task increases, the accuracy of the task decreases and the number of hits
increases (safety decreases). We also found that when workload increases, it is more
likely to impact accuracy of operations under manual (or low autonomy) control than
higher levels of autonomy. We also think that operators recognize higher workloads and
this recognition becomes evident in their perception of risk as it increases.
Age
Wrong turns
38
Time
Control allocation strategy
31
TLX
Manual errors
40 42
Perceived risk
57
Hits
56
Self performance rating
4953 4052 54
Figure 13.9: The significant correlations between task accuracy (wrong turns) and otherattributes.
The task accuracy for the experiments described in this thesis pertains to passing
the gates on the correct side. These wrong turns can further be classified into manual
errors (MERs) and automation errors (AERs). The model shows that the task accuracy
decreases as the workload increases. It also shows that older participants tend to have a
lower task accuracy. However, when automation usage is appropriate, the task accuracy
increases.
Task accuracy also impacts other attributes, as shown in Figure 13.9. When the
task accuracy decreases, it has a further detrimental impact on performance. The
155

time required to finish the task increases and the number of hits increases (or safety
decreases). Operators blame themselves when the task accuracy is decreased, and they
also expect an overall reduction in performance.
Muir TLX40RQ2 43
RQ3
34
Figure 13.10: The significant correlations between trust (Muir) and other attributes.
While the model shows that trust is impacted by risk attitudes and perhaps by
workload, trust does not seem to directly influence control allocation strategy as ex-
pected, rather it seems to be mediated by workload. The lack of a direct significant
correlation between trust and control allocation does not indicate a lack of relation-
ship between the two. This data shows that there are other attributes that tend to
have a stronger influence on control allocation than trust. However, we suspect the
most likely possibility is that, in application domains where operators have to exten-
sively rely on automation due to poor situation awareness, high baseline workloads,
and difficult tasks, trust does not directly mediate control allocation even though it
reflects automation’s reliability. A linear fit between Muir trust and gates passed in FA
mode showed that trust accounted for about 3% of the variance in gates passed in FA
mode. However, a linear fit between age and gates passed in FA mode showed that age
accounted for about 23% of the variance.
Even though the hypothesized model of human interaction with remote robots for
156

teleoperation (HARRT) is based on the statistically significant data, additional ex-
periments must be conducted to confirm the hypothesized links. At the very least,
this hypothesized model is novel since none of the research performed to date presents
the human automation model as a series of dependent connections. Of course, these
relationships are also influenced by external conditions including situation awareness,
feedback, and task difficulty. Additionally, the hypothesized model must always be
interpreted and applied in a context similar to the experiments presented in this thesis.
157

Hits
Time
Manual errors TLX
Wrong turns
RQ2
RQ3
Perceived riskSelf performance rating
Use of RAMuir
Control allocation strategy
Age
63
46
56
38
38
4351
44
42
40
42
40
6329
57
56
53
40
52
87
47 40
40
34
48
31
36
64
49
5439
Figure 13.11: A detailed hypothesized model for human interaction with remote robotsfor teleoperation (HARRT). This model is based on the correlation data shown in Figure13.6, but was created by only showing relationships that have a causal relationship. Thenumber next to edges represent significant correlation values as percentages. Numberswith an underscore indicate a negative correlation and numbers without an underscoreindicate a positive correlation. The directed edges represent proposed causal relation-ships between factors, with the factor next to the arrowhead being influenced when theother factor changes.
158

Chapter 14
Model and Guidelines
Chapters 6 - 11 describe experiments and present results showing the effects of lowering
situation awareness (SA), providing feedback, reducing task difficulty, and long term
interaction on operator trust and control allocation. This chapter presents qualitative
models based on the impact of factors described in those chapters. These models are
presented in the context of the Human interaction with Autonomous Remote Robot
for Teleoperation (HARRT) model described in Chapter 13. Finally, based on these
models, a set of guidelines are proposed to help better design autonomous robot systems
for remote teleoperation and to improve system performance during operation.
14.1 Reducing Situation Awareness (SA)
Figure 14.1 shows the impact of comparing the baseline dynamic reliability (DR) ex-
periment with the low SA experiment (LSA) where the user interface was modified to
impact participant’s SA.
159

Lowering SA
Increased time
Increased trust
More preferred FA mode
Improved control allocation strategy
Increased Workload
Reduced robot's performance rating
Increased mode switches
Figure 14.1: The impact of reducing situation awareness (SA) on different factors. Allof the effects shown are based on significant differences between the Low SituationAwareness (LSA) and Dynamic Reliability (DR) experiments.
14.1.1 Qualitative Model
As the participants’ SA was reduced, it increased their workload. We suspect the
increase in workload was due to the additional effort (cognitive and otherwise) required
to maintain the minimum required level of SA. Additionally, lowering SA makes the
task of remote teleoperation more difficult, which could also increase workload. The
combination of increased workload and poor SA increased the time needed to finish the
task.
We suspect that lowering SA forced participants into relying more on the fully au-
tonomous (FA) mode. Higher reliance on the FA mode improved the control allocation
strategy, since the ideal control allocation strategy required the participants to rely
more on FA than the robot assisted (RA) mode. While the increase in trust was unex-
160

pected, it can be explained by the higher reliance on FA for a task that was difficult to
perform manually.
Lowering SA also reduced the participants’ rating of the robot’s performance, even
though there wasn’t a significant difference in performance. We suspect this was due
to two reasons: poor SA made it difficult to correctly judge the robot’s performance
and the participants could have blamed the robot for providing inadequate information
needed for teleoperation.
The qualitative model based on this analysis is incorporated into the HARRT model
and is shown in Figure 14.5. Guidelines based on the SA sub-model are described below:
G1: Reduced SA leads to higher reliance on autonomous behaviors. Intentionally reduc-
ing SA to force operators to rely on autonomous behaviors is not recommended
as a design strategy due to the other undesirable side effects. However, such in-
fluence does remain a possibility, but should only be exercised when absolutely
necessary, since doing so can potentially impact safety and performance.
G2: Suspend or defer non-critical tasks when SA is reduced. Even with higher reliance
on automation, the workload is expected to increase, so tasks that are not critical
should be suspended or deferred to offset the increased workload and to prevent
an overall detrimental impact on performance.
G3: Switch functions unaffected by reduced SA to automation. Functions not impacted
by reduced SA can be switched over to automation in an attempt to reduce
workload.
G4: Educate operators about SA. Operators associate robot performance with SA and
therefore operators must be informed (during training or during the interaction)
that low SA does not necessarily impact the robot’s performance.
161

Providing robot confidence feedback
Improved control allocation strategy
Decreased hits
Decreased time
Increased Workload
Increased self performance rating
Increased mode switches
Fewer wrong turns
Figure 14.2: The impact of providing feedback on different factors. All of the effectsshown are based on significant differences between the Feedback (F) and Real-TimeTrust (RT) experiments.
14.2 Providing Feedback
Figure 14.2 shows the results of comparing results of the baseline Real-Time Trust
(RT) experiment with that of the Feedback (F) experiment where the participants were
provided with feedback concerning the robot’s confidence in its own sensors.
14.2.1 Qualitative Model
Providing information about the robot’s confidence in its own sensors and decision
making to the participants increased their workload, as they were given additional
information that needed to be processed. Also, participants reacted to the change in
robot’s confidence by aggressively changing autonomy modes and therefore increased
the number of autonomy mode switches. We suspect these autonomy mode changes
were another reason that resulted in an increase in workload.
However, increased autonomy mode switches and better robot supervision due to the
162
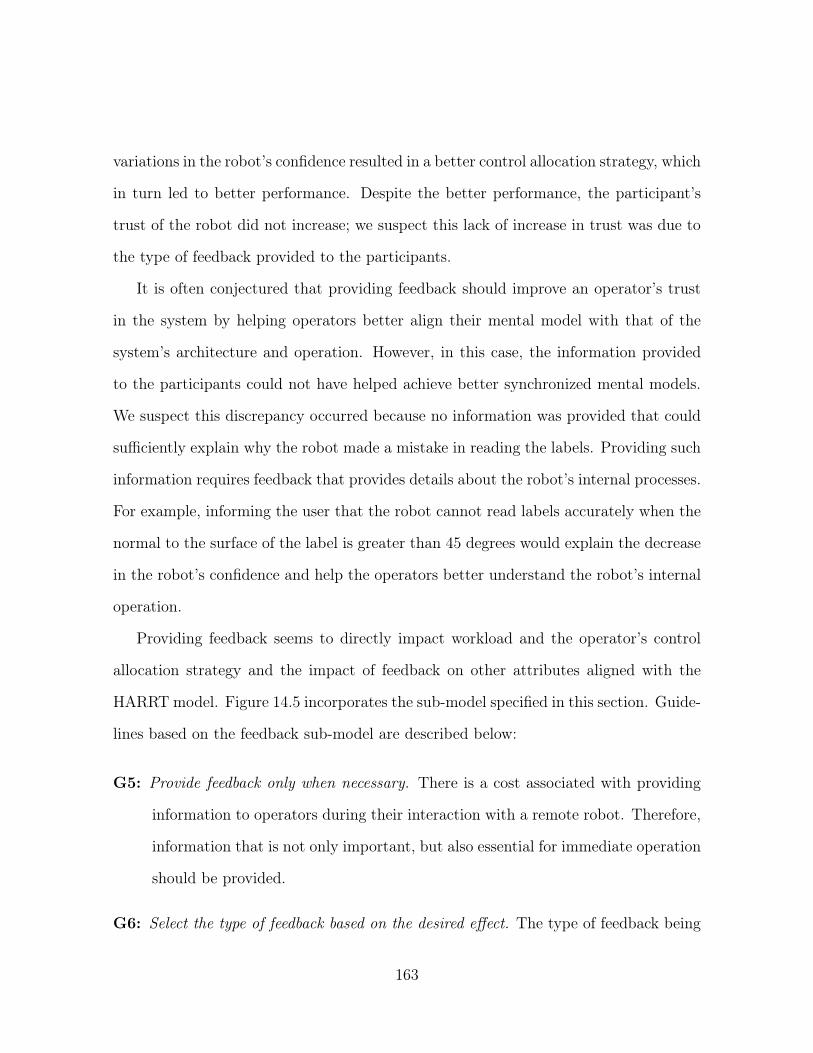
variations in the robot’s confidence resulted in a better control allocation strategy, which
in turn led to better performance. Despite the better performance, the participant’s
trust of the robot did not increase; we suspect this lack of increase in trust was due to
the type of feedback provided to the participants.
It is often conjectured that providing feedback should improve an operator’s trust
in the system by helping operators better align their mental model with that of the
system’s architecture and operation. However, in this case, the information provided
to the participants could not have helped achieve better synchronized mental models.
We suspect this discrepancy occurred because no information was provided that could
sufficiently explain why the robot made a mistake in reading the labels. Providing such
information requires feedback that provides details about the robot’s internal processes.
For example, informing the user that the robot cannot read labels accurately when the
normal to the surface of the label is greater than 45 degrees would explain the decrease
in the robot’s confidence and help the operators better understand the robot’s internal
operation.
Providing feedback seems to directly impact workload and the operator’s control
allocation strategy and the impact of feedback on other attributes aligned with the
HARRT model. Figure 14.5 incorporates the sub-model specified in this section. Guide-
lines based on the feedback sub-model are described below:
G5: Provide feedback only when necessary. There is a cost associated with providing
information to operators during their interaction with a remote robot. Therefore,
information that is not only important, but also essential for immediate operation
should be provided.
G6: Select the type of feedback based on the desired effect. The type of feedback being
163

provided to the operators must be considered carefully, since that can impact an
operator’s behavior. The corollary is, that based on the desired effect on operator
behavior, different types of feedback can be provided. For example, a temporal
impact on control allocation can be expected if the robot’s confidence is being
presented to the operators. However, if a long term effect is desired, other means
of providing information must be selected. For example, explaining the typical
causes for reduction in the robot’s confidence could provide the operators with
better understanding of the robot and its sensors and result in a permanent effect.
But guideline G5 regarding workload must be considered while doing so.
14.3 Reducing Task Difficulty
Figure 14.3 shows the results of comparing data from the baseline Real-Time Trust (RT)
experiment with that of the Reduced Difficulty (RD) experiment where the difficulty
of the teleoperation task was reduced.
14.3.1 Qualitative Model
With the teleoperation task easier to perform, we expected the participants to not rely
on the fully autonomous mode as much, and, consequently, a poor control allocation
strategy was expected. However, the control allocation strategy improved along with
an increase in autonomy mode switches. We suspect the reduced difficulty of the tele-
operation task reduced the participants’ workload and allowed them to better observe
the robot’s performance in the fully autonomous mode. This better robot supervision
allowed them to switch autonomy modes appropriately and improve the control alloca-
tion strategy. We suspect that improvement in supervision and the resulting increase in
164

Reducing task difficulty
Improved control allocation strategy
Decreased time
Decreased hits
Fewer wrong turns
Increased self performance rating
Decreased perceived risk
Figure 14.3: The impact of reducing task difficulty on different factors. All of the effectsshown are based on significant differences between the Reduced Difficulty (RD) and RTexperiments.
autonomy mode switches increased the workload enough to offset the initial reduction
in workload due to the easier task.
The easier teleoperation task and the better robot supervision improved perfor-
mance and safety by reducing the number of hits, reducing the time needed to finish,
and reducing the number of wrong turns. Reducing the difficulty of the task seems
to primarily impact an operator’s control allocation strategy. The impact on other
attributes aligns with the HARRT model and Figure 14.5 incorporates the sub-model
specified in this section. Guidelines based on the reduced difficulty sub-model are de-
scribed below:
G7: Tasks with reduced difficulty result in better robot supervision and no reduction
in workload. If the difficulty of the task reduces during an interaction or for in-
teractions that involve a remote robot teleoperation task that is relatively easy,
operators should be expected to allocate the additional available cognitive re-
sources towards better supervision of the robot’s behavior or secondary tasks.
165

Familiarity with robots
Lowered trust (Muir/AUTC)
Decreased mode switches
Improved control allocation strategy
Increased workload
Increased perceived risk
Figure 14.4: The impact of familiarity with robots on different factors. All of the effectsshown are based on significant differences between the two participant groups in theLong Term (LT) experiment.
G8: Do not expect operators to assume manual control for easier tasks. Operators
will not necessarily opt for lower autonomy modes, at least in scenarios involving
multiple tasks or a relatively high workload. While a reduction in the difficulty of
the task will improve performance and safety, the operator’s trust of the system
will not be affected.
14.4 Long Term Interaction
The long term interaction experiment (LT) was conducted to investigate if operator’s
trust and control allocation strategy change over a longer period of time. If trends were
found they would be incorporated into the model and the a set of guidelines would be
created based on that. Another goal of the LT experiment was to investigate if there
is a difference between operators who are familiar with robots and those who are not.
166

14.4.1 Qualitative Model
Interestingly, no significant differences were found between sessions two through six for
any attribute. This lack of a difference between sessions and the significant similarities
found between sessions indicates that an operator’s behavior during initial interaction
can predict his or her behavior over the short term.
With respect to the impact of familiarity with robots, several significant differences
were found. Figure 14.4 shows the impact familiarity with robots has on operator
behavior. It shows that while there wasn’t a difference in performance, the participants
who were familiar with robots trusted them less and had an increased workload, perhaps
due to better robot supervision in accordance with the HARRT model. The better robot
supervision in turn positively affected their control allocation strategy also is consistent
with the HARRT model. Figure 14.5 shows the familiarity sub-model incorporated
into the HARRT model and guidelines based on the reduced long term and familiarity
sub-model are described below:
G9: Initial operator behavior does not change over the short term. It is possible to
quickly assess and predict an operator’s behavior over a longer period of time,
based on their initial interactions with the robot.
G10: Familiarity with robots does not impact performance. Familiarity with robots
should not be interpreted as or confused with expertise in remote robot teleop-
eration. While familiarity with robots impacts trust and other attributes it does
not impact performance.
167
14.5 Impact of Timing of Periods of Low Reliability
Periods of low reliability early in the interaction not only have a more immediate detri-
mental impact on trust, but that effect lasts throughout the interaction as it also
impedes the recovery of trust. Since the experimental setup was designed to require
participants to rely more on the fully autonomous mode, the impact of decreased trust
on other parameters was not as noticeable. However, for most balanced operations, the
impact on trust would also be accompanied with a similar impact on control allocation,
performance, and workload. Guidelines based on the impact of periods of low reliability
early in the interaction are described below:
G11: Operator’s initial interactions must always be stable. The implications of the
timing data are that initial segments of every interaction must be stable and
reliable. If needed, they should be facilitated by conducting a short controlled
interaction.
G12: In the event of a reliability drop early in the interaction corrective measures
must be taken. These steps (e.g., providing information explaining the cause for
the reduction in reliability) must essentially minimize or prevent erratic operator
behavior due to confusion or other factors. There are costs associated with these
preventive steps, along with other implications associated with different measures,
so caution must be exercised while selecting corrective measures.
14.6 Impact of Age
As people age, their attitude towards risk changes: they are willing to take fewer
risks. This unwillingness to take on more risk is inherent in the fact that they prefer
168

some autonomy modes and do not switch out of their comfort zone as often. Attitudes
towards risk change with age, but so does the view or the definition of risk. It was often
mentioned by the older participants that the compensation did not matter to them as
much. However, it must also be said that they were still motivated to perform well.
The inertia in control allocation exhibited by the older participants could potentially
also have increased their workload and ultimately performance. Guidelines based on
the impact of age are described below:
G13: Know your target audience. It is important to take into account the different
population groups that will be interacting with a robot. Understanding the moti-
vations of the operators can help explain their view on potential risks and better
predict their behavior.
G14: Accommodate operators of all ages. Due to a higher probability of poor control
allocation and poor performance for older operators, more time should be spent
training them. To counteract the inertia observed, additional steps can also be
taken. However, caution must be exercised to ensure that these steps do not in-
crease their workload. For the other end of the age spectrum, given their tendency
to take more risk, the risks involved in the scenario must be explained carefully.
Since the younger population has the ability to better manage workload and bet-
ter robot management, it should be easier to influence their control allocation
strategy if needed.
169

Hits
Time
Manual errors TLX
Wrong turns
RQ2
RQ3
Perceived riskSelf performance rating
Use of RAMuir
Control allocation strategy
Situation awareness
Confidence feedback
Task difficulty
Age
Figure 14.5: The original human and autonomous remote robot teleoperation (HARRT)model augmented with the sub-models derived in this chapter. The orange or blue arrowindicate an inverse relationship or a proportional relationship respectively.
170
Chapter 15
Conclusions and Future Work
The prime motivation for this research was to investigate ways to improve human-robot
interaction (HRI) in the domain of remote robot teleoperation (RRT). We selected the
remote robot teleoperation domain because it is one of the more difficult fields within
HRI due to the fact that operators are not co-located with the robot and hence have to
rely on the robot’s sensors to maintain the required situation awareness (SA). It is also
a complex, challenging, and cognitively overwhelming task when performed manually
or with minimal assistance from the robot.
The first step towards understanding human-robot interaction in the RRT domain
was to assess the different factors that are at play when an operator controls a remote
autonomous robot. Based on prior research in the human-automation interaction do-
main, we expected trust to be the crucial factor that dictates how operators utilize the
autonomous (or semi-autonomous) behaviors. Hence, we conducted multiple surveys
with domain experts and novice users to understand their perspective on the task. We
found that reliability and risk were consistently ranked as being important. Armed with
this knowledge, the next logical step was to start examining how reliability impacts an
171
operator’s trust of the robot and control allocation strategy.
We carefully designed an experimental setup that incorporated the key aspects of
remote robot teleoperation, while providing a controlled environment that was easy
to replicate and use for multiple experiments. The ability to replicate was essential
to allow data to be compared from different sites and from experiments investigating
different factors. The experimental methodology was then modified to allow observation
of real-time trust, which provided valuable insight about how trust evolves during an
interaction and the implications of periods of low reliability early in the interaction.
Using the experimental methodology, multiple experiments were conducted to ex-
amine the impact of different factors on operator trust and control allocation. These
factors were selected based on different criteria. Some factors were selected based on
the results of the initial surveys (i.e., reliability and risk). In fact, to better model real
world scenarios, we ensured that dynamic reliability and risk were inherent in all of the
experiments. Other factors like situation awareness (SA) and reduced task difficulty
(RD) were selected based on their significance to the remote robot teleoperation task
and also on our observations of other experiments involving remote robot teleoperation.
Factors like feedback and long term interaction were selected based on conjectures and
commonly held beliefs. For example, it is often assumed that providing feedback to the
operator should increase their trust of the robot and improve performance.
The results from these experiments showed interesting, sometimes unexpected, but
overall insightful data. Using that data we were able to find different attributes that
are relevant to human interaction with remote autonomous robot and the mediating
relationships between them. These results were used to create the human interaction
with autonomous remote robots (HARRT) model. Based on the HARRT model and the
specific experiments, guidelines were proposed that should help improve overall perfor-
172
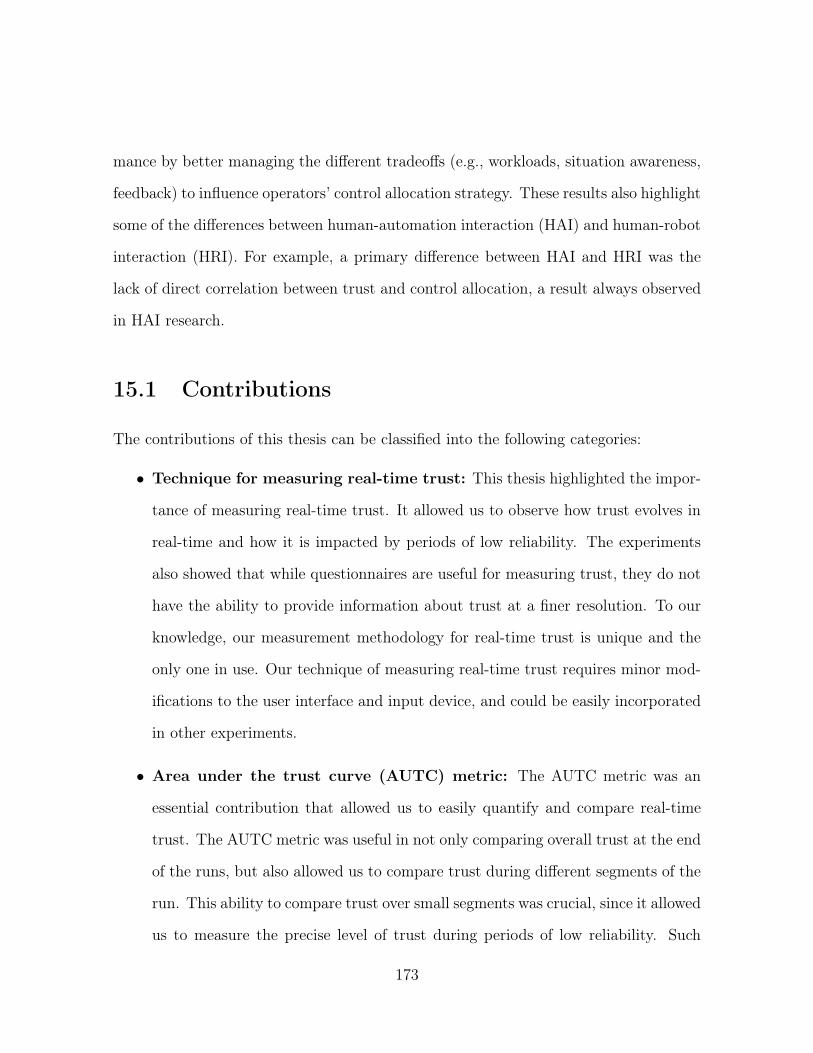
mance by better managing the different tradeoffs (e.g., workloads, situation awareness,
feedback) to influence operators’ control allocation strategy. These results also highlight
some of the differences between human-automation interaction (HAI) and human-robot
interaction (HRI). For example, a primary difference between HAI and HRI was the
lack of direct correlation between trust and control allocation, a result always observed
in HAI research.
15.1 Contributions
The contributions of this thesis can be classified into the following categories:
• Technique for measuring real-time trust: This thesis highlighted the impor-
tance of measuring real-time trust. It allowed us to observe how trust evolves in
real-time and how it is impacted by periods of low reliability. The experiments
also showed that while questionnaires are useful for measuring trust, they do not
have the ability to provide information about trust at a finer resolution. To our
knowledge, our measurement methodology for real-time trust is unique and the
only one in use. Our technique of measuring real-time trust requires minor mod-
ifications to the user interface and input device, and could be easily incorporated
in other experiments.
• Area under the trust curve (AUTC) metric: The AUTC metric was an
essential contribution that allowed us to easily quantify and compare real-time
trust. The AUTC metric was useful in not only comparing overall trust at the end
of the runs, but also allowed us to compare trust during different segments of the
run. This ability to compare trust over small segments was crucial, since it allowed
us to measure the precise level of trust during periods of low reliability. Such
173

measurements would not have been feasible with typical trend analyses, which
require large amounts of data and can only compare data over longer segments.
• Control allocation (CA) strategy metric: The issue of ideal control alloca-
tion is often raised and discussed, however, not quantified and measured. This
thesis showed a way to quantify the operator’s control allocation strategy by ex-
pressing it in terms of the deviation from the ideal control allocation strategy.
This metric should allow researchers to better evaluate the control allocation
strategy and find ways to remedy problems. It should be noted that the emphasis
in research is often to find ways to make operators rely more on the autonomous
behaviors. However, that is not a good metric or milestone, as such theories are
based on the flawed assumption that the autonomous behaviors are always better
and that automation is perfectly reliable.
• Impact of timing of periods of low reliability: One of the crucial findings
of this thesis was the impact of periods of low reliability at different points in
the interaction. It revealed that when reliability drops early in the interaction,
it has a more pronounced impact on trust and it also lowers the rate of recovery
of trust. When periods of low reliability occur late in the run, their impact on
real-time trust and other attributes is minimal and closer to that observed for
perfect reliability (Reliability A). End of run measures such as Muir and Jian
are subject to recency effects, whereas the real-time trust measurements provide
a more accurate view of trust throughout the run and during periods of low
reliability.
• Consistency in operator behavior over long term interaction: The week-
long interaction with each participant provided valuable insight. It showed that
174
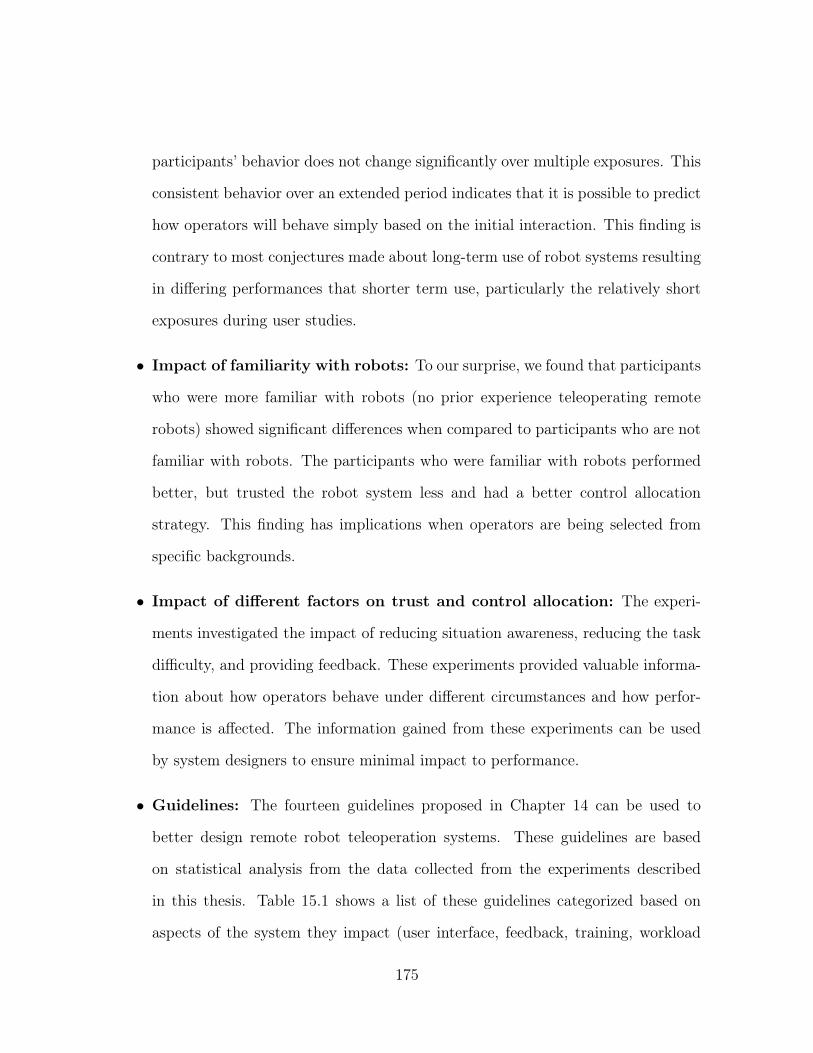
participants’ behavior does not change significantly over multiple exposures. This
consistent behavior over an extended period indicates that it is possible to predict
how operators will behave simply based on the initial interaction. This finding is
contrary to most conjectures made about long-term use of robot systems resulting
in differing performances that shorter term use, particularly the relatively short
exposures during user studies.
• Impact of familiarity with robots: To our surprise, we found that participants
who were more familiar with robots (no prior experience teleoperating remote
robots) showed significant differences when compared to participants who are not
familiar with robots. The participants who were familiar with robots performed
better, but trusted the robot system less and had a better control allocation
strategy. This finding has implications when operators are being selected from
specific backgrounds.
• Impact of different factors on trust and control allocation: The experi-
ments investigated the impact of reducing situation awareness, reducing the task
difficulty, and providing feedback. These experiments provided valuable informa-
tion about how operators behave under different circumstances and how perfor-
mance is affected. The information gained from these experiments can be used
by system designers to ensure minimal impact to performance.
• Guidelines: The fourteen guidelines proposed in Chapter 14 can be used to
better design remote robot teleoperation systems. These guidelines are based
on statistical analysis from the data collected from the experiments described
in this thesis. Table 15.1 shows a list of these guidelines categorized based on
aspects of the system they impact (user interface, feedback, training, workload
175
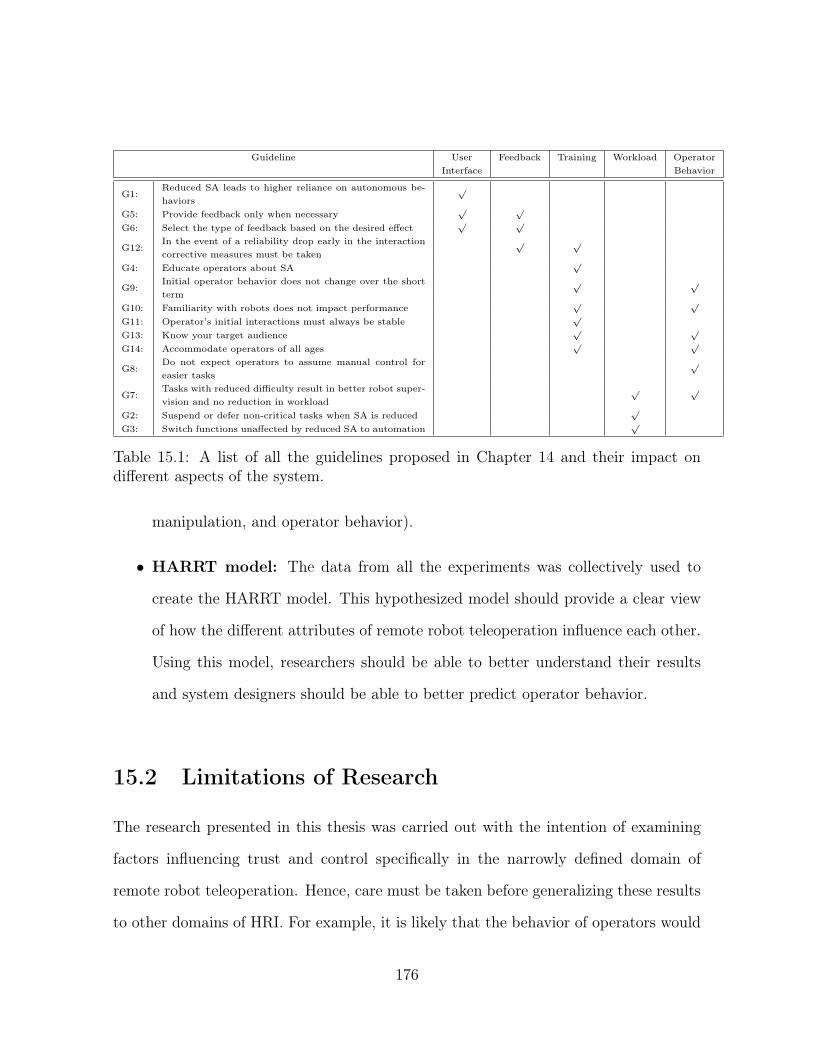
Guideline User Feedback Training Workload OperatorInterface Behavior
G1:Reduced SA leads to higher reliance on autonomous be-haviors
p
G5: Provide feedback only when necessaryp p
G6: Select the type of feedback based on the desired effectp p
G12:In the event of a reliability drop early in the interactioncorrective measures must be taken
p p
G4: Educate operators about SAp
G9:Initial operator behavior does not change over the shortterm
p p
G10: Familiarity with robots does not impact performancep p
G11: Operator’s initial interactions must always be stablep
G13: Know your target audiencep p
G14: Accommodate operators of all agesp p
G8:Do not expect operators to assume manual control foreasier tasks
p
G7:Tasks with reduced difficulty result in better robot super-vision and no reduction in workload
p p
G2: Suspend or defer non-critical tasks when SA is reducedp
G3: Switch functions unaffected by reduced SA to automationp
Table 15.1: A list of all the guidelines proposed in Chapter 14 and their impact ondifferent aspects of the system.
manipulation, and operator behavior).
• HARRT model: The data from all the experiments was collectively used to
create the HARRT model. This hypothesized model should provide a clear view
of how the different attributes of remote robot teleoperation influence each other.
Using this model, researchers should be able to better understand their results
and system designers should be able to better predict operator behavior.
15.2 Limitations of Research
The research presented in this thesis was carried out with the intention of examining
factors influencing trust and control specifically in the narrowly defined domain of
remote robot teleoperation. Hence, care must be taken before generalizing these results
to other domains of HRI. For example, it is likely that the behavior of operators would
176
be considerably different if they were co-located with the robot, primarily due to better
situation awareness. Similarly, the context in which the experiments were conducted
must also be considered before generalizing. All of the experiments presented in this
thesis represented high risk scenarios with a high workload for the operator. If risk is
entirely eliminated and the workload reduced to a minimum, then perhaps the HARRT
model might not be appropriate. However, such low risk and low workload scenarios
are unlikely in the real world. Nonetheless, context of the application must always be
considered.
The total number of participants from all of the experiments combined total eighty-
four. While this is a relatively high number for studies in HRI involving a real world
robot, it is not nearly enough to create a definitive model of human interaction with re-
mote robots. Hence, for this reason, the HARRT model is presented as a hypothesized
model, even though it is based on statistically significant data from all of the experi-
ments. To create a more conclusive version of the HARRT model, more participants
would be needed and the distribution of these participants along the different charac-
teristics (e.g., age, gender, technical background, etc.) would also need to be more or
less uniform. While we were fortunate to have a diverse group of participants across
age and gender, it is not entirely balanced and this fact must be taken into account
before widely using the HARRT model.
15.3 Future Work
While this thesis investigates four different factors that impact an operator’s trust
and control allocation providing valuable contribution, additional factors remain to be
investigated.
177

15.3.1 Additional Factors for Experimentation
Based on the feedback experiment, we posited that the type of feedback determines
how operator behavior is affected. We suspect feedback that helps the operator better
align their mental model of the robot’s behaviors will have a longer lasting impact.
Similarly, based on the differences between the two participant groups for the long
term experiment and the initial survey, we expect there to be differences between do-
main experts and novices as well as between people that are experienced teleoperators
and those that are not. These differences are important to investigate, as they will
become more relevant as applications of remote robots increase.
The experiments involved consistently high workloads with a significant amount
of risk. While the high risk and high workloads are more realistic, the far end of the
spectrum where the task is easy and involves minimal risk also needs to be investigated.
15.3.2 HARRT Model
While the HARRT model was based on the data from the experiments, it is still a
hypothesized model in its current state. Additional experiments must be conducted to
explicitly verify the hypothesized causality between the attributes. Also, experiments
validating the links between these attributes must be diverse in order to validate the
generality of the HARRT model.
The HARRT model is a qualitative model, and, as such, it helps to highlight the
relationships between the different attributes. However, it is not a quantitative model
and can not be used to predict trust, control allocation, workload, etc. If quantitative
models are needed to accurately predict performance and behavior, additional models
need to be created. While attempts were made to create quantitative models using
178
decision trees and linear regression, the prediction rates were not high when data from
individual experiments were considered. The prediction rates were even lower when the
data from all the experiments were considered in aggregate. Hence, to create a useful
quantitative model, we suspect large amounts of data would be required.
15.3.3 Measuring Real-time Performance
The Muir trust values showed significant correlations with some factors as shown in
Figure 13.6. However, the AUTC metric did not show a significant correlation with
other factors. This lack of correlation for AUTC was interesting; however, we suspect
it was due to the nature of the metrics being considered. The AUTC metric is use-
ful in observing real-time variations in trust. However, all of the other metrics were
cumulative, similar to the Muir trust scale, and hence the real-time changes were not
adequately reflected. Therefore, it would be worth investigating the correlation between
real-time variations in trust and other real-time metrics (e.g., hits, wrong turns, work-
load, secondary tasks). This investigation would further demonstrate the usefulness
of the AUTC metric, validate some of the hypothesized causes for correlations in the
HARRT model, and finally the data from those experiments could be used for real-time
prediction of trust, workload, and other subjective measures.
15.3.4 Investigating Different Domains
The task selected for our research was difficult and involved high levels of risk. The
risk in the scenario was not only based on the loss of compensation, but also based on
damage to the robot and the environment. Had the robot been used in the intended
scenario of search and rescue, the risk would have been far greater. However, there
179
are other domains where the risk is not as substantial and the necessity for using
a remote robot is not as high. Using telepresence robots to visit museums, other
public sites, or even family members in their homes can be such an example, where
people can opt out of using a remote robot. Given the design of most telepresence
robots, the risk of damage to the environment or to the robot itself would also be low.
Under such circumstances it is important to investigate how trust and operator behavior
are impacted when interaction involves low risk and low motivation. Also, in such a
scenario, the teleoperation task is secondary and the primary task is the interaction with
people in the remote environment or observing the remote environment. The added
layer of abstraction in the interaction must also be considered. Does the lack of trust,
inappropriate control allocation, or perceived performance impact an operator’s primary
task of interaction? And if so, can the perceived performance, control allocation, or
trust be artificially altered to positively impact the operator’s interaction?
15.3.5 Increasing Robustness in Interactions
From the experiments, it was evident that there were differences in participants’ be-
haviors. Such variations make it difficult to predict behavior and even more difficult
to detect odd behavior. If operators can be trained in a way that results in a more
predictable behavior, then it would be feasible to detect odd behavior and therefore
provide targeted assistance. While training is the key to ensuring consistent behavior,
the specifics of the training regimen need to be investigated. While training operators
for a long period of time is a possibility, it is not a practical solution and training
methodologies must be created that are short in duration, but just as effective. Un-
fortunately, remote robot teleoperation is a very complex and is also relatively new,
making it difficult to leverage existing biases or knowledge, unlike in designing gesture
180
sets for multi-touch devices.
One of the reasons that makes training for remote robot teleoperation difficult is
the lack of feedback. While the operators can observe the remote environment through
sensors and video feeds from the camera, it is still difficult for operators to fully com-
prehend the consequences of their actions or commands. This issue can potentially be
mitigated by providing a free roaming third person view of the robot where the opera-
tors experience a variety of environments that they could potentially encounter. Since
such a training scenario cannot possibly be provided with a real world robot, simulated
environments must be used. Preferably, simulations with high fidelity physics where the
structures in the environments can be modeled to be destructible. Since, none of the
simulation environments used for robots provide these characteristics, video game en-
gines must be used for such training. Training in a high fidelity simulated environment
will hopefully allow the operators to view the consequences of their (or the robot’s)
actions in real-time and post-interaction.
We hypothesize that such a training regimen will allow the operators to quickly
improve their skill and it will also allow them to better assess the robot’s capabilities.
These two characteristics will help the operators better calibrate their own skills and
those of the robot, which would hopefully result in a more consistent behavior across a
wide range of operators.
15.4 Summary
This thesis examines the different attributes that are at play when an operator interacts
with a remote robot and how they are related to each other. The research also shows the
specific effects of modifying certain attributes on operator behavior and performance.
181
Many useful results and guidelines based on those results are presented. Among them,
one of the more important and surprising one is the lack of strong correlation between
trust and control allocation, as expected based on prior research. While the HARRT
model helps explain operator behavior, however, additional research needs to be con-
ducted to investigate other factors, to validate the model, and make the model more
comprehensive and generalizable. And finally, based on all of that information, ways
to achieve consistent operator behavior must be investigated, since, consistent operator
behavior is crucial to not only to the successful wide spread adoption and use of remote
robots but also for standardizing remote robot systems themselves.
182
Bibliography
[Atoyan et al., 2006] Atoyan, H., Duquet, J.-R., and Robert, J.-M. (2006). Trust in
New Decision Aid Systems. In International Conferenceof the Association Franco-
phone d’Interaction Homme-Machine, pages 115–122, Montréal. 1.2, 7
[Bainbridge et al., 1968] Bainbridge, L., Beishon, J., Hemming, J. H., and Splaine, M.
(1968). A Study of Real-time Human Decision-Making Using a Plant Simulator.
Operational Research Society, 19(Special Conference Issue):91–106. 5
[Baker and Yanco, 2004] Baker, M. and Yanco, H. (2004). Autonomy Mode Sugges-
tions for Improving Human-Robot Interaction. In IEEE International Conference on
Systems, Man and Cybernetics. Proceedings, pages 2948–2943. 1, 1.2, 2.2
[Bisantz and Seong, 2001] Bisantz, A. M. and Seong, Y. (2001). Assessment of Oper-
ator Trust in and Utilization of Automated Decision-Aids Under Different Framing
Conditions. International Journal of Industrial Ergonomics, 28(2):85–97. 5
[Bliss and Acton, 2003] Bliss, J. P. and Acton, S. A. (2003). Alarm Mistrust in Au-
tomobiles: How Collision Alarm Reliability Affects Driving. Applied Ergonomics,
34(6):499–509. 1.3, 2.2
183

[Boehm-Davis et al., 1983] Boehm-Davis, D. A., Curry, R. E., Wiener, E. L., and Har-
rison, L. (1983). Human Factors of Flight-Deck Automation: Report on a NASA-
Industry Workshop. Ergonomics, 26(10):953–961. 1, 2
[Bruemmer et al., 2002] Bruemmer, D. J., Dudenhoeffer, D. D., and Marble, J. L.
(2002). Dynamic Autonomy for Urban Search and Rescue. In Proceedings of the
AAAI Mobile Robot Workshop. 1.2, 2.2
[Burke et al., 2004a] Burke, J. L., Murphy, R. R., Riddle, D. R., and Fincannon, T.
(2004a). Task Performance Metrics in Human-Robot Interaction: Taking a Systems
Approach. Performance Metrics for Intelligent Systems. 1
[Burke et al., 2004b] Burke, J. L., Murphy, R. R., Rogers, E., Lumelsky, V. L., and
Scholtz, J. (2004b). Final Report for the DARPA/NSF Interdisciplinary Study on
Human–Robot Interaction. Systems, Man, and Cybernetics, Part C: Applications
and Reviews, IEEE Transactions on, 34(2):103–112. 2.2, 7
[CasePick Systems, 2011] CasePick Systems (2011). Casepick systems. http://www.
casepick.com/company. Accessed: 30/12/2011. 2.2
[Chen, 2009] Chen, J. Y. (2009). Concurrent Performance of Military Tasks and
Robotics Tasks: Effects of Automation Unreliability and Individual Differences. In
Proceedings of the 4th ACM/IEEE international conference on Human robot inter-
action, pages 181–188, La Jolla, CA. 1.1, 2.1
[Chen and Thropp, 2007] Chen, J. Y. and Thropp, J. (2007). Review of Low Frame
Rate Effects on Human Performance. Systems, Man and Cybernetics, Part A: Sys-
tems and Humans, IEEE Transactions on, 37(6):1063–1076. 7
184
[Cohen et al., 1998] Cohen, M. S., Parasuraman, R., and Freeman, J. T. (1998). Trust
in Decision Aids: A Model and its Training Implications. Command and Control
Research and Technology Symposium. 2.1
[Cooper, 2012] Cooper, Q. (2012). Robot Realities Fail Fictional Fantasies. http:
//www.bbc.com/future/story/20120330-robot-realities. 4.2.1
[Cummings, 2004] Cummings, M. (2004). The Need for Command and Control Instant
Message Adaptive Interfaces: Lessons Learned from Tactical Tomahawk Human-in-
the-Loop Simulations. CyberPsychology & Behavior, 7(6):653–661. 7
[Dellaert and Thorpe, 1998] Dellaert, F. and Thorpe, C. (1998). Robust Car Track-
ing Using Kalman Filtering and Bayesian Templates. In Intelligent Transportation
Systems Conference, pages 72–83. 2, 2.2
[Desai et al., 2013] Desai, M., Kaniarasu, P., Medvedev, M., Steinfeld, A., and Yanco,
H. (2013). Impact of Robot Failures and Feedback on Real-Time Trust. In Proceed-
ings of the eighth Annual ACM/IEEE International Conference on Human-Robot
Interaction, pages 1–8. 1
[Desai et al., 2012a] Desai, M., Medvedev, M., Vazquez, M., McSheehy, S., Gadea-
Omelchenko, S., Bruggeman, C., Steinfeld, A., and Yanco, H. (2012a). Effects of
Changing Reliability on Trust of Robot Systems. In Proceedings of the seventh Annual
ACM/IEEE International Conference on Human-Robot Interaction, pages 1–8. 1, 1
[Desai and Yanco, 2005] Desai, M. and Yanco, H. (2005). Blending Human and Robot
Inputs for Sliding Scale Autonomy. In IEEE International Workshop on Robots and
Human Interactive Communication, pages 537–542. 1.2, 2.2
185
[Desai et al., 2012b] Desai, M., Yanco, H., Steinfeld, A., Aziz, R. D., and Bruggeman,
C. (2012b). Identifying Factors that Influence Trust in Human-Robot Interaction -
In Submission. Technical report, University of Massachusetts Lowell. 4, 4.2.4
[deVries et al., 2003] deVries, P., Midden, C., and Bouwhuis, D. (2003). The Effects
of Errors on System Trust, Self-Confidence, and the Allocation of Control in Route
Planning. International Journal of Human Computer Studies, 58(6):719–735. 2, 5
[Dixon and Wickens, 2006] Dixon, S. R. and Wickens, C. (2006). Automation Relia-
bility in Unmanned Aerial Vehicle Control: A Reliance-Compliance Model of Au-
tomation Dependence in High Workload. Human Factors, 48(3):474–486. 2.2, 4.2.1,
5
[Dorneich et al., 2010] Dorneich, M. C., Whitlow, S. D., Olson, E., and Anhalt, D.
(2010). The Combat Causal Reasoner Approach to Robotic Control. Proceedings of
the Human Factors and Ergonomics Society Annual Meeting, 54(25):2140–2144. 7
[Dudek et al., 1993] Dudek, G., Jenkin, M., Milios, E., and Wilkes, D. (1993). A Tax-
onomy for Swarm Robots. In IEEE/RSJ Internation Conference on Intelligent Robots
and Systems, pages 441–447, Yokohama, Japan. 2.2
[Dzindolet et al., 2002] Dzindolet, M., Pierce, L., Beck, H., and Dawe, L. (2002). The
perceived utility of human and automated aids in a visual detection task. Human
Factors: The Journal of the Human Factors and Ergonomics Society, 44(1):79. 5.6
[Dzindolet et al., 2001] Dzindolet, M., Pierce, L., Beck, H., Dawe, L., and Anderson,
B. (2001). Predicting misuse and disuse of combat identification systems. Military
Psychology, 13(3):147–164. 2.2
186

[Dzindolet et al., 2003] Dzindolet, M. T., Peterson, S. A., Pomranky, R. A., Pierce,
L. G., and Beck, H. P. (2003). The Role of Trust in Automation Reliance. Inter-
national Journal of Human Computer Studies, 58(6):697–718. 1.3, 2, 4.2.1, 5, 6.1.1,
9
[Endsley and Kiris, 1995] Endsley, M. and Kiris, E. (1995). The out-of-the-loop per-
formance problem and level of control in automation. Human Factors: The Journal
of the Human Factors and Ergonomics Society, 37(2):381–394. 1, 2
[Endsley, 1988] Endsley, M. R. (1988). Design and Evaluation for Situation Awareness
Enhancement. In Proceedings of the Human Factors and Ergonomics Society Annual
Meeting, pages 97–101. (document), 7, C.2.5
[Farrell and Lewandowsky, 2000] Farrell, S. and Lewandowsky, S. (2000). A connec-
tionist model of complacency and adaptive recovery under automation. Journal of
Experimental Psychology: Learning, Memory, and Cognition, 26(2):395. 2.1, 5
[Freedy et al., 2007] Freedy, A., DeVisser, E., and Weltman, G. (2007). Measurement
of Trust in Human-Robot Collaboration. Collaborative Technologies and Systems. 1,
1.3
[Gerkey et al., 2003] Gerkey, B., Vaughan, R., and Howard, A. (2003). The
player/stage project: Tools for multi-robot and distributed sensor systems. In Pro-
ceedings of the 11th international conference on advanced robotics, pages 317–323.
Portugal. 5.1
[Google Cars, 2011a] Google Cars (2011a). Google’s autonomous car project. http:
//googleblog.blogspot.com/2010/10/what-were-driving-at.html. Accessed:
30/12/2011. 2, 2.2
187
[Google Cars, 2011b] Google Cars (2011b). How google’s self-driving car works.
http://spectrum.ieee.org/automaton/robotics/artificial-intelligence/
how-google-self-driving-car-works. Accessed: 30/12/2011. 2
[Grasmick et al., 1993] Grasmick, H., Tittle, C., Bursick, Jr, R., and Arneklev, B.
(1993). Testing the Core Empirical Implications of Gottfredson and Hirschi’s General
Theory of Crime. Journal of Research in Crime and Delinquency, 30(1):5–29. 13.1.2
[Hart and Staveland, 1988] Hart, S. G. and Staveland, L. E. (1988). Development of
NASA-TLX (Task Load Index): Results of Empirical and Theoretical Research.
Human Mental Workload, 1(3):139–183. 6.1.7
[Harville, 1977] Harville, D. (1977). Maximum likelihood approaches to variance com-
ponent estimation and to related problems. Journal of the American Statistical As-
sociation, pages 320–338. 6.1.2, 7.2
[Hirzinger et al., 1994] Hirzinger, G., Brunner, B., Dietrich, J., and Heindl, J. (1994).
ROTEX-the First Remotely Controlled Robot in Space. In IEEE International Con-
ference on Robotics and Automation, pages 2604–2611. IEEE. 1.1
[IFR, 2011] IFR (2011). Statistics about service robots. http://www.ifr.org/
service-robots/statistics/. Accessed: 30/12/2011. 1, 2
[Intouch Health, 2012] Intouch Health (2012). The RP-7i Remote Presence
Robot. http://www.intouchhealth.com/products-and-services/products/
rp-7i-robot/. 1.1
[Intuitive Surgical, 2012] Intuitive Surgical (2012). The da Vinci Surgical System.
http://www.intuitivesurgical.com/products/davinci_surgical_system/. 1.1
188

[iRobot, 2012] iRobot (2012). iRobot 510 PackBot. http://www.irobot.com/us/
robots/defense/packbot.aspx. 1.1
[Jian et al., 2000a] Jian, J., Bisantz, A., and Drury, C. (2000a). Foundations for an
empirically determined scale of trust in automated systems. International Journal of
Cognitive Ergonomics, 4(1):53–71. 4.1
[Jian et al., 2000b] Jian, J., Bisantz, A., and Drury, C. (2000b). Foundations for an
empirically determined scale of trust in automated systems. Int’l Journal of Cognitive
Ergonomics, 4(1):53–71. 5.7
[Johnson et al., 2004] Johnson, J., Sanchez, J., Fisk, A., and Rogers, W. (2004). Type
of automation failure: The effects on trust and reliance in automation. In Proceedings
of the Human Factors and Ergonomics Society Annual Meeting, volume 48, pages
2163–2167. SAGE Publications. 5
[Keyes, 2007] Keyes, B. (2007). Evolution of a telepresence robot interface. Unpublished
master’s thesis). University of Massachusetts, Lowell. 7
[Khasawneh et al., 2003] Khasawneh, M., Bowling, S., Jiang, X., Gramopadhye, A.,
and Melloy, B. (2003). A model for predicting human trust in automated systems.
Origins. 5
[Kiva Systems, 2011] Kiva Systems (2011). Kiva systems. http://www.kivasystems.
com/. Accessed: 30/12/2011. 2.2
[Lee, 1992] Lee, J. (1992). Trust, Self-confidence and Operator’s Adaptation to Au-
tomation. PhD thesis, University of Illinois at Urbana-Champaign. 2.1
189
[Lee and Moray, 1991] Lee, J. and Moray, N. (1991). Trust, self-confidence and super-
visory control in a process control simulation. IEEE Int’l Conference on Systems,
Man, and Cybernetics, pages 291–295. (document), 2.3, 3, 5
[Lee and Moray, 1992a] Lee, J. and Moray, N. (1992a). Trust, control strategies and
allocation of function in human-machine systems. Ergonomics. 5.6, 6.1.6
[Lee and Moray, 1994] Lee, J. and Moray, N. (1994). Trust, self-confidence, and opera-
tors’ adaptation to automation. International Journal of Human Computer Studies,
40(1):153–184. 1, 1.2, 1.3, 5
[Lee and See, 2004] Lee, J. and See, K. (2004). Trust in automation: designing for
appropriate reliance. Human Factors, 46:50–80. 1.2
[Lee and Moray, 1992b] Lee, J. D. and Moray, N. (1992b). Trust, Control Strategies
and Allocation of Function in Human-Machine Systems. Ergonomics, 31(10):1243–
1270. 2.1, 5
[Lewandowsky et al., 2000] Lewandowsky, S., Mundy, M., and Tan, G. (2000). The
dynamics of trust: Comparing humans to automation. Journal of Experimental
Psychology: Applied, 6(2):104. 5
[Lin, 2008] Lin, P. (2008). Autonomous military robotics: Risk, ethics, and design.
Technical report, DTIC Document. 1, 2
[Lovchik and Diftler, 1999] Lovchik, C. and Diftler, M. (1999). The robonaut hand: A
dexterous robot hand for space. In Proceedings of the IEEE International Conference
on Robotics and Automation, volume 2, pages 907–912. IEEE. 1.1
190
[Madhani et al., 2002] Madhani, K., Khasawneh, M., Kaewkuekool, S., Gramopadhye,
A., and Melloy, B. (2002). Measurement of human trust in a hybrid inspection for
varying error patterns. In Proceedings of the Human Factors and Ergonomics Society
Annual Meeting, volume 46, pages 418–422. SAGE Publications. 2.2, 5
[Madhavan et al., 2006] Madhavan, P., Wiegmann, D., and Lacson, F. (2006). Automa-
tion failures on tasks easily performed by operators undermine trust in automated
aids. Human Factors: The Journal of the Human Factors and Ergonomics Society,
48(2):241–256. 5
[Merritt and Ilgen, 2008] Merritt, S. and Ilgen, D. (2008). Not all trust is created equal:
Dispositional and history-based trust in human-automation interactions. Human
Factors: The Journal of the Human Factors and Ergonomics Society, 50(2):194–210.
5
[Michaud et al., 2007] Michaud, F., Boissy, P., Corriveau, H., Grant, A., Lauria, M.,
Labonte, D., Cloutier, R., Roux, M., Royer, M., and Iannuzzi, D. (2007). Telepresence
robot for home care assistance. In AAAI Spring Symposium on Multidisciplinary
Collaboration for Socially Assistive Robotics. 2
[Micire, 2010] Micire, M. (2010). Multi-Touch Interaction for Robot Command and
Control. PhD thesis, University of Massachusetts Lowell, Lowell, MA, USA. 3.3.1
[Moray and Inagaki, 1999] Moray, N. and Inagaki, T. (1999). Laboratory Studies of
Trust Between Humans and Machines in Automated Systems. Transactions of the
Institute of Measurement and Control, 21(4-5):203–211. (document), 2, 2.1, 2.2, 5.1,
5.2, 5.3, 13.3.2
191
[Moray et al., 2000] Moray, N., Inagaki, T., and Itoh, M. (2000). Adaptive Automation,
Trust, and Self-Confidence in Fault Management of Time-Critical Tasks. Journal of
Experimental Psychology: Applied, 6(1):44–58. 2.1, 4.2.1, 5
[Muir, 1987] Muir, B. M. (1987). Trust Between Humans and Machines, and the Design
of Decision Aids. International Journal of Man-Machine Studies, 27(5-6):527–539.
2.1
[Muir, 1989] Muir, B. M. (1989). Operators’ Trust in and Use of Automatic Controllers
in a Supervisory Process Control Task . PhD thesis, University of Toronto, Toronto.
1, 1.2, 1.3, 2, 2.1, 2.2, 4.1, 5, 5.7, 8.2, 9.2.1
[Neato Robotics, 2011] Neato Robotics (2011). Neato xv-11. http://www.
neatorobotics.com/. Accessed: 30/12/2011. 2.2
[Norman, 1990] Norman, D. A. (1990). The ’Problem’ of Automation: Inappropriate
Feedback and Interaction. Philosophical Transactions of the Royal Society of London,
327(1241):585–593. 1
[Parasuraman, 1986] Parasuraman, R. (1986). Vigilance, Monitoring, and Search. In
Boff, K., Thomas, J., and Kaufman, L., editors, Handbook of Perception and Human
Performance: Cognitive Processes and Performance, pages 1–29. John Wiley & Sons.
2
[Parasuraman et al., 2009] Parasuraman, R., Cosenzo, K. A., and de Visser, E. (2009).
Adaptive Automation for Human Supervision of Multiple Uninhabited Vehicles: Ef-
fects on Change Detection, Situation Awareness, and Mental Workload. Military
Psychology, 21(2):270–297. 7
192

[Parasuraman et al., 1993] Parasuraman, R., Molloy, R., and Singh, I. (1993). Per-
formance Consequences of Automation-Induced "Complacency". The International
Journal of Aviation Psychology, 3(1):1–23. 5
[Parasuraman and Riley, 1997] Parasuraman, R. and Riley, V. (1997). Humans and
Automation: Use, Misuse, Disuse, Abuse. Human Factors, 39(2):230–253. 1, 2
[Parasuraman et al., 2008] Parasuraman, R., Sheridan, T., and Wickens, C. (2008).
Situation Awareness, Mental Workload, and Trust in Automation: Viable, Empiri-
cally Supported Cognitive Engineering Constructs. Journal of Cognitive Engineering
and Decision Making, 2(2):140–160. 7
[Perkins et al., 2010] Perkins, L., Miller, J. E., Hashemi, A., and Burns, G. (2010).
Designing for Human-Centered Systems: Situational Risk as a Factor of Trust in
Automation. In Proceedings of the Human Factors and Ergonomics Society, pages
1–5. 1.2
[Phillips, 1999] Phillips, R. O. (1999). Investigation of Controlled Flight into Terrain:
Descriptions of Flight Paths for Selected Controlled Flight into Terrain (CFIT) Air-
craft Accidents, 1985-1997. Technical report, Federal Aviation Administration. 1,
1.2
[Prinzel III, 2002] Prinzel III, L. J. (2002). The Relationship of Self-Efficacy and Com-
placency in Pilot-Automation Interaction. Technical report, Langley Research Cen-
ter. 2
[Riley, 1994] Riley, V. (1994). Human Use of Automation. PhD thesis, Unpublished
doctoral dissertation, University of Minnesota.
193

[Riley, 1996] Riley, V. (1996). Operator Reliance on Automation: Theory and Data. In
Parasuraman, R. and Mouloua, M., editors, Automation and Human Performance:
Theory and Applications, pages 19–35. Lawrence Erlbaum Associates. (document),
1, 1.2, 1.3, 2.2, 2, 2, 2.1, 2.2, 3, 5, 5.6
[Roomba, 2011] Roomba (2011). irobot roomba. http://www.irobot.com/. Accessed:
30/12/2011. 2.2
[Sanchez, 2006] Sanchez, J. (2006). Factors that Affect Trust and Reliance on an au-
tomated aid. PhD thesis, Georgia Institute of Technology, Georgia Institute of Tech-
nology. 2.2, 5
[Sarter et al., 1997] Sarter, N., Woods, D., and Billings, C. (1997). Automation S
urprises. Handbook of Human Factors and Ergonomics, 2:1926–1943. 1, 1.2, 2
[Sheridan, 1978] Sheridan, T. (1978). Human and computer control of undersea tele-
operators. Technical report, DTIC Document. (document), 2, 2.1
[Singh et al., 1993] Singh, I., Molloy, R., and Parasuraman, R. (1993). Individual
Differences in Monitoring Failures of Automation. Journal of General Psychology,
120(3):357–373. 3
[Tsui et al., 2011a] Tsui, K., Desai, M., Yanco, H., and Uhlik, C. (2011a). Exploring
Use Cases for Telepresence Robots. In ACM/IEEE International Conference on
Human-Robot Interaction (HRI), pages 11–18. IEEE. 1.1
[Tsui et al., 2011b] Tsui, K., Norton, A., Brooks, D., Yanco, H., and Kontak, D.
(2011b). Designing Telepresence Robot Systems for Use by People with Special
Needs. In Proc. of Intl. Symp. on Quality of Life Technologies. 2
194

[Turk, 2009] Turk, M. (2009). 3.1
[van Dongen and van Maanen, 2006] van Dongen, K. and van Maanen, P.-P. (2006).
Under-Reliance on the Decision Aid: A Difference in Calibration and Attribution
Between Self and Aid. In Conference, pages 225–229. 5
[VGO Communications, 2012] VGO Communications (2012). The VGo telepresence
robot. http://www.vgocom.com/what-vgo. 1.1
[Wickens et al., 2000] Wickens, C., Gempler, K., and Morphew, M. (2000). Workload
and Reliability of Predictor Displays in Aircraft Traffic Avoidance. Transportation
Human Factors, 2(2):99–126. 7
[Wickens and Xu, 2002] Wickens, C. and Xu, X. (2002). How does Automation Re-
liability Influence Workload? Technical report, University of Illinois at Urbana-
Champaign, Aviation Human Factors Division. 1, 1.2, 4.2.1
[Woods et al., 2004] Woods, D. D., Tittle, J., Feil, M., and Roesler, A. (2004). En-
visioning Human–Robot Coordination in Future Operations . Systems, Man, and
Cybernetics, Part C: Applications and Reviews, IEEE Transactions on, 34(2):210–
218. 7
[Yagoda, 2011] Yagoda, R. (2011). WHAT! You Want Me to Trust a ROBOT? The
Development of a Human Robot Interaction (HRI) Trust Scale. Master’s thesis,
North Carolina State University. 4.2.4
[Yanco and Drury, 2002] Yanco, H. A. and Drury, J. (2002). A Taxonomy for Human-
Robot Interaction. In Proceedings of the AAAI Fall Symposium on Human-Robot
Interaction, pages 111–119.
195

[Yanco and Drury, 2004] Yanco, H. A. and Drury, J. (2004). Classifying Human-Robot
Interaction: An Updated Taxonomy . In Systems, Man and Cybernetics, 2004 IEEE
International Conference on, pages 2841–2846 vol. 3. 2.2
196

Appendix A
Initial Survey
A.1 Participant Information
1. Gender (Male/Female/Prefer not to answer)
2. Age
3. How many years and months of Emergency Response or Search and Rescue ex-
perience do you have?
4. How many hours of experience do you have controlling robots?
5. Please briefly describe your experiences with robots. Also list the robots that
you’ve used.
6. Have you ever controlled an autonomous robot?
7. Which autonomous robots have you controlled and in what capacity?
8. Have you teleoperated a remote controlled robot? (Any robot that is not visible
197

from where you are and is being controlled through a video feed of some sort can
be called a remote teleoperated robot)
9. Which remote robots have you driven and in what capacity?
A.2 Factors Influencing Trust
Please describe all the factors that you think might affect your trust of a robot. Also
provide a short explanation for each factor.
The next two pages are going to describe scenarios of robot being used in search
tasks after a significant disaster event. After reading the description of the event and
the capabilities of the robot software, please respond to the questions based on your
knowledge of current state of the art for sensing and artificial intelligence. If you have
assumptions or caveats to your response, please add these comments in the free response
area below each question
A.3 Thorough Search in an Unstructured Environ-
ment
SCENARIO: A major earthquake has occurred in a large metropolitan area on a week
day in the mid-morning. You have responded to a small grocery store that has collapsed
and there are reports of survivors inside. The building is concrete construction and res-
cue personnel have identified an entry point large enough to get a robot through. The
structure is highly unstable and aftershocks are occurring at irregular intervals. The
safety manager and engineers has determined that the robot is the only safe option
for reconnaissance at this time. Your task is to perform a very thorough search the
198

first floor of the store for injured people. Although the robot can navigate the building
safely, only you can perform the task of identifying injured people using the cameras
and sensors on the robot. You will be controlling the robot from a safe location outside
the store. There are presently no time constraints. Based on this scenario and the
following descriptions of control levels, please answer the following questions.
The robot can be operated with the following levels of control:
1. Manual mode: You will have complete control of the robot. The robot will not
prevent you from driving into objects.
2. Safe mode: You will be able to drive the robot wherever you want and the control
software (automation) will safely stop before hitting objects.
3. Shared mode: You will be able to drive the robot wherever you want, but au-
tomation will share control and attempt to steer the robot away from objects and
not let the robot hit objects.
4. Waypoint mode: You can set waypoints and the robot will follow those without
the need for further control from you.
5. Goal mode: You select an area that you would like the robot to search and it will
automatically plan a route through the world and ensure that maximum coverage
is achieved.
1. Please state the order in which you would use the different autonomy levels.
2. How confident are you with the rankings you gave in the previous question? (Very
confident, Confident, Neutral, Somewhat confident, Not confident)
199

3. Please rank the autonomy modes based on the performance you’d expect.
A.4 Hasty Search in a Structured Environment
SCENARIO: An explosion has occurred in a manufacturing plant. Your task is to search
for people injured by the blast in an adjacent office building. It has been reported that
hazardous materials may be present in the now demolished manufacturing plant. The
office building appears to be structurally sound, but engineers have decided that a robot
should do the initial primary (or hasty) search of the office. Although the robot can
navigate the building safely, only you can perform the task of identifying injured people
using the cameras and sensors on the robot. You will be controlling the robot from a
safe location outside the office building. You have 30 minutes to complete your search
and report your findings to your search team manager. Based on this scenario and the
following descriptions of control levels, please answer the following questions.
The robot can be operated with the following levels of control:
1. Manual mode: You will have complete control of the robot. The robot will not
prevent you from driving into objects.
2. Safe mode: You will be able to drive the robot wherever you want and the control
software (automation) will safely stop before hitting objects.
3. Shared mode: You will be able to drive the robot wherever you want, but au-
tomation will share control and attempt to steer the robot away from objects and
not let the robot hit objects.
200
4. Waypoint mode: You can set waypoints and the robot will follow those without
the need for further control from you.
5. Goal mode: You select an area that you would like the robot to search and it will
automatically plan a route through the world and ensure that maximum coverage
is achieved.
1. Please state the order in which you would use the different autonomy levels.
2. How confident are you with the rankings you gave in the previous question? (Very
confident, Confident, Neutral, Somewhat confident, Not confident)
3. Please rank the autonomy modes based on the performance you’d expect.
A.5 Generic Task
There exists a hypothetical task that can only be performed through a robot. The
robot can be operated in one of two modes:
• Manual mode: You will have complete control over the robot.
• Automatic mode: The robot will operate itself.
Based only on this information please answer the following questions.
1. Which mode would you use?
2. Explain your the reasons for you decision in detail.
201

A.6 Factors Influencing Trust
1. Please order the following factors from the most influential on your trust of the
autonomous robot to the least. (Error by automation, Risk involved in the oper-
ation, Reward involved in the operation, System failure, Interface used to control
the robot, Lag, Stress/Mood)
2. Please indicate if the following factors will have a positive or negative influence
on your trust of autonomous robots. A factor has positive influence if your trust
of the robot increases with it and vice-versa. (Error by automation, Risk involved
in the operation, Reward involved in the operation, System failure, Interface used
to control the robot, Lag, Stress/Mood)
202

Appendix B
Expanded Survey
B.1 Participant Information
1. Gender (Male / Female / Prefer not to answer)
2. Age
3. How much time do you spend using computers every week? (< 5 hours / 5-10
hours / 10 - 25 hours / 25 - 50 hours / > 50 hours)
4. What is your occupation?
5. Do you play video games? (Yes / No)
6. Do you play first person shooter (FPS) games? (Yes / No)
7. Do you play real time strategy (RTS) games? (Yes / No)
8. Have you used a remote controlled car/helicopter/plane/robot before?
9. Do you have easy access to a car? (Yes / No)
203
10. How often do you drive? (Never / Rarely / More than once a month / More than
once a week / Almost daily)
11. Do you prefer to drive yourself or let someone else drive? (Prefer to drive / Let
someone else drive)
12. Please explain your answer for the previous question.
13. Have you used robots before? (Yes / No). If yes, please explain.
B.2 Assumptions about Robots
1. When you consider robots, what type of robots come to mind? Please describe
the top three types.
• First type [ ]
• Second type [ ]
• Third type [ ]
2. When you consider robots, what tasks do you expect robots to perform? Please
describe the top three tasks.
• First task [ ]
• Second task [ ]
• Third task [ ]
3. When you consider robots, what situations do you expect robots to operate in?
Please describe the top three situations.
• First situation [ ]
204

• Second situation [ ]
• Third situation [ ]
B.3 Factors Influencing Trust
1. How much do you think the following factors would influence your trust of an
autonomous robot? Please rate the following factors from 1 [Not at all] to 7
[Extremely].
• Error by automation [_]
• Risk involved in the operation [_]
• Trust in engineers that designed the robot [_]
• Speed of the robot [_]
• Technical capabilities of the robot [_]
• System failure (different components of the robot failing. ex: sensors, lights,
etc) [_]
• Size of the robot [_]
• Past experience with the robot [_]
• Training [_]
• Interface used to control the robot [_]
• Predictability [_]
• Reliability [_]
• Reward involved in the operation [_]
205

• Reliability [_]
• Situation awareness (knowing what is happening around the robot) [_]
• Trust in engineers that designed the robot [_]
• Lag (delay between sending commands and the robot responding to them)
[_]
• Stress [_]
• Others (please specify) [_]
2. Please select the top 5 factors that you think are important.
• Error by automation [_]
• Risk involved in the operation [_]
• Trust in engineers that designed the robot [_]
• Speed of the robot [_]
• Technical capabilities of the robot [_]
• System failure (different components of the robot failing. ex: sensors, lights,
etc) [_]
• Size of the robot [_]
• Past experience with the robot [_]
• Training [_]
• Interface used to control the robot [_]
• Predictability [_]
• Reliability [_]
206
• Reward involved in the operation [_]
• Reliability [_]
• Situation awareness (knowing what is happening around the robot) [_]
• Trust in engineers that designed the robot [_]
• Lag (delay between sending commands and the robot responding to them)
[_]
• Stress [_]
• Others (please specify) [_]
3. Please explain your answer for the previous question.
B.4 Video Questionnaire
Please open the link below in a new window and watch the video. The video shows
an autonomous robot navigating through a lobby. After watching the video answer the
questions below. Link:1
1. Please describe the robot’s behavior.
2. Below is a list of statements for evaluating trust between people and autonomous
robots. Based on the video that you just saw please rate the intensity of your
feeling of trust, or your impression of the robot. Please select a value which best
describes your feeling or your impression 1 [Not at all] to 7 [Extremely].
• ?The robot is deceptive [_]1The link here would be one of 6 provided in the Chapter 4.
207
• The robot behaves in an underhanded manner [_]
• The robot has integrity [_]
• The robotÕs actions will have a harmful or injurious outcome [_]
• The robot provides security [_]
• The robot is dependable [_]
• I can trust the robot [_]
• I am suspicious of the robotÕs intent, action, or outputs [_]
• I am wary of the robot [_]
• I am confident in the robot [_]
• The robot has integrity [_]
• The robot is reliable [_]
• I am familiar with the robot [_]
3. Please explain your answer for the previous question.
4. Please make the following ratings of the robot: (Please enter a number between
1 = “Not at all” and 100 = “Extremely high”)
• Dependability (i.e: To what extent can you count on the robot to do its
job?) [_]
• Responsibility (i.e: to what extent does the robot perform the task it was
designed to do?) [_]
• Predictability (i.e: to what extent the robot’s behavior can be predicted from
moment to moment?) [_]
208
• Competence (i.e: to what extent does the robot perform its function prop-
erly?) [_]
5. Please explain your answer for the previous question.
6. Please rate your own feelings about the robot: (Please enter a number between 1
= “Not at all” and 100 = “Extremely high”)
• Your degree of faith that the robot will be able to cope with other situations
in the future [_]
• Your degree of trust in the robot to respond accurately [_]
• Your overall degree of trust in the robot [_]
7. Please explain your answer for the previous question.
8. How would you rate the robot’s performance? [1 = Poor and 7 = Excellent]
9. If you were asked to drive the same robot under the same circumstances how do
you think you would perform? [1 = Poor and 7 = Excellent]
The questions listed in Section B.3 would be repeated here. This would conclude
the survey.
209

Appendix C
Questionnaires used with Experiments
C.1 Pre-experiment Questionnaire
C.1.1 Demographic Information
1. Participant ID
2. Age
3. Gender (Male/Female/Prefer not to answer)
4. Occupation
5. Computer usage per week (< 10 hours, < 20 hours, < 30 hours, < 40 hours, >
40 hours)
6. Which is your dominant hand? (Right/Left/Ambidextrous)
7. Is English your primary language? (Yes/No)
210
8. Please provide us with your level of experience in the following areas. Rate the
following from 1 = Strongly agree to 7 = Strongly disagree).
• I am experienced with robot
• I am experienced with RC cars
• I am experienced with first-person perspective video games
• I am experienced with real time strategy games
9. Have you seen robots in person before? If yes, please explain.
10. Please indicate your level of agreement with each individual statement regarding
risk-taking activity. (1 = Strong disagreement to 6 = Strong agreement)
• I like to test myself every now and them by doing something a little risky
• Sometimes I will take a risk just for the fun of it
• I sometimes find it exciting to do things for which I might get into trouble
• Excitement and adventure are more important to me than security
C.1.2 Current Technology Use
1. For each of the following options, please indicate the extent to which you used a
computer. (Not sure what it is / Never / Sometimes / Often)
• Getting information
• Conducting business (e.g., online purchasing, banking, bill-paying)
• Writing reports, preparing presentations
211

• Entertainment
2. Please indicate how concerned you are about the security of the information you
have released to each of the following. (Not sure what it is / Never / Sometimes
/ Often)
• Medical institutions
• Websites
• Financial institutions (e.g., banks)
• Stores of restaurants when you make credit/debit card purchases
• Friends or relatives
3. How concerned are you about your physical location being tracked by technologies
such as video cameras or cell phones? (Not at all / A little / Somewhat / Very)
C.1.3 General Personality
1. How well does each of the following common human traits or phrases describe
you? Please rate how accurate each is in describing you a the present time. (1 =
Not at all accurate to 7 = Extremely accurate)
• Like to learn new things
• Open to new experiences
• Innovative
• Traditional
• A private person
212

• Like to be in control
• Concerned with my physical appearance
• Anxious
• Independent
• Talkative
C.1.4 General Technology Attitudes
1. The following questions are about your attitudes and views towards technology
in general. In general, to what extent do you believe that technology (1 = Not at
all accurate to 7 = Extremely accurate)
• Makes life easy and convenient
• Makes life complicated
• Gives people control over their daily lives
• Makes people dependent
• Makes life comfortable
• Makes life stressful
• Brings people together
• Makes people isolated
• Increases personal safety and security
• Reduces privacy
213
2. How well does each of the following phrases regarding technology describe you?
Please rate how accurate each is in describing you at the present time (1 = Not
at all accurate to 7 = Extremely accurate)
• I like to keep up with the latest technology
• I generally wait to adopt a new technology until all the bugs have been
worked out
• I enjoy the challenge of figuring out high tech gadgets
• I feel confident that I have the ability to learn to use technology
• Technology makes me nervous
• If a human can accomplish a task as well as technology, I prefer to interact
with a person
• I like the idea of using technology to reduce my dependence on other people
214

C.2 Post-run Questionnaires
C.2.1 Workload TLX
Please rate the following by placing an ‘x’ on the scales.
Mental Demand
Low |———————————-| High
Physical Demand
Low |———————————-| High
Temporal Demand
Low |———————————-| High
Performance
Good |———————————-| Poor
Effort
Low |———————————-| High
Frustration
Low |———————————-| High
C.2.2 Jian (Trust)
Please rate your responses to the following questions ( 1 = Strongly disagree to 7 =
Strongly agree) I would like to operate this robot again
• The system is deceptive
• The system behaves in an underhanded manner
• I am suspicious of the system’s intent, action, or outputs
215

• I am wary of the system
• The system’s actions will have a harmful or injurious outcome
• I am confident in the system
• The system provides security
• The system has integrity
• The system is dependable
• The system is reliable
• I can trust the system
• I am familiar with the system
C.2.3 Muir (Trust)
Please select a value from 1 to 10, where 1 = Not at all and 10 = Completely.
• To what extent can the system’s behavior be predicted from moment to moment?
• To what extent can you count on the system to do its job?
• What degree of faith do you have that the system will be able to cope with all
systems “states in the future”?
• Overall how much do you trust the system?
216

C.2.4 Miscellaneous
1. Please rate your performance for the last run (1 = Poor to 7 = Excellent)
2. Please rate the robot’s overall performance for the last run (1 = Poor to 7 =
Excellent)
3. Which mode would you use? (1 = First; 2 = Second; 3 = No Preference)
• Corrected mode
• Fully Autonomous mode
4. Please rank the modes based on their performance? (1 = First; 2 = Second; 3 =
No Preference)
• Corrected mode
• Fully Autonomous mode
5. Please indicate your overall confidence level in the answers to the above questions?
(0 = Not at all confident to 100 = Completely confident)
6. Please describe all the factors that you think might affect your trust of an au-
tonomous robot.
7. Please rate the following statement from (1 = Very low to 100 = Very high). The
risk of not receiving the milestone and bonus payments was .
C.2.5 SA (SAGAT; [Endsley, 1988])
1. How many times did the robot hit objects?
217

2. How many times did you respond to the gauges before they entered the red zone?
3. What percent of the time was the camera aimed straight forward?
4. Draw the path that the robot took on the map provided to you. Please indicate
where the robot was at half way into the run and at the end of the run.
5. On the same map mark the regions that had high levels of CO2.
6. Indicate on the map provided to you where you found the victims along with the
victim IDs and the time since the start of run.
218

C.3 Post-experiment questionnaire
Please rate the following statements from (1 = Strongly agree to 7 = Strongly disagree)
• I would like to operate this robot again.
• The robot was malfunctioning.
• I trust this robot.
• I trust robots (in general).
• I would only participate again if I could be sure the robot was honest.
• I will not trust robots as much as I did before.
219

Appendix D
Additional Analysis
D.1 Regression Analysis
Table D.1: Results of backwards stepwise linear regression for the control allocationstrategy. The top row represents the experiments and the R2 values from the regression.The last column presents result of performing the regression on all of the experimentswith real-time trust. The estimates for each of the factors are shown in the rows. Asingle asterisk indicates that the p value for the estimate was between 0.05 and 0.01and two asterisks indicate that the p value was less than 0.01.
DR (27%) LSA (62%) RT (82%) F (39%) RD (68%) LT (40%) New (27%)Age 0.11⇤⇤ 0.80⇤⇤ -0.93⇤⇤ - 0.33⇤⇤ -2.16⇤⇤ -0.24⇤⇤Robots -0.61⇤⇤ - 3.95⇤⇤ 1.36⇤⇤ 0.68⇤ 13.68⇤⇤ -RC cars - 3.17⇤⇤ - -1.29⇤⇤ 1.92⇤⇤ -7.66⇤⇤ -0.27⇤RTS games - -3.89⇤⇤ 15.82⇤⇤ - 1.94⇤⇤ -2.53⇤⇤ -FPS games - -1.12⇤⇤ -15.90⇤⇤ - -0.72⇤ 1.86⇤⇤ 0.52⇤⇤RQ1 -1.08⇤⇤ -5.98⇤⇤ 10.75⇤⇤ - - 8.95⇤⇤ 0.48⇤RQ2 - 1.57⇤⇤ -3.47⇤ 1.71⇤⇤ - -13.21⇤⇤ -RQ3 1.13⇤⇤ 6.19⇤⇤ -4.53⇤⇤ - - - -RQ4 - -2.07⇤⇤ -4.78⇤⇤ - 1.58⇤ - -
220

Table D.2: Results of backwards stepwise linear regression for Muir trust. The top rowrepresents the experiments and the R2 values from the regression. The last columnpresents result of performing the regression on all of the experiments with real-timetrust. The estimates for each of the factors are shown in the rows. A single asteriskindicates that the p value for the estimate was between 0.05 and 0.01 and two asterisksindicate that the p value was less than 0.01.
DR (17%) LSA (70%) RT(79%) F (28%) RD (74%) LT (78%) New (37%)Age - -0.14⇤⇤ 0.12⇤⇤ -0.13⇤ -0.14⇤⇤ 0.20⇤ -Robots - - -1.88⇤⇤ - -0.57⇤⇤ - -RC cars - 0.25⇤ 1.74⇤⇤ - 0.62⇤⇤ 0.53⇤⇤ -RTS games - - -6.72⇤⇤ - 0.57⇤⇤ -0.93⇤⇤ -FPS games 0.22⇤ - 5.65⇤⇤ -0.46⇤⇤ -0.28⇤ 0.37⇤⇤ -0.23⇤⇤RQ1 - - -3.99⇤⇤ -1.49⇤⇤ - -1.19⇤⇤ -0.42⇤⇤RQ2 - 0.62⇤⇤ - 1.23⇤⇤ - 2.39⇤⇤ 0.79⇤⇤RQ3 - - 1.19⇤⇤ - - - -0.91⇤⇤RQ4 0.73⇤⇤ -1.20⇤⇤ 2.78⇤⇤ - 0.73⇤⇤ - 0.30⇤⇤
221

D.2 Real-Time Trust Graphs
Trus
t (AU
TC)
02468
10
02468
10
02468
10
02468
10
AB
CD
Reliability conditions
1 2 3 4 5 6 7 8 9 10 11 12 13 14 15 16 17Gates
Figure D.1: Real-time trust data for the different reliability conditions from the RT, F,RD and LT experiments.
222

Trus
t (AU
TC)
02468
10
02468
10
02468
10
02468
10
FLT
RD
RT
Experiments
1 2 3 4 5 6 7 8 9 10 11 12 13 14 15 16 17Gates
Figure D.2: Real-time trust data for the RT, F, RD and LT experiments.
223
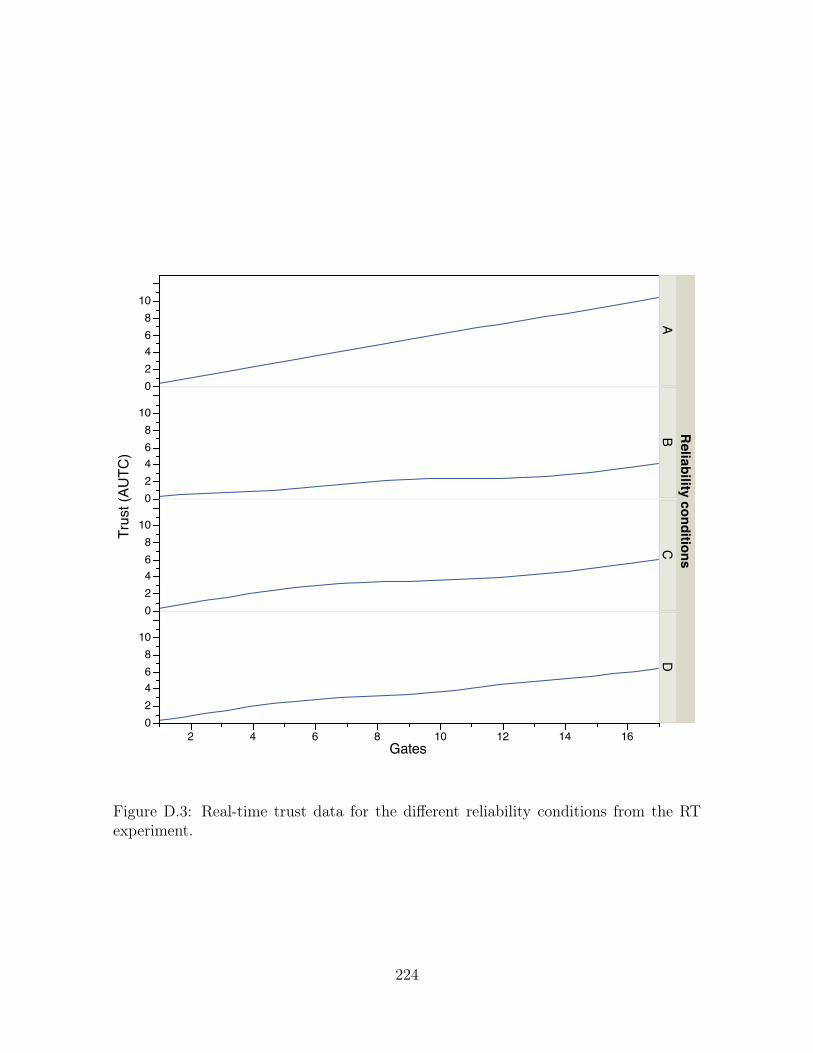
Trus
t (AU
TC)
02468
10
02468
10
02468
10
02468
10
AB
CD
Reliability conditions
2 4 6 8 10 12 14 16Gates
Figure D.3: Real-time trust data for the different reliability conditions from the RTexperiment.
224
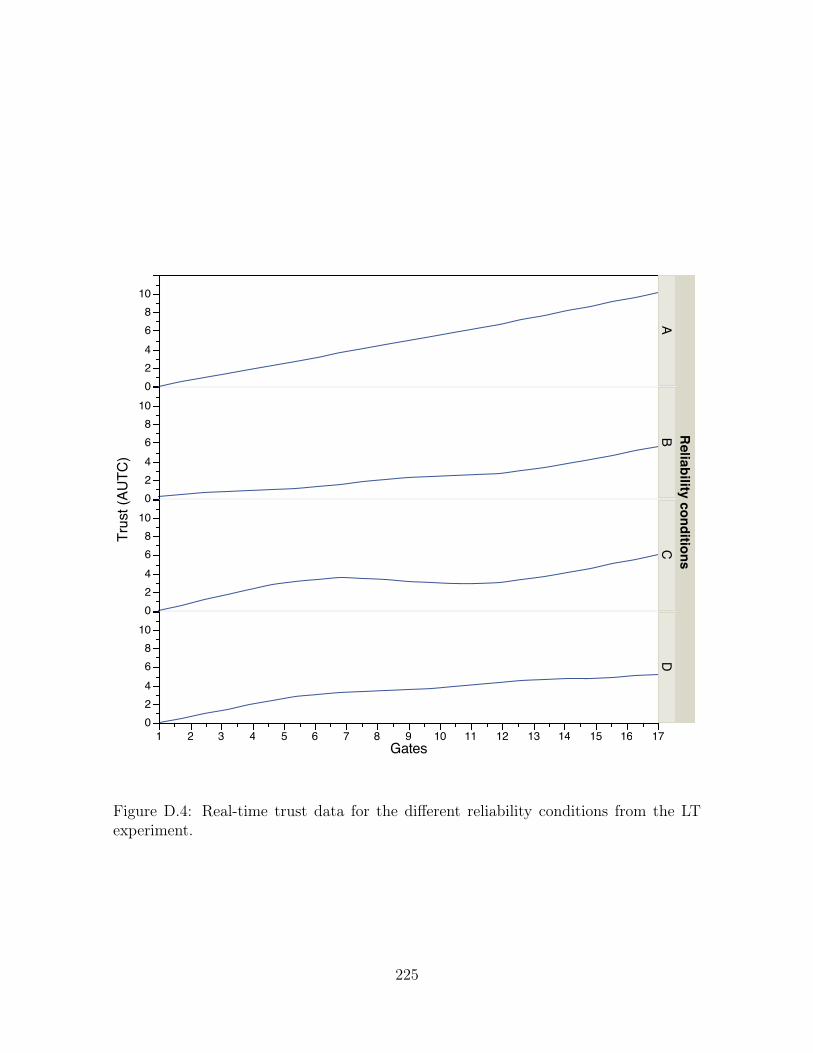
Trus
t (AU
TC)
024
68
10
024
68
10
024
68
10
024
68
10
AB
CD
Reliability conditions
1 2 3 4 5 6 7 8 9 10 11 12 13 14 15 16 17Gates
Figure D.4: Real-time trust data for the different reliability conditions from the LTexperiment.
225

Trus
t (AU
TC)
02468
10
02468
10
02468
10
02468
10
AB
CD
Reliability conditions
1 2 3 4 5 6 7 8 9 10 11 12 13 14 15 16 17Gates
Figure D.5: Real-time trust data for the different reliability conditions from the Fexperiment.
226

Trus
t (AU
TC)
02468
10
02468
10
02468
10
02468
10
AB
CD
Reliability conditions
2 4 6 8 10 12 14 16Gates
Figure D.6: Real-time trust data for the different reliability conditions from the RDexperiment.
227

Trus
t (AU
TC)
02468
10
1 2 3 4 5 6 7 8 9 10 11 12 13 14 15 16 17Gates
BC
A
D
Trus
t (AU
TC)
02468
10
1 2 3 4 5 6 7 8 9 10 11 12 13 14 15 16 17Gates
LTFRTRD
Figure D.7: Top: Real-time trust data for the different reliability conditions from all ofthe experiments. Bottom: Real-time trust data from all of the experiments.
228
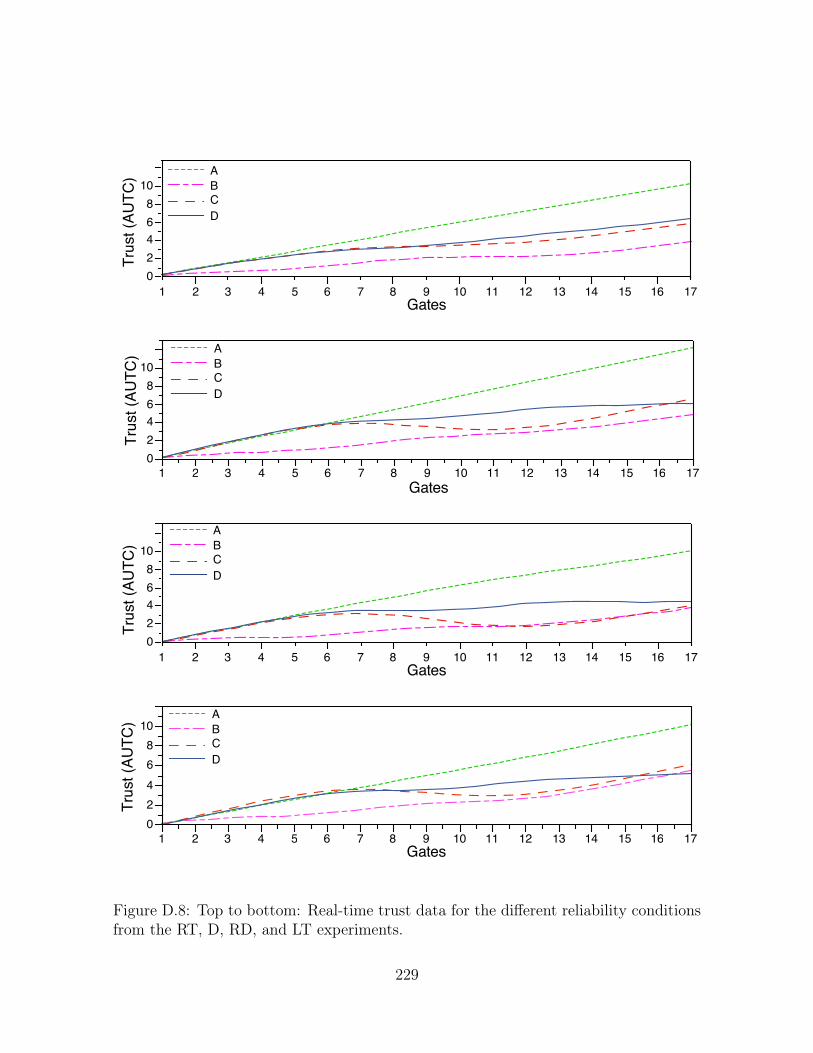
02468
10
1 2 3 4 5 6 7 8 9 10 11 12 13 14 15 16 17Gates
Trus
t (AU
TC)
CD
BA
02468
10
1 2 3 4 5 6 7 8 9 10 11 12 13 14 15 16 17
Trus
t (AU
TC)
Gates
CD
BA
02468
10
1 2 3 4 5 6 7 8 9 10 11 12 13 14 15 16 17Gates
CD
BA
Trus
t (AU
TC)
Trus
t (AU
TC)
024
68
10
1 2 3 4 5 6 7 8 9 10 11 12 13 14 15 16 17Gates
CD
BA
Figure D.8: Top to bottom: Real-time trust data for the different reliability conditionsfrom the RT, D, RD, and LT experiments.
229

D.3 Normalized Control Allocation
0
10
20
30
40
50
60
70
80
90100
Con
trol a
lloca
tion
stra
tegy
(%)
RT F
RD LT DR
LSA
Experiments
Figure D.9: Control allocation for all the experiments calculated as a percent value toallow comparison between the two experimental setup with different length maps.
In order to compare the control allocation strategy between the two experimental
setups, we normalized the values. The results of two-way analysis are presented below:
• Reliability: No significant effect found, F (3, 426)=0.07, p=0.97
• Experiment: Significant effect found, F (5, 426)=13.50, p<0.01. Tukey’s HSD
test showed the following significant results:
– LT vs RT, p<0.01
– LT vs DR, p<0.01
– LSA vs RT, p<0.01
– LT vs RD, p<0.01
– F vs RT, p<0.01
230
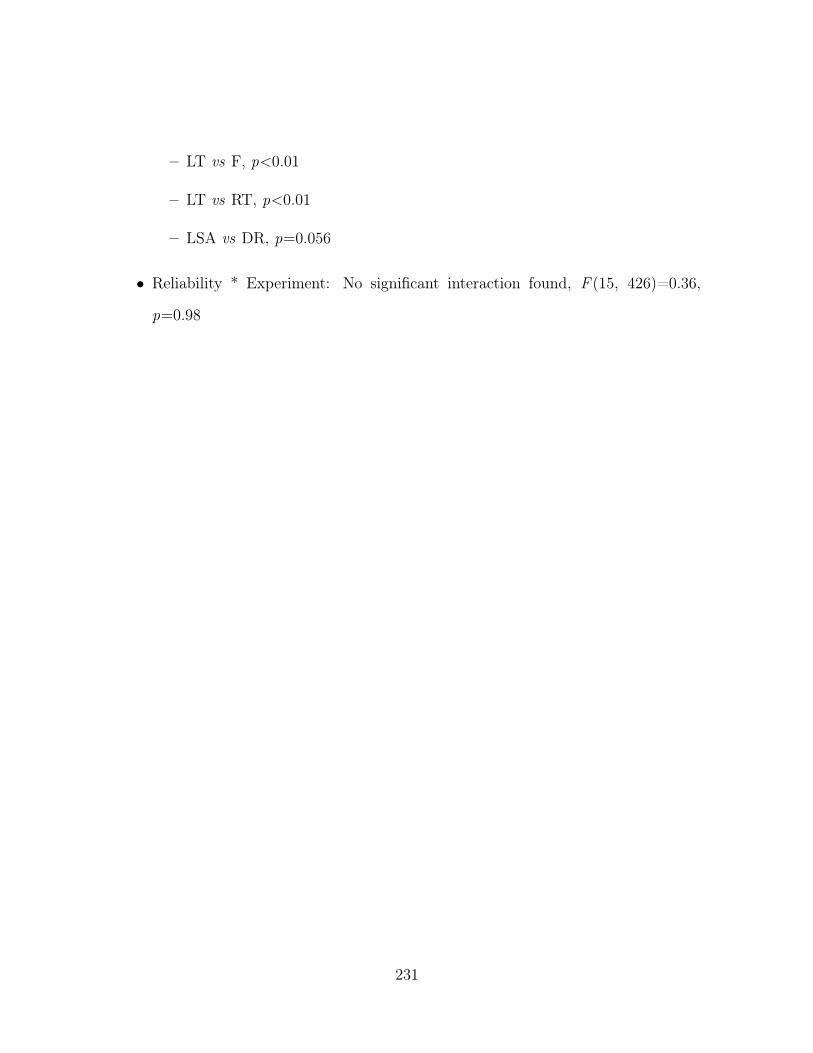
– LT vs F, p<0.01
– LT vs RT, p<0.01
– LSA vs DR, p=0.056
• Reliability * Experiment: No significant interaction found, F (15, 426)=0.36,
p=0.98
231


![Real-Time Human-Robot Interaction for a Service Robot ...arXiv:1802.00272v2 [cs.HC] 11 Jan 2019 Real-Time Human-Robot Interaction for a Service Robot Based on 3D Human Activity Recognition](https://static.fdocuments.us/doc/165x107/60423bae5fee363c6324c3bf/real-time-human-robot-interaction-for-a-service-robot-arxiv180200272v2-cshc.jpg)