
Relly Victoria PETRESCU, Florian Ion PETRESCU, Ovidiu ANTONESCU

PhD Letiţia PetrescuFaculty of Chemistry and Chemical Engineering
Babes-Bolyai University
Cluj-Napoca, Romania
Cambridge, Thursday, 31 October 2013 - slide 2
Goal and importance of the environmental evaluation
Tools used for sustainability and environmental evaluation
IGCC and CCS-CL
Case studies
Conclusions

Cambridge, Thursday, 31 October 2013 - slide 3
Much progress has been registered in industrial activities and human behavior with regard to environmental issues.
Technological and economical, but not environmental factors, considered for the optimization of a chemical plant.

Cambridge, Thursday, 31 October 2013 - slide 4
Methods and tools to evaluate environmental consequences of chemical and energy conversion processes and products are needed
- guide process and product design activities
- improve environmental performance ofchemical processes and products
- provide indicators of environmentalperformance for decision-making
(David R. Shonnard, 2006)

Cambridge, Thursday, 31 October 2013 - slide 5
Coal involves handling of solids, ash, pollutant emissions etc.
Coal usage in the energy sector
dirty energy source (Goyal at al., 2010)
CO2 emissions
The use of fossil fuels contributes:
- to the greenhouse effect
- other environmental impacts
(acidification, eutrophication and the depletion of natural resources)
(Koornneef at al., 2008)

Cambridge, Thursday, 31 October 2013 - slide 6
Goal and importance of the environmental evaluation
Tools used for sustainability and environmental evaluation
IGCC and CCS-CL
Case studies
Conclusions

Cambridge, Thursday, 31 October 2013 - slide 7

Cambridge, Thursday, 31 October 2013 - slide 8
“Sustainability in Chemical Engineering means continuous effort to protect and improve ecosystems, social balance and economic prosperity by a systematic and integral improvement of
Environmental protection
Raw material exploitation
Energy efficiency
Safety and health protection
in all kinds of material conversion processes and material production”
(EFCE definition)

Cambridge, Thursday, 31 October 2013 - slide 9
Energy is directly linked to the concept of sustainability
Energy resources drive much of the world’s economic activity
Energy resources are obtained from the environment, and wastes from energy processes are typically released to the environment
Energy and society

Cambridge, Thursday, 31 October 2013 - slide 10
Economy
Environment
Society
3D
2D
2D
2D
1D 1D
1D
3D indicators
2D indicators
1D indicators
(Martins et al., 2006)

Cambridge, Thursday, 31 October 2013 - slide 11
3D
Process SimulatorsSoftware
CAPE OPEN(CO) Toxicological DB
Chemical Processes
Molecular Modeling
1D
EnvironmentalIndicators
PSP Framework

Cambridge, Thursday, 31 October 2013 - slide 12
Process Simulator Data Base
CAPE OPEN
Unit Operation
Modules
Data
Data regarding the
streams
Data regarding the
substances involved in
the process
Types of
streams Mass flow rateName of the
substances
CAS numbers
of the
substances
Risk Phrases
for each
substance
Input stream of
the process
Output stream
containing the
main product of the
process
Output stream
containing the
salable co-products
Waste stream
of the process
PSP
3D Indicators 2D Indicators 1D Indicators
Material
Intensity
Energy
Intensity
Potential
Chemical Risk
Evaluation
Potential
Environmental
Impact EvaluationEco-efficiency
Waste
Reduction
Algorithm
(WAR)
Sustainability Evaluation

Cambridge, Thursday, 31 October 2013 - slide 13
Goal of CO: to support the interaction of process modeling software components from heterogeneous sources
This methodology has been chosen because we wanted to create a standard module able to be used in every process simulator software available on the market
Reaction
Environment
Thermo
Unit Op Unit Op
PPDB
Graph Analysis Thermo
Solveur
Cambridge, Thursday, 31 October 2013 - slide 14
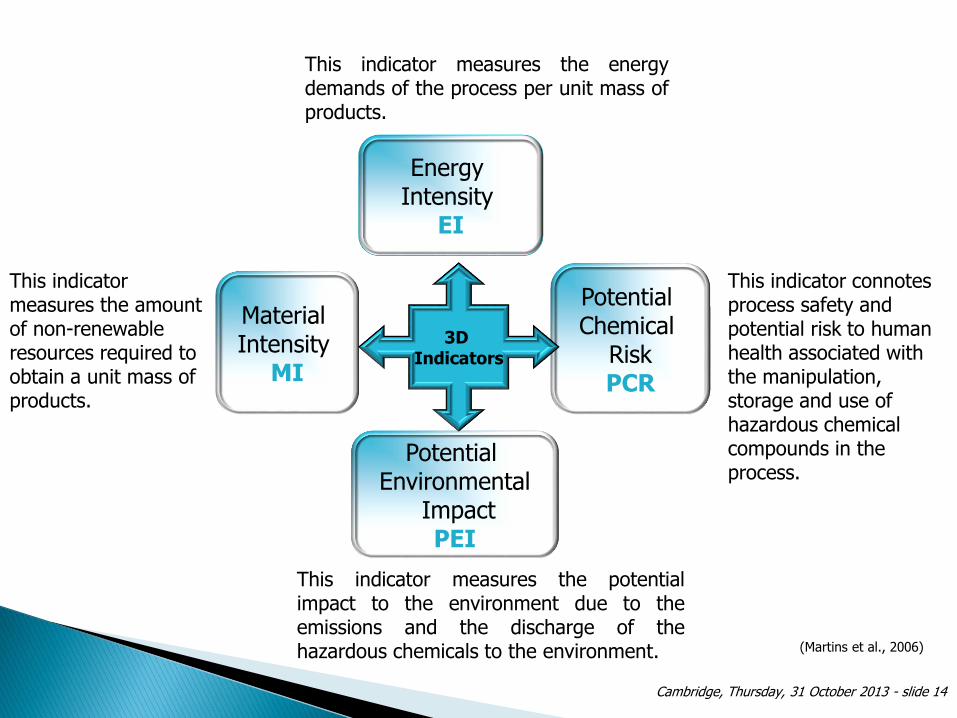
Material Intensity
MI
Energy Intensity
EI
Potential Chemical
RiskPCR
Potential Environmental
ImpactPEI
3D Indicators
This indicator measures the amount of non-renewable resources required to obtain a unit mass of products.
This indicator measures the energydemands of the process per unit mass ofproducts.
This indicator connotes process safety and potential risk to human health associated with the manipulation, storage and use of hazardous chemical compounds in the process.
This indicator measures the potentialimpact to the environment due to theemissions and the discharge of thehazardous chemicals to the environment. (Martins et al., 2006)

Cambridge, Thursday, 31 October 2013 - slide 15
- Is a tool used to evaluate the environmental friendliness of a chemical process
-The evaluation of environmental impact is made through environmental impact indexes
syst
gen
ep
we
cp
we
ep
out
cp
out
ep
in
cp
in
systIIIIIII
t
I
)()()()()()(
cp
i
we
cp
jcp
we
k
kkj
cp
j
cp
j
out
jout
j
cp
out
k
kkj
cp
j
cp
j
in
jin
j
cp
in
EI
xMII
xMII
0
...
...
)(
)(
)(
)()(
)(
)()(
ep
i
we
ep
jep
we
k
kkj
gep
j
out
j
sep
j k
kkj
out
j
k
kkj
cp
j
gep
j
out
jout
j
ep
out
k
kkj
ep
j
ep
j
in
jin
j
ep
in
EI
xM
xMxMII
xMII
0
...
...
0...
)(
)(
)(
)()(
)()(
)(
)()(
(Young et al., 2000)

Cambridge, Thursday, 31 October 2013 - slide 16

Cambridge, Thursday, 31 October 2013 - slide 17
(Young et al., 2000)

Cambridge, Thursday, 31 October 2013 - slide 18
Total rate of impact output
Iout
Total impact output per mass of products
Iout_mp
Total rate ofimpact generation
Igen
Total impact generated per mass of products
Igen_mp
1D Indicators
(Young et al., 2000)
Cambridge, Thursday, 31 October 2013 - slide 19
Goal and importance of the environmental evaluation
Tools used for sustainability and environmental evaluation
IGCC and CCS-CL
Case studies
Conclusions

Cambridge, Thursday, 31 October 2013 - slide 20
one of the most promising energy conversion methods
combines two leading technologies:
1) coal gasification which transforms coal to syngas2) combined cycle is one of the most efficient means in
generating electricity
clean and efficient coal power, and the low cost path to combat CO2
co-production improve the load-following, economics and efficiency of IGCC
flexible feedstock and products
(Liu et al., 2008)

Cambridge, Thursday, 31 October 2013 - slide 21
GHG emissions Fossil Fuel usage
CCS
(Juergen Karg, 2009)
IGCC with CCS
IGCC with CCS one of the promising options which needs to be considered in the near future
it satisfies the market needs in a carbon-constrained environment

Cambridge, Thursday, 31 October 2013 - slide 22
Goal and importance of the environmental evaluation
Tools used for sustainability and environmental evaluation
IGCC and CCS-CL
Case studies
Conclusions

Cambridge, Thursday, 31 October 2013 - slide 23
Goals:
IGCC with CCS
to create the model of the processes
to reduce the energy consumption
to identify the most environmental friendly
design from four different process alternatives

Cambridge, Thursday, 31 October 2013 - slide 24
Case 1: IGCC without CCS
Case 2: IGCC with calcium-based chemical looping cycle for pre-combustion CCS
Case 3: IGCC with calcium-based chemical looping cycle for post-combustion CCS
Case 4: IGCC with iron-based chemical looping cycle for pre-combustion CCS
Case Studies

Cambridge, Thursday, 31 October 2013 - slide 25
Case 1: IGCC without CCS

Cambridge, Thursday, 31 October 2013 - slide 26
Case 2 : IGCC with calcium-based chemical looping cycle for pre-combustion CCS

Cambridge, Thursday, 31 October 2013 - slide 27
Case 3 : IGCC with calcium-based chemical looping cycle for post-combustion CCS

Cambridge, Thursday, 31 October 2013 - slide 28
Case 4 : IGCC with iron-based chemical looping cycle for pre-combustion CCS

Cambridge, Thursday, 31 October 2013 - slide 29
Model Assumptions
Ca-based CL
Carbonation Reactor Temperature (°C): 650-750Calcination Reactor Temperature (°C): 850-1000Oxygen-carrier removed (%): 1
Fe-based CL
Fuel Reactor Temperature (°C): 650Air Reactor Temperature (°C): 850-950Oxygen-carrier removed (%): 0.5
Gasifier
Gasification pressure (bar): 40Gasification temperature (
oC) >1450
Carbon conversion (%) 99.9%
Fuel usedbituminous coal
GT
Type: M701G2Net Power output (MW): 334
CO2 compression
Delivery pressure(bar)> 110
Carbon capture rate
>90%

Cambridge, Thursday, 31 October 2013 - slide 30
Tools used for process simulation and environmantal evaluation
Process Simulator Softwares:
ChemCAD
Aspen Plus
Sustainability & Environmantal Evaluation:
PSP Framework
CAPE OPEN Unit Wizard
Microsoft Visual Basic
Process Simulator software
(PROII, Aspen Plus, COCO/COFEE)
Microsoft Office Access

Cambridge, Thursday, 31 October 2013 - slide 31
Case 1 Case 2 Case 3 Case 4
Coal flowratet/h 155.30 236.82 251.90 162.33
Coal LHV MJ/kg 25.35 25.35 25.35 25.35
Feedstock thermal energy (A) MWth 1093.7 1667.80 1774.01 1143.2
Thermal energy of the syngas(B) MWth 877.01 934.47 891.19 912.42
Cold gas efficiency (B/A * 100) % 80.19 80.14 80.14 79.81
Thermal energy of gas exit AGR (C) MWth 872.47 929.78 876.47 912.09
Syngas treatment efficiency (C/B *100) % 99.48 99.5 98.35 99.96
Gas turbine output MWe 334.00 334.00 334.00 334.00
Steam turbine output MWe 235.89 429.11 446.76 201.33
Expander power output MWe 0.72 1.43 1.50 0.29
Coal flowrate MWe 570.61 764.54 782.26 535.62
Gasification island power consumption MWe 7.91 9.69 9.14 8.55
Power island power Consumption MWe 21.11 20.52 20.63 23.28
Total ancillary power consumption (E) MWe 77.47 156.72 176.66 92.55
Net electric power output (F=D-E) MWe 493.13 607.82 605.60 443.07
Gross electrical efficiency (D/A * 100) % 52.17 45.84 44.10 46.85
Net electrical efficiency (F/A * 100) % 45.09 36.44 34.14 38.76
Carbon capture rate % 0.00 91.56 90.01 99.45
CO2 specific emissions kg/MW 766.74 58.87 77.46 3.01

Cambridge, Thursday, 31 October 2013 - slide 32
Results reported toone MW net energy produced
Case 1 Case 2 Case 3 Case 4
MIkg/MWe 7047.81 4067.12 4773.43 5222.55
EIkJ/MWe no value no value no value no value
PCRE-
233 233 233 233
PEI-
2199.97 2199.97 2199.97 2199.97

Cambridge, Thursday, 31 October 2013 - slide 33
Results reported toone MW net energy produced
Case 1 Case 2 Case 3 Case 4
Iout
PEI/MWh63.46 35.26 36.64 41.41
Iout_mp
PEI/(tCO2 captured * MWe) no value 40.43 39.11 48.11
Igen
PEI/MWh63.35 31.53 31.84 39.97
Igen_mp
PEI/(tCO2 captured * MWe) no value 36.15 33.98 46.43

Cambridge, Thursday, 31 October 2013 - slide 34
Goal and importance of the environmental evaluation
Tools used for sustainability and environmental evaluation
IGCC and CCS-CL
Case studies
Conclusions

Cambridge, Thursday, 31 October 2013 - slide 35
It is possible to reduce the generation of wastes and their environmental impact modifying the design of the process
PSP- tool used for environmental and sustainability evaluation
PSP is made up of 4 sw interfaced to process simulators, a relational database containing toxicological and risk and safety information and a set of software modules
PSP has been developed using the standard CO Methodology
PSP application in different case studies for choosing the most environmental friendly design
IGCC with CCS-CL promising option which needs to be considered for future power generation