Phase Change Materials-Assisted Heat Flux Reduction ...
17
energies Article Phase Change Materials-Assisted Heat Flux Reduction: Experiment and Numerical Analysis Hussein J. Akeiber 1, *, Seyed Ehsan Hosseini 1, *, Mazlan A. Wahid 1 , Hasanen M. Hussen 2 and Abdulrahman Th. Mohammad 3 Received: 21 September 2015; Accepted: 25 December 2015; Published: 7 January 2016 Academic Editor: Nyuk Hien Wong 1 High-Speed Reacting Flow Laboratory, Faculty of Mechanical Engineering, Universiti Teknologi Malaysia, 81310 UTM Skudai, Johor 81310, Malaysia; [email protected] 2 Machine and Mechanical Department, University of Technology, Baghdad 35023, Iraq; [email protected] 3 Baqubah Technical Institute, Middle Technical University, Baghdad 06800, Iraq; [email protected] * Correspondence: [email protected] (H.J.A.); [email protected] (S.E.H.); Tel.: +60-11-1126-1344 (H.J.A.); +60-11-1260-0959 (S.E.H.) Abstract: Phase change materials (PCM) in the construction industry became attractive because of several interesting attributes, such as thermo-physical parameters, open air atmospheric condition usage, cost and the duty structure requirement. Thermal performance optimization of PCMs in terms of proficient storage of a large amount of heat or cold in a finite volume remains a challenging task. Implementation of PCMs in buildings to achieve thermal comfort for a specific climatic condition in Iraq is our main focus. From this standpoint, the present paper reports the experimental and numerical results on the lowering of heat flux inside a residential building using PCM, which is composed of oil (40%) and wax (60%). This PCM (paraffin), being plentiful and cost-effective, is extracted locally from waste petroleum products in Iraq. Experiments are performed with two rooms of identical internal dimensions in the presence and absence of PCM. A two-dimensional numerical transient heat transfer model is developed and solved using the finite difference method. A relatively simple geometry is chosen to initially verify the numerical solution procedure by incorporating in the computer program two-dimensional elliptic flows. It is demonstrated that the heat flux inside the room containing PCM is remarkably lower than the one devoid of PCM. Keywords: phase change material (PCM); wax; melting temperature; heat flux 1. Introduction Over the years, it has been established that thermal energy storage systems (TESSs) with phase change materials (PCMs) can efficiently reduce the excessive usage of fossil fuels and subsequent global warming [1,2]. Thermal energy storage (TES) is found to play a vital role in a broad range of industrial and residential applications. The use of TESSs with PCMs in buildings enhances the human comfort by reducing the internal air temperature fluctuation. Consequently, the indoor air temperature remains near the required temperature over an extended time period [3]. Sensible heat TES, which stores heat in fluid or solid form, latent heat TES, which uses latent heat during the phase change process, and thermoelectric devices are the common examples of different types of TES technologies. TESSs can rapidly discharge or store huge amounts of heat with solar energy and heat as alternating sources [4]. Recent research reveals the advancements of extensive building architecture and management based on TES with PCMs. TES is attractive due to its absolute suitability to reduce the gap between energy demand and supply [5]. Energies 2016, 9, 30; doi:10.3390/en9010030 www.mdpi.com/journal/energies
Transcript of Phase Change Materials-Assisted Heat Flux Reduction ...

energies
Article
Phase Change Materials-Assisted Heat FluxReduction: Experiment and Numerical Analysis
Hussein J. Akeiber 1,*, Seyed Ehsan Hosseini 1,*, Mazlan A. Wahid 1, Hasanen M. Hussen 2
and Abdulrahman Th. Mohammad 3
Received: 21 September 2015; Accepted: 25 December 2015; Published: 7 January 2016Academic Editor: Nyuk Hien Wong
1 High-Speed Reacting Flow Laboratory, Faculty of Mechanical Engineering, Universiti Teknologi Malaysia,81310 UTM Skudai, Johor 81310, Malaysia; [email protected]
2 Machine and Mechanical Department, University of Technology, Baghdad 35023, Iraq;[email protected]
3 Baqubah Technical Institute, Middle Technical University, Baghdad 06800, Iraq; [email protected]* Correspondence: [email protected] (H.J.A.); [email protected] (S.E.H.);
Tel.: +60-11-1126-1344 (H.J.A.); +60-11-1260-0959 (S.E.H.)
Abstract: Phase change materials (PCM) in the construction industry became attractive because ofseveral interesting attributes, such as thermo-physical parameters, open air atmospheric conditionusage, cost and the duty structure requirement. Thermal performance optimization of PCMs in termsof proficient storage of a large amount of heat or cold in a finite volume remains a challenging task.Implementation of PCMs in buildings to achieve thermal comfort for a specific climatic conditionin Iraq is our main focus. From this standpoint, the present paper reports the experimental andnumerical results on the lowering of heat flux inside a residential building using PCM, which iscomposed of oil (40%) and wax (60%). This PCM (paraffin), being plentiful and cost-effective, isextracted locally from waste petroleum products in Iraq. Experiments are performed with two roomsof identical internal dimensions in the presence and absence of PCM. A two-dimensional numericaltransient heat transfer model is developed and solved using the finite difference method. A relativelysimple geometry is chosen to initially verify the numerical solution procedure by incorporating in thecomputer program two-dimensional elliptic flows. It is demonstrated that the heat flux inside theroom containing PCM is remarkably lower than the one devoid of PCM.
Keywords: phase change material (PCM); wax; melting temperature; heat flux
1. Introduction
Over the years, it has been established that thermal energy storage systems (TESSs) with phasechange materials (PCMs) can efficiently reduce the excessive usage of fossil fuels and subsequent globalwarming [1,2]. Thermal energy storage (TES) is found to play a vital role in a broad range of industrialand residential applications. The use of TESSs with PCMs in buildings enhances the human comfort byreducing the internal air temperature fluctuation. Consequently, the indoor air temperature remainsnear the required temperature over an extended time period [3]. Sensible heat TES, which stores heatin fluid or solid form, latent heat TES, which uses latent heat during the phase change process, andthermoelectric devices are the common examples of different types of TES technologies. TESSs canrapidly discharge or store huge amounts of heat with solar energy and heat as alternating sources [4].Recent research reveals the advancements of extensive building architecture and management basedon TES with PCMs. TES is attractive due to its absolute suitability to reduce the gap between energydemand and supply [5].
Energies 2016, 9, 30; doi:10.3390/en9010030 www.mdpi.com/journal/energies

Energies 2016, 9, 30 2 of 17
Several commercial PCMs have been developed with varying melting temperatures. Consideringthe cost of various PCMs, Rezaei et al. [6] examined their influence on energy and exergy efficiencies.Based on the lumped-parameter method, Li et al. [7] established an analytical temperature model. Theycalculated the enthalpy difference of inorganic salts derived from two types of composite materials. Itis shown that the melting point and the enthalpy difference of the binary eutectics (LiNO3-NaNO3,LiCL-NaCL and Li2CO3-Na2CO3) are consistent with the ones obtained from standard methods.Meanwhile, many efforts are made to produce high performance PCM integration in building walls.Romero-Sanchez et al. [8] evaluated the thermal performance of PCMs by incorporating in naturalstone. Experiments and numerical simulation are carried out to improve the thermal properties ofnatural stone, where concrete pilot houses are constructed. These pilot houses are covered withtrans-ventilated facade designs via Spanish Bateigazul natural stone. An improvement in humancomfort with the reduction in energy consumption is evidenced upon implementing PCMs.
Izquierdo-Barrientos et al. [9] inspected the effects of PCMs on external building walls withvarious configurations by altering the PCMs’ layer position, ambient conditions, wall orientationand phase transition temperature. A 1D transient heat transfer numerical model is developed andsolved using a finite difference method. Results revealed no significant reduction in the total heat lostduring winter irrespective of the variation of the PCM wall orientation or the transition temperature.Moreover, during the summer time, a significant difference in the heat gain is evidenced, which isattributed to the elevated solar radiation fluxes.
The thermal performances of a PCM based co-polymer composite wallboard were experimentallyassessed by Kuznik and Virgone [10], where two identical enclosures, called Test Cells 1 and 2, wereconstructed. The volume of each test cell is (3.10 m ˆ 3.10 m ˆ 2.50 m) and is bounded on five sides bya fixed temperature regulated air mass. The sixth side is a glazed face that separates the test cell from aclimate compartment. The air temperature in the room containing PCM is found to decrease up to4.2 ˝C without any thermal stratification as compared to the room without PCM composite.
Employing PCM in a representative Mediterranean building, De Gracia et al. [11] evaluated itsenvironmental impact in terms of warming. Three scenarios, such as different temperature controlsystems, different PCM types or different weather conditions, are emphasized based on the life cycleassessment (LCA) process. It is shown that the presence of PCM in the building envelope decreasedthe energy consumption without considerable reduction of the global impact. The LCA for the realrooms exhibited an impact reduction of 37% upon incorporating polyurethane (PU) into the referenceroom (REF). Kuznik et al. [12] optimized the PCM wallboard thickness in lightweight buildings withreduced air temperature fluctuations inside the room, where the in-house numerical code CODYMURis used to calculate the optimal thickness.
In another experiment, Navarro et al. [13] evaluated the PCM performance in terms of internalthermal gains. Three different rooms with the same internal dimensions (2.4 m ˆ 2.4 m ˆ 2.4 m) areconsidered. These rooms are labelled as (1) the REF (built using traditional two-layered brick withan air gap and without insulation), (2) the PU (constructed by a traditional brick with of spray foamthickness of 5 cm (walls) and 3 cm (roof)) and (3) the PCM (made with a PCM layer in the southernand western walls and on the roof). It is found that during the summer season the PCM room storedthe heat produced by the internal loads, thus limiting the heat dissipation to the outer environment.The REF is found to possess higher temperature fluctuations in its envelope (27.5–24 ˝C) than otherrooms with insulation (28–26 ˝C).
Pasupathy and Velraj [14] analyzed (theoretically and experimentally) the thermal performanceof an inorganic eutectic PCM-based thermal storage system (TSS) for energy conservation in buildings.In the design, one room contained PCM on the roof, and the other room is devoid of the PCMpanel. The inner walls, except the ceiling of the rooms, are insulated by a 6 mm-thick plywood onall sides to determine the sole influence of the PCM panel on the roof. The PCM panel is madeof (2 m ˆ 2 m) stainless steel having a thickness of 2.54 cm. The stainless steel accommodated aninorganic salt hydrate (48% CaCl2 + 4.3% NaCl + 0.4% KCl + 47.3% H2O) as the PCM. The measured

Energies 2016, 9, 30 3 of 17
room temperatures are observed to vary ~27 ˘ 3 ˝C during the experiment. Despite many dedicatedefforts, a comprehensive understanding of the PCM-mediated reduction in heat flux inside the buildingis far from being achieved.
In this paper, experimental and numerical investigations were performed using PCMs in buildingarchitecture to determine their impact on lowering the heat flux inside the building. Two identicalrooms, one without and the other with PCM, were considered for experiments. Numerical simulationwas done based on the transient heat transfer model. The heat flux inside the room is determinedto assess the thermal performance of such PCMs. Results are discussed, analyzed, comparedand validated.
2. Numerical Scheme
The boundary condition on the inner surface of the aluminum frame follows natural convection.Most of the previous researchers considered the bottom wall as insulated, because the temperaturedifference between the room and the wall was very small. The heat transfer coefficient (h) inside theroom is calculated (FORTRAN programming). Figures 1 and 2 display the schematics for the numericalmodel formulation, which assumes the following:
(i) One dimensional heat conduction in the composite wall is considered, and the end impacts arenot taken into account.
(ii) The thermal conductivity of the aluminum frame and the roof top slab are constant irrespectiveof temperature variation.
(iii) The PCM is uniform and isotropic.(iv) The convection impact in the molten PCM is not considered.(v) The interfacial resistances are negligible.
(vi) The value of Cp for the PCM panel is considered as follows:
T ă Tm ´ ∆T, Cp “ Cps (1)
T ą Tm ` ∆T, Cp “ Cpl (2)
Tm ´ ∆T ă T ă Tm ` ∆T, Cp “ hsl{2∆T (3)
where Cp is the specific heat capacity, hsl is the enthalpy change of solid-liquid, ∆T is half ofthe temperature range over which the phase change occurs and Tm is the phase transitiontemperature.
(vii) The latent heat being highly sensitive to the phase transition process of the PCM is modeledover a range of temperatures, where Cp is considered to be uniform during the phase conversion.Although, in reality, Cp varies with temperature.
Energies 2016, 9, 30
3
efforts, a comprehensive understanding of the PCM‐mediated reduction in heat flux inside the
building is far from being achieved.
In this paper, experimental and numerical investigations were performed using PCMs in
building architecture to determine their impact on lowering the heat flux inside the building. Two
identical rooms, one without and the other with PCM, were considered for experiments. Numerical
simulation was done based on the transient heat transfer model. The heat flux inside the room is
determined to assess the thermal performance of such PCMs. Results are discussed, analyzed,
compared and validated.
2. Numerical Scheme
The boundary condition on the inner surface of the aluminum frame follows natural convection.
Most of the previous researchers considered the bottom wall as insulated, because the temperature
difference between the room and the wall was very small. The heat transfer coefficient (h) inside the
room is calculated (FORTRAN programming). Figures 1 and 2 display the schematics for the
numerical model formulation, which assumes the following:
(i) One dimensional heat conduction in the composite wall is considered, and the end impacts are
not taken into account.
(ii) The thermal conductivity of the aluminum frame and the roof top slab are constant irrespective
of temperature variation. (iii) The PCM is uniform and isotropic.
(iv) The convection impact in the molten PCM is not considered.
(v) The interfacial resistances are negligible.
(vi) The value of Cp for the PCM panel is considered as follows:
∆ , (1)
∆ , (2)
∆ ∆ , /2∆ (3)
where is the specific heat capacity, hsl is the enthalpy change of solid‐liquid, ΔT is half of the
temperature range over which the phase change occurs and Tm is the phase transition temperature.
(vii) The latent heat being highly sensitive to the phase transition process of the PCM is modeled over
a range of temperatures, where is considered to be uniform during the phase conversion.
Although, in reality, varies with temperature.
Figure 1. Schematic diagram of phase change material (PCM) incorporated ceiling.
Figure 1. Schematic diagram of phase change material (PCM) incorporated ceiling.

Energies 2016, 9, 30 4 of 17
Energies 2016, 9, 30
4
Figure 2. Finite volume grid for the analysis.
Following these assumptions, the governing equation and the boundary conditions are written as:
∂∂
ρ ∂∂
0 ; 1, 2, 3 (4)
where m = 1 for the roof top slab, m = 2 for the PCM panel and m = 3 for the bottom aluminum frame.
The same equation holds for all three material regions and takes different values of k, ρ and .
In the outer walls (x = 0), where the floor is exposed to solar radiation, the boundary condition
is expressed as:
∂| (5)
The radiation effect is considered only during the sunshine hours. The boundary condition (x = L)
in the bottom layer of the aluminum frame is:
∂| (6)
The instantaneous continuity of heat flux and temperature at the interfaces x = and is
preserved.
The equation for the top volume cell is written as:
ρ ∆∆ δ δ
1δ
ρ∆
∆ α
σ α ∈
(7)
The equation for the volume cells located in between the top and bottom volume cells yields:
∆ρ ∆
∆ ∆ ∆ ∆
1 ƒδ δ
ρ ∆∆
(8)
The above‐mentioned discretized equations are applicable to volume cells for 2–4, 7 and for
10–12 of the roof top slab, PCM panel and aluminum frame, respectively, with: = 1, = 2, 3, 4;
= 2, = 7; and = 3, =10, 11, 12.
The equation for the interface volume cell 5 is written as:
δρ ∆∆ δ /2 δ /2 δ ∆
2∆2
1δ δ
ρ ∆∆
(9)
Figure 2. Finite volume grid for the analysis.
Following these assumptions, the governing equation and the boundary conditions are written as:
kmB2Tm
Bx2 “ρmCpmBTm
Btt0 ă x ă Lu ; m “ 1, 2, 3 (4)
where m = 1 for the roof top slab, m = 2 for the PCM panel and m = 3 for the bottom aluminum frame.The same equation holds for all three material regions and takes different values of k, ρ and Cp.
In the outer walls (x = 0), where the floor is exposed to solar radiation, the boundary condition isexpressed as:
k1BT1
Bx|x“0 “ qrad ` ho pT8 ´ Tx“0q (5)
The radiation effect is considered only during the sunshine hours. The boundary condition (x = L)in the bottom layer of the aluminum frame is:
k3BT3
Bx|x“L “ hi pTx“L ´ Troomq (6)
The instantaneous continuity of heat flux and temperature at the interfaces x = L1 and L2
is preserved.The equation for the top volume cell is written as:
ˆ
ρ1c1∆x1
∆t`
f k1
δx1` ho f
˙
T1 ´f k1
δx1T2
“ ho f T8 ` p1´ f q„
k1 pT2 ´ T1q
δx1´ ho pT1 ´ T8q
`ρ1c1T0
1∆t
∆x1 `αqs
` σ”
αT4sky´ P T4
s
ı
(7)
The equation for the volume cells located in between the top and bottom volume cells yields:
´f km
∆xmTi`1 `
„
ρmcm∆xm
∆t`
f km
∆xm`
f km
∆xm
Ti ´f km
∆xmTi
“ p1´ fq„
km pTi`1 ´ T´i´1q
δxm´
km pTi ´ Ti´1q
δxm
`ρmcmT0
i ∆xm
∆t
(8)
The above-mentioned discretized equations are applicable to volume cells for 2–4, 7 and for 10–12of the roof top slab, PCM panel and aluminum frame, respectively, with: m = 1, i = 2, 3, 4; m = 2, i = 7;and m = 3, i =10, 11, 12.

Energies 2016, 9, 30 5 of 17
The equation for the interface volume cell 5 is written as:
´f k1
δx1T4 `
„
ρ1c1∆x1
∆t`
fδx1{2k1 ` δx2{2k2
`f k1
δx1
T5 ´
»
—
—
–
f∆x1
2ki`
∆x2
2k2
fi
ffi
ffi
fl
T4
“ p1´ f q„
k1 pT6 ´ T5q
δx2´
k1 pT5 ´ T4q
δx1
`ρ1c1T0
5 ∆x1
∆t
(9)
where ∆x1 and ∆x2 are the cell thickness of the roof top slab and PCM panel, respectively. Similarly,the equation can be written for volume cell 6. A similar process is extended to control Volumes 8and 9, which involve cell thicknesses ∆x2 and ∆x3 corresponding to the PCM panel and the bottomaluminum frame, respectively.
The equation for the bottom volume cell 13 is given by:
´ f K3
δx3T12 `
„
ρ3C3∆X3
∆t`
f K3
δx3
T13
“ f rhi p´2qs ` p1´ fq„
2hi ´ kT13 ´ T12
δx3
`ρ3c3T0
13∆x3
∆t
(10)
3. Development of the Numerical Model
3.1. One-Phase Solution
For either completely solid or liquid PCM layers, the temperature distribution on the n-th layer ofthe wall follows the one-dimensional diffusion equation given by:
KnB2TBx2 “ ρncn
BTBt
(11)
with the boundary condition:T p0, tq “ To ptq (12)
T pL, tq “ Tl ptq (13)
The numerical solution for a single material node yields:
T j`1i “ T j
i `Kn∆t
ρncn p∆Xq2´
T ji`1 ´ 2T j
i ` T ji´1
¯
(14)
The finite difference equation for the inner interface is written as:
T j`1i “ T j
i `2∆t
”
Kins
´
T ji´1 ´ T j
i
¯
` Kpcm
´
T ji`1 ´ T j
i
¯ı
´
ρpcmCpcm ` ρinsCins
¯
p∆Xq2(15)
The finite difference equation for the outer surface is written as:
T j`1i “ T j
i `2∆t
”
Kpcm
´
T ji´1 ´ T j
i
¯
` Kins
´
T ji`1 ´ T j
i
¯ı
´
ρpcmCpcm ` ρinsCins
¯
p∆Xq2(16)
Depending on whether the PCM is completely solid or completely liquid upon entering theone-phase subroutine, this solution is run until the maximum nodal temperature within the PCM layerincreases above the melting point or until the minimum temperature within the material drops below

Energies 2016, 9, 30 6 of 17
the freezing point. The temperature distribution at this particular time instant becomes the initialcondition for the two-phase subroutine.
3.2. Two-Phase Solution
The boundary points between the solid and liquid are held constant at the melting temperature ofthe material when the PCM layer consists of more than one phase and is expressed as:
T “ Tm (17)
The movement of the solid-liquid boundary is given by:
Kpcmr limxÑxsl`
ˆ
BTBx
˙
´ limxÑxsl´
ˆ
BTBx
˙
s “ρpcmαdxsl
dt(18)
where xsl` and xsl´ denote the limits approaching the solid-liquid interface from the right and left,respectively.
An explicit numerical solution for a single material two-phase node is given by:
T j`1i “ T j
i “ Tm (19)
λj`1i “ λ
ji `
Kpcm∆t
ρpcmα p∆xq2pT j
i`1 ´ 2Tm ` T ji´1q (20)
where λ is the volume fraction of the i-th node, which is melted at the j-th time step. For the twoPCM-insulation interface points, the finite difference equation is modified to consider that the node ishalf insulation and half PCM. For these two nodes, λ = 1/2 = λmax indicates the fully-melted state.
For the inner interface node, the two-phase finite difference equation takes the form:
λj`1i “ λ
ji `
∆t”
KinspTji`1 ´ Tmq ´ KpcmpT
ji`1 ´ Tmq
ı
ρpcmα p∆xq2(21)
For the outer interface node, the two-phase finite difference equation yields:
λj`1i “ λ
ji `
∆t”
KpcmpTji`1 ´ Tmq ´ KinspT
ji`1 ´ Tmq
ı
ρpcmα p∆xq2(22)
Two-phase subroutine prepares a kind of switching between Equations (13)–(15) andEquations (15)–(18), based on the nodal state. Figure 3 shows a typical temperature for exiting theone-phase solid solution. In this case, the material is completely solid (l = 0) for all nodes with theoutermost PCM node at some temperature slightly above Tm.
Energies 2016, 9, 30
6
An explicit numerical solution for a single material two‐phase node is given by:
(19)
λ λ∆
ρ α ∆2 (20)
where λ is the volume fraction of the i‐th node, which is melted at the j‐th time step. For the two
PCM‐insulation interface points, the finite difference equation is modified to consider that the node
is half insulation and half PCM. For these two nodes, λ = 1/2 = λmax indicates the fully‐melted state.
For the inner interface node, the two‐phase finite difference equation takes the form:
λ λ∆
ρ α ∆ (21)
For the outer interface node, the two‐phase finite difference equation yields:
λ λ∆
ρ α ∆ (22)
Two‐phase subroutine prepares a kind of switching between Equations (13)–(15) and Equations
(15)–(18), based on the nodal state. Figure 3 shows a typical temperature for exiting the one‐phase
solid solution. In this case, the material is completely solid (l = 0) for all nodes with the outermost
PCM node at some temperature slightly above Tm.
Figure 3. Typical temperature distribution for exiting the one‐phase solid sub‐routine.
The temperature of this node is shifted back to the PCM melting temperature and kept constant.
Equation (18) is used to determine the fraction of the melted node. This is continued until l returns to
zero, meaning the complete re‐freezing of node or λ = λmax, implying the complete melting of nodes.
In such an instance, the temperature is again allowed to alter according to Equation (12). For the
nodes that are below , the temperatures are governed by the one‐phase equations until they
exceed . At this time, the node is in two phases, and the method of calculation is toggled to
Equations (15)–(18).
4. Experimental Scheme
Experiments are set up using two full‐scale rooms. The test room with PCM is constructed to
determine its effect on the roof and wall for thermal management of a residential building. The
thermal performance of this organic eutectic PCM having a melting temperature within 40–44 °C is
computed. The following criteria are satisfied for precise measurements:
(1) The PCM heat transfer is one‐dimensional.
(2) The heat flow from uncontrolled outside influences is negligible compared to the applied heat.
(3) The rate of the temperature rise and fall of the PCM is comparable to reality.
Figure 3. Typical temperature distribution for exiting the one-phase solid sub-routine.

Energies 2016, 9, 30 7 of 17
The temperature of this node is shifted back to the PCM melting temperature and kept constant.Equation (18) is used to determine the fraction of the melted node. This is continued until l returns tozero, meaning the complete re-freezing of node or λ = λmax, implying the complete melting of nodes.In such an instance, the temperature is again allowed to alter according to Equation (12). For the nodesthat are below Tm, the temperatures are governed by the one-phase equations until they exceed Tm. Atthis time, the node is in two phases, and the method of calculation is toggled to Equations (15)–(18).
4. Experimental Scheme
Experiments are set up using two full-scale rooms. The test room with PCM is constructed todetermine its effect on the roof and wall for thermal management of a residential building. The thermalperformance of this organic eutectic PCM having a melting temperature within 40–44 ˝C is computed.The following criteria are satisfied for precise measurements:
(1) The PCM heat transfer is one-dimensional.(2) The heat flow from uncontrolled outside influences is negligible compared to the applied heat.(3) The rate of the temperature rise and fall of the PCM is comparable to reality.
The general properties of the PCM are listed in Table 1.
Table 1. PCM properties.
Properties Value Unit
Tm 40–44 ˝CCps 2.21 kJ/kg¨ ˝CCpL 2.3 kJ/kg¨ ˝CKs 0.51 W/m¨ KKL 0.22 W/m¨ KρS 830 kg/m3
ρL 878 kg/m3
αL 9.59 ˆ 10´8 m2/sαS 7.92 ˆ 10´8 m2/sH 146 kJ/kg
4.1. Full-Scale Test Rooms
Two identical full-scale outdoor test rooms with dimension (3 m ˆ 2.5 m ˆ 2 m) as shown inFigure 4 are built at the University Technology site of Iraq. The thermal performance (internal thermalgains) of these two test rooms (PCM incorporated wall and roof) is analyzed to determine their impactunder the Iraqi climate. The wall and roof of one room is covered with PCM and the other withoutany PCM. The basic structures (windows and supports) of both rooms are identical and made of ametallic insulated door positioned on the north wall. The thermal behavior of these rooms is comparedto obtain the performance and effect of PCM. The detailed structure of these rooms is as follows:
(1) The REF is a test room without PCM. The walls (without insulation) are built using a communebrick system, cemented plaster and gypsum board. Conversely, the roof contains two layers,where the bottom slab (thickness 12 cm) is made from concrete and the top slab (thickness 10 cm)is made using a brick mixture plus mortar (Figure 4).
(2) Room 1: The structure is the same as the REF together with the incorporation of a PCM layer inthe southern, eastern and western walls, as well as in the roof. The PCM (paraffin) layer is 2.5 cmthick and contained in aluminum panels (Figure 4).

Energies 2016, 9, 30 8 of 17
Energies 2016, 9, 30
7
The general properties of the PCM are listed in Table 1.
Table 1. PCM properties.
Properties Value Unit
Tm 40–44 °C
Cps 2.21 kJ/kg∙°C
CpL 2.3 kJ/kg∙°C
Ks 0.51 W/m∙K
KL 0.22 W/m∙K
ρS 830 kg/m3
ρL 878 kg/m3
αL 9.59 × 10⁻⁸ m2/s
αS 7.92 × 10⁻⁸ m2/s
H 146 kJ/kg
4.1. Full‐Scale Test Rooms
Two identical full‐scale outdoor test rooms with dimension (3 m × 2.5 m × 2 m) as shown in
Figure 4 are built at the University Technology site of Iraq. The thermal performance (internal thermal
gains) of these two test rooms (PCM incorporated wall and roof) is analyzed to determine their
impact under the Iraqi climate. The wall and roof of one room is covered with PCM and the other
without any PCM. The basic structures (windows and supports) of both rooms are identical and made
of a metallic insulated door positioned on the north wall. The thermal behavior of these rooms is
compared to obtain the performance and effect of PCM. The detailed structure of these rooms is
as follows:
(1) The REF is a test room without PCM. The walls (without insulation) are built using a commune
brick system, cemented plaster and gypsum board. Conversely, the roof contains two layers,
where the bottom slab (thickness 12 cm) is made from concrete and the top slab (thickness 10 cm)
is made using a brick mixture plus mortar (Figure 4).
(2) Room 1: The structure is the same as the REF together with the incorporation of a PCM layer in
the southern, eastern and western walls, as well as in the roof. The PCM (paraffin) layer is 2.5 cm
thick and contained in aluminum panels (Figure 4).
Figure 4. Geometry of the constructed test rooms, reference room (REF) (left, without PCM) and
PCM2 (right).
5. Results and Discussion
Figure 5 illustrates the average variation of ambient temperature and the temperature inside the
test rooms with and without PCM at a 1.5 m height in the month of August. As shown in the figure,
the temperature of the room without PCM is found to increase at τ = 12 h, reaches the maximum
Figure 4. Geometry of the constructed test rooms, reference room (REF) (left, without PCM) andPCM2 (right).
5. Results and Discussion
Figure 5 illustrates the average variation of ambient temperature and the temperature inside thetest rooms with and without PCM at a 1.5 m height in the month of August. As shown in the figure,the temperature of the room without PCM is found to increase at τ = 12 h, reaches the maximum(35 ˝C) between 16 h and 17 h and then decreases. This is due to the fact that initially (up to 12 h), theheat is absorbed by the room walls and roof exposed to sun and then slowly released, which caused agreenhouse-like effect of an inner increase of the temperature, as expected. Needless to say, the sunsign (solar irradiance) reaches the maximum at 12 h and remains there for a few hours before graduallydropping in later in the afternoon (beyond 17 h). On the other hand, the implementation of the PCMin the building structures reduced the room temperature peak load by 5 ˝C for the same time period(between 16 h and 17 h). This lowering in the peak temperature inside the room and the creation ofthermal comfort is attributed to the effect of the heat storage capacity of the PCM on the temperaturevariation. Actually, during the first few hours of the day (up to 12 h), paraffin absorbed the latentheat from the room environment and then underwent phase transformation, thereby reducing thepeak temperature. However, with the decrease of the sun sign (beyond 17 h), the latent heat is slowlyreleased into the atmosphere. The temperature fluctuation in this case is much weaker than the onewithout PCM incorporated in the building. It is evident that the greenhouse effect was much loweredin the presence of PCM. This verifies the environmental friendliness of PCM when used in buildingmanagement and architecture.
Energies 2016, 9, 30
8
(35 °C) between 16 h and 17 h and then decreases. This is due to the fact that initially (up to 12 h), the
heat is absorbed by the room walls and roof exposed to sun and then slowly released, which caused
a greenhouse‐like effect of an inner increase of the temperature, as expected. Needless to say, the sun
sign (solar irradiance) reaches the maximum at 12 h and remains there for a few hours before
gradually dropping in later in the afternoon (beyond 17 h). On the other hand, the implementation
of the PCM in the building structures reduced the room temperature peak load by 5 °C for the same
time period (between 16 h and 17 h). This lowering in the peak temperature inside the room and the
creation of thermal comfort is attributed to the effect of the heat storage capacity of the PCM on the
temperature variation. Actually, during the first few hours of the day (up to 12 h), paraffin absorbed
the latent heat from the room environment and then underwent phase transformation, thereby
reducing the peak temperature. However, with the decrease of the sun sign (beyond 17 h), the latent
heat is slowly released into the atmosphere. The temperature fluctuation in this case is much weaker
than the one without PCM incorporated in the building. It is evident that the greenhouse effect was
much lowered in the presence of PCM. This verifies the environmental friendliness of PCM when
used in building management and architecture.
Figure 5. Temperature variation of the test rooms with and without PCM (REF) at a 1.5 m height in
the month of August.
Figure 6 depicts the average variation of ambient temperature and the temperature inside the
test rooms with and without PCM at a 1.5 m height in the month of January. The temperature of the
room without PCM started to increase at 10 h and reached its peak load at 20 h. The temperature of
the roof top reaches the maximum between 12 h and 16 h before dropping. The higher value of the
roof top temperature compared to the ambient and inside ones clearly indicates the role of both
radiation and convection throughout the day, as long as the sun signs; while the temperature inside
the room with PCM in the winter month of January is stable all day under ambient temperature. This
stability is due to the effect of using the PCM, which acts as a heat storage capacitor and diminishes
the rapid temperature fluctuation via phase transformation. During phase conversion in paraffin, a
huge amount of latent heat exchange occurs at a constant temperature. This elevated absorption of
heat by the PCM materials is indeed responsible for the reduction of the heat flux inside the room
and the maintenance of thermal comfort. Specifically, the use of PCM in the building walls and roof
increased their thermal resistance and thereby reduced the overall heat transfer through the walls
with much lowered heat load compared to the building without PCM.
The temperature variation for the PCM and non‐PCM walls is theoretically examined. The east,
south and west walls are used to calculate the heat flux through the external and internal walls’
surface and the amount of heat storage in the walls. In Figures 7–9, the external heat flux, heat storage
and internal heat flux on the east wall of both types of rooms have been compared. Figure 9 (heat flux
through the external wall) clearly reveals that the heat flux for the PCM incorporated room is slightly
higher than the one without PCM on the walls. This observation is attributed to the low thermal
Figure 5. Temperature variation of the test rooms with and without PCM (REF) at a 1.5 m height in themonth of August.
Energies 2016, 9, 30 9 of 17
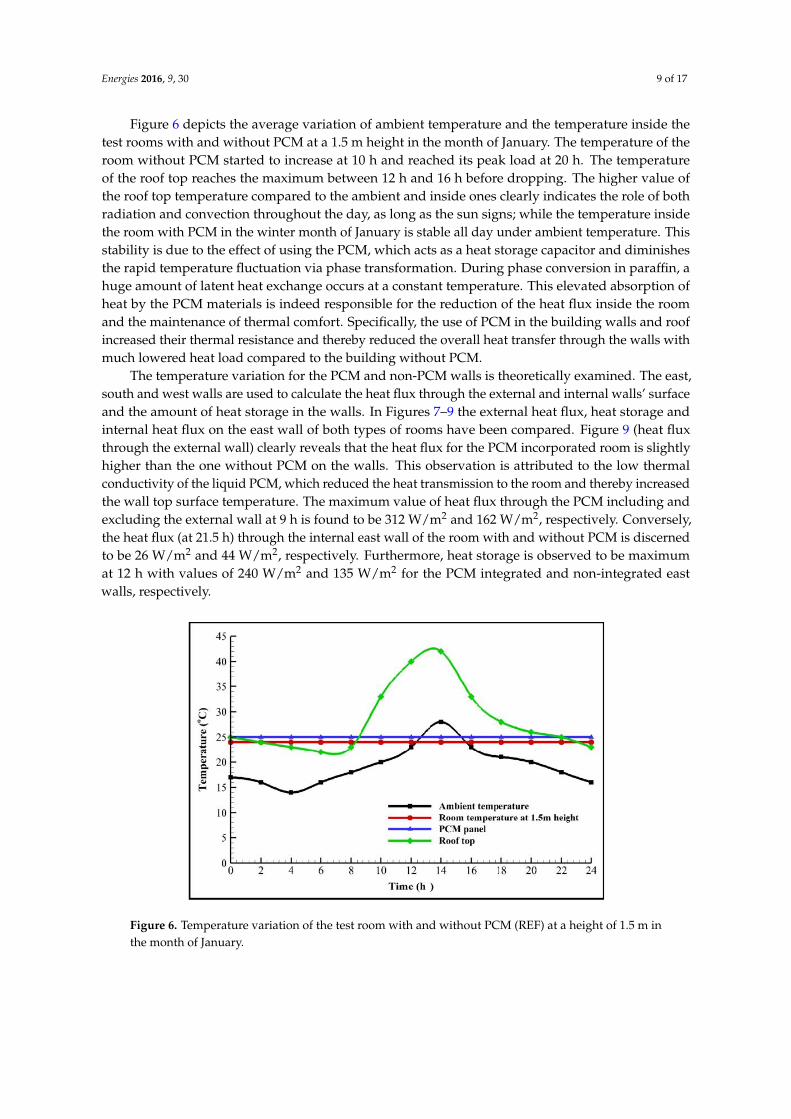
Figure 6 depicts the average variation of ambient temperature and the temperature inside thetest rooms with and without PCM at a 1.5 m height in the month of January. The temperature of theroom without PCM started to increase at 10 h and reached its peak load at 20 h. The temperatureof the roof top reaches the maximum between 12 h and 16 h before dropping. The higher value ofthe roof top temperature compared to the ambient and inside ones clearly indicates the role of bothradiation and convection throughout the day, as long as the sun signs; while the temperature insidethe room with PCM in the winter month of January is stable all day under ambient temperature. Thisstability is due to the effect of using the PCM, which acts as a heat storage capacitor and diminishesthe rapid temperature fluctuation via phase transformation. During phase conversion in paraffin, ahuge amount of latent heat exchange occurs at a constant temperature. This elevated absorption ofheat by the PCM materials is indeed responsible for the reduction of the heat flux inside the roomand the maintenance of thermal comfort. Specifically, the use of PCM in the building walls and roofincreased their thermal resistance and thereby reduced the overall heat transfer through the walls withmuch lowered heat load compared to the building without PCM.
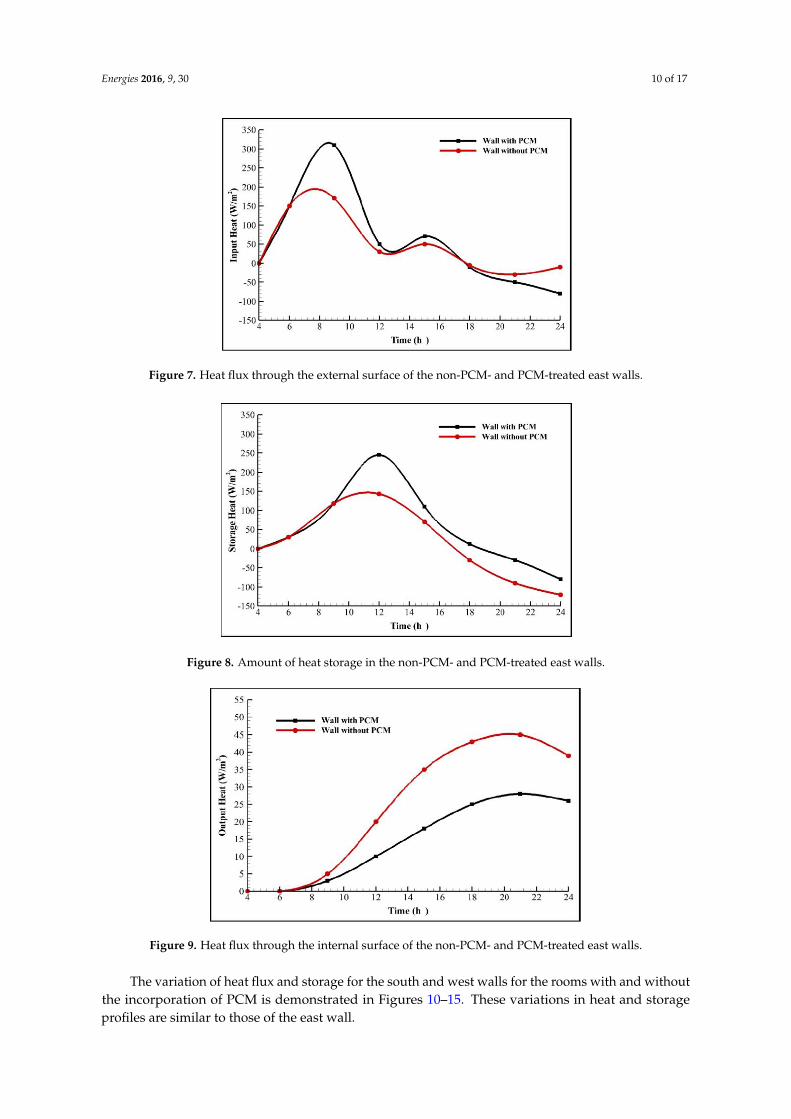
The temperature variation for the PCM and non-PCM walls is theoretically examined. The east,south and west walls are used to calculate the heat flux through the external and internal walls’ surfaceand the amount of heat storage in the walls. In Figures 7–9 the external heat flux, heat storage andinternal heat flux on the east wall of both types of rooms have been compared. Figure 9 (heat fluxthrough the external wall) clearly reveals that the heat flux for the PCM incorporated room is slightlyhigher than the one without PCM on the walls. This observation is attributed to the low thermalconductivity of the liquid PCM, which reduced the heat transmission to the room and thereby increasedthe wall top surface temperature. The maximum value of heat flux through the PCM including andexcluding the external wall at 9 h is found to be 312 W/m2 and 162 W/m2, respectively. Conversely,the heat flux (at 21.5 h) through the internal east wall of the room with and without PCM is discernedto be 26 W/m2 and 44 W/m2, respectively. Furthermore, heat storage is observed to be maximumat 12 h with values of 240 W/m2 and 135 W/m2 for the PCM integrated and non-integrated eastwalls, respectively.
Energies 2016, 9, 30
9
conductivity of the liquid PCM, which reduced the heat transmission to the room and thereby
increased the wall top surface temperature. The maximum value of heat flux through the PCM
including and excluding the external wall at 9 h is found to be 312 W/m2 and 162 W/m2, respectively.
Conversely, the heat flux (at 21.5 h) through the internal east wall of the room with and without PCM
is discerned to be 26 W/m2 and 44 W/m2, respectively. Furthermore, heat storage is observed to be
maximum at 12 h with values of 240 W/m2 and 135 W/m2 for the PCM integrated and non‐integrated
east walls, respectively.
Figure 6. Temperature variation of the test room with and without PCM (REF) at a height of 1.5 m in
the month of January.
Figure 7. Heat flux through the external surface of the non‐PCM‐ and PCM‐treated east walls.
Figure 6. Temperature variation of the test room with and without PCM (REF) at a height of 1.5 m inthe month of January.
Energies 2016, 9, 30 10 of 17
Energies 2016, 9, 30
9
conductivity of the liquid PCM, which reduced the heat transmission to the room and thereby
increased the wall top surface temperature. The maximum value of heat flux through the PCM
including and excluding the external wall at 9 h is found to be 312 W/m2 and 162 W/m2, respectively.
Conversely, the heat flux (at 21.5 h) through the internal east wall of the room with and without PCM
is discerned to be 26 W/m2 and 44 W/m2, respectively. Furthermore, heat storage is observed to be
maximum at 12 h with values of 240 W/m2 and 135 W/m2 for the PCM integrated and non‐integrated
east walls, respectively.
Figure 6. Temperature variation of the test room with and without PCM (REF) at a height of 1.5 m in
the month of January.
Figure 7. Heat flux through the external surface of the non‐PCM‐ and PCM‐treated east walls. Figure 7. Heat flux through the external surface of the non-PCM- and PCM-treated east walls.Energies 2016, 9, 30
10
Figure 8. Amount of heat storage in the non‐PCM‐ and PCM‐treated east walls.
Figure 9. Heat flux through the internal surface of the non‐PCM‐ and PCM‐treated east walls.
The variation of heat flux and storage for the south and west walls for the rooms with and
without the incorporation of PCM is demonstrated in Figures 10–15. These variations in heat and
storage profiles are similar to those of the east wall.
The value of thermal flow and heat storage through a selected wall is computed using finite
volume method (FVM), where the thermal flow (through the wall for both the internal and external
surface) is calculated. A fixed value of the internal and external heat transfer coefficient is used, which
is 7.73 W/m2∙°C and 23.3 W/m2∙°C for the internal and external wall surface, respectively. The amount
of stored heat in the walls containing PCMs is found to be larger than the traditional (REF) walls.
This elevated storage in PCM walls is ascribed to the high heat capacity and heat‐retaining
susceptibility without connecting any storage space to the air conditioner. The observed higher
thermal storage for the western walls is related to the longest exposure to the solar radiation.
Figure 8. Amount of heat storage in the non-PCM- and PCM-treated east walls.
Energies 2016, 9, 30
10
Figure 8. Amount of heat storage in the non‐PCM‐ and PCM‐treated east walls.
Figure 9. Heat flux through the internal surface of the non‐PCM‐ and PCM‐treated east walls.
The variation of heat flux and storage for the south and west walls for the rooms with and
without the incorporation of PCM is demonstrated in Figures 10–15. These variations in heat and
storage profiles are similar to those of the east wall.
The value of thermal flow and heat storage through a selected wall is computed using finite
volume method (FVM), where the thermal flow (through the wall for both the internal and external
surface) is calculated. A fixed value of the internal and external heat transfer coefficient is used, which
is 7.73 W/m2∙°C and 23.3 W/m2∙°C for the internal and external wall surface, respectively. The amount
of stored heat in the walls containing PCMs is found to be larger than the traditional (REF) walls.
This elevated storage in PCM walls is ascribed to the high heat capacity and heat‐retaining
susceptibility without connecting any storage space to the air conditioner. The observed higher
thermal storage for the western walls is related to the longest exposure to the solar radiation.
Figure 9. Heat flux through the internal surface of the non-PCM- and PCM-treated east walls.
The variation of heat flux and storage for the south and west walls for the rooms with and withoutthe incorporation of PCM is demonstrated in Figures 10–15. These variations in heat and storageprofiles are similar to those of the east wall.

Energies 2016, 9, 30 11 of 17
The value of thermal flow and heat storage through a selected wall is computed using finitevolume method (FVM), where the thermal flow (through the wall for both the internal and externalsurface) is calculated. A fixed value of the internal and external heat transfer coefficient is used, whichis 7.73 W/m2¨ ˝C and 23.3 W/m2¨ ˝C for the internal and external wall surface, respectively. Theamount of stored heat in the walls containing PCMs is found to be larger than the traditional (REF)walls. This elevated storage in PCM walls is ascribed to the high heat capacity and heat-retainingsusceptibility without connecting any storage space to the air conditioner. The observed higher thermalstorage for the western walls is related to the longest exposure to the solar radiation.Energies 2016, 9, 30
11
Figure 10. Heat flux through the external surface of the non‐PCM‐ and PCM‐treated south walls.
Figure 11. Amount of heat storage of the non‐PCM‐ and PCM‐treated south walls.
Figure 12. Heat flux through the internal surface of the non‐PCM‐ and PCM‐treated south walls.
Figure 13. Heat flux through the external surface of the non‐PCM‐ and PCM‐treated west walls.
Figure 10. Heat flux through the external surface of the non-PCM- and PCM-treated south walls.
Energies 2016, 9, 30
11
Figure 10. Heat flux through the external surface of the non‐PCM‐ and PCM‐treated south walls.
Figure 11. Amount of heat storage of the non‐PCM‐ and PCM‐treated south walls.
Figure 12. Heat flux through the internal surface of the non‐PCM‐ and PCM‐treated south walls.
Figure 13. Heat flux through the external surface of the non‐PCM‐ and PCM‐treated west walls.
Figure 11. Amount of heat storage of the non-PCM- and PCM-treated south walls.
Energies 2016, 9, 30
11
Figure 10. Heat flux through the external surface of the non‐PCM‐ and PCM‐treated south walls.
Figure 11. Amount of heat storage of the non‐PCM‐ and PCM‐treated south walls.
Figure 12. Heat flux through the internal surface of the non‐PCM‐ and PCM‐treated south walls.
Figure 13. Heat flux through the external surface of the non‐PCM‐ and PCM‐treated west walls.
Figure 12. Heat flux through the internal surface of the non-PCM- and PCM-treated south walls.

Energies 2016, 9, 30 12 of 17
Energies 2016, 9, 30
11
Figure 10. Heat flux through the external surface of the non‐PCM‐ and PCM‐treated south walls.
Figure 11. Amount of heat storage of the non‐PCM‐ and PCM‐treated south walls.
Figure 12. Heat flux through the internal surface of the non‐PCM‐ and PCM‐treated south walls.
Figure 13. Heat flux through the external surface of the non‐PCM‐ and PCM‐treated west walls. Figure 13. Heat flux through the external surface of the non-PCM- and PCM-treated west walls.Energies 2016, 9, 30
12
Figure 14. Amount of heat storage in the non‐PCM‐ and PCM‐treated west walls.
Figure 15. Heat flux through the internal surface of the non‐PCM‐ and PCM‐treated west walls.
The simulated temperature contours for REF and PCM2 at different times over the day are
illustrated in Figures 16–19. It is evident that the room with PCM integration in the roof achieves a
superior temperature distribution throughout the day than the one without PCM. However, with the
increase of sun sign, the temperature fluctuation became more prominent (at 12 h) for the REF room,
as shown in Figure 20a. The temperature fluctuation kept on increasing at 16 h and 18 h, as depicted
in Figures 21a and 22a.
(a) (b)
Figure 16. Temperature counters of the roof at 8 h for the room: (a) without and (b) with PCM.
29.687529.37529.062528.7528.437528.12527.812527.527.187526.87526.562526.2525.937525.62525.3125
27.562527.12526.687526.2525.812525.37524.937524.524.062523.62523.187522.7522.312521.87521.4375
Figure 14. Amount of heat storage in the non-PCM- and PCM-treated west walls.
Energies 2016, 9, 30
12
Figure 14. Amount of heat storage in the non‐PCM‐ and PCM‐treated west walls.
Figure 15. Heat flux through the internal surface of the non‐PCM‐ and PCM‐treated west walls.
The simulated temperature contours for REF and PCM2 at different times over the day are
illustrated in Figures 16–19. It is evident that the room with PCM integration in the roof achieves a
superior temperature distribution throughout the day than the one without PCM. However, with the
increase of sun sign, the temperature fluctuation became more prominent (at 12 h) for the REF room,
as shown in Figure 20a. The temperature fluctuation kept on increasing at 16 h and 18 h, as depicted
in Figures 21a and 22a.
(a) (b)
Figure 16. Temperature counters of the roof at 8 h for the room: (a) without and (b) with PCM.
29.687529.37529.062528.7528.437528.12527.812527.527.187526.87526.562526.2525.937525.62525.3125
27.562527.12526.687526.2525.812525.37524.937524.524.062523.62523.187522.7522.312521.87521.4375
Figure 15. Heat flux through the internal surface of the non-PCM- and PCM-treated west walls.
The simulated temperature contours for REF and PCM2 at different times over the day areillustrated in Figures 16–19. It is evident that the room with PCM integration in the roof achieves asuperior temperature distribution throughout the day than the one without PCM. However, with theincrease of sun sign, the temperature fluctuation became more prominent (at 12 h) for the REF room,as shown in Figure 20a. The temperature fluctuation kept on increasing at 16 h and 18 h, as depicted inFigures 21a and 22a.

Energies 2016, 9, 30 13 of 17
Energies 2016, 9, 30
12
Figure 14. Amount of heat storage in the non‐PCM‐ and PCM‐treated west walls.
Figure 15. Heat flux through the internal surface of the non‐PCM‐ and PCM‐treated west walls.
The simulated temperature contours for REF and PCM2 at different times over the day are
illustrated in Figures 16–19. It is evident that the room with PCM integration in the roof achieves a
superior temperature distribution throughout the day than the one without PCM. However, with the
increase of sun sign, the temperature fluctuation became more prominent (at 12 h) for the REF room,
as shown in Figure 20a. The temperature fluctuation kept on increasing at 16 h and 18 h, as depicted
in Figures 21a and 22a.
(a) (b)
Figure 16. Temperature counters of the roof at 8 h for the room: (a) without and (b) with PCM.
29.687529.37529.062528.7528.437528.12527.812527.527.187526.87526.562526.2525.937525.62525.3125
27.562527.12526.687526.2525.812525.37524.937524.524.062523.62523.187522.7522.312521.87521.4375
Figure 16. Temperature counters of the roof at 8 h for the room: (a) without and (b) with PCM.Energies 2016, 9, 30
13
(a) (b)
Figure 17. Temperature counters of the roof at 12 h for the room: (a) without and (b) with PCM.
(a) (b)
Figure 18. Temperature counters of the roof at 16 h for the room: (a) without and (b) with PCM.
(a) (b)
Figure 19. Temperature counters of the roof at 18 h for the room (a) without and (b) with PCM.
Figures 20 and 21 compare the simulation and experimental results of the roof temperature for
the rooms with and without PCM, respectively.
393837363534333232313029282726
27.562527.12526.687526.2525.812525.37524.937524.524.062523.62523.187522.7522.312521.87521.4375
454342413938373534333230292826
27.562527.12526.687526.2525.812525.37524.937524.524.062523.62523.187522.7522.312521.87521.4375
424140383736353433323129282726
27.562527.12526.687526.2525.812525.37524.937524.524.062523.62523.187522.7522.312521.87521.4375
Figure 17. Temperature counters of the roof at 12 h for the room: (a) without and (b) with PCM.
Energies 2016, 9, 30
13
(a) (b)
Figure 17. Temperature counters of the roof at 12 h for the room: (a) without and (b) with PCM.
(a) (b)
Figure 18. Temperature counters of the roof at 16 h for the room: (a) without and (b) with PCM.
(a) (b)
Figure 19. Temperature counters of the roof at 18 h for the room (a) without and (b) with PCM.
Figures 20 and 21 compare the simulation and experimental results of the roof temperature for
the rooms with and without PCM, respectively.
393837363534333232313029282726
27.562527.12526.687526.2525.812525.37524.937524.524.062523.62523.187522.7522.312521.87521.4375
454342413938373534333230292826
27.562527.12526.687526.2525.812525.37524.937524.524.062523.62523.187522.7522.312521.87521.4375
424140383736353433323129282726
27.562527.12526.687526.2525.812525.37524.937524.524.062523.62523.187522.7522.312521.87521.4375
Figure 18. Temperature counters of the roof at 16 h for the room: (a) without and (b) with PCM.

Energies 2016, 9, 30 14 of 17
Energies 2016, 9, 30
13
(a) (b)
Figure 17. Temperature counters of the roof at 12 h for the room: (a) without and (b) with PCM.
(a) (b)
Figure 18. Temperature counters of the roof at 16 h for the room: (a) without and (b) with PCM.
(a) (b)
Figure 19. Temperature counters of the roof at 18 h for the room (a) without and (b) with PCM.
Figures 20 and 21 compare the simulation and experimental results of the roof temperature for
the rooms with and without PCM, respectively.
393837363534333232313029282726
27.562527.12526.687526.2525.812525.37524.937524.524.062523.62523.187522.7522.312521.87521.4375
454342413938373534333230292826
27.562527.12526.687526.2525.812525.37524.937524.524.062523.62523.187522.7522.312521.87521.4375
424140383736353433323129282726
27.562527.12526.687526.2525.812525.37524.937524.524.062523.62523.187522.7522.312521.87521.4375
Figure 19. Temperature counters of the roof at 18 h for the room (a) without and (b) with PCM.
Figures 20 and 21 compare the simulation and experimental results of the roof temperature forthe rooms with and without PCM, respectively.Energies 2016, 9, 30
14
Figure 20. Experimental and simulated temperature of the PCM integrated roof.
Figure 21. Experimental and simulated temperature of the REF roof.
It is evident that the ceiling (concrete) temperature of the room containing PCM maintained the
temperature constant (27 °C) throughout the day as compared to that of the conventional room. This
demonstrates that the environment insignificantly affects the inner surface of the ceiling, because all
of the heat energy is absorbed by the PCM installed in the roof. Conversely, a considerable
temperature fluctuation is observed in the ceiling of the REF (without PCM), because the outside
environment immediately influenced its ceiling. Furthermore, the experimental results for PCM2
revealed a small reduction in ceiling temperature during the day time and slight augmentation
during the night time. This diminished temperature fluctuation of PCM2 arose from the large heat
storage capacity of the PCM. The occurrence of the observed temperature differences between the
simulation and experimental results is ascribed to the following reasons:
(1) The room ceiling is influenced by interior condition, where an actual temperature variation occurred.
(2) The effective thermal conductivity of the PCM in the experiment is higher due to the presence
of uniformly‐distributed high conductivity heat exchanger material in the PCM panel.
(3) The actual phase change may not occur during the phase change temperature as prescribed in
the theory.
Figure 22 shows the simulated heat flux entering the room. It is clear that the PCM incorporated
roof is better than the one without PCM. The implementation of PCM in the building structure
remarkably reduced (more than two‐thirds) the heat entry compared to the room without PCM
integration. Moreover, the presence of PCM reduced the heat transfer by 46.71% which is directly
proportional to reduction in the electricity consumption to maintain the room at 25 °C. Hence, the
incorporation of PCM in the building architecture of Iraq is recommended because of thermal
comfort, cost‐effectiveness and environmental friendliness.
Figure 20. Experimental and simulated temperature of the PCM integrated roof.
Energies 2016, 9, 30
14
Figure 20. Experimental and simulated temperature of the PCM integrated roof.
Figure 21. Experimental and simulated temperature of the REF roof.
It is evident that the ceiling (concrete) temperature of the room containing PCM maintained the
temperature constant (27 °C) throughout the day as compared to that of the conventional room. This
demonstrates that the environment insignificantly affects the inner surface of the ceiling, because all
of the heat energy is absorbed by the PCM installed in the roof. Conversely, a considerable
temperature fluctuation is observed in the ceiling of the REF (without PCM), because the outside
environment immediately influenced its ceiling. Furthermore, the experimental results for PCM2
revealed a small reduction in ceiling temperature during the day time and slight augmentation
during the night time. This diminished temperature fluctuation of PCM2 arose from the large heat
storage capacity of the PCM. The occurrence of the observed temperature differences between the
simulation and experimental results is ascribed to the following reasons:
(1) The room ceiling is influenced by interior condition, where an actual temperature variation occurred.
(2) The effective thermal conductivity of the PCM in the experiment is higher due to the presence
of uniformly‐distributed high conductivity heat exchanger material in the PCM panel.
(3) The actual phase change may not occur during the phase change temperature as prescribed in
the theory.
Figure 22 shows the simulated heat flux entering the room. It is clear that the PCM incorporated
roof is better than the one without PCM. The implementation of PCM in the building structure
remarkably reduced (more than two‐thirds) the heat entry compared to the room without PCM
integration. Moreover, the presence of PCM reduced the heat transfer by 46.71% which is directly
proportional to reduction in the electricity consumption to maintain the room at 25 °C. Hence, the
incorporation of PCM in the building architecture of Iraq is recommended because of thermal
comfort, cost‐effectiveness and environmental friendliness.
Figure 21. Experimental and simulated temperature of the REF roof.

Energies 2016, 9, 30 15 of 17
It is evident that the ceiling (concrete) temperature of the room containing PCM maintained thetemperature constant (27 ˝C) throughout the day as compared to that of the conventional room. Thisdemonstrates that the environment insignificantly affects the inner surface of the ceiling, because all ofthe heat energy is absorbed by the PCM installed in the roof. Conversely, a considerable temperaturefluctuation is observed in the ceiling of the REF (without PCM), because the outside environmentimmediately influenced its ceiling. Furthermore, the experimental results for PCM2 revealed a smallreduction in ceiling temperature during the day time and slight augmentation during the nighttime. This diminished temperature fluctuation of PCM2 arose from the large heat storage capacityof the PCM. The occurrence of the observed temperature differences between the simulation andexperimental results is ascribed to the following reasons:
(1) The room ceiling is influenced by interior condition, where an actual temperaturevariation occurred.
(2) The effective thermal conductivity of the PCM in the experiment is higher due to the presence ofuniformly-distributed high conductivity heat exchanger material in the PCM panel.
(3) The actual phase change may not occur during the phase change temperature as prescribed inthe theory.
Figure 22 shows the simulated heat flux entering the room. It is clear that the PCM incorporatedroof is better than the one without PCM. The implementation of PCM in the building structureremarkably reduced (more than two-thirds) the heat entry compared to the room without PCMintegration. Moreover, the presence of PCM reduced the heat transfer by 46.71% which is directlyproportional to reduction in the electricity consumption to maintain the room at 25 ˝C. Hence, theincorporation of PCM in the building architecture of Iraq is recommended because of thermal comfort,cost-effectiveness and environmental friendliness.Energies 2016, 9, 30
15
Figure 22. The simulated heat flux entering the room.
6. Conclusions
Thermal management of locally‐extracted PCM (paraffin with 40% oil and 60% wax)
incorporated building structures in the specific climatic condition of Iraq is reported. Experiments
and numerical investigations are made to examine the heat flux reduction inside a residential
building using such PCMs. These inexpensive PCMs are obtained from waste petroleum products in
Iraq. Two rooms of identical internal dimensions are built, one with PCM and the other without PCM
in the roof and walls. The thermal performances of these full‐scale test rooms are evaluated. The
experimental results are complemented using two‐dimensional numerical transient heat transfer
(laminar and turbulent flows) model simulation, where the finite difference method is used to solve
the discretized equations. The computations are conducted to obtain the solution of heat transfer in
a square cavity with differentially‐heated side walls. Simulation and experimental results revealed a
good agreement. The heat flux inside the PCM integrated room is demonstrated to be considerably
lower than the one without PCM. The admirable features of the results suggest that our systematic
theoretical and simulation studies may contribute towards the development of thermal management
of PCM integrated buildings in Iraq.
Acknowledgments: The authors would like to thank the Ministry of Science, Technology and Innovation
(MOSTI) and the Universiti Teknologi Malaysia for supporting this research activity under a science grant under
Grant Research No. R.J130000.7924.4S080. The authors are grateful to the staff of the Department of Mechanical
Engineering, University of Technology‐Iraq, for their help. Hussein is grateful to the government of Iraq for
providing the financial support and study leave to complete the doctoral degree.
Author Contributions: The contributions of each author are as follows: Hussein J. Akeiber and Seyed Ehsan Hosseini
provided the impetus for this work and analyzed the experimental and numerical results and drafted the
manuscript. Mazlan A. Wahid, Hasanen M. Hussen and Abdulrahman Th. Mohammad provided insights that
led to highlighting some of the distinctions between equations and worked on rewrites and clarifications.
All authors have read and approved the final manuscript.
Conflicts of Interest: The authors declare no conflict of interest.
Nomenclatures
C1, C3 Specific heat of roof top slab and concrete slab (kJ/kg∙K)
Cpl Specific heat of liquid PCM (kJ/kg∙K)
Cps Specific heat of solid PCM (kJ/kg∙K)
f Implicit factor
GrL Grashof number
hi Inside heat transfer coefficient (W/m2∙K)
ho Outside heat transfer coefficient (W/m2∙K)
k1, k2, k3 Thermal conductivity of roof top slab, PCM panel and bottom concrete slab (W/m∙K)
Figure 22. The simulated heat flux entering the room.
6. Conclusions
Thermal management of locally-extracted PCM (paraffin with 40% oil and 60% wax) incorporatedbuilding structures in the specific climatic condition of Iraq is reported. Experiments and numericalinvestigations are made to examine the heat flux reduction inside a residential building using suchPCMs. These inexpensive PCMs are obtained from waste petroleum products in Iraq. Two roomsof identical internal dimensions are built, one with PCM and the other without PCM in the roofand walls. The thermal performances of these full-scale test rooms are evaluated. The experimental

Energies 2016, 9, 30 16 of 17
results are complemented using two-dimensional numerical transient heat transfer (laminar andturbulent flows) model simulation, where the finite difference method is used to solve the discretizedequations. The computations are conducted to obtain the solution of heat transfer in a square cavitywith differentially-heated side walls. Simulation and experimental results revealed a good agreement.The heat flux inside the PCM integrated room is demonstrated to be considerably lower than theone without PCM. The admirable features of the results suggest that our systematic theoreticaland simulation studies may contribute towards the development of thermal management of PCMintegrated buildings in Iraq.
Acknowledgments: The authors would like to thank the Ministry of Science, Technology and Innovation (MOSTI)and the Universiti Teknologi Malaysia for supporting this research activity under a science grant under GrantResearch No. R.J130000.7924.4S080. The authors are grateful to the staff of the Department of MechanicalEngineering, University of Technology-Iraq, for their help. Hussein is grateful to the government of Iraq forproviding the financial support and study leave to complete the doctoral degree.
Author Contributions: The contributions of each author are as follows: Hussein J. Akeiber andSeyed Ehsan Hosseini provided the impetus for this work and analyzed the experimental and numerical resultsand drafted the manuscript. Mazlan A. Wahid, Hasanen M. Hussen and Abdulrahman Th. Mohammadprovided insights that led to highlighting some of the distinctions between equations and worked on rewrites andclarifications. All authors have read and approved the final manuscript.
Conflicts of Interest: The authors declare no conflict of interest.
Nomenclatures
C1, C3 Specific heat of roof top slab and concrete slab (kJ/kg¨ K)Cpl Specific heat of liquid PCM (kJ/kg¨ K)Cps Specific heat of solid PCM (kJ/kg¨ K)f Implicit factorGrL Grashof numberhi Inside heat transfer coefficient (W/m2¨ K)ho Outside heat transfer coefficient (W/m2¨ K)k1, k2, k3 Thermal conductivity of roof top slab, PCM panel and bottom concrete slab (W/m¨ K)L1, L2, L3 Thickness of roof top slab, PCM panel and bottom concrete slab (m)NuL Nusselt numberPr Prandtl numberqrad Radiation flux (W/m2)Re Reynolds numberT TemperatureT8 Ambient temperatureTi
0 Previous time step temperature at i-th volume cellTi Current time step temperature at i-th volume cellTin Initial temperatureTroom Room temperatureTs Surface temperatureTsky Sky temperatureα Absorptivityε Emissivityhsl Solid-liquid enthalpy change (kJ/kg)σ Stefan-Boltzmann constantρ1, ρ2, ρ3 Density of roof top slab, PCM panel and bottom concrete slab (kg/m3)∆t Time step (s)δx1,δx2, δx3 Nodal distances (m)∆x1, ∆x2, ∆x3 Control volume length of roof top slab, PCM panel and bottom concrete slab (m)

Energies 2016, 9, 30 17 of 17
References
1. Tenorio, J.A.; Sánchez-Ramos, J.; Ruiz-Pardo, Á.; Álvarez, S.; Cabeza, L.F. Energy Efficiency Indicators forAssessing Construction Systems Storing Renewable Energy: Application to Phase Change Material-BearingFaçades. Energies 2015, 8, 8630–8649. [CrossRef]
2. Lo Brano, V.; Ciulla, G.; Piacentino, A.; Cardona, F. On the efficacy of PCM to shave peak temperature ofcrystalline photovoltaic panels: An FDM model and field validation. Energies 2013, 6, 6188–6210. [CrossRef]
3. Seong, Y.B.; Lim, J.H. Energy Saving Potentials of Phase Change Materials Applied to Lightweight BuildingEnvelopes. Energies 2013, 6, 5219–5230. [CrossRef]
4. Normura, T.; Tsubota, M.; Oya, T.; Okinka, N.; Akiyama, T. Heat storage in direct-contact heat exchangerwith phase change material. Appl. Therm. Eng. 2013, 50, 26–34. [CrossRef]
5. Oro, E.; De Gracia, A.; Castell, A.; Farid, M.M.; Cabeza, L.F. Review on phase change materials (PCMs) forcold thermal energy storage applications. Appl. Energy 2012, 99, 513–533. [CrossRef]
6. Rezaei, M.; Anisur, M.R.; Mahfuz, M.H.; Kibria, M.A.; Saidur, R.; Metselaar, I.H.S.C. Performance and costanalysis of phase change materials with different melting temperatures in heating system. Energy 2013, 5,173–178. [CrossRef]
7. Li, Y.; Zhang, Y.; Li, M.; Zhang, M. Testing method of phase change temperature and heat of inorganic hightemperature phase change materials. Exp. Therm. Fluid Sci. 2013, 44, 697–707. [CrossRef]
8. Romero-Sanchez, M.D.; Guillem-Lopez, C.; Lopez-Buendia, A.M.; Stamatiadou, M.; Mandilaras, I.;Katsourinis, D.; Founti, M. Treatment of natural stones with phase change materials: Experiments andcomputational approaches. Appl. Therm. Eng. 2012, 48, 136–143. [CrossRef]
9. Izquierdo-Barrientos, M.A.; Belmonte, J.F.; Rodríguez-Sánchez, D.; Molina, A.E.; lmendros-Ibáñez, J.A.A numerical study of external building walls containing phase change materials (PCM). Appl. Therm. Eng.2012, 47, 73–85. [CrossRef]
10. Kuznik, F.; Virgone, J. Experimental assessment of a phase change material for wall building use. Appl. Energy2009, 86, 2038–2046. [CrossRef]
11. De Gracia, A.; Rincón, L.; Castell, A.; Jiménez, M.; Boerb, D.; Medrano, M.; Cabez, L.F. Life Cycle Assessmentof the inclusion of phase change materials (PCM) in experimental buildings. Energy Build. 2010, 42, 1517–1523.[CrossRef]
12. Kuznik, F.; Virgone, J.; Noel, J. Optimization of a phase change material wallboard for building use.Appl. Therm. Eng. 2008, 28, 1291–1298. [CrossRef]
13. Navarro, L.; de Garcia, A.; Solé, C.; Castell, A.; Cabeza, L.F. Thermal loads inside buildings with phasechange materials: Experimental results. Energy Proced. 2012, 30, 342–349. [CrossRef]
14. Pasupathy, A.; Velraj, R. Effect of double layer phase change material in building roof for year round thermalmanagement. Energy Build. 2008, 40, 193–203. [CrossRef]
© 2016 by the authors; licensee MDPI, Basel, Switzerland. This article is an open accessarticle distributed under the terms and conditions of the Creative Commons by Attribution(CC-BY) license (http://creativecommons.org/licenses/by/4.0/).