Phase-Based Level Set Segmentation of Ultrasound Images Author: Ahror Belaid, Djamal Boukerroui, Y....
24
Phase-Based Level Set Segmentation of Ultrasound Images Author: Ahror Belaid, Djamal Boukerroui, Y. Maingourd, and Jean- Francois Lerallut Source: IEEE TRANSACTIONS ON INFORMATION TECHNOLOGY IN BIOMEDICINE, 2011.01 Date : 20110302 Speaker: YayunCheng
-
date post
19-Dec-2015 -
Category
Documents
-
view
223 -
download
0
Transcript of Phase-Based Level Set Segmentation of Ultrasound Images Author: Ahror Belaid, Djamal Boukerroui, Y....
Phase-Based Level Set Segmentation ofUltrasound Images
Author: Ahror Belaid, Djamal Boukerroui, Y. Maingourd, and Jean-Francois LerallutSource: IEEE TRANSACTIONS ON INFORMATION TECHNOLOGY IN BIOMEDICINE,
2011.01Date : 20110302
Speaker: YayunCheng

Introduction• Ultrasound imaging is an exploration technique commonly used in many
diagnostic and therapeutic applications. It has many advantages: it is noninvasive, provides images in real time, and requires lightweight material.
• Ultrasonic image segmentation is a difficult problem due to speckle noise, low contrast, low signal-to-noise and local changes of intensity.
• Intensity-based methods do not perform particularly well on ultrasound images and these images respond well to local phase-based methods which are theoretically intensity invariant.

• In this study, we refer to echocardiographic data.• The most popular approach has been to treat
echocardiographic endocardial segmentation as a contour finding approach.
• Conventional intensity gradient-based methods have had limited success on typical clinical images. To avoid this drawback, phase-based approach offers a good alternative, since it makes the approach robust to attenuation artifacts.
Related Works

Related Works
• A model of feature perception called the local energy model has been developed by Morrone et al. [22], [23].
• A wide range of feature types give rise to points of high-phase congruency.
• Phase information has been used in numerous applications ,Mulet-Parada and Noble [25], [26] were the first to successfully use the local phase information for boundary detection on echocardiographic images.

Object
• Here, we use level set propagation to capture the left ventricle boundaries.
• This uses local phase information derived from the monogenic signal, which is a ultidimensional extension of the analytic signal [44]–[46].
• Our idea is to use a novel speed function, which combines the local phase and local orientation in order to detect boundaries in low contrast regions.

Background
• The information carried by the phase of a picture appears to be much more significant than the information carried by its amplitude.
Image of Phyllis Image of Aaron Image composed of Aaron's magnitude and Phyllis' phase
Image composed of Aaron's phase and Phyllis' magnitude
• One of the popular methods to estimate local signal information is based on the analytic representation of the signal.

• To extract the local properties (amplitude and phase) of a 1-D signal f(x), we need to represent it in its analytic form:
• The local amplitude (energy) and local phase of f(x) are given by
• Felsberg and Sommer [45][46] proposed a novel n-D generalization of the analytic signal based on the Riesz transform, which is used instead of the Hilbert transform. Also, they proposed a 2-D isotropic analytic signal, called monogenic signal
BackgroundA. Monogenic Signal
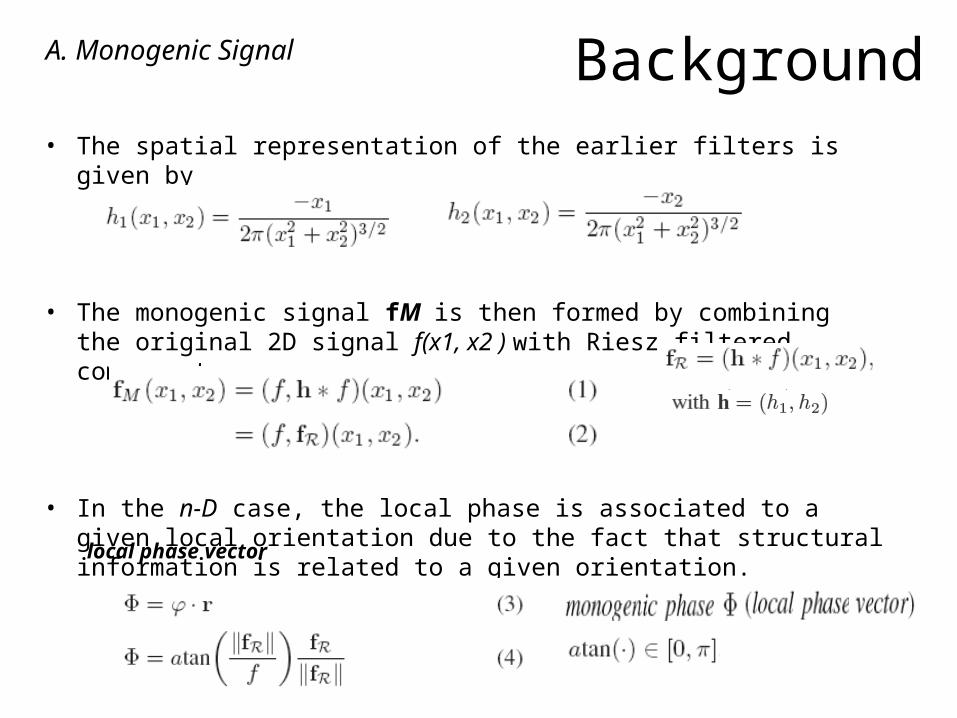
• The spatial representation of the earlier filters is given by
• The monogenic signal fM is then formed by combining the original 2D signal f(x1, x2 ) with Riesz filtered components
• In the n-D case, the local phase is associated to a given local orientation due to the fact that structural information is related to a given orientation.
BackgroundA. Monogenic Signal
local phase vector

• The defined local phase vector can be interpreted as a rotation vector, which magnitude corresponds to the phase angle between the real signal and the monogenic signal.
• The monogenic phase characterizes the local structure of an image as long as the image is locally i1-D, given that the phase has been defined with respect to a given orientation.
• The phase vector orientation r represents the local orientation of the image
BackgroundA. Monogenic Signal

• The local properties are estimated using a pair of bandpass quadrature filters. Indeed, the detection by the monogenic signal assumes signal consists of few frequencies is bandlimited.
• The monogenic signal can be represented by a scalar-valued even and vector-valued odd filtered responses
• In [50], [51], Boukerroui et al. showed that Cauchy family has better properties.
• In this paper, a Cauchy kernel is used as a bandpass filter.
BackgroundB. Quadrature Filters
c(x1, x2; s) is the isotropic bandpass filter and s > 0
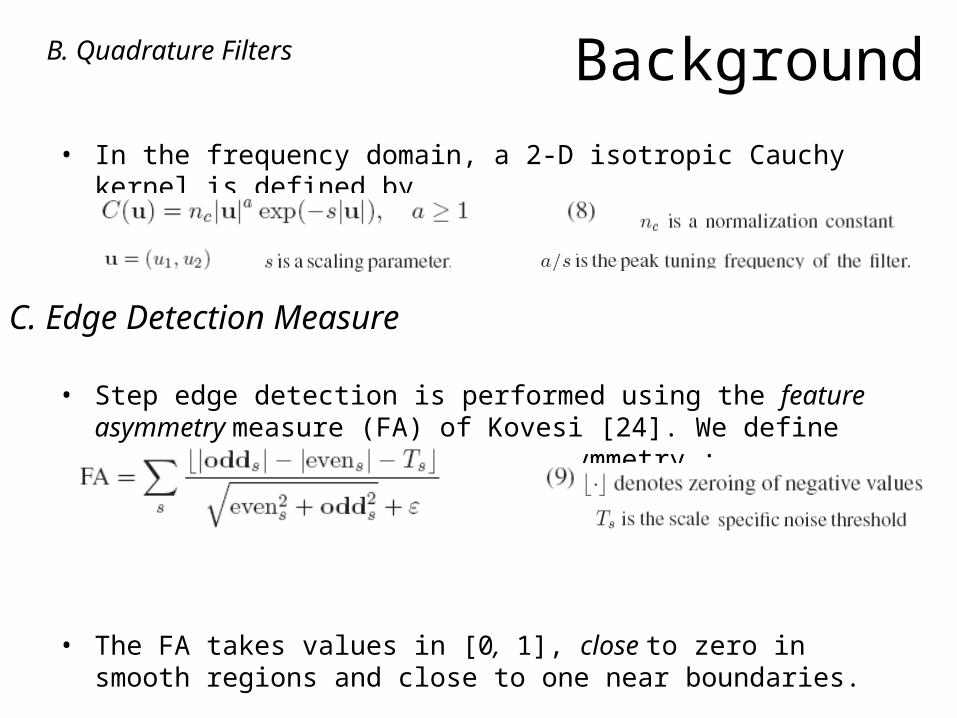
• In the frequency domain, a 2-D isotropic Cauchy kernel is defined by
• Step edge detection is performed using the feature asymmetry measure (FA) of Kovesi [24]. We define the multiple scales feature asymmetry :
• The FA takes values in [0, 1], close to zero in smooth regions and close to one near boundaries.
BackgroundB. Quadrature Filters
C. Edge Detection Measure
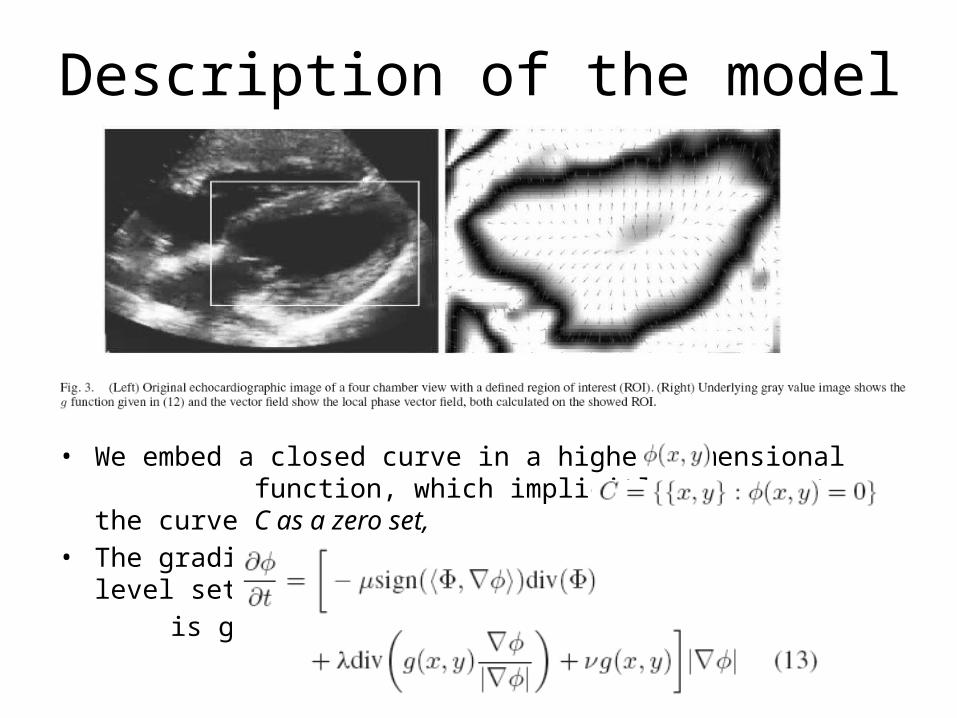
Description of the model
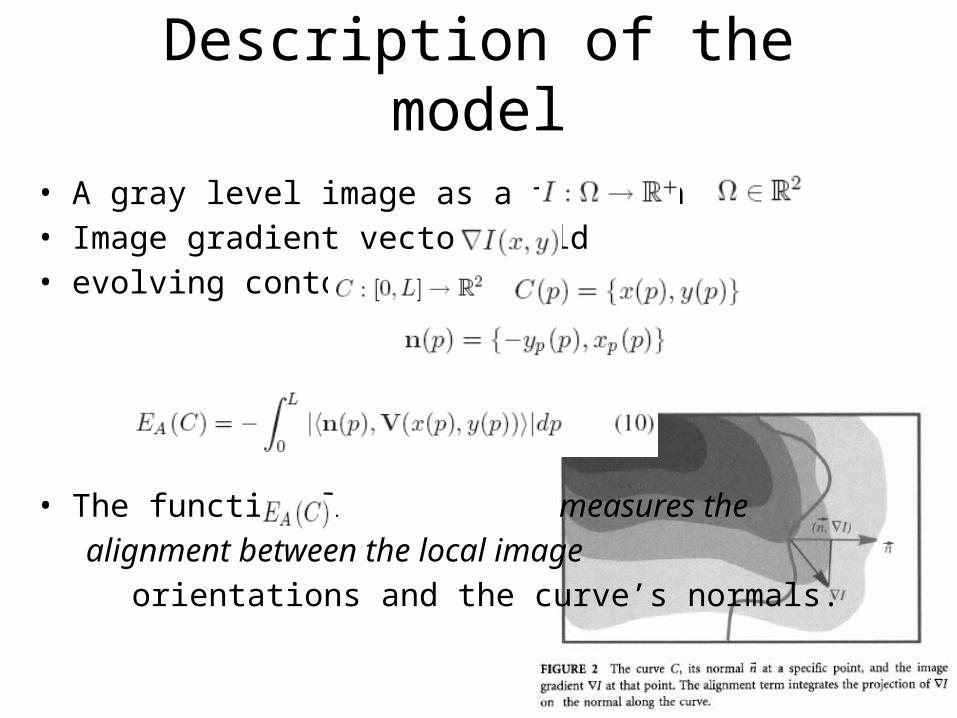
• A gray level image as a function• Image gradient vector field• evolving contour
• The functional measures the alignment between the local image orientations and the curve’s normals.

• In the proposed work, we use the local orientation (the monogenic phase ) given by (4) instead of the classical gradient estimation.
• It is known in literature that when we use several terms, geodesic active contour model (GAC) [54] serves as a good regularization for other dominant terms.
Description of the model
Thus, the values of g are close to one in smooth regions and close to zero nearboundaries.
Description of the model
• We embed a closed curve in a higher dimensional function, which implicitly represents the curve C as a zero set,
• The gradient descent flow minimizing , in the level set formulation, is given by

Result• MATLAB 7.6 (R2008a)• 15 s of CPU time per image (image size 256 × 256) on an IBM Intel Xeon
single-CPU 3.4 GHz.• Parameter: bandwidth = 2.5 octaves as suggested in [50] wavelength= 20 pixels(natural data),10 pixels(synthetic data)• α = 0.5• The GAC parameter λ is not set to the same value in all experiments.
• Found by experiment that ν = 0.1 was appropriate for most datasets.• Compare with GAC(without alignment term) and GAC + ML(strengthen it by
a region-based term )
many objects of different sizes, then λ should be smallonly large objects no smaller objects, λ has to be larger

It is computed by the FA measure, using the monogenic signal with the Cauchy filters.
By moving closer to the coarse scales, edge detection looses details but recovers regularity of the boundaries
Result

Resultshows illustrative results of our method on two typicalultrasound images (left ventricle).

• We have collected a set of 20 bidimensional cardiac ultrasoundimages, obtained from a Philips IE33 echocardiographic imagingsystem.
• The dataset was segmented by two specialists in an independent way. five times,ten manual segmentations per image.Total 200 manual segmentations.
• intraobserver : each specialist for each image.
• Interobserver : different specialists.
Result

• Two distance to compute the comparison between two contours
• dice similarity coefficient (DSC)
• mean absolute distance(MAD)• the distance between two given curves
Result
Result
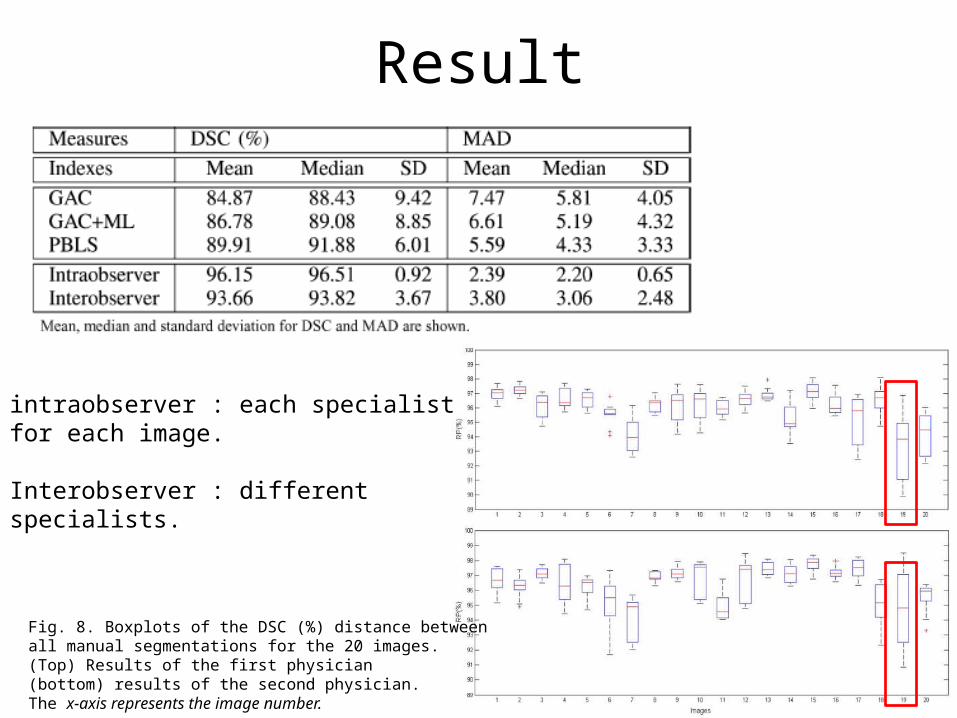
Fig. 8. Boxplots of the DSC (%) distance between all manual segmentations for the 20 images. (Top) Results of the first physician (bottom) results of the second physician. The x-axis represents the image number.
intraobserver : each specialist for each image.
Interobserver : different specialists.
Result
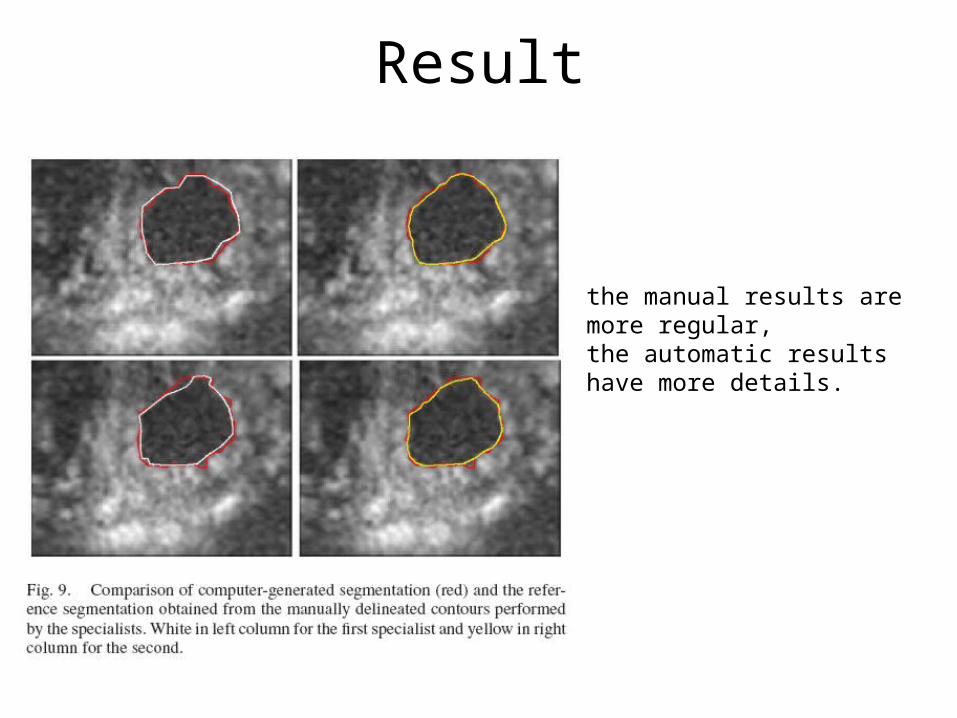
the manual results are more regular,the automatic results have more details.
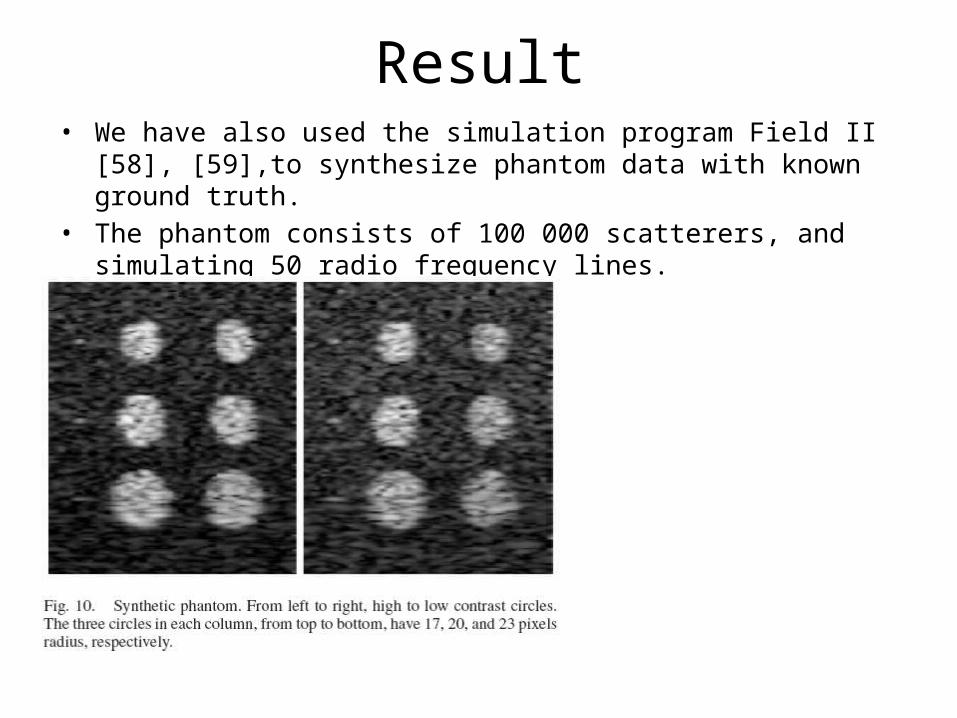
• We have also used the simulation program Field II [58], [59],to synthesize phantom data with known ground truth.
• The phantom consists of 100 000 scatterers, and simulating 50 radio frequency lines.
Result

Result
Boxplot of the DSC (%) measure (left) and MAD distance (right) of the semiautomatic segmentation: PBLS, GAC + ML, and GAC
Comparison of the PBLS (yellow) with the GAC(red, left) and the GAC + ML (red, right line).
The results of the proposed PBLS and GAC +ML methods are better than those of GAC.
large variance of the GAC + ML method
Conclusion
• We have presented in this paper a new approach for the segmentation of the left ventricle in ultrasound images.
• In a level set framework, we integrate the use of a novel speed term based on local phase information and local orientation; both estimated using the monogenic signal.
• A key advantage of this approach is that it is more robust to intensity inhomogeneities.