Pharmacy Benefit Managers (PBMs): Generating Savings for ... · PBMs: Generating Savings for Plan...
22
Pharmacy Benefit Managers (PBMs): Generating Savings for Plan Sponsors and Consumers Prepared for February 2016
Transcript of Pharmacy Benefit Managers (PBMs): Generating Savings for ... · PBMs: Generating Savings for Plan...
Pharmacy Benefit Managers (PBMs):
Generating Savings for Plan Sponsors and Consumers
Prepared for
February 2016

PBMs: Generating Savings for Plan Sponsors and Consumers January 2016
2
Table of Contents
I. Executive Summary .............................................................................................. 3
II. Discussion ............................................................................................................. 4
PBM Tools Focus on Six Key Savings Categories ................................................................... 4
Plan-Sponsor Decisions Determine PBM Savings .................................................................... 4
PBM Savings from Current Use of PBM Tools ........................................................................ 5
Potential Additional Savings with Greater Use of PBM Tools ................................................. 5
Factors Limiting the Use of PBM Tools .................................................................................... 5
Potential Costs if the Use of PBM Tools Is Restricted .............................................................. 8
How PBMs Generate Savings on Specialty Medications .......................................................... 8
PBM Savings Help Employers Preserve and Create Jobs ......................................................... 9
III. Conclusion .......................................................................................................... 9
IV. Methodology .....................................................................................................10
Deriving Baseline Drug Expenditures Managed by PBMs ..................................................... 10
Developing a Model of PBM Savings ..................................................................................... 12
Evidence and Estimates ........................................................................................................... 12
Manufacturer Price Concessions and Pharmacy Discounts ............................................... 12
PBM Impact on the Use of Generics and Preferred Brands .............................................. 14
Utilization Management and Adherence Programs ........................................................... 17
Administrative Efficiencies ............................................................................................... 20
Projecting Limited/Average/Best-Practice PBM Savings .................................................. 20
Estimating the Cost of Jobs Covered by PBM Savings ...................................................... 22

PBMs: Generating Savings for Plan Sponsors and Consumers January 2016
3
I. Executive Summary
Pharmacy Benefit Managers (PBMs) now implement prescription drug benefits for some 266 million
Americans who have health insurance from a variety of sponsors: commercial health plans, self-
insured employer plans, union plans, Medicare Part D plans, the Federal Employees Health Benefits
Program, state government employee plans, managed Medicaid plans, and others. Working under
contract to these plan sponsors, PBMs use advanced tools to manage drug benefit programs that give
consumers more efficient and affordable access to medications. Visante was commissioned by the
Pharmaceutical Care Management Association (PCMA) to estimate the savings that these PBM tools
generate for plan sponsors and consumers.
Major Findings:
How PBM Tools Produce Savings: PBM tools focus on six primary areas to produce savings:
o Negotiating rebates from drug manufacturers
o Negotiating discounts from drugstores
o Offering more affordable pharmacy channels
o Encouraging use of generics and affordable brands
o Reducing waste and improving adherence
o Managing high-cost specialty medications
Range of Savings from PBM Tools: Based on many factors, plan sponsors decide how
extensively PBM tools will be used to manage drug benefits for their enrollees. If plan sponsors
elect to have PBMs use their full range of tools, they can save up to 30% on drug benefit costs
compared to sponsors that opt for a limited range of tools. Across the entire marketplace, the
decisions of plan sponsors result in PBM tools producing savings that average 10-20% relative to
plans with limited management.
PBM Savings: From 2016 to 2025, the current use of PBM tools in the marketplace will save plan
sponsors and consumers approximately $654 billion.
o Commercial plan sponsors and their members will save nearly $350 billion;
o Medicare Part D and its beneficiaries, nearly $257 billion; and
o Managed Medicaid plans, nearly $48 billion (use of PBM tools in Fee-For-Service [FFS]
Medicaid is currently “limited,” or about 10% less than what could be achieved with the
average use of PBM tools seen in other sectors).
PBM Savings and Jobs: Annual savings currently generated by PBMs for the commercial sector
will cover the cost of more than 670,000 jobs in 2016. By adopting high use of PBM tools,
commercial plan sponsors could cover the cost of more than 190,000 additional jobs next year. If
PBM tools are limited, then lost savings to the commercial sector could equal the cost of more than
190,000 jobs. Put another way, each 1% decrease in prescription drug expenditures covers the cost
of more than 19,000 jobs nationwide.

PBMs: Generating Savings for Plan Sponsors and Consumers January 2016
4
II. Discussion
PBM Tools Focus on Six Key Savings Categories
Over the past 25 years, the share of the health care dollar spent on pharmaceuticals has nearly doubled,
from roughly 5% to 10%. New medications and broader insurance coverage have increased outpatient
prescription drug expenditures—now totaling more than $340 billion annually in 2016—and have
increased the need for pharmacy benefits management. PBMs have a difficult mission: to increase
prescription drug access while reducing cost growth.
PBM tools focus on six primary categories that reduce costs:
1. Negotiating Rebates from Drug Manufacturers: PBMs negotiate rebates from manufacturers
of brand-name drugs that compete with therapeutically similar brands and generics.
Manufacturers typically provide a rebate if their product is “preferred,” which means it is
assigned a copay lower than that of competing products.
2. Negotiating Discounts from Drugstores: Retail pharmacies provide discounts to be included
in a plan’s pharmacy network. The more selective the network, the greater the discount,
because each pharmacy will gain business.
3. Offering More Affordable Pharmacy Channels: Mail-service and specialty pharmacy
channels typically give plan sponsors deeper discounts than do retail pharmacies. These
channels also help encourage the use of preferred products for additional savings.
4. Encouraging Use of Generics and Affordable Brands: PBMs use several tools to encourage
the use of generic drugs and preferred brands. These include formularies and tiered cost
sharing, prior authorization and step-therapy protocols, generic incentives, consumer education,
and physician outreach. As PBMs and plan sponsors strive for greater savings, drug mix
becomes even more important.
5. Reducing Waste and Improving Adherence: PBMs use Drug Utilization Review to reduce
waste, such as polypharmacy, and implement patient adherence programs to help patients stick
to their prescription regimens. Both programs improve clinical outcomes and influence
prescription volume and expenditures.
6. Managing High-Cost Specialty Medications: PBMs combine savings from all the above
categories with the unique capabilities of specialty pharmacies in safely storing, handling, and
delivering complex, often injectable, medications that cost thousands per dose and in providing
effective patient education, monitoring, and support for patients with complex conditions, such
as hepatitis C, multiple sclerosis, and cancer.
Plan-Sponsor Decisions Determine PBM Savings
More than 266 million Americans now have prescription benefits within three primary health
insurance markets served by PBMs: private/commercial insurance, Medicare Part D, and Managed
Medicaid. All 266 million covered lives are in plans that use PBMs and PBM tools to manage costs.
Another 15 million covered lives are under state FFS Medicaid programs, where use of PBM tools is
limited.

PBMs: Generating Savings for Plan Sponsors and Consumers January 2016
5
Plan sponsors guide how actively pharmacy benefits are managed. They also determine formulary
coverage, copayment tiers, utilization management, and pharmacy channel options. In making these
choices, plan sponsors weigh many factors, including clinical quality, cost, and member satisfaction.
For example, while nearly 80% of employer-sponsored plans used three, four, or more copay tiers in
2014, 5% opted to manage prescription drug costs less actively and applied the same copay (an
average of $15) for every medication.1 These 5% would be examples of plan sponsors who choose to
limit their use of PBM tools.
Plan sponsors typically wish to balance controlling costs against minimizing change for their members,
all while ensuring access to needed care. As sophisticated purchasers, most plan sponsors use a
competitive bidding process to specify their requirements and contract with the PBM that can best
meet their needs. Independent panels of experts known as Pharmacy and Therapeutics Committees
ensure that the use of PBM tools is clinically appropriate.
Plan-sponsor choices in using PBM tools can produce additional savings up to 30% greater than
expenditures for plans with limited use of PBM tools.
Figure 1: How Plan Decisions Determine PBM Savings
Note: Savings relative to unmanaged expenditures.
Source: Visante, 2016.
1 Kaiser Family Foundation, “HRET Employer Health Benefits Survey,” 2014.
PBM
Savings
Average Use of PBM Tools: 10-20% More Savings
Low/Restricted Use of PBM Tools
Low/Restricted Use of PBM Tools:
► Open formulary
► Few copay tiers ► Little utilization management ► Minimal use of mail-service pharmacy
► Open pharmacy network
► Little use of specialty pharmacies
High Use of PBM Tools:
► More selective formulary
► Four or more tiers ► Pre-approvals and step therapy
► Strong incentives to use mail service
► Preferred pharmacy options and high performance networks
► High use of specialty pharmacies
High Use of PBM Tools: 20-30% More Savings

PBMs: Generating Savings for Plan Sponsors and Consumers January 2016
6
PBM Savings from Current Use of PBM Tools
From 2016 to 2025, the current use of PBM tools in the marketplace will save plan sponsors and
consumers nearly $654 billion.
o Commercial plan sponsors and their members will save $349.6 billion;
o Medicare Part D and its beneficiaries, $256.6 billion2; and
o Managed Medicaid plans, $47.6 billion (use of PBM tools in FFS Medicaid is currently
“limited,” or about 10% less that what could be achieved with the average use of PBM tools
seen in other sectors).
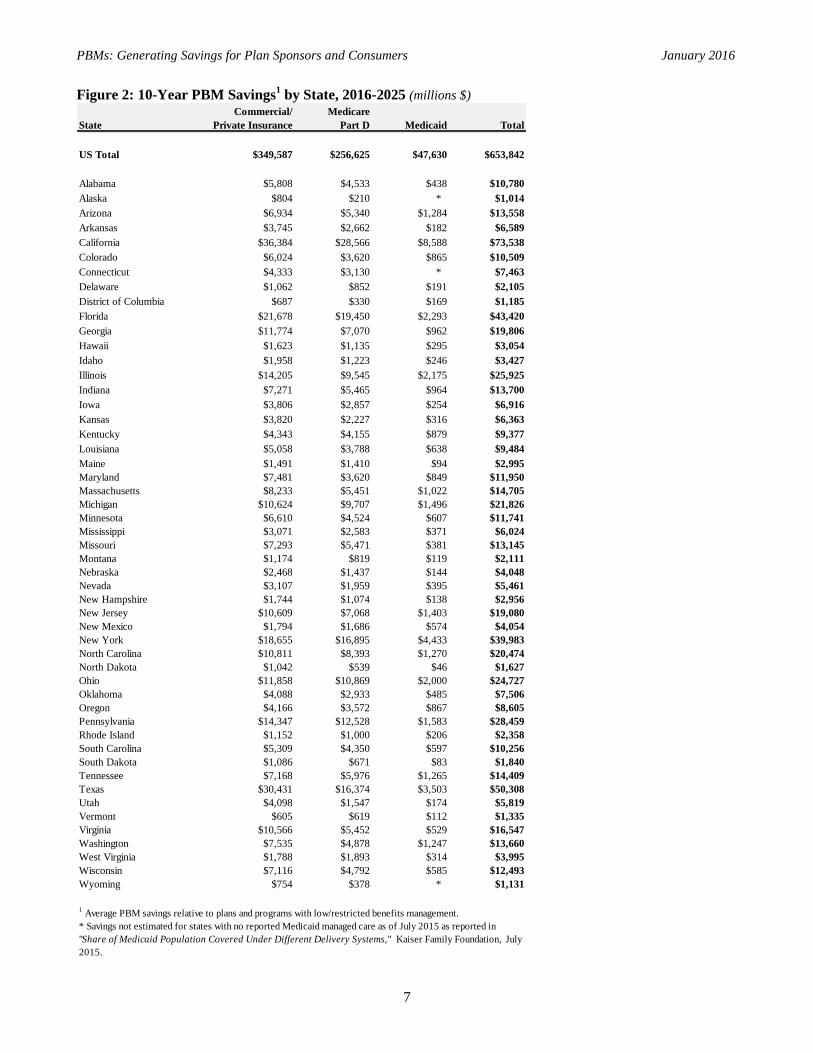
A state-by-state breakdown of PBM savings from current use of PBM tools is provided in Figure 2.
Potential Additional Savings with Greater Use of PBM Tools
If all plan sponsors adopted high use of PBM tools, then projected prescription drug expenditures
could save an additional $678 billion over the next decade.
o Commercial plan sponsors and their members could save $349.6 billion;
o Medicare Part D and its beneficiaries, $256.6 billion;
o Managed Medicaid, $47.6 billion; and
o State Medicaid FFS programs could save $24.7 billion, particularly by encouraging
generics, negotiating pharmacy discounts, and reducing waste.
Factors Limiting the Use of PBM Tools
In the commercial sector large employers, unions, state governments, and other plan sponsors have a
range of goals, budgets, and philosophies. PBM savings are limited by benefit design decisions made
by individual plans, as reflected in the wide range of PBM savings observed from plan to plan in the
commercial sector.
PBM savings in Medicare Part D are limited by the need for stand-alone prescription drug plans to
attract and retain enrollees and by governmental restrictions placed on the use of certain PBM tools.
Because Part D plans have similar goals and limits, PBM savings are fairly consistent across these
plans.
The use of PBM tools is generally low and often restricted in Medicaid FFS. This is particularly the
case in three areas: (1) little to no use of competitive pharmacy networks to negotiate market-based
dispensing fees and discounts; (2) limited use of differential copays to encourage the use of generics
and more affordable brands; and (3) lesser use of PBM tools that help prevent fraud, waste, and abuse.
Across all sectors, however, most plan sponsors do not typically place limits on PBM tools that have
already been integrated into a plan. Looking forward, then, the main factor that could limit the use of
PBM tools is restrictive government policy.
2 Throughout this report, please note that what are characterized as savings for the Part D program include not only savings on prescription drugs but also
savings on non-drug medical expenditures that would accrue to other parts of the Medicare program.
PBMs: Generating Savings for Plan Sponsors and Consumers January 2016
7
Figure 2: 10-Year PBM Savings1 by State, 2016-2025 (millions $)
State
Commercial/
Private Insurance
Medicare
Part D Medicaid Total
US Total $349,587 $256,625 $47,630 $653,842
Alabama $5,808 $4,533 $438 $10,780
Alaska $804 $210 * $1,014
Arizona $6,934 $5,340 $1,284 $13,558
Arkansas $3,745 $2,662 $182 $6,589
California $36,384 $28,566 $8,588 $73,538
Colorado $6,024 $3,620 $865 $10,509
Connecticut $4,333 $3,130 * $7,463
Delaware $1,062 $852 $191 $2,105
District of Columbia $687 $330 $169 $1,185
Florida $21,678 $19,450 $2,293 $43,420
Georgia $11,774 $7,070 $962 $19,806
Hawaii $1,623 $1,135 $295 $3,054
Idaho $1,958 $1,223 $246 $3,427
Illinois $14,205 $9,545 $2,175 $25,925
Indiana $7,271 $5,465 $964 $13,700
Iowa $3,806 $2,857 $254 $6,916
Kansas $3,820 $2,227 $316 $6,363
Kentucky $4,343 $4,155 $879 $9,377
Louisiana $5,058 $3,788 $638 $9,484
Maine $1,491 $1,410 $94 $2,995
Maryland $7,481 $3,620 $849 $11,950
Massachusetts $8,233 $5,451 $1,022 $14,705
Michigan $10,624 $9,707 $1,496 $21,826
Minnesota $6,610 $4,524 $607 $11,741
Mississippi $3,071 $2,583 $371 $6,024
Missouri $7,293 $5,471 $381 $13,145
Montana $1,174 $819 $119 $2,111
Nebraska $2,468 $1,437 $144 $4,048
Nevada $3,107 $1,959 $395 $5,461
New Hampshire $1,744 $1,074 $138 $2,956
New Jersey $10,609 $7,068 $1,403 $19,080
New Mexico $1,794 $1,686 $574 $4,054
New York $18,655 $16,895 $4,433 $39,983
North Carolina $10,811 $8,393 $1,270 $20,474
North Dakota $1,042 $539 $46 $1,627
Ohio $11,858 $10,869 $2,000 $24,727
Oklahoma $4,088 $2,933 $485 $7,506
Oregon $4,166 $3,572 $867 $8,605
Pennsylvania $14,347 $12,528 $1,583 $28,459
Rhode Island $1,152 $1,000 $206 $2,358
South Carolina $5,309 $4,350 $597 $10,256
South Dakota $1,086 $671 $83 $1,840
Tennessee $7,168 $5,976 $1,265 $14,409
Texas $30,431 $16,374 $3,503 $50,308
Utah $4,098 $1,547 $174 $5,819
Vermont $605 $619 $112 $1,335
Virginia $10,566 $5,452 $529 $16,547
Washington $7,535 $4,878 $1,247 $13,660
West Virginia $1,788 $1,893 $314 $3,995
Wisconsin $7,116 $4,792 $585 $12,493
Wyoming $754 $378 * $1,131
1 Average PBM savings relative to plans and programs with low/restricted benefits management.
* Savings not estimated for states with no reported Medicaid managed care as of July 2015 as reported in
"Share of Medicaid Population Covered Under Different Delivery Systems," Kaiser Family Foundation, July
2015.
PBMs: Generating Savings for Plan Sponsors and Consumers January 2016
8
If enacted, state and federal proposals that mandate coverage of brand-name drugs, increase pharmacy
reimbursement levels, limit the use of mail-service pharmacies, and force the disclosure of proprietary
contract information could all serve to increase costs.
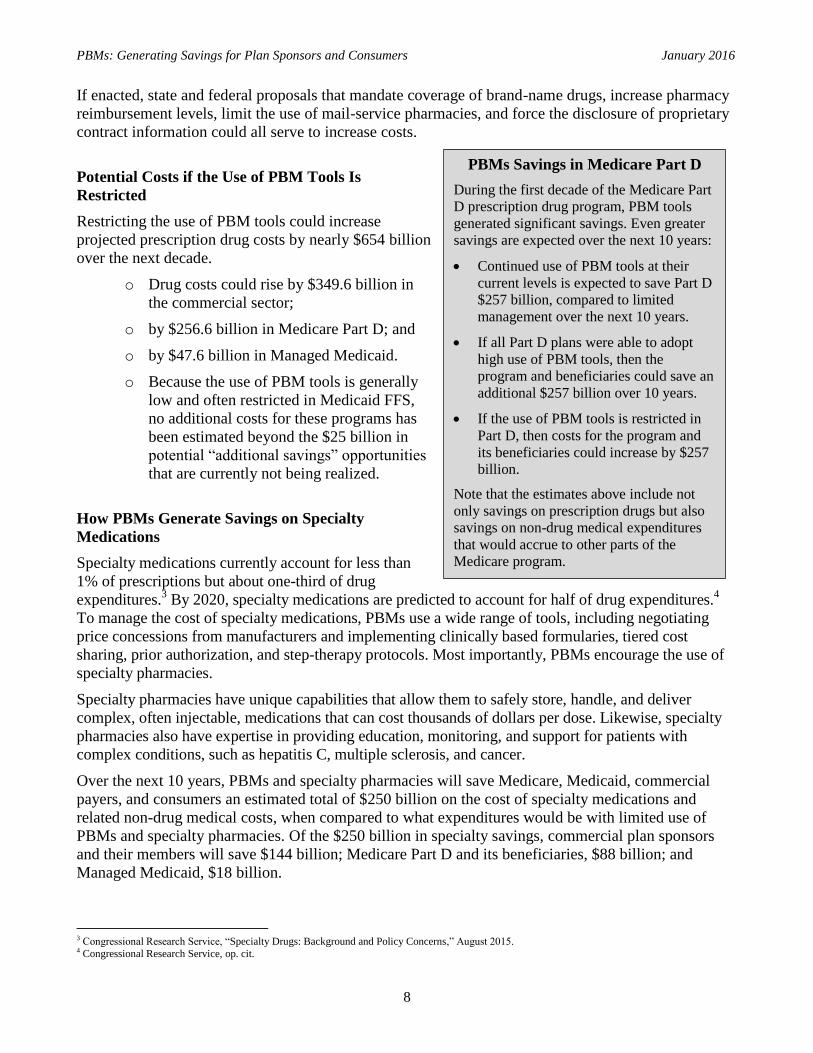
Potential Costs if the Use of PBM Tools Is
Restricted
Restricting the use of PBM tools could increase
projected prescription drug costs by nearly $654 billion
over the next decade.
o Drug costs could rise by $349.6 billion in
the commercial sector;
o by $256.6 billion in Medicare Part D; and
o by $47.6 billion in Managed Medicaid.
o Because the use of PBM tools is generally
low and often restricted in Medicaid FFS,
no additional costs for these programs has
been estimated beyond the $25 billion in
potential “additional savings” opportunities
that are currently not being realized.
How PBMs Generate Savings on Specialty
Medications
Specialty medications currently account for less than
1% of prescriptions but about one-third of drug
expenditures.3 By 2020, specialty medications are predicted to account for half of drug expenditures.
4
To manage the cost of specialty medications, PBMs use a wide range of tools, including negotiating
price concessions from manufacturers and implementing clinically based formularies, tiered cost
sharing, prior authorization, and step-therapy protocols. Most importantly, PBMs encourage the use of
specialty pharmacies.
Specialty pharmacies have unique capabilities that allow them to safely store, handle, and deliver
complex, often injectable, medications that can cost thousands of dollars per dose. Likewise, specialty
pharmacies also have expertise in providing education, monitoring, and support for patients with
complex conditions, such as hepatitis C, multiple sclerosis, and cancer.
Over the next 10 years, PBMs and specialty pharmacies will save Medicare, Medicaid, commercial
payers, and consumers an estimated total of $250 billion on the cost of specialty medications and
related non-drug medical costs, when compared to what expenditures would be with limited use of
PBMs and specialty pharmacies. Of the $250 billion in specialty savings, commercial plan sponsors
and their members will save $144 billion; Medicare Part D and its beneficiaries, $88 billion; and
Managed Medicaid, $18 billion.
3 Congressional Research Service, “Specialty Drugs: Background and Policy Concerns,” August 2015. 4 Congressional Research Service, op. cit.
PBMs Savings in Medicare Part D
During the first decade of the Medicare Part
D prescription drug program, PBM tools
generated significant savings. Even greater
savings are expected over the next 10 years:
Continued use of PBM tools at their
current levels is expected to save Part D
$257 billion, compared to limited
management over the next 10 years.
If all Part D plans were able to adopt
high use of PBM tools, then the
program and beneficiaries could save an
additional $257 billion over 10 years.
If the use of PBM tools is restricted in
Part D, then costs for the program and
its beneficiaries could increase by $257
billion.
Note that the estimates above include not
only savings on prescription drugs but also
savings on non-drug medical expenditures
that would accrue to other parts of the
Medicare program.

PBMs: Generating Savings for Plan Sponsors and Consumers January 2016
9
PBM Savings Help Employers Preserve and Create Jobs
Employers bear a large portion of health costs in the United States, and studies suggest that rising costs
can lead to a decline in employment.5,6
The savings generated by PBMs provide employers with funds
to preserve and create jobs. Based on data produced by the Bureau of Labor Statistics (BLS), Visante
projects the total compensation costs for a full-time equivalent private industry worker at $68,177 in
2016.7 In economic terms, this represents the approximate opportunity cost of a job. With employer-
sponsored private-insurance drug expenditures of $131 billion in 2016,8,9
a 1% increase in that figure
equals the opportunity cost of more than 19,000 jobs in the “commercial” sector, defined to include
both private-sector workers and government employees receiving health benefits through private
insurance. We discuss our calculations in more detail in the methodology.
III. Conclusion
PBM tools provide substantial savings to plan sponsors and consumers. Plan sponsors balance
controlling costs against minimizing change for their members, all while ensuring access to needed
care. Savings can range from 20% to 30%, from limited use to high use of PBM tools. At
current/average use, PBM tools will save $654 billion compared to low or restricted use over the next
decade. In addition to these expected savings, an additional $679 billion could be saved if all plan
sponsors adopted high use of PBM tools. Likewise, $654 billion could be lost if PBM tools are limited
by government policies or other factors. Much is at stake, as PBM savings can help employers to
preserve tens of thousands of jobs over the next 10 years.
5 Baicker, K., et al., “The Labor Market Effects of Rising Health Insurance Premiums,” Journal of Labor Economics 24(3):609-634, July 2006. 6 Cutler, D., et al., “Labor Market Responses to Rising Health Insurance Costs: Evidence on Hours Worked,” The Rand Journal of Economics 29(3), 1998. 7 Bureau of Labor Statistics, “Employer Costs for Employee Compensation,” December 2014. 8 Centers for Medicare and Medicaid Services, National Health Expenditure Data, projected 2014-2024. 9 “Health Insurance Coverage of the Total Population,” Kaiser Family Foundation.

PBMs: Generating Savings for Plan Sponsors and Consumers January 2016
10
IV. Methodology
Visante’s model for projected PBM savings draws on data from the Centers for Medicare and
Medicaid Services (CMS), Government Accountability Office (GAO), Federal Trade Commission
(FTC), Congressional Budget Office (CBO), PBM financial filings with the Securities and Exchange
Commission, PBM drug trend reports, structured interviews with PBM industry experts, peer-reviewed
studies, and commercial third-party drug claims data.
Deriving Baseline Drug Expenditures Managed by PBMs
To derive baseline drug expenditures managed using PBM tools, Visante began with CMS National
Health Expenditure (NHE) projections for outpatient prescription drug expenditures from 2014 to
2024. By these estimates, spending on outpatient prescription drugs will grow from $343 billion in
2016 to $600 billion in 2025, for a total of $4.6 trillion over the 10-year period.10,11
The projections
reflect CMS assumptions concerning the impact of health reform, manufacturer price inflation, patent
expirations, new drug introductions, follow-on biologics, and other factors. According to CMS, growth
in prescription drug spending is projected to average about 6% for the 10-year period. Our model
incorporates these assumptions to the extent that they are incorporated into the NHE projections. Note
that CMS estimates that prescription drug spending rose sharply to 12.6% in 2014, partly as a result of
expensive new treatments for hepatitis C. CMS expects that PBMs will manage these costs, saying,
“Prescription drug spending growth is projected to decelerate, as lower costs associated with expensive
specialty treatments for hepatitis C are negotiated between payers and the drug industry.” For Part D,
the CMS actuaries note, “Medicare spending growth for prescription drugs is expected to slow from
17.3% in 2014 to 9.0% in 2015, in part because of increased rebates from pharmaceutical companies
for recently available hepatitis C treatments.”
CMS outpatient drug expenditure projections reflect net costs to payers, including plan sponsors and
consumers. Manufacturer and pharmacy discounts are reflected in CMS figures. Outpatient
prescription drug expenditures account for about 75% of the nation’s drug bill, and nearly all PBM
management activities focus on outpatient prescription drugs.
CMS segments outpatient prescription drug expenditures by payer, including private insurance,
Medicare, Medicaid, and other government programs. Visante assumes that nearly all private-insurer
expenditures and nearly all Medicare Part D expenditures are associated with the use of PBM tools.
Medicaid is slightly more complicated. Prescription drugs for Medicare/Medicaid dual eligibles are
paid under Medicare, but other Medicaid drug expenditures are split between Managed Medicaid and
FFS Medicaid.12
Prescription expenditures in the Veterans Administration, Indian Health Service, and
Department of Defense (DOD)/TriCare direct services also were excluded. Children’s Health
Insurance Program (CHIP) expenditures were included with Medicaid,13
and DoD/TriCare “purchased
services” expenditures on prescriptions outside military treatment facilities were included under
private/commercial.14
10 Centers for Medicare and Medicaid Services, National Health Expenditure Data, projected 2014-2024. 11 The National Health Accounts do not include projections for 2025. These values were projected assuming the 2021-2024 growth rate held for 2025. 12 Kaiser Family Foundation, “Total Medicaid and CHIP Enrollment”; “Dual Eligibles as a Percent of Total Medicare Beneficiaries”; “Total Medicaid
MCO Enrollment,” September 2014. 13 Centers for Medicare and Medicaid Services, “Net Reported Medicaid and CHIP Expenditures.” 14 TriCare drug spend under “purchased services” is estimated at $3.1 billion for 2014, according to “The Evaluation of the TRICARE Program: Access,
Cost, and Quality, Fiscal Year 2015 Report to Congress,” Defense Health Agency, Department of Defense, February 2015.

PBMs: Generating Savings for Plan Sponsors and Consumers January 2016
11
Visante next estimated the share of consumer out-of-pocket expenditures arising from copayments/cost
sharing for prescriptions associated with PBMs and PBM tools. First, we projected the average cost
sharing per prescription based on survey data for commercial plan sponsors15,16
and for Medicare Part
D plans as reported by CBO.17
We then multiplied average cost sharing by the estimated number of
prescriptions each year under both private/commercial insurance and Medicare Part D.
Visante estimated the prescriptions associated with PBM tools based on data published by a variety of
sources. In 2014, 5.5 billion prescriptions (adjusted to “30-day equivalents”)18
were filled at chain
pharmacies, independent pharmacies, food stores, pharmacies servicing nursing homes, mail-service
pharmacies, and specialty pharmacies.19
After these calculations, we estimate that 2016 outpatient prescription drug expenditures associated
with some use of PBM tools, including plan sponsor and consumer payments, will be approximately
$180 billion for the commercial market, $118 billion for Medicare Part D, $24 billion for Managed
Medicaid, and $7 billion for FFS Medicaid. Over the 2016-2025 period, these figures are $2.3 trillion
for the commercial sector, $1.7 trillion for Medicare Part D, $314 billion for Managed Medicaid, and
$94 billion for FFS Medicaid. Note that more PBMs are playing a management role in physician-
administered drugs covered by medical benefits (including Medicare Part B) and that our baseline
expenditures or savings estimates do not reflect such activity.
As discussed, CMS’s 10-year projections reflect many assumptions regarding marketplace trends. We
believe that CMS estimates reasonably capture these trends and reflect the current savings that PBMs
achieve in the marketplace. CMS does not publish the detailed factors underlying its model, so we
estimated the factor inputs necessary to model PBM savings and then applied them to baseline
expenditures derived from CMS data.
We assume that over the 10-year projection period:
The trend for traditional prescription drugs will average annual growth of less than 3%, while
the trend for specialty drugs will average double-digit annual growth.20
The generic dispensing rate (GDR) was 82% in 201421
and will continue to grow slowly
throughout the next 10 years.22
Specialty medications will be the dominant force driving growth in prescription drug
expenditures during the next 10 years. One report estimates total specialty drug spend at $127
billion in 2014, growing to $235 billion in 2018, with half paid under the pharmacy benefit and
half paid under the medical benefit.23
Another estimates total specialty drug spend of $124
15 Kaiser Family Foundation and Health Research & Educational Trust, “Employer Health Benefits Survey, 2014 Annual Survey.” 16 Pharmacy Benefit Management Institute, “Prescription Drug Benefit Cost and Plan Design Report, 2014-2015.” 17 Congressional Budget Office, “Effects of Using Generic Drugs on Medicare’s Prescription Drug Spending,” September 2010. 18 In other words, prescriptions for a 90-day supply have been adjusted to estimate three 30-day prescriptions. 19 “Medicines Use and Spending Shifts: A Review of the Use of Medicines in the U.S. in 2014,” Report by the IMS Institute for Healthcare Informatics,
April 2015. 20 Drug Trend Reports from Express Scripts, CVS Health, Prime Therapeutics, and Catamaran. 21 IMS reports GDR of 82% for 2014 counting only unbranded generics, but 88% if including branded generics. Since the average cost for unbranded
generics was $18 per adjusted prescription vs. $171 for branded generics, we believe the “unbranded GDR calculation” is a more useful metric for
estimating cost savings. Therefore, we use the “unbranded GDR calculation” in this report. 22 IMS Health and PBM Drug Trend Reports. 23 “2014-15 Economic Report on Retail, Mail, and Specialty Pharmacies,” Pembroke Consulting, released January 2015.

PBMs: Generating Savings for Plan Sponsors and Consumers January 2016
12
billion in 2014.24
Most project that the specialty pharmacy market will grow much more rapidly
than will the market for traditional prescription drugs, at a projected annual rate of 10% to
20%.25
We estimate the total specialty market growing from $192 billion in 2016 to $569
billion in 2025, with 50% of the specialty market covered under the pharmacy benefit (and
included in this analysis). The 50% covered under the medical benefit is not included.
Again, we assume that these trends are captured in the CMS projections.
Developing a Model of PBM Savings
Using the 10-year projections described above, we developed an economic model to determine ranges
of PBM savings relative to drug expenditures that might be seen in a completely unmanaged
environment, such as an uninsured population. We did this by adjusting key variables to reflect
potential changes in the level of PBM management. These ranges let us estimate the average savings
that PBMs generate—as well as both limited and best-practice savings estimates, depending on the
approach of different plan sponsors. For our savings model, we assume that the NHE projections
reflect the “average” level of PBM savings for commercial, Medicare Part D, and Managed Medicaid
markets, and a “limited” level of PBM savings for FFS Medicaid (based on a recent study showing net
prescription costs 11% higher in states with FFS Medicaid vs. Managed Medicaid).26
Our economic model is based on a review of the evidence associated with broad savings categories.
These include manufacturer price concessions and pharmacy discounts, use of generics and preferred
brands, and utilization management and adherence programs.
Evidence and Estimates of Manufacturer Price Concessions and Pharmacy Discounts
The broad category of price concessions and pharmacy discounts comprises pharmacy network
discounts, mail-service pharmacy discounts, specialty pharmacy discounts, and manufacturer rebates.
Pharmacy Network Discounts: Historically, GAO has reported that the average price PBMs
negotiated for retail-pharmacy drugs was about 18% below the average retail-pharmacy cash
price for brand-name drugs and 47% below for generic drugs.27
Moreover, in 2005 the FTC
reported that customers without insurance paid 15% more for brand-name drugs than did
customers with insurance.28
Average Wholesale Price (AWP) discounts for brand-name drugs
were approximately 15% from 2002 to 2004, so the AWP discount correlates well with savings
below unmanaged cash prices. Meanwhile, average AWP discounts in pharmacy network
contracts have increased from 16% to 18% for brands and from 61% to 64% for generics.29
But
for generic drugs, the so-called $4 generic discount programs many pharmacies have
introduced during the past several years have substantially narrowed the gap between retail
cash prices and the network discount prices that PBMs have negotiated. New types of
“preferred networks” have also become common during the past few years. In Medicare Part D,
81% of seniors enrolled in prescription drug plans with preferred cost-sharing pharmacy
24 IMS Health, op. cit. 25 Drug Trend Reports from Express Scripts, CVS Health, Prime Therapeutics, and Catamaran. 26 The Menges Group, “Comparison of Medicaid Pharmacy Costs and Usage in Carve-In Versus Carve-Out States,” April 2015. 27 Government Accountability Office, “Federal Employees’ Health Benefits: Effects of Using Pharmacy Benefit Managers on Health Plans, Enrollees, and
Pharmacies,” January 2003. 28 Federal Trade Commission, “Pharmacy Benefit Managers: Ownership of Mail-Order Pharmacies,” 2005. 29 Pharmacy Benefit Management Institute, “Prescription Drug Benefit Cost and Plan Design Report, 2014-2015.”

PBMs: Generating Savings for Plan Sponsors and Consumers January 2016
13
networks in early 2015.30
The majority of commercial employer-sponsored plans also now
offer a preferred network.31
According to a recent analysis from CMS, preferred pharmacies
had average weighted unit costs that were about 6% less expensive than other network
pharmacies. The four biggest plans, accounting for 93% of claims, had average unit cost
savings of 8% at preferred pharmacies.32,33
Mail-Service Pharmacy Discounts: Mail-service pharmacies offer significant discounts over
retail pharmacies. According to GAO, “With deeper discounts and no dispensing fees, mail-
order/home-delivery prices are 27% and 53% below the average cash price customers would
pay at a retail pharmacy for brand-name and generic drugs, respectively.”34
A survey of PBM
clients finds mail-service discounts of 21% off AWP for brand-name drugs (3-5 points better
than retail) and 64% for generics (1-3 points better than retail).35
Another survey of managed
care organizations reported mail-service discounts 6 points better than retail networks.36
What’s
more, 55% of surveyed PBM clients pay no dispensing fees,37
which adds close to 1 percentage
point of savings for brands and 4 points for generics. However, mail-service penetration is also
a crucial variable in predicting mail-service savings. While Visante estimates that 10-15% of
“adjusted prescriptions” are filled via mail (adjusted so that one 90-day prescription is
normalized to three 30-day prescriptions), PBM drug trend reports indicate that plan sponsors
can achieve mail-service penetration of 30% or more.38,39
Approximately 25% of employers
report using mandatory mail for some or all drugs.40
Manufacturer Discounts and Rebates: PBMs negotiate price concessions with
pharmaceutical manufacturers on selected brand-name drugs. A CBO analysis published in
2010 notes that rebates for Medicare Part D are approximately 14%;41
the investment research
firm Sector & Sovereign Research estimates that in 2009, rebates for private plan sponsors
averaged 14.3% of brand prescription costs.42
Because brand costs account for almost 75% of
the total, this translates to an overall discount on total drug spend of more than 10%. An Office
of Inspector General (OIG) report published in March 2011 supports this estimate, with rebates
of approximately 10% of total gross Part D drug costs.43
The OIG estimated Medicare Part D
rebates for just the top 100 brands at 19%.44
The most recent employer survey suggests a
median rebate of $14 per brand prescription (retail-30), which we estimate to be approximately
9% of the average traditional (non-specialty) brand prescription cost.45
This figure represents a
“blended average.” Some brand drugs may have rebates of 40-50%, while other brand drugs
may have no rebates at all.
30 “In 2015, 8 of 10 Seniors Choose Preferred Pharmacy Networks in Medicare,” Drug Channels, Jan. 22, 2015. 31 Pharmacy Benefit Management Institute, “Prescription Drug Benefit Cost and Plan Design Report, 2014-2015.” 32 “CMS Part D Claims Analysis: Negotiated Pricing between Preferred and Non-Preferred Pharmacy Networks,” April 30, 2013. 33 “New CMS Study: Preferred Pharmacy Networks Are Cheaper,” Drug Channels, July 11, 2013. 34 Government Accountability Office, op. cit. 35 Pharmacy Benefit Management Institute, op. cit. 36“Pharmacy Benefit Report: 2010/2011 Facts, Figures, & Forecasts,” 2011. 18th Ed. Novartis Pharmaceuticals Corporation. 37 Pharmacy Benefit Management Institute, op. cit. 38 CVS Caremark, op. cit. 39 “Driving Mail Service Usage Reduces Pharmacy Costs,” OptumRx, 2013. 40 Pharmacy Benefit Management Institute, op. cit. 41 Congressional Budget Office, op. cit. 42 “Drug Prices Rise Despite Calls for Cuts,” The Wall Street Journal, March 17, 2011. 43 Department of Health and Human Services, Office of Inspector General, “Concerns with Rebates in the Medicare Part D Program,” March 2011. 44 Department of Health and Human Services, Office of Inspector General, “Higher Rebates for Brand-Name Drugs Result in Lower Costs for Medicaid
Compared to Medicare Part D,” August 2011. 45 Pharmacy Benefit Management Institute, op. cit.

PBMs: Generating Savings for Plan Sponsors and Consumers January 2016
14
Specialty Pharmacy: Specialty pharmacy networks have been reported to save 13-18%.46
Manufacturer competition is also becoming more important in specialty. For example, in late
2014, AbbVie obtained FDA approval to compete against Gilead’s market-leading drugs for
hepatitis C. PBMs immediately took advantage of the opportunity to obtain discounts of
approximately 46%,47
creating savings estimated at $4 billion in the U.S. for 2015.48
Because the average PBM savings is included in the base economic model projections, the savings
compared with unmanaged drug expenditures are easily calculated. We simply remove all discounts
associated with pharmacy network contracts and mail-service pharmacies—and remove all
manufacturer rebates—to determine drug expenditures based on undiscounted prices.
We base assumptions for retail/mail/specialty discounts on survey data reported by the Pharmacy
Benefit Management Institute for limited, average, and best-practice in each channel.49
Mail-service
penetration is estimated at a minimum of 0% in plans with no mail-service benefit, 10-15% (measured
as normalized prescriptions) for average plans, and 30-40% for plans with high mail-service pharmacy
use. Rebates for average plans are estimated at 9% of expenditures on brand-name drugs.
Based on this evidence and methodology, Visante calculates the following savings from price
concessions and discounts:
Figure 3: Range of Possible PBM Savings through
Manufacturer Price Concessions and Pharmacy Discounts
Limited Average High
Estimated Savings vs.
Unmanaged/Uninsured 16% to 21% 21% to 26% 26% to 31%
Increased Savings vs.
Limited Use of PBM Tools -- 5% 10%
Source: Visante, 2015.
Evidence and Estimates of PBM Impact on the Use of Generics and Preferred Brands
PBMs implement a variety of tools and techniques to promote generics and more affordable brands.
These tools include formularies, tiered copays, prior authorization, step-therapy programs, generic
incentives, and consumer education. GAO reported that plan savings for these PBM intervention
techniques ranged from 1% to 9% of total spending on prescription drug benefits.50
According to IMS Health, 82% of all drug prescriptions in 2014 were filled with unbranded generics,
but unbranded generics alone accounted for almost 17% of drug expenditures.51
GDRs have increased
significantly during the past few years, due to patent expirations for blockbuster brands and PBM
strategies to maximize the new generics. Key data on how PBM tools can shift drug mix toward more
46 Baldini, C. and Culley E., “Estimated Cost Savings Associated with the Transfer of Office-Administered Specialty Pharmaceuticals to a Specialty
Pharmacy Provider in a Medical Injectable Drug Program,” Journal of Managed Care Pharmacy 17(1):51-59, 2011. 47 “What Gilead’s Big Hepatitis C Discounts Mean for Biosimilar Pricing,” Drug Channels, Feb. 5, 2015, http://www.drugchannels.net/2015/02/what-
gileads-big-hepatitis-c-discounts.html#more. 48 “Express Scripts’ Miller Says Hepatitis C Price War to Save Billions,” Reuters, Jan. 22, 2015. 49 Pharmacy Benefit Management Institute, op. cit. 50 Government Accountability Office, op. cit. 51 IMS Health, op. cit.

PBMs: Generating Savings for Plan Sponsors and Consumers January 2016
15
affordable products include the following:
Generic Substitution: Most plans now require generic substitution whenever possible. A
survey of health plans indicates that generic substitution rates (i.e., how often a generic product
is dispensed when available as a brand alternative) are more than 96% for commercial plans.52
PBM research has suggested that plans can save from 6% to 10% when requiring clinically
appropriate generic substitution.53
A peer-reviewed study showed that mandatory generic
substitution in a two-tier plan cut drug spending by 8%.54
Other data suggest that mail-service
pharmacies increase generic substitution. Within the first week of the introduction of generic
zolpidem, one mail-service pharmacy achieved a generic substitution rate of 97%, compared
with a 77% substitution rate over the same period at retail pharmacies.55
Formularies and Therapeutic Interchange: CBO examined potential substitution for seven
therapeutic classes identified by Medicare. It concluded that if generics rather than single-
source brand-name prescriptions had been used, prescription drug costs in 2007 would have
fallen by $4 billion—or 7% of total payments to plans and pharmacies that year.56
PBM
research suggests savings of 1-5% through therapeutic substitution.57
Step Therapy: These programs apply clinical guidelines to encourage the use of a preferred,
first-line drug before a more expensive, second-line drug. Step-therapy programs are widely
used, with 69% of employers reporting their use in 2013.58
One study examined step therapy
for three classes: proton pump inhibitors (for ulcers), selective serotonin reuptake inhibitors
(for depression), and nonsteroidal anti-inflammatory drugs (for pain). The plan sponsor
experienced a decrease in net cost after implementing step therapy, while the comparison group
had an increase. This translated to a savings of approximately 2.3% of total drug spend.
59
Another study evaluated step therapy for antihypertensive drugs and found that drug costs were
13% lower for the patients in the step-therapy intervention group.60
Copay Tiers: During the past 10 years, plan sponsors have dramatically increased the use of
tiered copay structures to encourage greater use of generics and preferred brands. The
implementation of tiered copays has created more aligned incentives for consumers. A study
published in 2012 found that benefit design has a strong impact on the use of generic drugs in
Medicare Part D plans (especially low copays for generic drugs), and estimated that a 10%
increase in generic statin use (in place of brand-name use) would result in $1 billion in
savings.61
One study examined the addition of a three-tier copay, with relatively modest copays
of $8/$15/$25. Payer costs dropped 17%, with 10% attributed to the absolute increase in
copayments and 7% to the utilization and lower cost of substituted drugs.62
Another study
indicated that changing from a single-tier or two-tier formulary to a three-tier formulary was
associated with a decrease in total drug spending of 5-15%, depending on the copay
52 “Pharmacy Benefit Report: 2010/2011 Facts, Figures, & Forecasts,” 2011. 18th Ed. Novartis Pharmaceuticals Corporation. 53 Kaiser Family Foundation, “Cost Containment Strategies for Prescription Drugs: Assessing the Evidence in the Literature,” March 2005. 54 Joyce, G., et al., “Employer Drug Benefit Plans and Spending on Prescription Drugs,” JAMA 288:1733-1739, 2002. 55 Medco Drug Trend Report 2008. 56 Congressional Budget Office, op. cit. 57 Kaiser Family Foundation, op. cit. 58 Pharmacy Benefit Management Institute, op. cit. 59 Motheral, B., et al., “Plan-Sponsor Savings and Member Experience with Point-of-Service Prescription Step Therapy,” AJMC, July 2004. 60 Yokoyama, et al., “Effects of a Step Therapy Program for Angiotensin Receptor Blockers on Antihypertensive Medication Utilization Patterns and Cost
of Drug Therapy,” J Manag Care Pharm 13(3):235-244, April 2007. 61 Hoadley,J., et al., “In Medicare Part D Plans, Low or Zero Copays and Other Features to Encourage the Use of Generic Statins Work, Could Save
Billions,” Health Affairs 3(10):2266-2275, October 2012. 62 Motheral, B., et al., “Effect of Three-Tier Prescription Copay on Pharmaceutical and Other Medical Utilization,” Medical Care 39(12):1293-1304,
December 2001.

PBMs: Generating Savings for Plan Sponsors and Consumers January 2016
16
structures.63
Other studies demonstrated that the introduction of a third tier for non-preferred
brand names induces a shift to lower-tiered drugs and strengthens plans’ ability to negotiate
price discounts.64,65
Consumer Education: PBMs deliver various educational materials to increase consumer
understanding of their pharmacy benefit. PBMs may include additional incentives in their
pharmacy network contracts to achieve improved formulary compliance and use of generic
alternatives. A PBM study estimated that consumer education can save up to 4% from generic
incentives and education.66
Specialty Pharmacy: While this segment has historically offered limited opportunities to
promote generics, managing specialty drug mix will become increasingly important. Specialty
drug categories in which formulary-preferred brands have most often been used include growth
hormone, multiple sclerosis, rheumatoid arthritis, blood modifiers, and hepatitis C. In one plan,
a specialty pharmacy increased the market share of the formulary-preferred human growth
hormone from 27% to 82% within 12 months, generating savings of 20% in this expensive
category.67
But as more biosimilars are approved during the next several years—with discounts
of up to 50% vs. their brand competitors—these savings will become increasingly significant
for specialty drug spend. A Rand study predicted that biosimilars will lead to a $44.2 billion
reduction in direct spending on biologic drugs from 2014 to 2024, or about 4% of total biologic
spending over the same period.68
In our model, we adjusted drug mix to reflect a higher or lower dispensing of cheaper alternative
drugs, primarily generics and preferred brands.
To calculate the additional cost associated with unmanaged drug mix, we reduced the GDR in the
current projections by 5 points (based on lower GDRs observed in plans with limited management).
We also assumed greater use of higher-cost brands in an unmanaged environment. The net result
indicates that drug mix delivers 10-15% of savings for the average PBM-managed plan vs. unmanaged
drug expenditures.
To model a best-practice high-savings scenario, we estimate that lower-cost drug alternatives could be
used in place of 25% of brand prescriptions in an average savings environment. Of these lower-cost
alternatives, approximately two-thirds could be generics and one-third formulary-preferred brands. A
high-performing plan could increase GDR by 4-5 percentage points, which correlates to best-practice
GDRs reported by PBMs.69
Similarly, limited management will reduce GDR by 4-5 percentage points.
Based on this evidence and methodology, Visante calculates the following savings from managing
drug mix to encourage the use of generics and preferred brands:
63 Landon,B., et al., “Incentive Formularies and Changes in Prescription Drug Spending,” Am J Manag Care 13(part 2):360-369, June 2007. 64 Joyce, et al., op. cit. 65 Huskamp, H. et al., “The Impact of a Three-Tier Formulary on Demand Response for Prescription Drugs,” Journal of Economics and Management
Strategy 14(3):729-753, July 2005. 66 Drug Trend Report 2003, Medco Health. 67 “Specialty Pharmacy: Historical Evolution and Current Market Needs,” presented at PCMA Specialty Pharmacy Symposium, May 5, 2008. 68 Mulcahy, A., et al., “The Cost Savings Potential of Biosimilar Drugs in the United States,” The Rand Corporation, 2014. 69 CVS Caremark, op. cit.

PBMs: Generating Savings for Plan Sponsors and Consumers January 2016
17
Figure 4: Range of Possible PBM Savings
Through the Use of Generics and Preferred Brands
Limited Average High
Estimated Savings vs
Unmanaged/Uninsured 7% to 11% 11% to 15% 15% to 19%
Increased Savings vs
Limited Use of PBM Tools -- 4% 8%
Source: Visante, 2015.
Evidence and Estimates of Utilization Management and Adherence Programs
PBMs provide tools that tend to reduce utilization by eliminating waste and polypharmacy. They also
use tools that may increase utilization through improved adherence to drug therapy for chronic disease.
Utilization Management: Drug utilization review (DUR) programs improve quality and safety
by preventing drug duplication, drug interactions, and polypharmacy. Such programs also
reduce dangerous over-utilization of prescription drugs. Numerous studies have documented
drug cost savings associated with DUR programs. One peer-reviewed study examined DUR
programs and found average savings of 6.9% on total drug spend.70
Other PBM tools that help
reduce excess utilization include:
Refill Too Soon: According to one survey, the most common plan-sponsor tool—used by
85%71
—is a “refill too soon supply edit.” Such an edit triggers if, say, a pharmacy
dispenses a 30-day supply of medication and the patient tries to refill it 10 days later.
Quantity Limits: Employers report using quantity limits 84% of the time for the top drug
categories.72
PBM research notes that plan exclusions, including specific drug limits and
general limitations, can save up to 1% of drug spend.73
Prior Authorization: Prior authorization ensures that a prescription drug meets clinical
guidelines before it is dispensed, and is used by 80% of employer plan sponsors.74
One
study looked at 22 states that implemented prior authorization programs for Cox-2
inhibitors, non-steroidal anti-inflammatory drugs (NSAIDs). With nearly 18 million
NSAID prescriptions covered by Medicaid in 2003, prior authorization reduced the annual
cost of these drugs by $185 million, lowering total drug spend by 0.6% in this drug
category alone.75
Patient Adherence: PBM tools for increasing clinical quality and patient health may boost the
numbers of prescriptions. This can occur in the PBM programs focused on ensuring that
patients adhere to prescribed drug therapies for such chronic diseases as diabetes, hypertension,
and heart failure. Numerous studies have demonstrated that improved patient adherence
70 Moore, W., et al., “Systemwide Effects of Medicaid Retrospective Drug Utilization Review Programs,” Journal of Health Politics, Policy and Law
25(4):653-688, August 2000. 71 Pharmacy Benefit Management Institute, op. cit. 72 Pharmacy Benefit Management Institute, op. cit. 73 2002 Drug Trend Report, Medco Health. 74 Pharmacy Benefit Management Institute, op. cit. 75 Fischer, M., et al., “Medicaid Prior-Authorization Programs and the Use of Cyclooxygenase-2 Inhibitors,” New England Journal of Medicine 351:2187-
2194, November 18, 2004.

PBMs: Generating Savings for Plan Sponsors and Consumers January 2016
18
delivers improved clinical outcomes and reduces non-drug medical costs.76,77
Research has
shown that 90-day supplies filled via mail service, with lower copays—combined with refill
reminders, auto-refills, patient education, and other adherence strategies—can improve
adherence by 5-10 percentage points.78,79,80,81
Adherence programs have historically focused on
mail-service pharmacy; however, some evidence suggests that adherence can also be improved
by using similar strategies at retail pharmacies,82
particularly with 90-day at-retail prescriptions
increasingly being incorporated into pharmacy benefit designs. In 2013, the fulfillment of a 90-
day supply of drugs from network retail pharmacies was offered by 61% of employer-plan
sponsors.83
Our savings model looks at total drug spend (i.e., both “payor spend” and “consumer spend”),
so shifting costs from payors to consumers would not be counted as “cost savings.” That said,
there is uncertainty about what the “optimal amount of consumer cost sharing” should be.
According to one literature review, 85% of studies that examined changes in patient cost
sharing revealed that increasing cost sharing had a negative effect on adherence.84
Cost-related
nonadherence has prompted some employers to reevaluate their cost-sharing policies. Some
plan sponsors have reduced or eliminated copayments for selected medications in accordance
with value-based insurance designs, and demonstrated improvements in adherence as a
result.85,86
The CBO estimates that for every 5 percentage point improvement increase in adherence
(measured by number of prescriptions), total medical costs are reduced by 1%.87
Based on
Visante’s analysis, in 2014, a 1% decrease in medical costs equaled $15 billion. Coincidentally,
in 2014, a 5% increase in prescription drug expenditures equaled approximately the same
amount. We can therefore adopt a more simplified version of CBO’s methodology to infer that
a 5% increase in prescription drug expenditures (related only to improved adherence, NOT
price increases) will result in a 1% decrease in medical costs. For the purposes of Visante’s
model, we have assumed that each dollar of increased drug expenditure from increased
adherence results in an equal dollar decrease in non-drug medical costs. While this
methodology may apply generally to a broad spectrum of drug categories, it may not apply to
each specific, individual drug.
Specialty Pharmacy: Utilization management and patient adherence programs play an
important role in specialty pharmacy. One specialty pharmacy, for instance, identified
inappropriate utilization according to nationally recognized clinical guidelines for six therapy
categories. Applying these clinical guidelines with 52 clients cut costs by 24% in these
categories.88
Other studies have demonstrated that prior authorization, a commonly used
76 “Advancing Adherence & the Science of Pharmacy Care, Volume 3,” CVS Caremark, 2013. 77 “Insights. Advancing the Science of Pharmacy Care,” CVS Health, Fall 2014. 78 Express Scripts, “Is Compliance Really Better in Home Delivery? Evidence across Three Chronic Therapy Classes,” 2008. 79 Duru, O., et al., “Mail-Order Pharmacy Use and Adherence to Diabetes-Related Medications,” Am J Managed Care 16(1):33-40, 2010. 80 Iyengar, et al., “Dispensing Channel and Medication Adherence: Evidence across 3 Therapy Classes,” Am J Manag Care 19(10):798-804, 2013. 81 Iyengar, R., et al., “Association between Dispensing Channel and Medication Adherence among Medicare Beneficiaries Taking Medications to Treat
Diabetes, High Blood Pressure, or High Blood Cholesterol,” J Manag Care Pharm 20(8):851-861, 2014. 82 Cutrona, S., et al., “Modes of Delivery for Interventions to Improve Cardiovascular Medication Adherence,” Am J Managed Care 16(12):929-994,
2010. 83 Pharmacy Benefit Management Institute, op. cit. 84 Eaddy, M., et al., “How Patient Cost-Sharing Trends Affect Adherence and Outcomes—A Literature Review,” P&T Jan;37(1):45-55, 2012. 85 Chernew, M., et al., “Impact of Decreasing Copayments on Medication Adherence within a Disease Management Environment,” Health Aff 27(1):103-
112, 2008. 86 Maciejewski, M., et al., “Copayment Reductions Generate Greater Medication Adherence in Targeted Patients,” Health Affairs 29(11):2002-2008, 2010. 87 “Offsetting Effects of Prescription Drug Use on Medicare’s Spending for Medical Services,” Congressional Budget Office, November 2012. 88 “Specialty Pharmacy: Historical Evolution and Current Market Needs,” op. cit.
PBMs: Generating Savings for Plan Sponsors and Consumers January 2016
19
specialty pharmacy tool, generates savings of up to 50%.89,90
Specialty pharmacies can also
reduce product waste by eliminating excessive quantities of expensive pharmaceuticals. One
specialty pharmacy demonstrated that hemophilia assay management and waste reduction
reduce expenditures by 7.7%, that Revlimid dose optimization saves 6.6%, and that a Synagis
waste reduction program saves 1%.91
Patient adherence is often crucial to successful therapy in
diseases related to specialty pharmacy (e.g., multiple sclerosis, hepatitis C, HIV, transplant).
Specialty pharmacy improved adherence for multiple sclerosis from 84% to 90%;92
for hepatitis
C from 70% to 78%;93
for HIV from 81% to 90%;94
and for transplant patients from 76% to
85%.95
Numerous studies suggest that the improved adherence resulting from specialty
pharmacy interventions can reduce non-drug medical costs through care coordination, clinical
assessments, and patient education and support.96,97,98,99,100,101,102
However, a recent assessment
by the Institute for Clinical and Economic Review suggests that the introductory prices of some
new specialty drugs would need to be three times lower to create net savings to the health
system.103
Visante estimates that for a plan with average use of PBM tools, utilization management programs
reduce prescription volume by approximately 1-5%. Mail-service adherence programs may increase
prescription volume and costs by 5-10% in applicable categories, while creating equivalent savings
offsets in non-drug medical/hospital costs. Specialty-pharmacy adherence programs also improve
adherence and increase drug costs, but with some of the high price tags associated with specialty
pharmaceuticals, we are not sure that improved adherence for specialty drugs always creates equivalent
offsets in non-drug medical/hospital costs. Because of these question marks, we assume that specialty
adherence programs increase utilization and costs of specialty drugs by 5% across the board, but with
medical offsets equal to only half this increase in drug costs.
Because pharmacies and pharmaceutical manufacturers have an economic incentive to promote patient
adherence in order to increase prescription volume, we also assume that some adherence impact would
be present for an unmanaged benefit. Based on this evidence and methodology, Visante calculates the
following savings from utilization management (Figure 5):
89 “Specialty Utilization Management Proves Effective: Ampyra Prior Authorization Improves Safety and Saves Money,” Prime Therapeutics, 2011. 90 “Specialty Prior Authorizations Reduce Costs and Enhance Medication Safety,” Walgreens Specialty Pharmacy, 2009. 91 “Specialty Pharmacy: Historical Evolution and Current Market Needs,” op. cit. 92 Tang, J., and Faris, R., “Exploring the Impact of Dispensing Channel on Medication Adherence among Multiple Sclerosis Patients,” presented at the
14th Annual International Meeting of the International Society for Pharmacoeconomics and Outcomes Research (ISPOR), May 2009. 93 Visaria, J., and Frazee, S., “Role of Pharmacy Channel in Adherence to Hepatitis C Regimens,” Am J Pharm Benefits 5(1):17-24, 2013. 94 Miller, S., “Personalizing the Specialty Business,” presentation at the PCMA Specialty Pharmacy Business Forum, April 4, 2012. 95 Ibid. 96 Mitra, D., et al., “Treatment Patterns and Adherence among Patients with Chronic Hepatitis C Virus in a U.S. Managed Care Population,” Value Health
Jun-Jul;13(4):479-486, 2010. 97 Tan, H., et al., “Impact of Adherence to Disease-Modifying Therapies on Clinical and Economic Outcomes among Patients with Multiple Sclerosis,”
Adv Ther Jan;28(1):51-61, 2011. 98 Specialty Pharmacy News, June:10(6), 2013. 99 Tschida, S., et al., “Outcomes of a Specialty Pharmacy Program for Oral Oncology Medications,” Am J Pharm Benefits 4(4):165-174, 2012. 100 Tschida, S., et al., “Managing Specialty Medication Services through a Specialty Pharmacy Program: The Case of Oral Renal Transplant
Immunosuppressant Medications,” J Managed Care Pharm 19(1):26-41, 2013. 101 Russek, S., and Szymanski, J., Medco, “Specialty Pharmacy: Rare Disease Management,” presented at the PCMA Specialty Pharmacy Symposium,
June 2005. 102 Barlow, J., et al., “Impact of Specialty Pharmacy on Treatment Costs for Rheumatoid Arthritis,” Am J Pharm Benefits 4(Special Issue):SP49-SP56,
2012. 103 “PCSK9 Inhibitors for Treatment of High Cholesterol: Effectiveness, Value, and Value-Based Price Benchmarks,” Institute for Clinical and Economic
Review, November 24, 2015.

PBMs: Generating Savings for Plan Sponsors and Consumers January 2016
20
Figure 5: Range of PBM Savings
Through Utilization Management and Adherence Programs
Limited Average High
Estimated Savings vs
Unmanaged/Uninsured -1% to 1% 0% to 2% 1% to 3%
Increased Savings vs
Limited Use of PBM Tools -- 1% 2%
Source: Visante, 2015.
Evidence and Estimates of Administrative Efficiencies
PBMs have created the most efficient claims processing system in the health care industry. No other
health care segment (physicians, hospitals, long-term care, home care, etc.) can yet duplicate the PBM
system’s speed and low cost. In the 1980s, PBMs were already connected online with pharmacies
throughout the nation. This connectivity and online claims processing system allows each prescription
claim to be adjudicated in seconds—with great cost efficiency.
PBM-pioneered systems also speed vital information and data to pharmacists. For example, if a patient
uses multiple pharmacies, the PBM system can compare the new prescription with the patient’s entire
claims history across all pharmacies, identify a potentially dangerous drug-drug interaction, and alert
the pharmacist before the new prescription is filled. No other U.S. health care segment has been able to
replicate this innovation.
PBMs also use advanced computer algorithms and auditing techniques to efficiently detect and combat
fraud, waste, and abuse. Most PBMs screen for fraud, waste, and abuse both before and after a claim is
paid, and problem claims can often be detected automatically.
PBM fees are low compared with the value of PBM services. The GAO reported PBM fees from
Federal Employees’ Health Benefits Program plans for various administrative and clinical services,
including processing claims and drug utilization reviews. These administrative fees, which varied by
plan depending on contracted services, accounted for an average of about 1.5% of each plan’s total
drug benefit spending.104
However, the Federal Employees’ Health Benefits Program represents an
extremely large PBM client, which is likely to pay relatively low fees compared with other clients.
Therefore, fees for average PBM clients are assumed to be higher. According to financial reports from
the largest PBMs, earnings before interest, depreciation, taxes, and amortization (EBIDTA) accounts
for 2-4% of total revenue (i.e., drug spend).105
Projecting Limited/Average/Best-Practice PBM Savings
To project average PBM savings relative to unmanaged expenditures, we must first project potential
drug expenditures with no pharmacy benefit management (unmanaged expenditures). We combined
estimated percentage savings for average PBM management with our estimation of baseline
expenditures managed by PBMs, derived from CMS data (which already reflect this level of savings).
104 Government Accountability Office, op. cit. 105 Securities and Exchange Commission, Forms 10-Q, Express Scripts, Catamaran, 2014.
PBMs: Generating Savings for Plan Sponsors and Consumers January 2016
21
We then subtracted current drug expenditures from unmanaged drug expenditures to derive average
PBM savings.
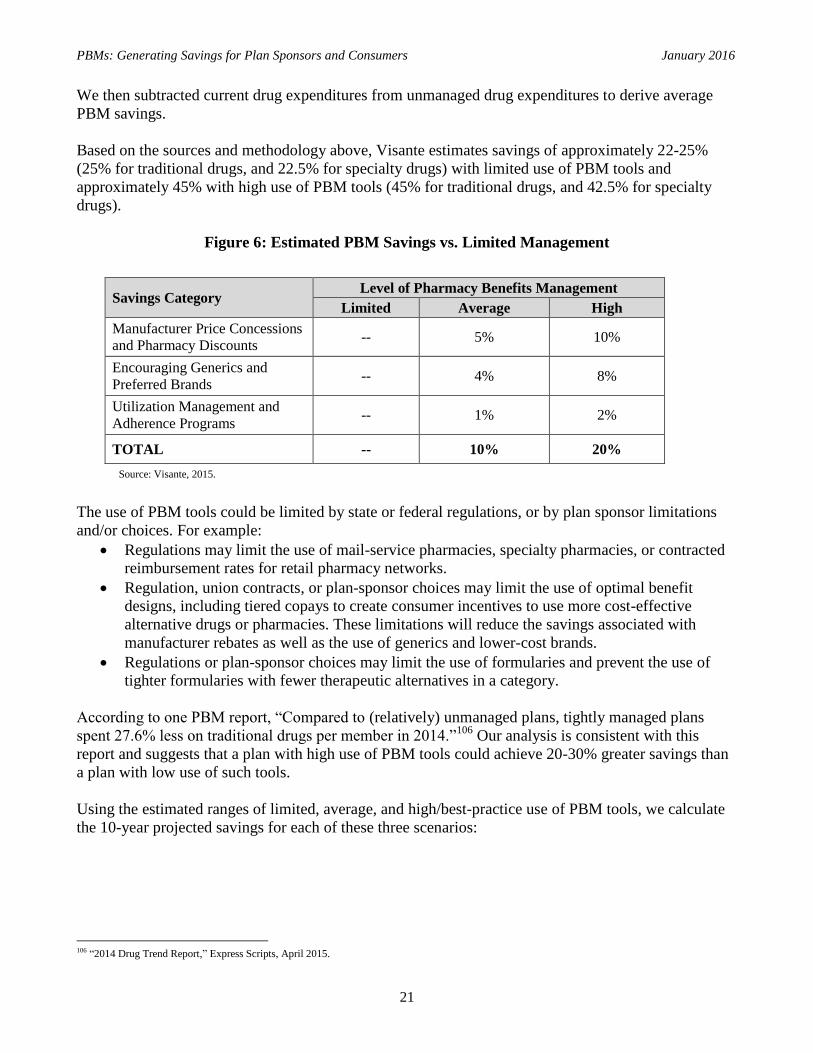
Based on the sources and methodology above, Visante estimates savings of approximately 22-25%
(25% for traditional drugs, and 22.5% for specialty drugs) with limited use of PBM tools and
approximately 45% with high use of PBM tools (45% for traditional drugs, and 42.5% for specialty
drugs).
Figure 6: Estimated PBM Savings vs. Limited Management
Savings Category Level of Pharmacy Benefits Management
Limited Average High
Manufacturer Price Concessions
and Pharmacy Discounts -- 5% 10%
Encouraging Generics and
Preferred Brands -- 4% 8%
Utilization Management and
Adherence Programs -- 1% 2%
TOTAL -- 10% 20%
Source: Visante, 2015.
The use of PBM tools could be limited by state or federal regulations, or by plan sponsor limitations
and/or choices. For example:
Regulations may limit the use of mail-service pharmacies, specialty pharmacies, or contracted
reimbursement rates for retail pharmacy networks.
Regulation, union contracts, or plan-sponsor choices may limit the use of optimal benefit
designs, including tiered copays to create consumer incentives to use more cost-effective
alternative drugs or pharmacies. These limitations will reduce the savings associated with
manufacturer rebates as well as the use of generics and lower-cost brands.
Regulations or plan-sponsor choices may limit the use of formularies and prevent the use of
tighter formularies with fewer therapeutic alternatives in a category.
According to one PBM report, “Compared to (relatively) unmanaged plans, tightly managed plans
spent 27.6% less on traditional drugs per member in 2014.”106
Our analysis is consistent with this
report and suggests that a plan with high use of PBM tools could achieve 20-30% greater savings than
a plan with low use of such tools.
Using the estimated ranges of limited, average, and high/best-practice use of PBM tools, we calculate
the 10-year projected savings for each of these three scenarios:
106 “2014 Drug Trend Report,” Express Scripts, April 2015.

PBMs: Generating Savings for Plan Sponsors and Consumers January 2016
22
Figure 7: Projected 10-Year Drug Expenditures Under Three Scenarios
(Dollar figures in billions)
*Assume that projected expenditures for private, Medicare, and Managed Medicaid reflect
“Average” levels of management, while FFS Medicaid reflects “Limited” management.
Source: Visante, 2015.
Estimating the Cost of Jobs Covered by PBM Savings
BLS estimates that total compensation costs per hour for private industry workers was $31.32 in
December 2014.107
This figure was multiplied by 2,080 hours (40 hours per week, 52 weeks per year)
to derive 2014 total compensation costs of $65,145.60 per full-time equivalent (FTE) job. This figure
was inflated using a 2.3% annual growth rate, the most recent 12-month change in the Employment
Cost Index (ECI) for private industry workers (December 2013 to December 2014), to project 2016
compensation costs of $68,177 per FTE job. This figure was used as the cost of a job in 2016.
Savings generated by PBMs for the commercial sector were derived by multiplying the midpoint of
our estimated average PBM savings (35%) by 2016 employer-sponsored private-insurance drug
expenditures of $131 billion estimated by CMS.108,109
This figure was divided by the cost of an FTE
job in 2016 to derive that more than 672,000 jobs could be covered by savings generated by PBMs in
2016. We then similarly calculated how jobs could be paid for at high and limited PBM savings levels.
If all commercial plan sponsors choose high use of PBM tools in 2016, then the resulting savings
would cover the cost of 190,000 additional new jobs from those covered if plan sponsors continued at
an average level of PBM savings. Similarly, if plan-sponsor choices or government policies limit the
use of PBM tools, lost savings would equal the cost of 190,000 jobs lost.
107 Bureau of Labor Statistics, op. cit. 108 Centers for Medicare and Medicaid Services, National Health Expenditure Data, projected 2014-2024. 109 “Health Insurance Coverage of the Total Population,” Kaiser Family Foundation.
Level of Pharmacy Benefit Management *
Limited Average High
Commercial/Private Insurance $2,658 $2,308 $1,959
Medicare $1,947 $1,690 $1,433
Managed Medicaid $362 $314 $266
FFS Medicaid $94 $82 $69
Payer Type