Pharmaceuticals leaching from bio- solids amended soils
59
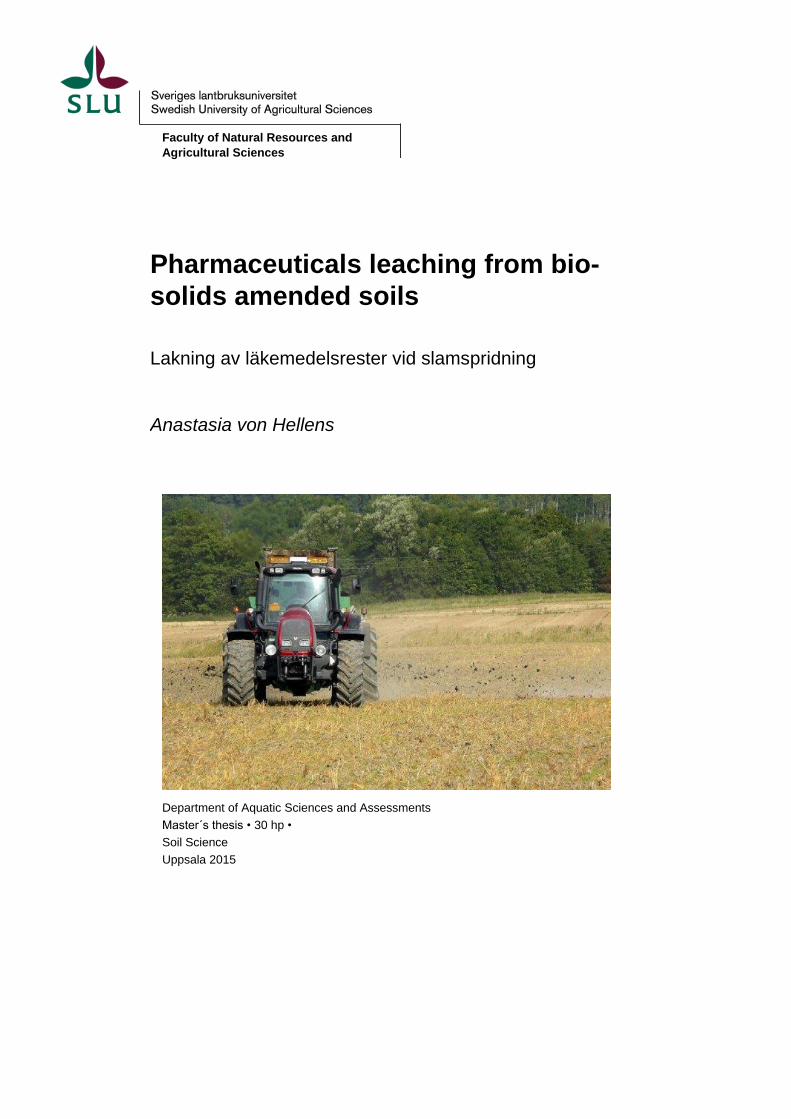
Faculty of Natural Resources and Agricultural Sciences Pharmaceuticals leaching from bio- solids amended soils Lakning av läkemedelsrester vid slamspridning Anastasia von Hellens Department of Aquatic Sciences and Assessments Master´s thesis • 30 hp • Soil Science Uppsala 2015
Transcript of Pharmaceuticals leaching from bio- solids amended soils
Faculty of Natural Resources and
Agricultural Sciences
Pharmaceuticals leaching from bio-
solids amended soils
Lakning av läkemedelsrester vid slamspridning
Anastasia von Hellens
Department of Aquatic Sciences and Assessments
Master´s thesis • 30 hp •
Soil Science
Uppsala 2015
Pharmaceuticals leaching from biosolids amended soils
Lakning av läkemedelsrester vid slamspridning
Anastasia von Hellens
Supervisor: Dr. Lutz Ahrens,
Swedish University of Agricultural Sciences,
Department of Aquatic Sciences and Assessments
Assistant Supervisors: Dr. Mats Larsbo,
Swedish University of Agricultural Sciences,
Department of Soil and Environment
Dr. Meritxell Gros Calvo,
Swedish University of Agricultural Sciences,
Department of Aquatic Sciences and Assessments
Examiner: Prof. Nicholas Jarvis,
Swedish University of Agricultural Sciences,
Department of Soil and Environment
Credits: 30 hp
Level: Advanced A2E
Course title: Independent project/degree project in Soil Science – Master's thesis
Course code: EX0430
Programme/education: Agricultural Programme – Soil/Plant
Place of publication: Uppsala
Year of publication: 2015
Cover picture: Sunita Hallgren
Online publication: http://stud.epsilon.slu.se
Keywords: Biosolids, pharmaceuticals, leaching, soil texture, correlation analysis,
physiochemical properties
Sveriges lantbruksuniversitet
Swedish University of Agricultural Sciences
Faculty of Natural Resources and Agricultural Sciences
Department of Aquatic Sciences and Assessments

Acknowledgment Conducting this experiment has been like a long hike over hills and valleys
with ups and downs. It would not have been managed without my partner in
crime Elin Andersson, a pharmacist with lab-skills beyond. However, with-
out the guidance of Lutz Ahrens and Meritxell Gros Calvo I am sure we
would still be wandering. I would like to thank Mats Larsbo for his im-
mense patience, always listening to my scattered thoughts then helping me
clearing them out. A large thank you goes to Caroline Holm that on a cold
January morning helped me collect frozen sludge from Hovgården, not
more needs to be said there I think.
A large thank you is also sent to the whole department of Aquatic Scienc-
es and Assessments and all the help received from co-workers in the lab.
Thank you Karin Wiberg, for enabling this project and Nicholas Jarvis,
taking your time to go through my thoughts and ideas.
Till alla vänner som väntat med lunchen för att SPEn måste blir klar och
som lyssnat i oändlighet på tankar om molekyler och metanol. Till mamma
för evinnerlig vishet och lyhört öra. Pappa för kämparglöd samt lillasyster
för ständig uppmuntran.
Laatste maar niet geringste, Michiel Braakhekke – geduld, wijsheid een
liefde.

Abstract
Biosolids are currently applied on arable land in order to recirculate nutri-
ents from urban areas. Biosolids have been reported to contain organic con-
taminants such as pharmaceuticals; thereby the impact of spreading of bio-
solids on the environment has to be investigated. This study aims to investi-
gate the transport of pharmaceuticals in lab-scale soil columns using undis-
turbed soil of different texture (i.e. clay, loam and loamy sand). The selected
pharmaceuticals included ß-blockers (i.e. atenolol, metoprolol, propranolol
and sotalol), antidepressants (i.e. amitriptyline, carbamazepine, citalopram,
diazepam, fluoxetine, lamotrigine, oxazepam, sertraline, venlafaxine and
zolpidem) and antibiotics (i.e. azithromycin, ciprofloxacin, clarithromycin,
norfloxacin, ofloxacin, roxithromycin, sulfamethoxazole and trimethoprim).
The soil columns with the highest clay content showed highest leaching
regarding both relative mass and concentration from 9 out of 12 selected
pharmaceuticals. The leaching of the pharmaceuticals (absolute amount)
decreased in order of clay > loam > loamy sand. Carbamazepine, metoprolol
and oxazepam leached highest (absolute amount) whereas trimethoprim,
fluoxetine and citalopram leached the lowest (absolute amount). This indi-
cates that the soil texture affect the leaching behaviour of pharmaceuticals
by rapid flow through macropores. A correlation between leaching behav-
iour and physicochemical properties of pharmaceuticals showed hydropho-
bicity to be significantly negatively correlated with leaching (p < 0.05,
spearman correlation). However, the study also concludes that other proper-
ties (i.e. adsorption to organic carbon, half-life and water solubility) are
important to investigate when assessing the transport of pharmaceuticals in
undisturbed soils.
Keywords: Biosolids, pharmaceuticals, leaching, soil texture, correlation
analysis, physiochemical properties

Sammanfattning
För att återföra näring från det urbana samhället sprids idag slam från
svenska vattenreningsverk på åkermark. Slam har visats innehålla olika
miljöstörande ämnen bland annat läkemedel, varvid spridning av slammet är
omdebatterad och dess miljöpåverkan bör undersökas. Denna studie syftar
till att undersöka transport av läkemedelsrester i ostörda jordar med
varierande textur (styv lera, mellan lera och sand). Detta gjordes genom ett
laboratorieexperiment där slam innehållande läkemedelsrester spreds på
jordkolumner och bevattnades med artificiellt regnvatten. Experimentet
undersökte transport av beta-blockerare (atenolol, metoprolol, propranolol
och sotalol), antidepressiva (amitriptylin, citalopram, diazepam, fluoxetin,
karbamazepin, lamotrigin, oxazepam, sertralin, venlafaxin och zolpidem)
och antibiotika (azithromycin, ciprofloxacin, klaritromycin, norfloxacin,
ofloxacin, roxithromycin, sulfametoxazol och trimetoprim). Jordar med
högst lerinnehåll lakade mest både gällande relativ massa och koncentration
för 9 av 12 läkemedel. Lakningen av substanserna (absolut massa) minskade
i ordningen styv lera > mellan leran > sand. Karbamazepin, metoprolol och
oxazepam lakade mest (absolut massa) medan trimetoprim, fluoxetin och
citalopram lakade minst (absolut massa). Resultaten indikerar att
marktexturen påverkar lakning då läkemedel transporteras genom
makroporer. En korrelation mellan lakning och läkemedelssubstansernas
fysiokemiska egenskaper visade att graden av hur hydrofobt en substans är
ger signifikant negativ korrelation med lakning (p < 0.05, spearman
korrelation). Dock är det viktigt att ta hänsyn till andra egenskaper så som
adsorption till organiskt kol, halveringstid och vattenlöslighet för att kunna
förutsäga transport av läkemedelsrester i mark.
Nyckelord: Slamspridning, läkemedel, lakning, marktextur, korrelations
analys, fysiokemiska egenskaper

Table of contents
Acknowledgment 3
Abbreviations 8
1 Introduction 10
1.1 Background 10
1.2 Aim 12
1.3 Limitations of the study 12
1.4 Research questions 12
2 Theory 13
2.1 Background on selected pharmaceuticals 13
2.2 Properties of pharmaceuticals affecting their transport behavior 17
2.2.1 Physiochemical properties of pharmaceuticals 17
2.2.2 Ionic strength 17
2.2.3 Sorption to soil and biosolids 18
2.2.4 Persistence in soil and sludge 18
2.3 Soil properties influencing leaching behaviour of pharmaceuticals 19
2.4 Soil leaching experiments on pharmaceuticals 20
3 Material and Methods 21
3.1 Materials and chemicals 21
3.2 Soil sampling 22
3.3 Sludge sampling 23
3.4 Column leaching experiment 24
3.4.1 Sludge spiking 24
3.4.2 Leaching experiment 24
3.5 Analysis of pharmaceuticals 27
3.5.1 Extraction of leachate samples 27
3.5.2 Extraction of sludge samples 27
3.6 Instrumental analysis 29
3.7 Quality assurance and quality control 29
3.8 Data evaluation and statistical analysis 29
4 Results 30
4.1 Quality assurance and quality control 30
4.2 Evaluation of the experimental setup 30
4.3 Effects of soil texture on leaching pattern 31

4.4 Comparison of leaching pattern 34
4.5 Mass balance 36
5 Discussion 39
5.1 Effects of soil texture on leaching pattern. 39
5.2 Correlation of physiochemical properties 41
6 Conclusions and future perspectives 46
References 47
6.1 Internet references 51
Appendix A 53
Appendix B 56
Appendix C 57
Appendix D 58
Appendix E 59

8
Abbreviations
AMT amitriptyline
ATL atenolol
AZC azithromycin
CBZ carbamazepine
CFX ciprofloxacin
CIT citalopram
CLC clarithromycin
DZP diazepam
FXT fluoxetine
LTG lamotrigine
MET metoprolol
NFX norfloxacin
OFX ofloxacin
OZP oxazepam
PRO propranolol
RXC roxithromycin
SOT sotalol
SMX sulfamethoxazole
SRT sertraline
TMP trimethoprim
VEN venlafaxine
ZPD zolpidem

9

10
1 Introduction
1.1 Background
In order to ensure recirculation of the limited natural resource phosphorus, the Swe-
dish government has decided that by 2018, 40 % of phosphorous and 10 % nitrogen
originating from sewage sludge is to be applied on arable land (Swedish Environmen-
tal Protection Agency, EPA, 2013). Consequently, approximately 250 000 tons of dry
weight sewage sludge is today annually distributed on Swedish farm fields, approxi-
mately 25 % (Swedish EPA, 2013). The Swedish Code of Statues, SNFS (1994:2),
based on the European sludge legislation 86/278/EEG, regulates the usage of sludge
on arable land (Swedish EPA, 2001). This is done in order to ensure protection of the
environment by minimizing the risk of exposure to soil, plants, animals and humans
and furthermore to surface and groundwater. The distribution of sludge on arable land
follows the guidelines for fertilizer distribution, SJVFS (2004:62), governed by the
Swedish Board of Agriculture (Swedish board of Agriculture, 2013). Prior to distribu-
tion, the quality of the sludge is controlled according to the certification system Revaq
which ensures sanitation of the sludge in order to prevent spreading of salmonella
(Svenskt Vatten, 2015). The Revaq-certification also ensures that guideline values are
not exceeded with regards to concentrations of heavy metals (Pb, Ni, Cu, Cr, Zn, Cd
and Hg) in order to prevent accumulation in soil (Svenskt Vatten, 2015a). Leachate
water from wastewater treatment plants is also analyzed in order to prevent spreading
of perfluorooctane sulfonate (PFOS), polyaromatic hydrocarbons (PAH), phthalates
and brominated flame retardants (BDE) with the sludge (Svenskt Vatten, 2015b).
However, there is today no legislation for guideline values with regards to concentra-
tions of pharmaceuticals in sewage sludge (Svenskt Vatten, 2014; Veolia Vatten,
2014). This despite the fact that several monitoring reports have shown occurrence of
a wide range of pharmaceuticals in various concentrations in sludge (Adolfsson-Erici
et al. 2005; Lindberg et al. 2005; Helmfrid, I. & Eriksson, C. 2010; Lindberg, et al.
2010; Wahlberg et al. 2010; Fick et al. 2011; Haglund, P. & Olofsson, U. 2012).

11
In Sweden, there have been several reports stating findings of pharmaceuticals
in lakes and surface waters (Remberger et al. 2009; Fick et al. 2010; Wahlberg et
al. 2010) and drinking water (Wahlberg et al. 2010). The main source for pharma-
ceutical residues is effluents from wastewater treatment plants. However, manure
and biosolids application has also showed to be a source for pharmaceuticals in
groundwater (Kay et al. 2004; Hamscher et al. 2005; Blackwell et al. 2007). It
might also lead to transport to different water bodies through leaching and surface
runoff (Topp et al. 2008; Lapen et al. 2008; Wu et al. 2010). Furthermore, applica-
tion of manure and biosolids can result in accumulation of pharmaceuticals in the
top soil layer (Tolls, J. 2001; Wu et al. 2010). However, since little is known of the
environmental transport of pharmaceuticals in soil after biosolids application fur-
ther research is needed in this area.
Due to the risk pharmaceuticals may pose to the environment, several studies
have been conducted investigating adsorption, desorption and transport of human
pharmaceuticals (Kreuzig et al. 2005; Chefetz et al. 2008; Lapen et al. 2008 ; Topp
et al. 2008; Wu et al. 2010; Fenet et al. 2012; Schaffer et al. 2012). There have
also been studies investigating leaching of veterinary pharmaceuticals from animal
manure through soil after manure application (Unold et al. 2009; Engelhardt et al.
2015). There have however up to date not been any studies investigating the natu-
ral transport and fate of pharmaceuticals from biosolids through undisturbed soil at
environmental relevant concentrations. Nor have there been any studies investigat-
ing leaching of pharmaceuticals from Swedish soils. In order to ensure human and
environmental safety and minimize the risk of their exposure, there is a need to
understand the persistence of pharmaceuticals in the environment. Therefore, fur-
ther investigation of transport of pharmaceuticals in undisturbed soil after biosolid
application is needed.

12
1.2 Aim
The aim of this study was to investigate the transport pattern of selected phar-
maceuticals in a lab-scale soil column leaching experiment using three undisturbed
soils of contrasting texture (i.e. clay, loam, loamy sand) with incorporated biosol-
ids. The leaching patterns of the pharmaceuticals were correlated with their physi-
cal and chemical properties. This study aims to advance the knowledge of risks
associated with applying biosolids contaminated with pharmaceuticals on arable
land.
1.3 Limitations of the study
Pharmaceuticals and other organic pollutants can be transported through differ-
ent pathways in the environment but this study was limited only to investigate
lateral leaching and did not include e.g. surface runoff. Processes such as volatili-
ty, degradation, cocktail effects, transformation or bioaccumulation are important
processes which may affect the transport. These processes are not studied sepa-
rately in this study.
1.4 Research questions
The study aims to answer the following research questions
Which effects does the soil texture have on the leaching of pharmaceuticals in
soil following biosolids application?
Are the physical-chemical properties (log Pow, log Dow, Mw, Kow, Koc, DT50 and
Sw) of the pharmaceuticals be correlated to their leaching pattern?

13
2 Theory
2.1 Background on selected pharmaceuticals
The pharmaceuticals of this study are presented in Table 1. They were selected
based on their findings in Swedish sewage sludge (Fick et al. 2011) and effluent
water from Swedish wastewater treatment plants (Wahlberg et al. 2010). Amitrip-
tyline (AMT), atenolol (ATL), clarithromycin (CLC), ofloaxcin (OFX), oxazepam
(OZP), norfloaxcin (NFX), sulfamethoxazole (SMX), trimethoprim (TMP),
zolpidem (ZPD) have been detected in low levels (b.ld. – 100 g/kg dewatered
sludge) in sludge. Carbamazepine (CBZ), citalopram (CIT), ciprofloxacin (CFX),
fluoxetine (FXT), metoprolol (MET), sertraline (SRT) and venlafaxine (VEN)
were found in high levels (> 100 g /kg dewatered sludge) (Fick et al. 2011).
Atenolol (ATL), metoprolol (MET), oxazepam (OZP), citalopram (CIT) and sul-
famethoxazole (SMX) have been found in various concentrations in effluent water
from wastewater treatment plants (5 ng/L – 30 ng/L) (Wahlberg et al. 2010).
Pharmaceuticals have varying physiochemical properties and functional groups
like amines and carboxylic acid. The pharmaceuticals investigated in this study
can be clustered in to three classes; ß-blockers, antidepressants and antibiotics
(Table 1). They are ionisable compounds that can exist as different ions depending
on the pH of the environment (Schwarzenbach et al. 2005). Most of the pharma-
ceuticals of this study can be characterized as bases due to their high pKa values
(Table 1). DZP, LTG and ZPD are compounds characterized as weak bases and
the rest as strong bases (Manallack, D. 2007). ATL, MET, PRO and SOT are char-
acterized as ß-blockers and are strong bases that can exist in cationic or neutral
form in the environment (Maszkowska et al. 2014).
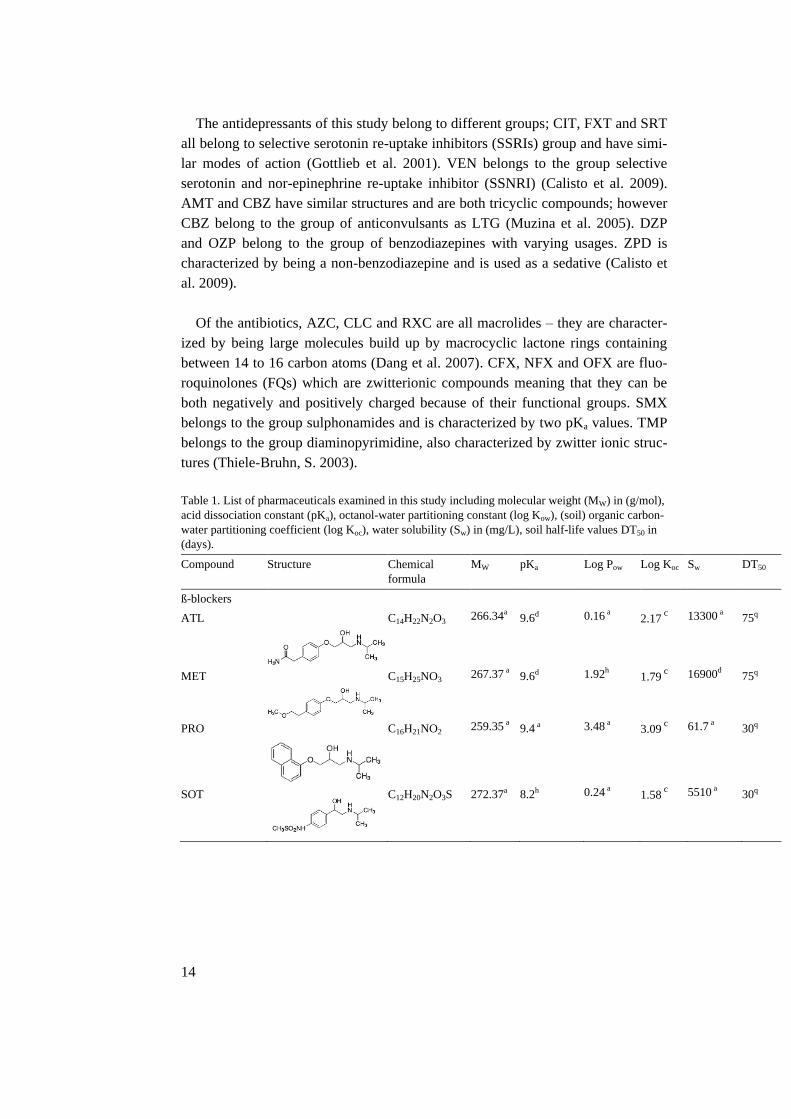
14
The antidepressants of this study belong to different groups; CIT, FXT and SRT
all belong to selective serotonin re-uptake inhibitors (SSRIs) group and have simi-
lar modes of action (Gottlieb et al. 2001). VEN belongs to the group selective
serotonin and nor-epinephrine re-uptake inhibitor (SSNRI) (Calisto et al. 2009).
AMT and CBZ have similar structures and are both tricyclic compounds; however
CBZ belong to the group of anticonvulsants as LTG (Muzina et al. 2005). DZP
and OZP belong to the group of benzodiazepines with varying usages. ZPD is
characterized by being a non-benzodiazepine and is used as a sedative (Calisto et
al. 2009).
Of the antibiotics, AZC, CLC and RXC are all macrolides – they are character-
ized by being large molecules build up by macrocyclic lactone rings containing
between 14 to 16 carbon atoms (Dang et al. 2007). CFX, NFX and OFX are fluo-
roquinolones (FQs) which are zwitterionic compounds meaning that they can be
both negatively and positively charged because of their functional groups. SMX
belongs to the group sulphonamides and is characterized by two pKa values. TMP
belongs to the group diaminopyrimidine, also characterized by zwitter ionic struc-
tures (Thiele-Bruhn, S. 2003).
Table 1. List of pharmaceuticals examined in this study including molecular weight (MW) in (g/mol),
acid dissociation constant (pKa), octanol-water partitioning constant (log Kow), (soil) organic carbon-
water partitioning coefficient (log Koc), water solubility (Sw) in (mg/L), soil half-life values DT50 in
(days).
Compound Structure Chemical
formula
MW pKa Log Pow Log Koc Sw DT50
ß-blockers
ATL
C14H22N2O3 266.34a 9.6d 0.16 a 2.17 c
13300 a 75q
MET
C15H25NO3 267.37 a 9.6d 1.92h 1.79 c
16900d 75q
PRO
C16H21NO2 259.35 a 9.4 a 3.48 a 3.09 c
61.7 a 30q
SOT
C12H20N2O3S 272.37a 8.2h 0.24 a 1.58 c
5510 a 30q

15
Compound Structure Chemical
formula
MW pKa Log Pow Log Koc Sw DT50
Antidepressants
AMT
C20H23N 277.40 a 9.4 a 4.92 a 5.70 c
9.71a 85n
CBZ
C15H12N2O 236.27 a 7.0d 2.45 a 3.59 c
17.7 a 68l
CIT
C20H21FN2O 324.39 a 9.59 f 3.74 a 4.40 c
n.d. 360q
DZP
C16H13ClN2O 284.74 a 3.4 a 2.82 a 4.05 c
50 a 75q
FXT
C17H18F3NO 309.30 a 10.05 f 4.05 a 5.32 c
60.3 a 120q
LTG
C9H7Cl2N5 256.09 a 5.7g 2.57b 3.13 c
170e 120q
OZP
C15H11ClN2O2 286.70 a 10.9d 2.24 a 3.08 c
179 a 54j
SRT
C17H17Cl2N 306.23 a 9.47 f 5.29 a 5.53 c
3.5d 84m
VEN
C17H27NO2 277.40 a 9.4d 3.28 a 3.17 c
267c 120q
ZPD
C19H21N3O 307.39 a 6.2 a 3.85 a 4.42c 23000d 120q

16
Compound Structure Chemical
formula
MW pKa Log Pow Log Koc Sw DT50
Antibiotics
AZC
C38H72N2O12 748.98 a 8.7 a 4.02 a n.d. 7.09 a 71o
CFX
C17H18FN3O3 331.34 a 6.16a/ 8.63 0.28 a 1.55 c 30000 a 120q
CLC
C38H69NO13 747.95 a 8.9 a 3.16 a n.d. 0.342 a n.d.
NFX
C16H18FN3O3 319.33 a 6.1/8.75d 0.46d 1.97 c 178000 a 289o
OFX
C18H20FN3O4 361.37 a 6.2/9.28d -0.39 a 1.65 c 28300 a 198o
RXC
C41H76N2O15 837.05 a 9.2i 2.75 a n.d. 0.0189d 130p
SMX
C10H11N3O3S 253.28 a 1.7/5.7d
0.89 a 3.19 c 610 a 75q
TMP
C14H18N4O3 290.32 a 1.32/7.12d 0.91 a 2.956c 400 a 120q
Molecular structure from FASS (2015) aChemIDplus Advanced (2015), experimental. bGoldstein et al. (2014) cChemSpider. EPISuite (PCKOCWIN v1.66) (2015) dBonnet et al. (2010) fVasskog et al. (2006) gYoung et al.
(2014) hRamil et al. (2009) iKees et al, (2000) jLöffler et al. (2005) lCarter et al. (2014) mLi et al. (2013a) nLi et
al. (2013b) oGottschall.et al. (2012) pSchlüsener et al. (2006) qChemSpider. EPIISuite. Fugacity model (III) (2015)
17
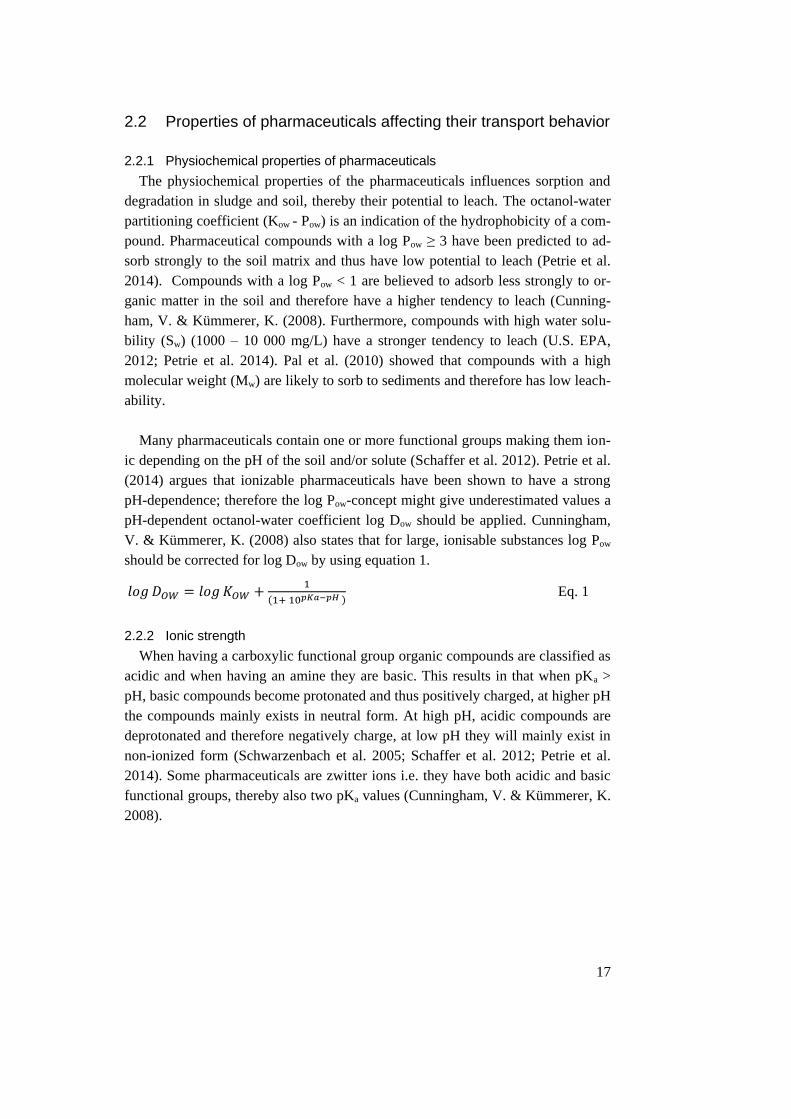
2.2 Properties of pharmaceuticals affecting their transport behavior
2.2.1 Physiochemical properties of pharmaceuticals
The physiochemical properties of the pharmaceuticals influences sorption and
degradation in sludge and soil, thereby their potential to leach. The octanol-water
partitioning coefficient (Kow - Pow) is an indication of the hydrophobicity of a com-
pound. Pharmaceutical compounds with a log Pow ≥ 3 have been predicted to ad-
sorb strongly to the soil matrix and thus have low potential to leach (Petrie et al.
2014). Compounds with a log Pow < 1 are believed to adsorb less strongly to or-
ganic matter in the soil and therefore have a higher tendency to leach (Cunning-
ham, V. & Kümmerer, K. (2008). Furthermore, compounds with high water solu-
bility (Sw) (1000 – 10 000 mg/L) have a stronger tendency to leach (U.S. EPA,
2012; Petrie et al. 2014). Pal et al. (2010) showed that compounds with a high
molecular weight (Mw) are likely to sorb to sediments and therefore has low leach-
ability.
Many pharmaceuticals contain one or more functional groups making them ion-
ic depending on the pH of the soil and/or solute (Schaffer et al. 2012). Petrie et al.
(2014) argues that ionizable pharmaceuticals have been shown to have a strong
pH-dependence; therefore the log Pow-concept might give underestimated values a
pH-dependent octanol-water coefficient log Dow should be applied. Cunningham,
V. & Kümmerer, K. (2008) also states that for large, ionisable substances log Pow
should be corrected for log Dow by using equation 1.
𝑙𝑜𝑔 𝐷𝑂𝑊 = 𝑙𝑜𝑔 𝐾𝑂𝑊 +1
(1+ 10𝑝𝐾𝑎−𝑝𝐻 ) Eq. 1
2.2.2 Ionic strength
When having a carboxylic functional group organic compounds are classified as
acidic and when having an amine they are basic. This results in that when pKa >
pH, basic compounds become protonated and thus positively charged, at higher pH
the compounds mainly exists in neutral form. At high pH, acidic compounds are
deprotonated and therefore negatively charge, at low pH they will mainly exist in
non-ionized form (Schwarzenbach et al. 2005; Schaffer et al. 2012; Petrie et al.
2014). Some pharmaceuticals are zwitter ions i.e. they have both acidic and basic
functional groups, thereby also two pKa values (Cunningham, V. & Kümmerer, K.
2008).
18
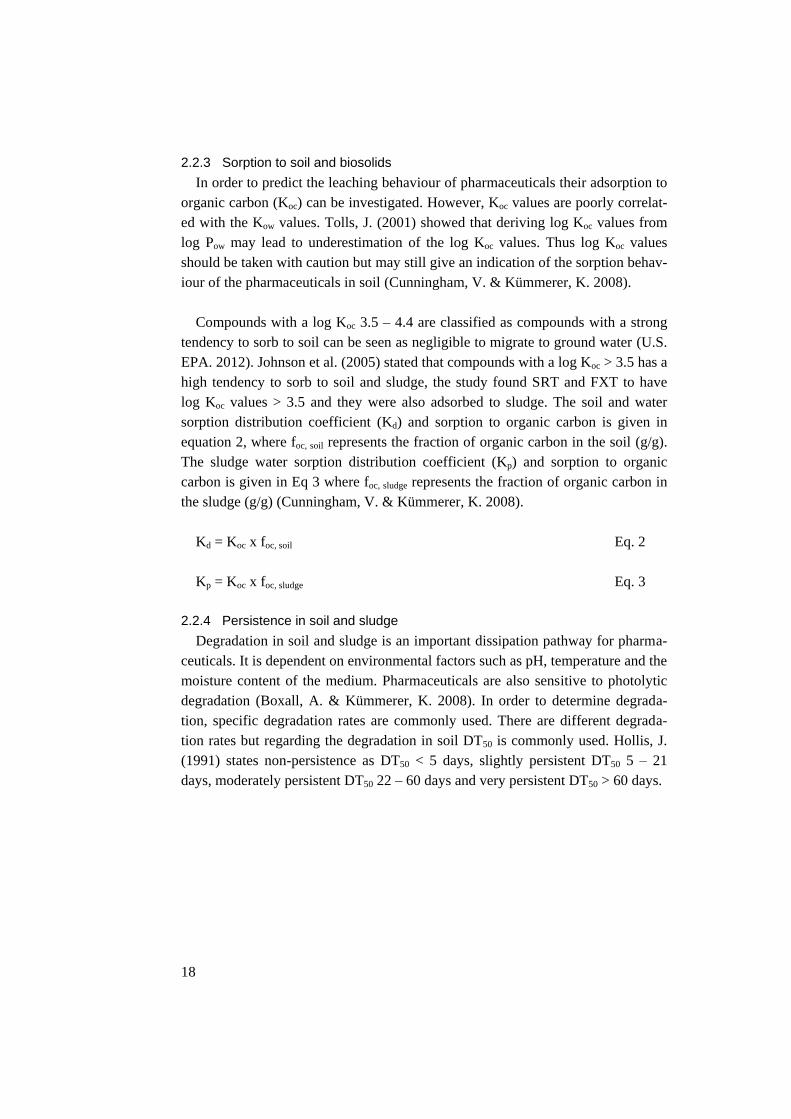
2.2.3 Sorption to soil and biosolids
In order to predict the leaching behaviour of pharmaceuticals their adsorption to
organic carbon (Koc) can be investigated. However, Koc values are poorly correlat-
ed with the Kow values. Tolls, J. (2001) showed that deriving log Koc values from
log Pow may lead to underestimation of the log Koc values. Thus log Koc values
should be taken with caution but may still give an indication of the sorption behav-
iour of the pharmaceuticals in soil (Cunningham, V. & Kümmerer, K. 2008).
Compounds with a log Koc 3.5 – 4.4 are classified as compounds with a strong
tendency to sorb to soil can be seen as negligible to migrate to ground water (U.S.
EPA. 2012). Johnson et al. (2005) stated that compounds with a log Koc > 3.5 has a
high tendency to sorb to soil and sludge, the study found SRT and FXT to have
log Koc values > 3.5 and they were also adsorbed to sludge. The soil and water
sorption distribution coefficient (Kd) and sorption to organic carbon is given in
equation 2, where foc, soil represents the fraction of organic carbon in the soil (g/g).
The sludge water sorption distribution coefficient (Kp) and sorption to organic
carbon is given in Eq 3 where foc, sludge represents the fraction of organic carbon in
the sludge (g/g) (Cunningham, V. & Kümmerer, K. 2008).
Kd = Koc x foc, soil Eq. 2
Kp = Koc x foc, sludge Eq. 3
2.2.4 Persistence in soil and sludge
Degradation in soil and sludge is an important dissipation pathway for pharma-
ceuticals. It is dependent on environmental factors such as pH, temperature and the
moisture content of the medium. Pharmaceuticals are also sensitive to photolytic
degradation (Boxall, A. & Kümmerer, K. 2008). In order to determine degrada-
tion, specific degradation rates are commonly used. There are different degrada-
tion rates but regarding the degradation in soil DT50 is commonly used. Hollis, J.
(1991) states non-persistence as DT50 < 5 days, slightly persistent DT50 5 – 21
days, moderately persistent DT50 22 – 60 days and very persistent DT50 > 60 days.
19
2.3 Soil properties influencing leaching behaviour of pharmaceuticals
There are several soil properties that influence the transport behaviour of phar-
maceuticals in soils. Kumar et al. (2005) and Golet et al. (2003) found increasing
adsorption of antibiotics with increasing soil organic matter and clay content. This
shows that sorption soil can be described by other factors apart from Koc as de-
scribed in the chapter 2.2.3. Soil pH, abundance of metal oxides and cation ex-
change capacity (CEC) have also shown to affect adsorption, thereby the leaching
of pharmaceuticals (Oppel et al. 2004; Schaffer et al. 2012; Srinivasan et al. 2013).
Maszkowska et al. (2014) state that pharmaceuticals (e.g. ß-blockers) that are posi-
tively charged at low pH are more strongly retained in soil than neutral due to
attraction to permanently negatively charged surfaces. Schaffer et al. (2012) states
that cationic exchange processes are responsible for retardation of positively
charged pharmaceuticals (ATL, DZP and TMP). Also Srinivasan et al. (2013)
found sulfonamides to bind more strongly to soils when in cationic form.
However, the above cited studies are all conducted through batch experiments
and do not take in to account the structure of the soil. Coarse grained soils have
higher water transport capacities and could therefore be predicted to leach more
(Eriksson et al. 2005). However, in soils with fine grained material cracks and
large biopores can be created through drought and biological activity (Yaron, B.
1989; Eriksson et al. 2005). Solute flow in such macropores can occur with very
little interaction with the surrounding soil matrix (Jarvis, N. 2007).Thus,
macropores can reduce pharmaceutical sorption to soil surfaces and facilitate rapid
transport through the profile and thereby leaching to groundwater. Lapen et al.
(2008), Edwards et al. (2009), Larsbo et al. (2009a) and Gottschall et al. (2012)
have shown that pharmaceuticals may be transported through macropores to tile
drains. Kay et al. (2004) also found macroporous transport of veterinary antibiotics
in clay after a manure application. D’Alessio et al. (2014) found estrogen being
transported in macropores.

20
2.4 Soil leaching experiments on pharmaceuticals
Undisturbed soil columns have been widely used in research in order to under-
stand the leaching behavior and transport of various contaminants such as pesti-
cides (Larsbo et al. 2013), nutrients (Svanbäck et al. 2013) and metals (Richards et
al. 2000) under unsaturated conditions. The main benefits of undisturbed soil col-
umn experiments compared to field experiments are that they are easy to control,
less costly than and more likely to create an accurate mass balance of the chemical
transport (Takamatsu et al. 2007). When conducting column experiments in the
laboratory, parameters such as temperature and water content can be kept con-
trolled. Undisturbed column experiments furthermore enable the evaluation of
both chemical properties and physical structure on the mobility of the pharmaceu-
ticals (Duran-Álvarez et al. 2014). One benefit of undisturbed soil columns over
disturbed is that re-packing of disturbed soil columns eliminates the soil structure
and soil macropores. On the other hand, packed columns are homogenized and
therefore results in better reproducibility (Lewis, J. & Sjöström, J. 2010).
21
3 Material and Methods The soil column leaching experiment and the sample extraction and analysis
was performed in the POP laboratory of the Department of Aquatic Sciences and
Assessments, SLU, Uppsala, Sweden.
3.1 Materials and chemicals
In this study 22 pharmaceuticals were included; AMT (HCl) (> 95%), ATL
(98.5 %), AZC (95 %), CBZ (100 %), CFX (100 %), CIT (HBr) (98 %), CLC (95
%), FXT (HCl) (99,9 %), LTG (> 95%), MET (tartrate salt) (100 %), NFX (>
95%), OFX (99.8 %), PRO (HCl) (99 %), RXC (> 95%), SER (HCl) (98 %), SMX
(99.9 %), SOT (HCl) (> 95%), TMP (99.5 %), VEN (HCl) (98 %) were purchased
from Sigma-Aldrich. DZP (> 95%), OZP (> 95%) and ZPD (> 95%) (tartrate solu-
tion) were acquired as a 1 mg/mL solution, dissolved in an appropriate solvent,
from Cerilliant and purchased through Sigma-Aldrich (see Table 1). Of these 22,
17 were included in the spiking solution in the sludge: ATL, AZC, CBZ, CFX,
CIT, CLC, DZP, FXT, LTG, MET, OFX, OZP, PRO, SER, SMX, TMP, and
VEN.
The isotopically labelled substances carbamazepine-d10 (as 100 μg/mL solu-
tion), citalopram-d6 (as 100 μg/mL solution HBr solution, free base), diazepam-d5
(as 1 mg/mL solution), fluoxetine-d5 (as 1 mg/mL solution), lamotrigine-13C-15N4
(as 500 μg/mL solution), ofloxacin-d3, sertraline-d3 (as 100 μg/mL HCl solution,
free base) and venlafaxine-d6 (as 100 μg/mL HCl solution, free base) were ac-
quired from Sigma-Aldrich. Atenolol-d7, ciprofloxacin-d8 and sulfamethoxazole-d4
were purchased in Toronto Research Chemicals (TRC).
Individual stock standard solutions and isotopically labeled solutions of the sub-
stances purchased in solid state were prepared on a weight basis in methanol (at a
concentration of 1 mg/mL).
22
This was done except for CFX, OFX and NFX which were dissolved in metha-
nol adding 100 L of NaOH 1 M. After preparation, standards were stored at −20
˚C. Intermediate standard solutions, containing all pharmaceuticals, were prepared
in methanol, and these solutions were used to prepare working standard solutions.
The solvents Acetonitrile (ACN) (99.5 %), Methanol (MeOH) (99.8 %) used in
this study were purchased through Merck.
In order to avoid contamination, all glass and metal ware was cleaned according
to the following procedure: The glassware was washed with distilled water, rinsed
with ethanol three times, dish washed, burned at 400˚C and rinsed with Millipore
water three times before use. Plastic material included in the experiment (polyeth-
ylene bottles for leachate collection and rainfall simulation, tanks to prepare the
artificial rainwater and all PVC material) were washed with distilled water, rinsed
with ethanol three times and thereafter rinsed with Millipore water three times.
3.2 Soil sampling
Soil samples were collected from three sites around Uppsala: Rosta Gård, So-1
(59˚59´N; 17˚35´E) and Säby 2, So-2 (59˚50´N; 17˚41´E) and Säby 3, So-3
(59˚54´N; 17˚39´E). The soils were chosen based on their texture characteristics
with a clay percentage varying from 4 % to 47 %, see Table 2.
Table 2. Soil properties for sampling sites.
Abbreviation Texturea Clay (<2 µm) (%) Silt (2-60 µm) (%) Sand (60 µm – 2 mm) (%) pH OC (%)
So-1 Loamy sand 4.3 12.3 83.4 5.9 1.24
So-2 Loam 19.5 48.2 32.3 5.7 2.45
So-3 Clay 47.3 31.5 21.2 5.8 2.03
aU.S Soil Taxonomy Triangle (Pedosphere, 2015)
The characteristics of So-1 were determined by Eurofins and characteristics of
So-2 and So-3 at the Soil Physics laboratory at the Department of Soil and Envi-
ronment, SLU, Uppsala, Sweden. In order to avoid contamination of veterinary
pharmaceuticals from stable manure fields that had been conventionally cultivated,
thus only received mineral fertilizers were chosen. Prior to sampling, the fields
had also received the same mechanical cultivation technique with two carrier cul-
tivations made post-harvest to a depth of 10 – 15 cm. So-1 had been cultivated
with rye wheat (Triticale spp.) planted during spring 2014 and at So-2 and So-3
with autumn wheat (Triticum aestivum spp.).
23
During the period of November 21, 2014, and December 3, 2014, four undis-
turbed soil columns (PVC pipes of 20 cm high, 12.5 cm inner diameter) were
sampled at each of the three sites. The undisturbed soil columns were obtained
according to Larsbo et al. (2013) with the difference that the columns were gently
hammered in to the soil and thereafter dug out by hand. The undisturbed columns
were collected at least 1.5 m from any edge of the field plot and approximately 1
m apart from each other. Effort was made to avoid tire tracks in order to minimize
disturbance due to compaction. Before taking the samples, the upper layer of or-
ganic material (top 3 cm) such as plant and biota residues was gently removed
(Durán-Álvarez et al. 2014). The columns were prepared by removal of excess soil
at the bottom which was done with the help of a sharp spatula. All columns were
covered with PVC caps and sealed in plastic bags in order to prevent moisture loss
during storage. The columns were stored in a cooling room at + 4 ˚C until the start
of the leaching experiments (February 2, 2015), in order to minimize biological
activity during storage.
3.3 Sludge sampling
Revaq certified sludge (3 kg of dewatered and thermophilicly digested at
37.3 ˚C) was sampled at Hovgården waste deposit site owned by Uppsala Vatten
och Avfall AB on January 15, 2015. The sludge originated from the wastewater
treatment plant of Kungsängsverket. The properties of the sludge can be seen in
Table 3. The sludge was deposited at Hovgården (59˚93´N; 17˚77´E) during July
2014 and had thus been stored for approximately 6 months prior to sampling. The
sludge was frozen at the time of sampling and was therefore chopped in to pieces
before packed in plastic containers and stored at +4 ˚C until the homogenizing and
spiking procedure January 26, 2015.
Table 3. Properties of dewatered sludge from Hovgårdena.
Average pH Density (g/m3) Average OC (%)
7.5 0.9 8.6
aUppsala Vatten och Avfall AB, (2013)
The sludge was homogenized according to the following procedure. The sludge
was placed in a 10 L metal bucket and thereafter broken from large aggregates into
small pieces with a pair of sterilized tweezers. Thereafter, the sludge was stirred
for approximately 10 minutes, five minutes clockwise and five minutes counter-
clockwise in order to ensure complete and even homogenization.

24
3.4 Column leaching experiment
3.4.1 Sludge spiking
Due to detection purposes in the leachate samples the sludge (1.5 kg) was
spiked with 78000 ng absolute of individual pharmaceuticals (i.e. 7800 µL of
standard-mix with c = 10 ng/µL) containing the following selected pharmaceuti-
cals: ATL, AZC, CBZ, CFX, CIT, CLC, DZP, FXT, LTG, MET, OFX, OZP,
PRO, SER, SMX, TMP, and VEN. A standard mixture of 10 ng selected pharma-
ceuticals/µL mentioned above was prepared by adding 200 µL of each compound
and thereafter diluting it to 20 mL MeOH/Millipore water (50:50 v/v). This result-
ed in a spiking concentration of 52 µg/kg in the dewatered sludge and a total
amount of 6.5 µg/soil column (125 g sludge/column). In order to validate the ex-
periment and assure similar transport behaviour from the spiked and non-spiked
compounds, a few pharmaceuticals from each group were selected and not spiked
in the sewage sludge. The non-spiked pharmaceuticals were SOT (ß-blockers),
NFX, RXC (antibiotics), AMT and ZPD (antidepressants). The sludge was spiked
according to the procedure from Lapen et al. (2008) and Wu et al. (2010) that used
spiking concentrations of 1760 µg/kg and 100 mg/kg sludge, respectively. Howev-
er, in this study the spiking concentration selected (52 µg/Kg dewatered sludge)
was lower in order to investigate the transport of the pharmaceuticals at environ-
mentally relevant concentrations. The homogenized sludge was divided in glass
jars of 250 mL (1 jar per soil column and 1 jar for background analysis). To each
jar 125 g of homogenized sludge was added. The sludge in each jar was spiked
with 650 µL (10 ng/µL) standard mixture. The spiking solution was added in the
250 mL glass jars by adding 15 drops in a star-shaped pattern, mixing the sludge
10 times after each adding. The drops were added in a star shape 3 times and after
the third time the sludge was mixed 30 times by mixing from the edges of the
glass jars to the middle. The spiking procedure took approximately 4 minutes per
sample. The spiked sludge samples were stored in room temperature between Jan-
uary 27, 2015 and February 2, 2015, in order to let the pharmaceuticals adsorb to
the sludge.
3.4.2 Leaching experiment
The leaching experiment was initiated February 2, 2015, according to the simi-
lar procedure as Jarvis et al. (2008) and Svanbäck et al. (2013). Prior to the start of
the experiment, the soils were stored at +18 ˚C for 72 hours which was equivalent
to the temperature the experiment was carries out. The experiment was set up by
placing 12 soil columns in 12 syphons where a nylon fabric mesh filter of 50 µm
was placed in the bottom of each syphon in order to prevent contamination of soil
particles in the leachates (Figure 1).

25
Figure 1. Image of the setup of the leaching experiment.
The columns containing three different soil types; clay, loam and loamy sand
were all set up in sets of quadruplicates. The columns were set up in the laboratory
with the base of the columns exposed so that free drainage could occur (Jarvis et
al. 2008; Larsbo et al. 2009b; Larsbo et al. 2013).
In order to mimic the natural release of pharmaceuticals to the soil profile a
common sludge application rate was used, as in the study of Lapen et al. (2008)
and Wu et al. (2010). The amounts mentioned in previous studies were modified
according to annual Swedish sludge application rates of approximately 4 ton de-
watered sludge/ha.

26
To reduce the transport cost of the sludge application a 5 year load is usually
applied leading to approximately 20 ton dewatered sludge/ha (Svenskt vatten,
2014). This application rate was used for the experiment giving that approximately
125 g sludge per column was applied. In order to mimic field incorporation of
sludge in soil, 5 cm of top soil was excavated from the upper layer of the soil col-
umns and mixed with 125 g spiked sludge. The soil and sludge were mixed in a 2
L glass beaker for approximately 2 minutes, one minute clockwise and one minute
counter-clockwise in order to ensure complete and even mixing. The soil and
sludge mixture was then returned to the soil column and gently pressed into place
(Richards et al. 2000).
The experiment was carried out using a rainfall simulator, described in detail by
Ahrens (unpublished). The experiment was carried out over a 34-day period start-
ing on February 2 and ending on March 8, 2015. In order to ensure leaching of the
pharmaceuticals over the period of the experiment, a rainfall intensity of 1.6 mm/h
was chosen. Therefore, approximately 1 L of artificial rainwater (0.01 M CaCl2
Millipore) was added to each column over a 48 hour interval. From the rainfall
simulators, tubes with valves attached were located above the columns. Siphons
equipped with PVC sieves covered with a Ø 125 mm filter paper (Munktell, Ahl-
strom) were placed on top of the soil columns. This, in order to ensure even distri-
bution of the artificial rainwater (Figure 1).
Over a 48 hour interval approximately 1 L of leachate was collected in 1 L pol-
yethylene bottles from each column (1 L rainfall/48 hours). The pooling scheme
can be seen in Table 4 below. Due to analysis purposes, 2 L of leachate from 4
days was pooled. This was done during the first 16 days of the experiment. For the
remaining 18 days, 3 L of leachate from 6 days was pooled. This resulted in seven
pools in total for each column. In order to normalise the analysis, all leachate vol-
umes were pooled to 1 L, taking 50 % from each leachate for day 4 – 16 and 33 %
from each leachate bottle day 22 – 34.
Table 4. Pooling scheme of the volumes taken out from each column (L).
Period (day) 0-4 4-8 8-12 12-16 16-22 22-28 28-34
Approximate leachate volume taken out (L) 2 2 2 2 3 3 3
Approximate final pooled volume analysed (L) 1 1 1 1 1 1 1
27
3.5 Analysis of pharmaceuticals
3.5.1 Extraction of leachate samples
The extraction of the leachates samples was done by firstly filtering the full vol-
ume of the leachate using glass microfiber filter of 0.7 µm. 250 mL of each filtrat-
ed leachate sample was transferred to a 250 mL Schott glass bottle and initial pH
was measured. To each sample 50 µL (1 ng/µL) pharmaceutical isotopic standard
(IS) mixture and 7.5 mL of a 0.1 M Na2EDTA solution was added and the bottles
thoroughly shaken. The glass bottles were thereafter adjusted to pH 3 by dropwise
addition of formic acid and thoroughly shaken between the additions in order to
ensure even distribution. Prior to the extraction the full volume of the leachate
sample was weighted.
The pharmaceutical residues in the leachate were extracted by solid-phase ex-
traction (SPE) using Oasis hydrophilic-lipophilic balance (HLB) cartridges (6cc,
200 mg, 30 μm, Waters). Before loading the leachate samples the cartridges were
pre-conditioned with 6 mL MeOH followed by 6 mL of Millipore water acidified
with formic acid to a pH of 3. The cartridges were loaded with 250 mL of the fil-
trated samples. After sample loading, the cartridges were rinsed with 6 mL of Mil-
lipore water acidified to pH 3. The cartridges were dried by centrifugation at 3500
rpm for 5 minutes in order to remove remaining excess water. The leachate sam-
ples were eluted with 8 mL of MeOH. The eluate was thereafter concentrated until
complete dryness using a nitrogen evaporator. Thereafter the solution was evapo-
rated to complete dryness and thereafter stored at -20˚C until analysis. For period
0 - 8, one duplicate was used and for period 8 – 34, two duplicates. Extracts were
reconstructed by the addition of 100 µL MeOH and 900 µL Millipore water.
3.5.2 Extraction of sludge samples
By the start of the leaching experiment (2 February, 2015), 125 g of unspiked
and 125 g of spiked sludge was frozen in order to compare the initial pharmaceuti-
cal concentrations in the sludge and to evaluate the percentage of measured con-
centration of the compounds in the sludge compared to the spiked. The percentage
of the spiked concentrations was calculated by dividing the concentration in the
spiked sludge with the initial concentration in the sludge and the spiking concen-
tration. Both sludge samples were freeze dried for 48 hours. Prior to the extraction
the samples were grinded in a porcelain mortar in order to achieve homogenous
samples. Samples were stored at +4˚C before analysis.
Two different extraction methods were used in order to determine the concen-
trations of pharmaceuticals in sludge, method A and method B.

28
Method A was used to analyse AMT, CBZ, FXT, MET and LTG. Method B
was used in order to analyse ATL, CIT, DZP, OZP, PRO, TMP and VEN. All
sludge samples were analysed in duplicates for both methods.
Method A
In Method A, 2 g homogenized freeze dried sludge was weighted in 50 mL PP
tubes. To all samples, 2 mL 100 mM sodium hydroxide solution (NaOH in 80%
methanol and 20% Millipore water) was added and samples were let to soak for 30
minutes. Thereafter 20 mL of MeOH and 100 µL (1 ng/µL) pharmaceutical isotop-
ic standard (IS) mixture was added to each sample. The PP-tubes were placed in a
wrist-action shaker at 200 rpm for 60 minutes and thereafter centrifuged at 3000
rpm for 15 minutes. Thereafter the supernatant of each sample was decanted in to
new 50 mL PP-tubes. The extraction procedure was repeated for the remaining
sludge with the exception that only 1 mL 100 mM sodium hydroxide solution
(NaOH in 80% methanol and 20% Millipore water) and 10 mL MeOH was added.
The PP-tubes were placed in a wrist-action shaker at 200 rpm for 30 minutes and
thereafter centrifuged at 3000 rpm for 15 minutes. Thereafter, the remaining su-
pernatant was decanted to the first PP-tube. The decanted sample, 0.1 mL 4 M
hydrochloric acid (HCl) was added and the sample shook by hand. Subsequently,
the tubes were centrifuged at 3000 rpm for 5 minutes. A volume of 15 mL of the
sample extract (half of the sample extract) was transferred to a 15 mL PP-tube and
concentrated to 1 mL using a nitrogen evaporator. The samples were frozen at -
20˚C for one hour and centrifuged at 3500 rpm for 5 minutes.
Thereafter, the supernatant was decanted to a new HPLC vial. For the clean-up,
25 mg ENVI-Carb and 50 µL glacial acetic acid was added to a 1.7 mL Eppendorf
centrifuge tube. The 1 mL samples were added to the Eppendorf centrifuge tubes
and vortexted for 30 seconds. Thereafter the samples were centrifuged at 4000 rpm
for 15 minutes. The 1 mL samples were transferred to a HPLC vial and evaporated
under nitrogen gas to complete dryness. The samples were stored at -20˚C until the
time of analysis and prior to analysis they were reconstituted by addition of 300
µL MeOH and 700 µL Millipore water.
Method B
Method B was initiated by weighing 2 g homogenized freeze dried sludge in 50
mL PP tubes. To all samples, 50 µL (1 ng/µL) pharmaceutical isotopic standard
(IS) mixture was added. The samples were thereafter vortexed in order to homog-
enize and mix well. After addition of the isotopic standard mix, the samples were
left for 30 minutes before extraction. To each sample, 10 mL of Na2EDTA (0.1 M)
and 10 mL of Acetonitrile (ACN, 1 % acetic acid) was added. After each addition,
the samples were vortexed for 30 seconds.

29
Thereafter, 1.5 g NaOC and 6 g MgSO4 was added, each sample was manually
shook for 30 seconds and vortexed for 1 minute. The samples were thereafter cen-
trifuged for 15 minutes at 3500 rpm. After centrifugation, 10 mL of supernatant
was decanted from each sample and added to 15 mL PP tube with 900 mg MgSO4
and 150 mg PSA. Each sample was manually shook for 30 seconds, vortexed for 1
minute and thereafter centrifuged for 15 minutes at 3500 rpm. After centrifugation,
approximately 9 mL of supernatant was decanted to 10 mL glass tubes. The sam-
ples were thereafter concentrated using a nitrogen evaporator until 200 µL of sam-
ple was left. The sample was thereafter transferred to a 1 mL HPLC vial by rinsing
the glass tubes twice with 200 µL acetonitrile (ACN). The extract was frozen for
one hour at -20˚C and thereafter centrifuged for 5 minutes at 3500 rpm. The su-
pernatant was transferred to a 1 mL HPLC vial and concentrated under nitrogen
gas to complete dryness thereafter stored at -20˚C until analysis. The reconstruc-
tion before HPLC analysis was done by addition of 300 µL MeOH and 700 µL
Millipore water.
3.6 Instrumental analysis
All samples were analysed with high-performance liquid chromatography cou-
pled with mass spectrometry (HPLC-MS/MS) Gros (unpublished). A separate
mixture of isotopically labeled internal standards, used for internal standard cali-
bration, was prepared in methanol.
3.7 Quality assurance and quality control
In order to avoid contamination of the samples, materials and objects that might
contain pharmaceuticals were avoided. In order to assure no contamination of
SPE cartridges, two blank samples containing Millipore water acidified with for-
mic acid to pH 3 were used. LOD was set to 3 x σ/S for all the samples and LOQ
was selected as the lowest concentration detected on the calibration curve.
3.8 Data evaluation and statistical analysis
In order to assure that the leaching patterns for the different soil types were sig-
nificant a student t-test on 95 % significance level on total ng leached was per-
formed. A student t-test on 95 % significance of the total input and output volumes
was also performed in order to investigate if the irregularities of the flow rate were
significant. Both student t-tests were generated by Minitab 16. Spearman correla-
tion coefficients were calculated using R (R Core Team, 2015). From this a
spearman correlation matrix was created.

30
4 Results
4.1 Quality assurance and quality control
Two analytical blanks using Millipore water were analysed. The Millipore
blanks were analysed simultaneously with samples conducted after 28 days of the
experiment. In the Millipore blanks, only CIT was detected. CIT was detected at
0.0069 µg/L which was below LOQ (0.017 – 0.030 µg/L and thereby put as <
LOQ, see Table A1 – A3 in the Appendix.
In order to assure that the correct pharmaceuticals had been detected, LOD was
calculated as LOD = 3 x σ/S and LOQ as the lowest concentration detected on the
calibration curve. The samples that were below LOD have been graded as not
detected (n.d.) in table A1 – A3, Appendix.
4.2 Evaluation of the experimental setup
As seen in Table C1 in the Appendix, an irregular flow rate was applied on the
columns due to flaws in the rainfall simulator. The statistical data however show
that no significant differences between the soil types can be seen with regards to
the total volume applied (p-values > 0.05, t-test. Table C2, Appendix). The clay
did however get a higher volume applied after 8 days (2.46 L) and did show high
standard deviations (0.16 L). However the total volume that leached showed no
significant difference between the soil types, as seen in Table C3 and by the statis-
tics in Table C4, Appendix (p > 0.05, t-test).
One of the clay columns clogged after 4 days of the experiment and was thus
removed giving clay, n = 3. Table D2 in Appendix shows the average pH analysed
for each leachate sample where a slight trend for a decline can be seen.

31
4.3 Effects of soil texture on leaching pattern
Of the 22 selected pharmaceuticals 12 leached in detectable concentrations
(Figure 2, Figure 3 and Table A1 – A3, Appendix). Of the 12 pharmaceuticals that
leached, 5 were found to leach from loamy sand: CBZ, CIT, MET, OZP and VEN
(Table A1 – A3, Appendix). From loam, 10 pharmaceuticals leached: ATL, CBZ,
CIT, DZP, FXT, MET, OZP, PRO, SRT and VEN (Table A1 – A3, Appendix).
From clay, 12 leached: ATL, CBZ, CIT, DZP, FXT, LTG, MET, OZP, PRO, SRT,
TMP and VEN (Table A1 – A3, Appendix). Most pharmaceuticals that did not
leach belong to the group of antibiotics; AZC, CFX, CLC, NFX, OFX, RXC,
SMX. The others that did not leach were SOT (ß-blocker), AMT and ZPD (antide-
pressant).
All pharmaceuticals that leach in loamy sand apart from CIT show a gradual in-
crease in leaching (MET Figure 2 and CBZ, OZP, VEN Figure 3). For MET and
CBZ there is no clear difference in leaching concentrations between clay and loam
(Figure 2 and Figure 3). The student t-test gave p-values > 0.05 for the first two
leaching points for both compounds (Table C5, Appendix) indicating no signifi-
cant differences in leaching.
DZP does not leach in loamy sand but in loam and clay (Figure 3) where it in
clay leaches with higher concentration, error bars not overlapping. TMP and LTG
do not leach in loamy sand or loam but in clay (Figure 3). LTG shows a tendency
to stop leaching after 34 days (Figure 3) whereas TMP stops leaching completely
after 28 days (Figure 3).
CIT shows similar leaching pattern for all soil textures with peaks after 8 days
(Figure 2). FXT does not leach in loamy sand but in loam and clay with a peak
after 8 days (Figure 2) showing no difference in leaching pattern. The same can be
seen for ATL (Figure 2).
SRT is not seen to leach in loamy sand and has a delayed leaching pattern in
both loam and clay (Figure 2). In loam it shows a slight tendency to decline in
leaching whereas in clay it shows a tendency to decrease leaching after 16 days.

32
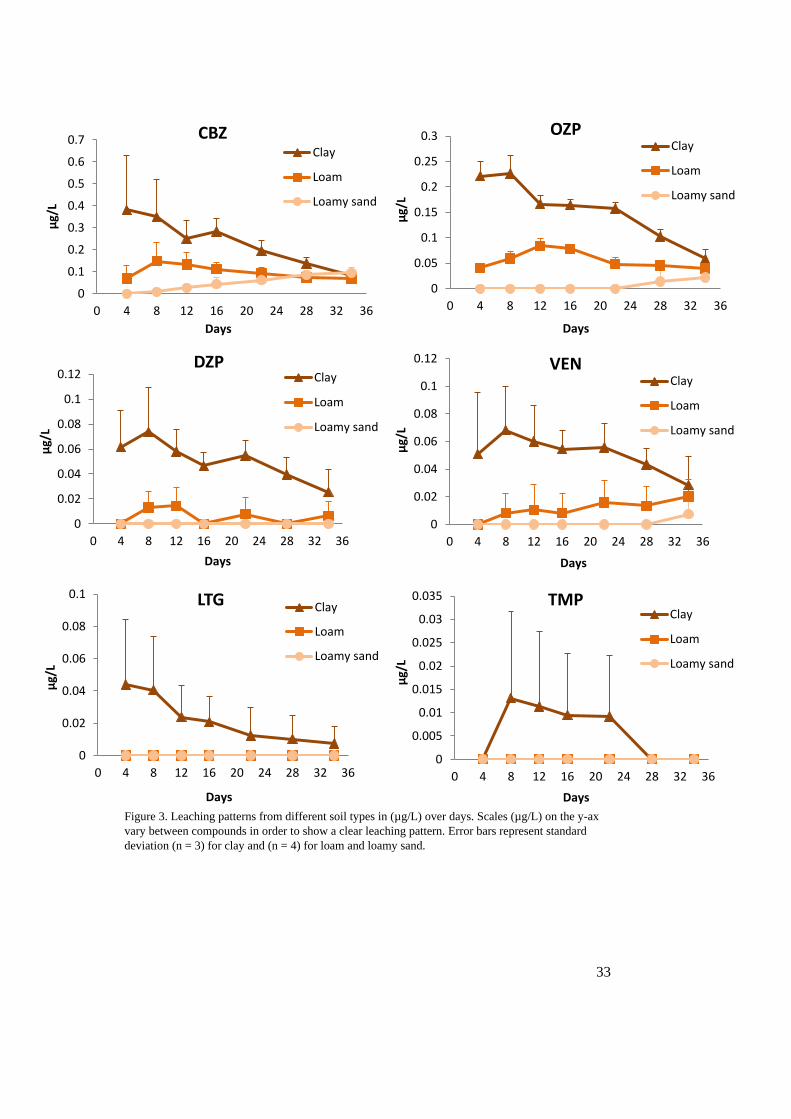
Figure 2. Leaching patterns from different soil types in (µg/L) over days. Scales (µg/L) on the y-ax
vary between compounds in order to show a clear leaching pattern. Error bars represent standard
deviation (n = 3) for clay and (n = 4) for loam and loamy sand.
0
0.1
0.2
0.3
0.4
0.5
0.6
0.7
0 4 8 12 16 20 24 28 32 36
µg/
L
Days
MET Clay
Loam
Loamy sand
0.00
0.05
0.10
0.15
0.20
0 4 8 12 16 20 24 28 32 36
µg/
L
Days
PRO Clay
Loam
Loamy sand
0
0.01
0.02
0.03
0 4 8 12 16 20 24 28 32 36
µg/
L
Days
ATL Clay
Loam
Loamy sand
0
0.01
0.02
0.03
0 4 8 12 16 20 24 28 32 36
µg/
L
Days
SRT Clay
Loam
Loamy sand
0
0.01
0.02
0.03
0.04
0 4 8 12 16 20 24 28 32 36
µg/
L
Days
FXT Clay
Loam
Loamy sand
0
0.05
0.1
0.15
0.2
0 4 8 12 16 20 24 28 32 36
µg/
L
Days
CIT Clay
Loam
Loamy sand
33
Figure 3. Leaching patterns from different soil types in (µg/L) over days. Scales (µg/L) on the y-ax
vary between compounds in order to show a clear leaching pattern. Error bars represent standard
deviation (n = 3) for clay and (n = 4) for loam and loamy sand.
0
0.1
0.2
0.3
0.4
0.5
0.6
0.7
0 4 8 12 16 20 24 28 32 36
µg/
L
Days
CBZ Clay
Loam
Loamy sand
0
0.05
0.1
0.15
0.2
0.25
0.3
0 4 8 12 16 20 24 28 32 36
µg/
L
Days
OZP Clay
Loam
Loamy sand
0
0.02
0.04
0.06
0.08
0.1
0.12
0 4 8 12 16 20 24 28 32 36
µg/
L
Days
DZP Clay
Loam
Loamy sand
0
0.02
0.04
0.06
0.08
0.1
0.12
0 4 8 12 16 20 24 28 32 36
µg/
L
Days
VEN Clay
Loam
Loamy sand
0
0.02
0.04
0.06
0.08
0.1
0 4 8 12 16 20 24 28 32 36
µg/
L
Days
LTG Clay
Loam
Loamy sand
0
0.005
0.01
0.015
0.02
0.025
0.03
0.035
0 4 8 12 16 20 24 28 32 36
µg/
L
Days
TMP Clay
Loam
Loamy sand

34
4.4 Comparison of leaching pattern
Figure 4. Highest, lowest and average values of (ng) absolute ß-blockers leached per soil column
depending on soil texture.
A difference in average mass leached from loam and clay can be seen for both
MET and PRO (Figure 4). The leaching of both MET and PRO was significantly
higher from clay than loam (p < 0.05, t-test, Table 5). For ATL there is no signifi-
cant difference (p > 0.05, t-test, Table 5) between mass leached from loam and
clay regarding the mean values of the mass leached (Figure 4).
0
1000
2000
3000
4000
5000
6000
Loamysand
Loam Clay Loamysand
Loam Clay Loamysand
Loam Clay
ATL PRO MET
ng
abso
lute
leac
he
d
Compound and soil type

35
Figure 5. Highest, lowest and average values of (ng) absolute antidepressants and TMP leached
depending on soil texture.
For anti-depressants the total leaching was significantly higher from clay than
loam for 4 out of 8 substances (p < 0.05, t-test, Table 5).
Table 5. P-value derived from student two sided t-test on 95 % significance level in the total ng
leached from different soil types, p < 0.05 shows significant differences (*)a.
Compound loamy sand vs loam loam vs clay loamy sand vs clay
ATL n.d. 0.678 n.d.
PRO n.d. 0.011* n.d.
MET 0.010* 0.027* 0.003*
CBZ 0.102 0.044* 0.010*
FXT n.d. 0.550 n.d.
CIT 0.060 0.157 0.102
DZP n.d. 0.010* n.d.
OZP 0.012* 0.046* 0.008*
LTG n.d. n.d. n.d.
SRT n.d. 0.413 n.d.
VEN 0.148 0.045* 0.011*
TMP n.d. n.d. n.d.
an.d. = not detected.
0
1000
2000
3000
4000
5000
6000
Loam
y sa
nd
Loam Cla
y
Loam
y sa
nd
Loam Cla
y
Loam
y sa
nd
Loam Cla
y
Loam
y sa
nd
Loam Cla
y
Loam
y sa
nd
Loam Cla
y
Loam
y sa
nd
Loam Cla
y
Loam
y sa
nd
Loam Cla
y
Loam
y sa
nd
Loam Cla
y
Loam
y sa
nd
Loam Cla
y
CBZ OZP DZP VEN CIT SRT LTG FXT TMP
ng
abso
lute
leac
he
d
Compound and soil type

36
4.5 Mass balance
For ATL, less than 1 % of the mass contained in the biosolids leached from both
loam and clay (Figure 6). For ATL, the percentage measured in the sludge of the
spiked concentration in the biosolids was less than 50 % (Table B1, Appendix).
For PRO, 1.8 % of the mass contained in the biosolids leached from clay and 0.2
% from loam (Figure 6). The percentage measured in the sludge of the spiked con-
centration of PRO in the biosolids was 129 % (Table B1, Appendix). Regarding
MET, differences in ratio leached can be seen to follow the leaching patter clay >
loam > loamy sand with 13 % > 2.4 % > 0.2 % absolute amount leached. The
percentage measured in the sludge of the spiked concentration of MET in the bio-
solids was 176 %. A higher concentration of PRO (366.1 µg/L) than of MET
(113.6 µg/L) was found in the biosolids (Table B1, Appendix).
For CBZ differences in ratio leached can be seen to follow the leaching patter
clay > loam > loamy sand with 15 % > 6.5 % > 3.5 % relative amount leached
(Figure 6). The percentage measured in the sludge of the spiked concentration of
CBZ in the biosolids was 157 % (Table B1, Appendix). For OZP more absolute
amount leached than for DZP in all soil types (Figure 6). The percentage measured
in the sludge of the spiked concentration in the biosolids for both compounds was
above 200 % (Table B1, Appendix). For VEN, 2.4 % of the mass contained in the
biosolids leached from clay and less than 0.5 % from loam and loamy sand (Figure
7). The percentage measured in the sludge of the spiked concentration in the bio-
solids of VEN was 141 % (Table B1, Appendix). For CIT and FXT, less than 0.5
% of the mass contained in the biosolids leached where FXT did not leach from
loamy and (Figure 7). For TMP, 0.5 % of the mass contained in the biosolids
leached from clay (Figure 7). For CIT and TMP, the percentage measured in the
sludge of the spiked concentration in the biosolids was above 200 % (Table B1,
Appendix). For FXT the percentage measured in the sludge of the spiked concen-
tration in the biosolids was 100 % (Table B1, Appendix). For LTG, less than 2 %
of the mass contained in the biosolids leached from clay (Figure 7). AMT was not
found in the leachate whereby absolute amount leached could not be measured.
The percentage measured in the sludge of the spiked concentration in the biosolids
was below 100 % (Table B1, Appendix).

37
Figure 6. Ratio of initial ng compound analysed in sludge (Mo) after spiking and average ng found in
leachate (M) from soil columns with different texture. Each bar representing a fraction (%) of initial
ng compound analysed in sludge (Mo) above each bar.
0.8 % 0.5 % 0 % 1.8 % 0.2 % 0 %
13 %
2.4 % 0.2 % 0%
10%
20%
30%
40%
50%
60%
70%
80%
90%
100%
Mo
Cla
y
Loam
Loam
y sa
nd
Mo
Cla
y
Loam
Loam
y sa
nd
Mo
Cla
y
Loam
Loam
y sa
nd
ATL PRO MET
15 %
6.5 % 3.5 %
7 % 3.6 % 0.5 % 5.8 % 0.6 % 0 % 0%
10%
20%
30%
40%
50%
60%
70%
80%
90%
100%
Mo
Cla
y
Loam
Loam
y sa
nd
Mo
Cla
y
Loam
Loam
y sa
nd
Mo
Cla
y
Loam
Loam
y sa
nd
CBZ OZP DZP

38
Figure 7. Ratio of initial ng compound analysed in sludge (Mo) after spiking and average ng found in
leachate (M) from soil columns with different texture. Each bar representing a fraction (%) of initial
ng compound analysed in sludge (Mo) above each bar.
2.4 % 0.4 % 0.1 % 0.2 % 0.1 % 0.1 % 0.3 % 0.3 % 0 % 1.8 % 0 % 0 % 0.5 % 0 % 0 % 0%
10%
20%
30%
40%
50%
60%
70%
80%
90%
100%
Mo
Cla
y
Loam
Loam
y sa
nd
Mo
Cla
y
Loam
Loam
y sa
nd
Mo
Cla
y
Loam
Loam
y sa
nd
Mo
Cla
y
Loam
Loam
y sa
nd
Mo
Cla
y
Loam
Loam
y sa
nd
VEN CIT FXT LTG TMP

39
5 Discussion
5.1 Effects of soil texture on leaching pattern.
It is seen that 9 out of 12 compounds leached in the order clay > loam > loamy
sand (CBZ, DZP, LTG, MET, OZP, PRO, SRT, TMP and VEN) (Figure 2, Figure
3, Table 5 and Table C5, Appendix). The leaching from clay was higher than the
loamy sand despite of the lower organic matter content of the loamy sand (1.24 %)
compared to clay (2.03 %) and despite of the lower clay content of the loamy sand
(4.30 %) compared to the clay (47.3 %). Previous batch and disturbed column
studies have shown adsorption of pharmaceuticals to clay fractions and organic
matter (Schaffer et al. 2012; Srinivasan et al. 2013 and Maszkowska et al. 2014).
High clay content leads to more adsorption sites compared to sandy soil due to a
larger specific surface area of the clay particles, thus, it would be assumed that the
pharmaceuticals would be retained to a larger extent in clay compared to loamy
sand. However, the higher leaching from clay suggests that the compounds are
transported by rapid flow through macropores that can occur in soils with high
clay fraction (Eriksson et al. 2005). The low and delayed leaching of 4 of the 5
compounds (CBZ, MET, OZP and VEN) that leached in the loamy sand suggests
uniform percolation through mesopores (Eriksson et al. 2005). Since undisturbed
soil columns preserve the soil structure and soil macropores (Lewis, J. & Sjöström,
J. 2010) it can be assumed that the undisturbed columns of this experiment facili-
tates transport through the soil structure.
Leaching of pharmaceuticals through macroporous flow has previously been
shown by Lapen et al. (2008), Larsbo et al. (2009a) and Edwards et al. (2009).
Furthermore, pharmaceutical transport through macroporous flow has been shown
by D’Alessio et al. (2014) who investigated estrogen transport in undisturbed soil
systems.

40
Since flow in macropores occurs with little or no interaction with the surround-
ing soil-matrix, the sorption of the compounds to clay and organic matter occurred
under non-equilibrium conditions. Macroporous flow in clay soils in the region of
Uppsala has been reported by Larsbo et al. (2009b), however with regards to herbi-
cide transport. Herbicides and pharmaceuticals can be thought to have similar
transport patterns with both groups being ionisable compounds with molecular
weights in similar range. Atrazine has been shown to be transported by
macroporous flow (Delwiche et al. 2014). With atrazine being a triazine and LTG
a phenoltriazine, it is likely that their transport behaviors are similar (Watelle et al.
1997; Delwiche et al. 2014). It can thus be expected that for ionisable compounds
such as pharmaceuticals, macroporous flow is the main transport pathway for the 9
compounds that showed increased leaching in clay.
FXT did not show a significant difference in leaching between loam and clay
(p > 0.05, t-test, Table 5). One explanation might be strong sorption to biosolids
which is in agreement with the high log Koc value (5.32) and the study from
Gottschall et al. (2012). With the organic carbon content of clay and loam being
similar (2.03 % and 2.45 %) and the high log Koc value of FXT (5.32), adsorption
to the organic carbon of the soil needs to be considered (Johnson et al. 2005; U.S.
EPA. 2012). CIT did not show a significant difference in leaching between the
different soil types (p > 0.05, t-test, Table 5). This might be explained by that CIT
was either sorbed to the sludge due to its high log Koc value (4.40) or retained in
the organic carbon of the soil (U.S. EPA. 2012). However, the data for CIT has to
be taken with caution since the percentage measured in the sludge was 247 % of
the spiked concentration (Table B1, Appendix) which indicate instrumental inter-
ferences.
ATL did not show a difference in leaching pattern (p > 0.05, t-test, Table 5)
with varying soil type in contrast to the other ß-blockers (i.e. MET and PRO)
(Figure 2). ATL was found in a lower concentration in the spiked sludge (23.2
µg/kg) than MET (225.5 µg/kg). The low measured concentration of ATL in the
sludge compared to the spiked concentration 45 % (Table B1, Appendix) indicate
degradation of the compound. This might explain why ATL did not show a differ-
ence in leaching pattern.
SRT showed no significant difference in absolute amount leached between the
loam and the clay (p > 0.05, t-test, Table 5). However, when looking at Figure 2, a
difference in leaching pattern can be seen with SRT starting to leach 14 days earli-
er from clay than loam. The retained pattern shows that there is a suggestion of
macroporous flow with faster transport through the clay.

41
Furthermore the slow leaching of SRT might be a result of the high log Dow val-
ue (5.29), indicating retention of the compound as shown by Petrie et al. (2014).
Johnson et al. (2005) also showed that SRT strongly sorb to sludge, which was
explained by the high log Koc value (5.53).
The compounds SOT and ZPD did not leach which can be explained by the fact
that they were not spiked and were not detected in the non-spiked sludge either
(Table B1, Appendix). AMT did also not leach but was however detected in both
non-spiked and spiked sludge (Table B1, Appendix). The compound has also pre-
viously been detected in Swedish sewage sludge (Fick et al. 2011). With the simi-
lar structure of AMT and CBZ it could be assumed that AMT leach in a similar
way, however it does not. This can be explained by the high log Koc value of AMT
(5.70) which suggest that it is strongly bound to either biosolids or the organic
carbon of the soil (U.S. EPA. 2012).
In general, the same volumes of artificial rainwater were added to the different
soil columns. However, the irrigation rate of 1.6 mm/day was not always main-
tained on a daily basis (Table C1, Appendix). Statistical analysis showed no sig-
nificant differences between total volume added and total volume leached (p >
0.05, t-test, Table C2 and Table C4, Appendix). Thereby it can be thought that the
inconsistent irrigation rate did not affect the leaching patterns of the compounds.
5.2 Correlation of physiochemical properties
A correlation matrix was done correlating the physiochemical properties of the
pharmaceuticals and their leaching behavior. Low correlation was found when
including all pharmaceuticals investigated (Figure E1, Appendix). No correlation
could be performed for the pharmaceutical groups ß-blockers and antibiotics since
only 3 and 1 compound, respectively, were detected in the leachate. Thus a corre-
lation was only performed for antidepressants (Figure 8).

42
Figure 8. Spearman correlation matrix showing correlation between physiochemical properties of
antidepressants and leaching behavior. -1 stands for negative correlation whilst 1 stands for positive.
Positive correlation indicates that variables on the y-axis increase when the variables on the x-axis
increase. Negative correlation indicates that variables on the y-axis decrease when the variables on
the x-axis increase. Blank boxes indicate significant correlation between the y and x variables.
Antidepressants
For the antidepressants, the leaching amount of individual compounds was gen-
erally higher for clay compared to loam and loamy sand and decreased as follows:
CBZ > OZP > DZP > VEN > LTG (Figure 6 and Figure 7). Log Dow can be seen
to be significantly negatively correlated with the relative leaching, with leaching
decreasing when log Dow is increasing (Figure 8). Decreased leaching due to high
log Dow values has previously been shown by Petrie et al. (2014). The relative
mass of CBZ, OZP and DZP leached from clay ranged between 5 % and 15 %
compared to the total concentration in the sludge (Figure 6 and Figure 7). The
peak of the leaching was reached at day 4 (CBZ) and day 8 (OZP and DZP) and
decreased continuously until day 34 which indicate that that the remaining 95% to
85 % is either retained in the soil, sludge or that it is degraded. The pharmaceuti-
cals with a high DT50 (i.e. FXT, LTG and VEN) are probably adsorbed to the soil
or sludge and the ones with low DT50 (i.e. CBZ, OZP and DZP) might have de-
graded.
43
De Wilde et al. (2009) showed high DT50 values for pesticides to indicate strong
sorption to soil due to reduced bioavailability. Thus, the lack of correlation of
DT50 values with the significant correlation of log Dow (Figure 8) suggests the
remaining pharmaceuticals to be adsorbed to the soil matrix. This can also be be-
lieved with the leachate pH (pH 3.6 ± 0.2, Table D2, Appendix) being below the
pKa for CBZ, CIT, FXT, LTG, OZP, SRT and VEN (Table 1) giving that they are
cationic and would thus bind to the permanent negatively charged clay surfaces
(Maszkowska et al. 2014).
Figure 8 show significant negative correlation for log Koc and leaching
(p < 0.05, spearman correlation) where leaching decreases with increased log Koc
in leaching from clay. This is to be expected since pharmaceuticals are known to
sorb to organic carbon (Cunningham, V. & Kümmerer, K. 2008). From this study
it can not be determined if the pharmaceuticals are sorbed to the organic carbon in
the sludge or the soil. However, if investigating the organic fraction of the sludge
(8.6 %, Table 3) and clay (2.23 %, Table 2) an indication is given that the pharma-
ceuticals might be sorbed stronger to sludge compared to clay. However, further
research is needed since the pH of the biosolids also affect sorption (Cunningham,
V. & Kümmerer, K. 2008) and the pH of the leachate (pH 3.6 ± 0.2, Table D2,
Appendix) and sludge (pH 7.5, Table 3) differ. No significant correlation can be
seen for log Koc and leaching from loam and loamy sand (p > 0.05, spearman cor-
relation). This is believed to be due to too few data points (n = 6 and n = 4 respec-
tively). Figure 8 shows no significant correlation between Sw and leaching (p >
0.05, spearman correlation) which ranged between 17.7 mg/L and 267 mg/L.
No significant correlation can be seen in Figure 8 between Mw and leaching
(p > 0.05, spearman correlation). This is to be expected with the compounds hav-
ing molar weights in the similar range (236 – 324 g/mole). No significant correla-
tion can be seen between DT50 and leaching (p > 0.05, spearman correlation). This
might be explained by that the DT50 values are high (i.e. 54 – 360 days) compared
to the duration of the study, 34 days. Thus, the compounds might not have had
time to degrade and thereby correlations cannot be seen. No difference in correla-
tion between leaching between log Dow and log Pow could be seen (Table D1, Ap-
pendix). This can be seen as an indication that when looking at leaching behavior
of pharmaceuticals in biosolids both values can be used.
44
ß-blockers
Due to lack of data points (n = 3), no correlation matrix could be made for ß-
blockers. However, from Figure 4 and 6 it can be seen that the ß-blockers leached
in the magnitude of MET > PRO > ATL. The larger leaching of MET than PRO
can be explained by the log Dow value of the compounds, MET having a lower log
Dow value (1.92) than PRO (3.48). As shown by Petrie et al. (2014), compounds
with a low log Dow have a high tendency to leach. This suggests that log Dow is a
relevant indicator to use when correlating leaching behavior of ß-blockers. MET
also has a higher Sw value (16 900 mg/L) than PRO (61.7 mg/L) and also leached
to a larger extent than PRO. According to U.S. EPA. (2012) and Petrie et al.
(2014) compounds with a Sw value between 1000 and 10 000 mg/L have a high
leaching potential. This indicates that solubility might also be a parameter relevant
to take in to account when investigating leaching.
The lower relative amount leached of ATL compared to MET could be due to
degradation. However, the DT50 values of the compounds are both 75 days indicat-
ing that they would degrade equally as fast. These DT50 values are however mod-
elled (ChemSpider, EPISuite (PCKOCWIN v1.66), 2015) and when looking look-
ing at data derived under natural conditions differences can be seen. Ramil et al.
(2009) found PRO, MET and ATL to degrade in water/sediment in the following
magnitude of 33 > 24 > 3 days. These values cannot be used to estimate the degra-
dation in soil but gives an indication of the magnitude and variation between the
degradation of ATL and MET. It can thereby be thought that DT50 values derived
under natural conditions are important factors to consider when investigating
leaching of ß-blockers.
Antibiotics
With only TMP leaching, no correlation matrix could be made for antibiotics
(Figure 8). TMP is the only compound from the group diaminopyrimidine which
makes it difficult to compare its leaching behavior with the other investigated
compounds. TMP is a zwitterionic compound as ZMX and the FQs, where ZMX
and FQs have been shown to be removed from sludge to a lesser degree than TMP
(Lindberg et al. 2006). This indicates that TMP has a lower tendency to sorb to
sludge and thus has a higher leaching potential.
The FQs did not leach and were not found in neither the spiked or non-spiked
sludge (Table A1 – A3 and Table B1, Appendix). Although, CFX, OFX and NFX
have low log Pow of 0.28, -0.39 and 0.46, respectively, which suggest high leach-
ing potential (Petrie et al. 2014).

45
The high DT50 values of the compounds (i.e. 120, 198 and 189 days) suggest
that they have limited bioavailability and thereby predicted not to leach (De Wilde
et al. 2009). Golet et al. (2003), Lindberg et al. (2006), Lindberg et al. (2007) and
Gottschall et al. (2012) have showed a strong sorption of FQs to biosolids and the
limited mobility of the compounds. This suggests that the FQs of this experiment
are most likely to be adsorbed to the sludge, despite their low log Koc values (1.55
and 1.65, 1.97 for CFX, OFX and NFX respectively) (U.S. EPA, 2012). However,
further research is needed since pH of the biosolids might also affect the sorption
of these compounds (Cunningham, V. & Kümmerer, K. 2008) and the pH of the
leachate and sludge differ (Table D2, Appendix and Table 3).
The macrolides AZC, CLC and RXC did not leach (Table A1 – A3 and Table
B1, Appendix) and were also not detected in the non-spiked biosolids (Table B1,
Appendix) despite that they have been detected in biosolids in Sweden (Fick et al.
2011). The log Pow values of AZC (4.02) and RXC (3.16) indicate that they show
tendency to leach. RXC has a log Pow of 2.75 and should according to Petrie et al.
(2014) leach but it did not in this study. The Koc values for these compound could
not be found, however, their high molecular weights (747.95, 748.98 and 873.05
g/mole) indicate that they would sorb strongly (Pal et al. 2010). The ability for
macrolides to sorb to biosolids has been confirmed by Hollis, J. (1991) who classi-
fied the compounds as immobile. Thus molecular weight might be a good correla-
tion factor for leaching of macrolides with less leaching due to higher molecular
weight.

46
6 Conclusions and future perspectives The main conclusion of this study is that soil texture can be seen to affect leaching
pattern and concentrations of pharmaceuticals from biosolids amended soils at
environmental relevant concentrations. This study also shows that log Dow is sig-
nificantly negatively correlated with leaching of pharmaceuticals (p < 0.05,
spearman correlation). This can be explained by the fact that pharmaceuticals with
a high log Dow are potentially stronger sorbed to soil. This indicates that log Dow is
a relevant factor to consider when predicting leaching of pharmaceuticals. The
study also showed the need of considering other physicochemical properties such
as log Koc, DT50 and Sw when predicting the risk of leaching of pharmaceuticals.
The study showed no difference in correlating leaching with log Dow or log Pow. By
this it can be concluded that when predicting leaching of pharmaceuticals from
biosolids both log Dow and log Pow can be used.
The results of this study shows higher leaching of pharmaceuticals in clay com-
pared to loam and loamy sand using undisturbed soil columns investigating the top
soil layer. In order to fully understand the leaching behavior of pharmaceuticals
the whole soil profile should be investigated, for example by large field-scale ly-
simeter studies. Usage of field-scale lysimeters would better predict actual field
conditions by taking into account natural parameters such as temperature, rainfall
but also change in biological activity and pH along the depth of the profile. These
factors influence degradation and sorption of pharmaceuticals and should be inves-
tigated in order to better understand the transport of the compounds. Furthermore,
the width of lysimeters would enable investigation of natural sized macropores.
Natural leaching processes such as surface runoff that occur in the field needs to
be investigated in the future.
Ultimately, the results and future perspectives of this study show that there is a
need to revise the current legislation for biosolids application on arable land.

47
References Adolfsson-Erici, M., Pettersson, M., Wahlberg, C., & Asplund, L. (2005). Östrogena ämnen i
avloppsvatten, slam och lagrad urin (in Swedish).
Bonnet, U., Bingmann, D., Wiltfang, J., Scherbaum, N., & Wiemann, M. (2010). Modulatory effects
of neuropsychopharmaca on intracellular pH of hippocampal neurones in vitro. British journal of
pharmacology, 159(2), 474-483.
Boxall, A. B. A., & Kümmerer, K. (2008). Pharmaceuticals in the environment: sources, fate, effects
and risks. Third Edition103.
Blackwell, P. A., Kay, P., Ashauer, R., & Boxall, A. B. (2009). Effects of agricultural conditions on
the leaching behaviour of veterinary antibiotics in soils. Chemosphere, 75(1), 13-19.
Calisto, V., & Esteves, V. I. (2009). Psychiatric pharmaceuticals in the environment. Chemosphere,
77(10), 1257-1274.
Carter, L. J., Garman, C. D., Ryan, J., Dowle, A., Bergstrom, E., Thomas-Oates, J., & Boxall, A. B.
(2014). Fate and uptake of pharmaceuticals in soil–earthworm systems. Environmental science &
technology, 48(10), 5955-5963.
Chefetz, B., Mualem, T., Ben-Ari, J., (2008). Sorption and mobility of pharmaceutical compounds in
soil irrigated with reclaimed wastewater. Chemosphere 73 (8), 1335–1343.
Cunningham, V., & Kümmerer, K. (2008). Pharmaceuticals in the environment: sources, fate, effects
and risks. Third Edition103.
D'Alessio, M., Vasudevan, D., Lichwa, J., Mohanty, S. K., & Ray, C. (2014). Fate and transport of
selected estrogen compounds in Hawaii soils: Effect of soil type and macropores. Journal of con-
taminant hydrology, 166, 1-10.
Dang, V., Nanda, N., Cooper, T. W., Greenfield, R. A., & Bronze, M. S. (2007). Part VII. Macro-
lides, azalides, ketolides, lincosamides, and streptogramins. The Journal of the Oklahoma State
Medical Association, 100(3), 75-81.
De Wilde, T., Mertens, J., Šimunek, J., Sniegowksi, K., Ryckeboer, J., Jaeken, P., ... & Spanoghe, P.
(2009). Characterizing pesticide sorption and degradation in microscale biopurification systems
using column displacement experiments. Environmental Pollution, 157(2), 463-473.
Delwiche, K. B., Lehmann, J., & Walter, M. T. (2014). Atrazine leaching from biochar-amended
soils. Chemosphere, 95, 346-352.
Durán–Álvarez, J. C., Prado, B., Ferroud, A., Juayerk, N., & Jiménez-Cisneros, B. (2014). Sorption,
desorption and displacement of ibuprofen, estrone, and 17β estradiol in wastewater irrigated and
rainfed agricultural soils. Science of the Total Environment, 473, 189-198.
Edwards, M., Topp, E., Metcalfe, C. D., Li, H., Gottschall, N., Bolton, P., ... & Lapen, D. R. (2009).
Pharmaceutical and personal care products in tile drainage following surface spreading and injec-

48
tion of dewatered municipal biosolids to an agricultural field. Science of the total environment,
407(14), 4220-4230.
Engelhardt, I., Sittig, S., Šimůnek, J., Groeneweg, J., Pütz, T., & Vereecken, H. (2015). Fate of the
antibiotic sulfadiazine in natural soils: Experimental and numerical investigations. Journal of
contaminant hydrology, 177, 30-42.
Eriksson, J., Nilsson, I., & Simonsson, M. (2005). Wiklandes marklära. Studentlitteratur.
Fenet, H., Mathieu, O., Mahjoub, O., Li, Z., Hillaire-Buys, D., Casellas, C., & Gomez, E. (2012).
Carbamazepine, carbamazepine epoxide and dihydroxycarbamazepine sorption to soil and occur-
rence in a wastewater reuse site in Tunisia. Chemosphere, 88(1), 49-54.
Fick, J., Lindberg, R. H., Kaj, L., & Brorström-Lundén, E. (2011). Results from the Swedish Nation-
al Screening Programme 2010, Subreport 3. Pharmaceuticals. Report B 2014 IVL, Swedish Envi-
ronmental Research Institute Lt.
Goldstein, M., Shenker, M., & Chefetz, B. (2014). Insights into the uptake processes of wastewater-
borne pharmaceuticals by vegetables. Environmental science & technology, 48(10), 5593-5600.
Golet, E. M., Xifra, I., Siegrist, H., Alder, A. C., & Giger, W. (2003). Environmental exposure as-
sessment of fluoroquinolone antibacterial agents from sewage to soil. Environmental Science &
Technology, 37(15), 3243-3249.
Gottlieb, S. S., & McCarter, R. J. (2001). Comparative effects of three beta blockers on survival after
acute myocardial infarction. The American journal of cardiology, 87(7), 823-826.
Gottschall, N., Topp, E., Metcalfe, C., Edwards, M., Payne, M., Kleywegt, S., & Lapen, D. R.
(2012). Pharmaceutical and personal care products in groundwater, subsurface drainage, soil, and
wheat grain, following a high single application of municipal biosolids to a field. Chemosphere,
87(2), 194-203.
Haglund, P., & Olofsson, U., (2012). Miljöövervakning av utgående vatten och slam från svenska
avloppsreningsverk. Resultat från år 2010 och en sammanfattning av slamresultaten från åren
2004 - 2010. Rapport från Umeå universitet till Naturvårdsverket (in Swedish).
Hamscher, G., Pawelzick, H. T., Höper, H., & Nau, H. (2005). Different behavior of tetracyclines
and sulfonamides in sandy soils after repeated fertilization with liquid manure. Environmental
toxicology and chemistry, 24(4), 861-868.
Helmfrid, I., & Eriksson, C. (2010). Läkemedelsrester från sjukhus och avloppsreningsverk. Land-
stinget i Östergötland. Rapport 2010:1 (in Swedish).
Hollis, J. M. (1991). Mapping the vulnerability of aquifers and surface waters to pesticide contami-
nation at the national/regional scale. Pesticides in Soils and Water, BCPC Monograph, (47), 165-
174.
Jarvis, N. J. (2007). A review of non‐equilibrium water flow and solute transport in soil macropores:
principles, controlling factors and consequences for water quality. European Journal of Soil Sci-
ence, 58(3), 523-546
Jarvis, N., Etana, A., & Stagnitti, F. (2008). Water repellency, near-saturated infiltration and prefer-
ential solute transport in a macroporous clay soil. Geoderma, 143(3), 223-230.
Johnson, D. J., Sanderson, H., Brain, R. A., Wilson, C. J., Bestari, K. J. T., & Solomon, K. R. (2005).
Exposure assessment and microcosm fate of selected selective serotonin reuptake inhibitors. Reg-
ulatory Toxicology and Pharmacology, 42(3), 313-323.
Kay, P., Blackwell, P. A., & Boxall, A. (2004). Fate of veterinary antibiotics in a macroporous tile
drained clay soil. Environmental Toxicology and Chemistry, 23(5), 1136-1144.
Kees, F., Holstege, A., Ittner, K. P., Zimmermann, M., Lock, G., Scholmerich, J., & Grobecker, H.
(2000). Pharmacokinetic interaction between proton pump inhibitors and roxithromycin in volun-
teers. Alimentary Pharmacology and Therapeutics, 14(4), 407-412.

49
Kreuzig, R., & Höltge, S. (2005). Investigations on the fate of sulfadiazine in manured soil: laborato-
ry experiments and test plot studies. Environmental Toxicology and Chemistry, 24(4), 771-776.
Kumar, K., Gupta, S. C., Chander, Y., & Singh, A. K. (2005). Antibiotic use in agriculture and its
impact on the terrestrial environment. Advances in agronomy, 87, 1-54.
Lapen, D. R., Topp, E., Metcalfe, C. D., Li, H., Edwards, M., Gottschall, N., ... & Beck, A. (2008).
Pharmaceutical and personal care products in tile drainage following land application of munici-
pal biosolids. Science of the Total Environment, 399(1), 50-65.
Larsbo, M., Lapen, D. R., Topp, E., Metcalfe, C., Abbaspour, K. C., & Fenner, K. (2009a). Simula-
tion of pharmaceutical and personal care product transport to tile drains after biosolids applica-
tion. Journal of environmental quality, 38(3), 1274-1285.
Larsbo, M., Stenström, J., Etana, A., Börjesson, E., & Jarvis, N. J. (2009b). Herbicide sorption, deg-
radation, and leaching in three Swedish soils under long-term conventional and reduced tillage.
Soil and Tillage research, 105(2), 200-208.
Larsbo, M., Löfstrand, E., de Veer, D. V. A., & Ulén, B. (2013). Pesticide leaching from two Swe-
dish topsoils of contrasting texture amended with biochar. Journal of contaminant hydrology,
147, 73-81.
Lewis, J., & Sjöström, J. (2010). Optimizing the experimental design of soil columns in saturated and
unsaturated transport experiments. Journal of Contaminant Hydrology, 115(1), 1-13.
Li, H., Sumarah, M. W., & Topp, E. (2013a). Persistence and dissipation pathways of the antidepres-
sant sertraline in agricultural soils. Science of The Total Environment, 452, 296-301.
Li, H., Sumarah, M. W., & Topp, E. (2013b). Persistence of the tricyclic antidepressant drugs ami-
triptyline and nortriptyline in agriculture soils. Environmental Toxicology and Chemistry, 32(3),
509-516.
Lindberg, R. H., Wennberg, P., Johansson, M. I., Tysklind, M., & Andersson, B. A. (2005). Screen-
ing of human antibiotic substances and determination of weekly mass flows in five sewage treat-
ment plants in Sweden. Environmental Science & Technology, 39(10), 3421-3429.
Lindberg, R. H., Olofsson, U., Rendahl, P., Johansson, M. I., Tysklind, M., & Andersson, B. A.
(2006). Behavior of fluoroquinolones and trimethoprim during mechanical, chemical, and active
sludge treatment of sewage water and digestion of sludge. Environmental science & technology,
40(3), 1042-1048.
Lindberg, R. H., Björklund, K., Rendahl, P., Johansson, M. I., Tysklind, M., & Andersson, B. A.
(2007). Environmental risk assessment of antibiotics in the Swedish environment with emphasis
on sewage treatment plants. Water research, 41(3), 613-619.
Lindberg, R. H., Fick, J., & Tysklind, M. (2010). Screening of antimycotics in Swedish sewage
treatment plants–Waters and sludge. Water research, 44(2), 649-657.
Löffler, D., Römbke, J., Meller, M., & Ternes, T. A. (2005). Environmental fate of pharmaceuticals
in water/sediment systems. Environmental Science & Technology, 39(14), 5209-5218.
Manallack, D. T. (2007). The pKa distribution of drugs: application to drug discovery. Perspectives
in medicinal chemistry, 1, 25.
Maszkowska, J., Stolte, S., Kumirska, J., Łukaszewicz, P., Mioduszewska, K., Puckowski, A., ... &
Białk-Bielińska, A. (2014). Beta-blockers in the environment: Part I. Mobility and hydrolysis
study. Science of the Total Environment, 493, 1112-1121.
Muzina, D. J., Elhaj, O., Gajwani, P., Gao, K., & Calabrese, J. R. (2005). Lamotrigine and antiepi-
leptic drugs as mood stabilizers in bipolar disorder. Acta Psychiatrica Scandinavica, 111, 21-28
Oppel, J., Broll, G., Löffler, D., Meller, M., Römbke, J., & Ternes, T. (2004). Leaching behaviour of
pharmaceuticals in soil testing-systems: a part of an environmental risk assessment for groundwa-
ter protection. Science of the total environment, 328(1), 265-273.

50
Pal, A., Gin, K. Y. H., Lin, A. Y. C., & Reinhard, M. (2010). Impacts of emerging organic contami-
nants on freshwater resources: review of recent occurrences, sources, fate and effects. Science of
the Total Environment, 408(24), 6062-6069.
Petrie, B., Barden, R., & Kasprzyk-Hordern, B. (2014). A review on emerging contaminants in
wastewaters and the environment: Current knowledge, understudied areas and recommendations
for future monitoring. Water research. 72, 3-27.
R Core Team. (2015). R: A language and environment for statistical computing. R Foundation for
Statistical Computing, Vienna, Austria.
Ramil, M., El Aref, T., Fink, G., Scheurer, M., & Ternes, T. A. (2009). Fate of beta blockers in
aquatic-sediment systems: sorption and biotransformation. Environmental science & technology,
44(3), 962-970.
Remberger, M., Wiklund, P., Woldegiorgis, A., Viktor, T., Kaj, L., & Brorström-Lundén, E. (2009).
Anti-inflammatory and analgesic drugs in WWTP influent and effluent streams and the occur-
rence in the aquatic environment. IVL Swedish Environmental Research Institute Report
Richards, B. K., Steenhuis, T. S., Peverly, J. H., & McBride, M. B. (2000). Effect of sludge-
processing mode, soil texture and soil pH on metal mobility in undisturbed soil columns under
accelerated loading. Environmental Pollution, 109(2), 327-346.
Schaffer, M., Boxberger, N., Börnick, H., Licha, T., & Worch, E. (2012). Sorption influenced
transport of ionisable pharmaceuticals onto a natural sandy aquifer sediment at different pH.
Chemosphere, 87(5), 513-520.
Schlüsener, M. P., & Bester, K. (2006). Persistence of antibiotics such as macrolides, tiamulin and
salinomycin in soil. Environmental Pollution, 143(3), 565-571.
Schwarzenbach, R. P., Gschwend, P. M., & Imboden, D. M. (2005). Environmental organic chemis-
try. John Wiley & Sons.
Srinivasan, P., Sarmah, A. K., & Manley-Harris, M. (2013). Co-contaminants and factors affecting
the sorption behaviour of two sulfonamides in pasture soils. Environmental Pollution, 180, 165-
172.
Svanbäck, Annika and Ulen, Barbro and Etana, Ararso and Bergström, Lars and Kleinman, Peter
J.A. and Mattsson, Lennart (2013). Influence of soil phosphorus and manure on phosphorus
leaching in Swedish topsoils. Nutrient cycling in agroecosystems. 96:2-3, 133-147 (Peer-review)
Swedish EPA. (2013). Hållbar återföring av fosfor: Naturvårdsverkets redovisning av ett uppdrag
från regeringen. The Swedish National Environmental Protection agency, Rapport 6580 (in Swe-
dish).
Takamatsu, T., Koshikawa, M. K., Watanabe, M., Hou, H., & Murata, T. (2007). Design of a meso‐
scale indoor lysimeter for undisturbed soil to investigate the behaviour of solutes in soil. Europe-
an journal of soil science, 58(1), 329-334.
Thiele‐Bruhn, S. (2003). Pharmaceutical antibiotic compounds in soils–a review. Journal of Plant
Nutrition and Soil Science, 166(2), 145-167.
Tolls, J. (2001). Sorption of veterinary pharmaceuticals in soils: a review. Environmental science &
technology, 35(17), 3397-3406.
Topp, E., Monteiro, S. C., Beck, A., Coelho, B. B., Boxall, A. B., Duenk, P. W., ... & Metcalfe, C. D.
(2008). Runoff of pharmaceuticals and personal care products following application of biosolids
to an agricultural field. Science of the Total Environment, 396(1), 52-59.
Unold, M., Šimůnek, J., Kasteel, R., Groeneweg, J., & Vereecken, H. (2009). Transport of manure-
based applied sulfadiazine and its main transformation products in soil columns. Vadose Zone
Journal, 8(3), 677-689

51
U.S. EPA. (2012). Sustainable Futures/P2 Framework Manual. Office of Chemical Safety and Pollu-
tion Prevention (7403M) EPA-748-B12-001, 2012. United States Environmental Protection
Agency.
Vasskog, T., Berger, U., Samuelsen, P. J., Kallenborn, R., & Jensen, E. (2006). Selective serotonin
reuptake inhibitors in sewage influents and effluents from Tromsø, Norway. Journal of Chroma-
tography A, 1115(1), 187-195.
Wahlberg, C., Björlenius, B., & Paxéus, N. (2010). Läkemedelsrester i Stockholms vattenmiljö.
Förekomst, förebyggande åtgärder och refining av avloppsvatten. Stockholm Vatten AB.
Watelle, M., Demedts, P., Franck, F., De Deyn, P. P., Wauters, A., & Neels, H. (1997). Analysis of
the antiepileptic phenyltriazine compound lamotrigine using gas chromatography with nitrogen
phosphorus detection. Therapeutic drug monitoring, 19(4), 460-464.
Wu, C., Spongberg, A. L., Witter, J. D., Fang, M., Czajkowski, K. P., & Ames, A. (2010). Dissipa-
tion and leaching potential of selected pharmaceutically active compounds in soils amended with
biosolids. Archives of environmental contamination and toxicology, 59(3), 343-351.
Yaron, B. (1989). General principles of pesticide movement to groundwater. Agriculture, ecosystems
& environment, 26(3), 275-297.
Young, R. B., Chefetz, B., Liu, A., Desyaterik, Y., & Borch, T. (2014). Direct photodegradation of
lamotrigine (an antiepileptic) in simulated sunlight–pH influenced rates and products. Environ-
mental Science: Processes & Impacts, 16(4), 848-857.
6.1 Internet references ChemIDPlus Advanced , (2015-04-15)
http://chem.sis.nlm.nih.gov/chemidplus/ [2015-03-28]
ChemSpider. EPISuite (PCKOCWIN v1.66) (2015-04-15)
http://www.chemspider.com/ [2015-03-28]
ChemSpider. EPIISuite. Fugacity model (III) (2015-04-15)
http://www.chemspider.com/ [2015-03-29]
Fass., (2015-04-28)
http://www.fass.se [2015-03-29]
Pedosphere, (2015-02-01)
http://www.pedosphere.com/resources/bulkdensity/triangle_us.cfm [2015-04-22]
Svenskt Vatten, (2015-05-01)a. REVAQ, Regler för certifieringssystemet
http://www.svensktvatten.se/Vattentjanster/Avlopp-och-Miljo/REVAQ/Certifiering/REVAQ-
regler/ [2015-04-22]
Svenskt Vatten, (2015-04-14)b. Manual för bedömning av lakvatten inom REVAQ.
http://www.svensktvatten.se/Vattentjanster/Avlopp-och-Miljo/REVAQ/Certifiering/REVAQ-
regler/ [2015-04-22]
Svenskt Vatten, (2014-10-20). REVAQ, Vanliga frågor och svar
http://www.svensktvatten.se/Global/Avlopp%20och%20milj%c3%b6/Revaq/REVAQ%20vanlig
a%20fra%cc%8agor%20och%20svar%20141020.pdf [2014-11-15]
Swedish EPA, (2001). SNFS, S. (1994). 2. Kungörelse med föreskrifter om skydd för miljön, särskilt
marken, när avloppsslam används i jordbruket.
http://www.naturvardsverket.se/Stod-i-miljoarbetet/Rattsinformation/Foreskrifter-allmanna-
rad/NFS/1994/SNFS-19942---Skydd-for-miljon-nar-avloppsslam-anvands-i-jordbruket/ [2015-
04-22]
52
Swedish Board of Agriculture, (2013). SJVFS 2004:62. Föreskrifter och allmänna råd om
miljöhänsyn i jordbruket vad avser växtnäring.
http://www.jordbruksverket.se/forfattningar/forfattningssamling/2004.4.50cb902d1234ca17a7e80
001328.html [2015-04-22]
Uppsala Vatten och Avfall AB (2013). Miljörapport 2013, Kungsängsverket.
http://www.uppsalavatten.se/sv/omoss/Anlaggningar/VA-anlaggningar/Avloppsreningsverk/
[2015-04-14]
Veolia Vatten, (2014-11-20). Användning av slam i jordbruket
http://www.veoliavatten.se/sweden/ressources/documents/1/3425,Anvandning-av-slam-i-
jordbruket.pdf [2014-12-08]
53
Appendix A Table A1. Average leaching concentrations (µg/L) in loamy sand with standard deviations (±). N.d.
stands for not detected and (0.017 – 0.03 µg/L) < LOQ are concentrations below the lowest concen-
tration detected on the calibration curve. For clay (n = 3), loam (n = 4) and loamy clay (n = 4).
Days 4 8 12 16 22 28 34
ATL n.d n.d n.d < LOQ < LOQ < LOQ n.d
AMT n.d n.d n.d n.d n.d n.d n.d
PRO n.d n.d < LOQ n.d n.d n.d
MET n.d n.d < LOQ < LOQ < LOQ
0.0085 ±
0.015
0.0103 ±
0.022
SOT n.d n.d n.d n.d n.d n.d n.d
CBZ < LOQ
0.008 ±
0.014
0.0263 ±
0.017
0.0438 ±
0.028
0.0620 ±
0.023
0.0851 ±
0.021
0.0947 ±
0.025
FXT n.d n.d n.d n.d n.d n.d n.d
CIT n.d
0.1182 ±
0.008 n.d < LOQ n.d n.d n.d
DZP n.d n.d n.d n.d n.d < LOQ < LOQ
OZP n.d n.d n.d n.d n.d
0.0141 ±
0.024
0.0215 ±
0.037
LTG n.d n.d n.d n.d n.d n.d < LOQ
SRT n.d n.d n.d n.d n.d n.d n.d
VEN n.d n.d < LOQ n.d < LOQ < LOQ
0.0075 ±
0.013
ZPD n.d n.d n.d n.d n.d n.d n.d
TPM n.d n.d n.d n.d < LOQ n.d n.d
AZC n.d n.d n.d n.d n.d n.d n.d
CFX n.d n.d n.d n.d n.d n.d n.d
CLC n.d n.d n.d n.d n.d n.d n.d
NFX n.d n.d n.d n.d n.d n.d n.d
OFX n.d n.d n.d n.d n.d n.d n.d
RXC n.d n.d n.d n.d n.d n.d n.d
SMX n.d n.d n.d n.d n.d n.d n.d

54
Table A2. Average leaching concentrations (µg/L) in loam with standard deviations (±).N.d. stands
for not detected and (0.017 – 0.03 µg/L) < LOQ are concentrations below the lowest concentration
detected on the calibration curve. For clay (n = 3), loam (n = 4) and loamy clay (n = 4).
Days 4 8 12 16 22 28 34
ATL n.d n.d
0.0077 ±
0.0134 n.d n.d n.d
< LOQ
AMT n.d n.d n.d n.d n.d n.d n.d
PRO < LOQ
0.01371±
0.0139
0.01453 ±
0.025
0.00989 ±
0.017
0.0231 ±
0.039
0.01906 ±
0.019
0.01842 ±
0.018
MET
0.04906 ±
0.049
0.09075 ±
0.057
0.09479 ±
0.053
0.09317 ±
0.029
0.0900 ±
0.039
0.0645 ±
0.016
0.0715 ±
0.032
SOT n.d n.d n.d n.d n.d n.d n.d
CBZ
0.0691 ±
0.057
0.1478 ±
0.085
0.1327 ±
0.054
0.1116 ±
0.032
0.0938 ±
0.026
0.0740 ±
0.020
0.0688 ±
0.021
FXT n.d
0.03150
±0.003 n.d n.d n.d n.d n.d
CIT n.d
0.1279 ±
0.016
0.0065 ±
0.011 < LOQ
0.00674 ±
0.011
0.0103±
0.018
0.0109 ±
0.019
DZP < LOQ
0.0131
±0.013
0.0145 ±
0.015 < LOQ
0.0078 ±
0.014 < LOQ
0.0065 ±
0.011
OZP
0.0407 ±
0.041
0.0594 ±
0.059
0.0839 ±
0.03
0.0785 ±
0.019
0.04806 ±
0.028
0.0458 ±
0.005
0.0398 ±
0.024
LTG < LOQ < LOQ < LOQ < LOQ < LOQ < LOQ < LOQ
SRT n.d n.d n.d n.d n.d
0.00683 ±
0.012
0.0064 ±
0.011
VEN n.d
0.00807 ±
0.014
0.01062 ±
0.018
0.0082 ±
0.014
0.01582 ±
0.015
0.0135 ±
0.0135
0.0202 ±
0.012
ZPD n.d n.d n.d n.d n.d n.d n.d
TPM n.d n.d n.d n.d < LOQ < LOQ < LOQ
AZC n.d n.d n.d n.d n.d n.d n.d
CFX n.d n.d n.d n.d n.d n.d n.d
CLC n.d n.d n.d n.d n.d n.d n.d
NFX n.d n.d n.d n.d n.d n.d n.d
OFX n.d n.d n.d n.d n.d n.d n.d
RXC n.d n.d n.d n.d n.d n.d n.d
SMX n.d n.d n.d n.d n.d n.d n.d

55
Table A3. Average leaching concentrations (µg/L) in clay with standard deviations (±).N.d. stands
for not detected and (0.017 – 0.03 µg/L) < LOQ are concentrations below the lowest concentration
detected on the calibration curve. For clay (n = 3), loam (n = 4) and loamy clay (n=4).
Days 4 8 12 16 22 28 34
ATL
n.d n.d
0.0107 ±
0.015 < LOQ < LOQ n.d n.d
AMT < LOQ < LOQ < LOQ < LOQ < LOQ < LOQ < LOQ
PRO
0.0701 ±
0.055
0.1036 ±
0.037
0.1039 ±
0.037
0.0739 ±
0.020
0.1093 ±
0.045
0.0680 ±
0.027
0.0730 ±
0.026
MET
0.3767 ±
0.252
0.3693 ±
0.188
0.2378 ±
0.077
0.2141 ±
0.031
0.2191 ±
0.052
0.1345 ±
0.02957
0.1268 ±
0.032
SOT n.d n.d n.d n.d n.d n.d n.d
CBZ
0.3817 ±
0.247
0.3499 ±
0.169
0.2502 ±
0.083
0.2837 ±
0.059
0.1945 ±
0.047
0.1370 ±
0.025
0.0830 ±
0.022
FXT n.d
0.0331 ±
0.001 n.d n.d n.d n.d n.d
CIT n.d
0.1525 ±
0.014
0.0471 ±
0.026
0.0322 ±
0.005
0.0436 ±
0.018
0.0248 ±
0.020
0.0245 ±
0.019
DZP
0.0616 ±
0.029
0.0736 ±
0.036
0.0580 ±
0.017
0.0465 ±
0.011
0.0547 ±
0.012
0.0396 ±
0.014
0.0253 ±
0.018
OZP
0.2208 ±
0.128
0.2265 ±
0.118
0.1664 ±
0.046
0.1638 ±
0.046
0.1576 ±
0.051
0.1024 ±
0.032
0.0584 ±
0.041
LTG
0.0439 ±
0.040
0.0405 ±
0.033
0.0237 ±
0.019
0.0208 ±
0.016
0.01237 ±
0.017
0.0102 ±
0.014
0.0074±
0.010
SRT n.d n.d
0.0073 ±
0.010
0.0148 ±
0.010
0.0118 ±
0.017
0.0094 ±
0.013
0.0090 ±
0.013
VEN
0.05089 ±
0.045
0.0682 ±
0.031
0.0599 ±
0.026
0.0544 ±
0.013
0.0557 ±
0.017
0.0434 ±
0.011
0.0283 ±
0.021
ZPD n.d n.d n.d n.d n.d n.d n.d
TPM n.d
0.0131 ±
0.018
0.0113±
0.016
0.0094 ±
0.01334
0.0091 ±
0.0130 < LOQ < LOQ
AZC n.d n.d n.d n.d n.d n.d n.d
CFX n.d n.d n.d n.d n.d n.d n.d
CLC n.d n.d n.d n.d n.d n.d n.d
NFX n.d n.d n.d n.d n.d n.d n.d
OFX n.d n.d n.d n.d n.d n.d n.d
RXC n.d n.d n.d n.d n.d n.d n.d
SMX n.d n.d n.d n.d n.d n.d n.d

56
Appendix B Table B1. Concentration (µg/kg) in biosolids prior spiking and post-spiking. Percentage of spiked
concentration (52 µg/kg) calculated on the basis of the spiking concentration.
Compound Concentration prior spiking Concentration post-spiking % of spiked
ATL n.d. 23.2 45
MET 76.5 225.5 176
PRO 231.2 366.1 129
SOT n.d. n.d.
CBZ 73.3 196.0 157
CIT 1623.4 4136 247
DZP n.d. 113.6 218
OZP 79.45 366.1 279
LTG 28.8 153.2 189
SRT n.d. n.d.
VEN 145.9 280.5 141
TMP n.d. 143.9 277
FXT 85.7 199.9 100
AMT 90.2 110.3 80
ZPD n.d n.d
AZC n.d. n.d.
CFX n.d. n.d.
CLC n.d. n.d.
NFX n.d. n.d.
OFX n.d. n.d.
RXC n.d. n.d.
SMX n.d. n.d.

57
Appendix C Table C1. Average input volumes (L) for each day with standard deviations (±), for clay (n = 3),
loam (n = 4) and loamy clay (n=4).
4 8 12 16 22 28 34
Loamy sand 2.52 ±
0.03
2.01 ±
0.01
1.96 ±
0.11
2.47 ±
0.11
2.99 ±
0.02
3.02 ±
0.06
3.06 ±
0.01
Loam 2.52 ±
0.15
2.002 ±
0.01
1.98 ±
0.01
2.43 ±
0.11
2.98 ±
0.04
3.02 ±
0.01
3.06 ±
0.01
Clay 2.55 ±
0.11
2.46 ±
0.16
1.79 ±
0.11
2.34 ±
0.26
3.03 ±
0.02
3.03 ±
0.01
3.06 ±
0.01
Table C2. Results from student t-test on 95 % significance level on the total input volumes (L) for
each soil type. p < 0.05 shows significant differences.
Soil type p-value
loamy sand vs loam 0.58
loamy sand vs clay 0.13
loam vs clay 0.08
Table C3. Average output volumes (L) for each day with standard deviations (±), for clay (n = 3),
loam (n = 4) and loamy clay (n=4).
4 8 12 16 22 28 34
Loamy
sand
1.85 ±
0.12
1.88 ±
0.14
1.88 ±
0.18
1.96 ±
0.10
3.02 ±
0.10
2.94 ±
0.02
2.99 ±
0.03
Loam 1.99 ±
0.18
1.84 ±
0.16
1.83 ±
0.20
2.06 ±
0.07
2.97 ±
0.10
2.96 ±
0.10
2.99 ±
0.01
Clay 1.95 ±
0.05
1.90 ±
0.04
2.11 ±
0.05
1.83 ±
0.09
3.01 ±
0.11
2.94 ±
0.01
3.00 ±
0.02
Table C4. Results from student t-test on 95 % significance level on the total input volumes (L) for
each soil type. p < 0.05 shows significant differences.
Soil type p-value
loamy sand vs loam 0.259
loamy sand vs clay 0.129
loam vs clay 0.184
Table C5. Two sided t-test on 95 % significance level performed on the first two leaching points
between clay and loam. p < 0.05 shows significant differences.
p-value - Sample point 1 p-value - Sample point 2
MET 0.106 0.090
CBZ 0.110 0.130

58
Appendix D
Table D1. pH-correlated log Pow value, log Dow. Derived from Equation 1 and pKa-values from Table
1 using the average pH value of the leachate (3.6 ± 0.2). Log Dow values were not calculated for
zwitterionic compounds.
Compound Log Pow Log Dow
ATL 0.16 0.16
MET 1.92 1.92
PRO 3.48 3.48
SOT 0.24 0.24
AMT 4.92 4.92
CBZ 2.45 2.45
CIT 3.74 3.74
DZP 2.82 3.43
FXT 4.05 4.05
LTG 2.57 2.58
OZP 2.24 2.24
SRT 5.29 5.29
VEN 3.28 3.28
ZPD 3.85 3.85
AZC 4.02 4.02
CFX 0.28 0.28
RXC 2.75 2.75
Table D2. Average leachate pH for each soil type over the time span of the experiment with standard
deviations (±), for clay (n = 3), loam (n = 4) and loamy clay (n=4).
Days 4 8 12 16 22 28 34
Loamy sand 3.8 ± 0.04 3.6 ± 0.01 3.5 ± 0.03 3.5 ± 0.05 3.5 ± 0.02 3.6 ± 0.02 3.5 ± 0.02
Loam 3.8 ± 0.02 3.7 ± 0.08 3.8 ± 0.01 3.5 ± 0.02 3.6 ± 0.02 3.6 ± 0.05 3.5 ± 0.04
Clay 3.9 ± 0.01 3.7 ± 0.05 3.6 ± 0.10 3.5 ± 0.05 3.5 ± 0.03 3.5 ± 0.01 3.6 ± 0.02
59
Appendix E
Figure E1.Spearman correlation matrix showing correlation between physiochemical properties of all
compounds and their leaching behavior. -1 stands for negative correlation whilst 1 stands for posi-
tive. Positive correlation indicates that variables on the y-axis increase when the variables on the x-
axis increase. Negative correlation indicates that variables on the y-axis decrease when the variables
on the x-axis increase. Blank boxes indicate significant correlation between the y and x variables.