Pharmaceutical Price Controls and the Orphan Drug Megafund …20Tranbarger... · 2017-08-15 ·...
55
Pharmaceutical Price Controls and the Orphan Drug Megafund Model Cody Tranbarger Faculty Advisor: Professor Adam Honig April 27, 2017 Submitted to the Department of Economics of Amherst College in partial fulfillment of the requirements for the degree of Bachelor of Arts with Honors
Transcript of Pharmaceutical Price Controls and the Orphan Drug Megafund …20Tranbarger... · 2017-08-15 ·...
Pharmaceutical Price Controls and
the Orphan Drug Megafund Model
Cody Tranbarger
Faculty Advisor: Professor Adam Honig
April 27, 2017
Submitted to the Department of Economics
of Amherst College in partial fulfillment
of the requirements for the degree of
Bachelor of Arts with Honors
I
Dedicated to
Tony Lane Tranbarger
April 6, 1963 - August 4, 2016
Rest in Peace, Dad

II
Abstract
The market for biomedical R&D suffers from underinvestment as a consequence of
its scale, time horizon, and risk. The megafund has been introduced as a potential solution
to this market failure via the provision of large-scale financing and a market for
diversification, effectively serving to alleviate scale misalignment and improve the
efficiency of biomedical capital markets. Orphan drugs are particularly suitable for
portfolio financing due to pathological characteristics which increase the rate of regulatory
approval and decrease the correlation between projects. Application of the megafund
model to orphan drug development thus has the potential to mitigate information
asymmetry problems in biomedical capital markets and stimulate R&D investment.
These predictions, however, are obscured by the increasingly probable scenario of
government intervention. Empirical analyses suggest that price controls on pharmaceutical
drugs would reduce R&D spending by lowering the expected returns to such investment.
Thus, megafund financing and free-market intervention have competing effects on the
equilibrium level of biomedical R&D investment. The following paper explores this
relationship and the relative magnitude of each component. I begin by expanding the
existing megafund theoretical framework to better represent the realities of orphan drug
development. I then analyze the megafund’s performance in statistical simulations under
two price control regimes. I find that price controls do not materially influence the default
rate on debt securities, but lead to a 25 – 70% decline in equity returns on average. The
decline in performance is significantly larger under a fixed, multidimensional price control
regime as opposed to a variable, unidimensional regime, and thus may carry implications
for optimal drug pricing policy.

III
Acknowledgements
First and foremost, I would like to thank my faculty advisors, Professors Adam
Honig and Geoff Woglom. Eight short months ago, Professor Woglom helped me
elucidate a pointed inquiry from vague curiosity. Since then, Professor Honig’s
unwavering support and counsel have been instrumental in translating thoughts into
writing. Of course, I would be remiss if I failed to acknowledge Professor Reyes and my
thesis seminar classmates. Thank you all for the compliments, the criticism, and the laughs
along the way.
I would also like to thank the faculty of and my colleagues within both the Amherst
Economics and Biology departments. My academic experience at Amherst has been
nothing short of invigorating. At times, I have succeeded, and at others, I have failed; but
importantly, I’ve learned from every outcome along the way. Amherst, thank you for the
trials and tribulations; I am undoubtedly better for them.
It is exceedingly difficult to quantify the gratitude I owe my parents. Their support
is unconditional; their enthusiasm resolute. Thank you both for exemplifying passion and
fostering ambition. You two have taught me more than you could ever comprehend.
Finally, to the men of Jenkins, the next bottle of Kirkland Prosecco is on me. It’s
been a hell of a run; here’s to many, many more.

IV
Table of Contents
1. Introduction 1
2. Literature Review 7
2.1 Research and Development Investment 7
2.2 Portfolio Financing – A Generalized Solution 9
2.2.1 Diversification and Portfolio Theory 9
2.2.2 Securitization 10
2.2.3 The Biomedical Megafund 12
2.2.4 The Orphan Drug Megafund 13
3. The Effect of Price Controls on Pharmaceutical R&D 15
4. Theoretical Integration of ODA Incentives 20
5. Price Control Simulations 29
5.1 Simulation Framework and Parameters 30
5.2 The Kassebaum/Metzenbaum Sales Trigger 34
5.3 The Orphan Drug Windfall Tax 36
6. Results 39
7. Discussion 42
8. Conclusion 44

1
1. Introduction
Capital markets channel savings and investment between individual investors
(lenders) and firms, governments, etc. (borrowers) through the transaction of debt and
equity instruments. The transfer of capital is essential for generating economic output and
growth, and thus, capital markets are a vital component of any economy. A breadth of
economic research has documented the prevalence of information asymmetry problems in
capital markets. From a macroeconomic perspective, the primary consequence of
information asymmetry within such markets is an inefficient allocation of capital.
Like all markets, biomedical capital markets, in which capital is allocated to drug
research and development (R&D) projects, exhibit these same problems. Their magnitude,
however, is amplified by the nature of drug development. Rising costs and lengthening
development periods have increased the risks associated with drug development,
contributing to a ‘productivity crisis in pharmaceutical R&D’ (Pammolli et al. 2011).
Average pre-approval costs per new drug have risen to $2.6 billion, while clinical
development periods have stagnated between 6 – 8 years with a meager 12% approval rate
(DiMasa et al. 2016, PhRMA 2015). Because of the investment size and associated
uncertainty, information asymmetry problems are exacerbated in biomedical capital
markets. These market imperfections increase the cost of external capital, which precludes
some firms from participating in public capital markets. Ultimately, the result is an
aggregate underinvestment in drug research and development.
While market interventions, such as the establishment of specialized investors,
have served as piecemeal solutions, a market failure persists. This failure, specifically, is
the misalignment of investment scale and consequent lack of diversification capacity.
2
Drug development requires significant upfront capital, and thus, it is difficult for any single
investor to hold a portfolio of investments in drug development programs. Consequently,
R&D underinvestment persists because investors are unable to sufficiently diversify the
idiosyncratic risk associated with biomedical investment. Empirical evidence corroborates
this claim. Approved new molecular entities (NMEs) have experienced average annual
declines since the mid-1990s, with 22 approvals in 2016 marking a six-year low (Hirschler
2017). Lagging productivity has exerted downward pressure on market valuations,
ultimately leading to capital outflows and the persistence of suboptimal investment levels.
Fernandez et al. (2012) propose a solution to this market failure in the form of a
biomedical megafund. The megafund utilizes diversification and securitization to develop
a portfolio-financed investment vehicle through which investors can spread idiosyncratic
risk across numerous drug development programs. Further, the megafund provides large-
scale financing to biomedical R&D, effectively serving to mediate scale mismatch, lower
transaction costs, and improve the efficiency of biomedical capital markets.
Fagnan et al. (2014) specify the megafund framework to orphan drugs exclusively.
Orphan drugs are developed to treat rare diseases and possess several characteristics that
make them exceptionally suitable for the megafund model. Despite these characteristics,
though, orphan drugs have not traditionally received significant R&D investment. Despite
countless medical breakthroughs over the past century, hundreds of rare diseases still exist
as ‘untreatable,’ which is largely a result of the privatization of drug development and the
supply-demand framework that informs firms’ R&D decisions. Because resources for
pharmaceutical R&D are scarce, decisions must be made to maximize profit opportunities.
Thus, historically, disease severity and quantity afflicted have guided resource allocation:

3
the most serious diseases affecting the largest patient populations have received the
greatest proportion of resources, and so on (Rhode 2000).
Rare diseases, meanwhile, are inherently characterized by limited patient
populations and quantitatively limited demand, and thereby fail to provide sufficient
incentives for R&D investment. Thus, rare diseases historically remained ‘orphaned’
because of their preclusion from R&D investment. While the behavior of firms was
rational in this context, a perceived market failure had developed: absent additional
economic and/or regulatory incentives, the pharmaceutical industry would continue to
neglect rare diseases while more than five million afflicted Americans would continue to
suffer inexorably (Rhode 2000). In response, the U.S. government intervened in the
market, and in 1973, the Orphan Drug Act was signed into law.
The Orphan Drug Act (ODA) formally defines orphan drugs as ‘pharmaceutical
treatments for diseases that affect fewer than 200,000 U.S. inhabitants’. The Act provides
several financial incentives to encourage the development of orphan drugs, and by all
accounts, it has been a powerful driver of drug development for rare, traditionally-
neglected diseases. In the decade preceding the passage of the ODA, only ten orphan
drugs were approved for use in the United States (Rhode 2000). Since then, more than 300
orphan drugs have been approved while an additional 2000 candidates have been granted
orphan drug designations (Wellman-Labadie and Zhou 2010). Between 2000 and 2010,
the compound annual growth rate (CAGR) of orphan drug approvals was ~10%, in contrast
to a negative CAGR for non-orphan approvals over the same period (Meekings et al.
2010).

4
On the other hand, some ODA incentives have been condemned for enabling firms
to engage in price gouging behaviors (Garber 1994). Commonly cited are the orphan
drugs Cosmegon, Indocin I.V., and Acthar, which increased in price by 3,436%, 1,389%,
and 1,310%, respectively, between 1998 and 2008 (Hemphill 2010). More recently,
Marathon Pharmaceuticals became the exemplar for such behavior after placing an
$89,000 price tag on its newly approved muscular dystrophy drug. In addition to
egregious prices, proponents of government intervention often cite the abuse of orphan
drug status for a single drug across several disease indications. For example, as of 2008,
only 4 of the 18 blockbuster drugs1 solely approved as orphan drugs had a single
therapeutic use. In this case, it is possible that initially unprofitable drugs reach
‘blockbuster status’ by treating multiple orphan disease niches, effectively increasing the
drug’s patient population while preserving its monopoly pricing privileges (Wellman-
Labadie and Zhou 2010). Although such examples are rare, they have contributed to a
growing public perception of abuse and exploitation, and have thrust orphan drugs into the
wider debate concerning drug pricing and healthcare provision.
In developed countries like the United States, the pharmaceutical industry is unique
in that a third-party healthcare provider, such as a private health insurer or a government
agency, directly pays for at least a fraction of the consumer’s prescription drug
expenditures (Hemphill 2010). While the U.S. government pays for more than 40% of
total healthcare expenditures, it does so through several uncoordinated programs, which
impedes its ability to exert market power to negotiate prices. As such, both the public and
private sectors act as price takers, and thus price consideration has not traditionally been a
1 A blockbuster drug is defined as any pharmaceutical product which exceeds $1 billion in annual sales.

5
priority in the U.S. pharmaceutical market (Garber 1994). Indeed, it is oft speculated that
the pricing discretion granted to private drug developers and the U.S.’s status as a world
leader in medical innovation share a causal relationship. As such, drugs have traditionally
been considered ‘priceless goods’ to ensure the development of novel therapeutics and
their dissemination to the masses (Maitland 2002).
Recent sociopolitical developments, however, contradict this perspective. Public
rhetoric for government intervention has reached a crescendo in response to drug price
increases and swelling healthcare expenditures. Pharmaceutical productivity has
plummeted while drug price inflation has far outpaced the CPI. Average prices of brand-
name drugs have increased by 164% since 2008. In 2015 alone, prescription drugs
received an average price increase of 16.2% and aggregate U.S. drug spending rose by
5.2% (Express Scripts 2016). In response, public sentiment has shifted in favor of
government intervention – a 2016 survey found that 78% of respondents favored drug
price controls (Rau 2016).
Because orphan drugs tend to be among the most expensive, they have been
inextricably entwined in discussions regarding the industry’s pricing practices. Given the
combination of perceived commercial and ethical abuse, shifting public sentiment against
the pharmaceutical industry, and a Republican majority under the Donald Trump
administration, government intervention is becoming increasingly likely. While any
potential legislation would likely target drug prices more broadly, orphan drugs would be
disproportionately affected because of their inherently high prices.
If the detrimental effects of price controls on R&D investment outweigh the
incentives conferred by the ODA, government intervention could carry significant
6
ramifications for orphan drug development going forward. Such ramifications could
extend to drug development more broadly if the costs of government intervention similarly
outweigh the general benefits of portfolio financing. To explore this possibility and
illustrate the long-run implications, I analyze the effects of government-imposed price
controls on the megafund model. I begin by evaluating the effect of price controls on
historical pharmaceutical R&D levels within several models. Secondly, I incorporate the
financial incentives mandated by the ODA within an illustrative megafund model,
something Fagnan et al. (2014) fail to do. I then use a mathematical example to
demonstrate how the benefits of portfolio financing for orphan drugs may exceed those of
non-orphan drugs. I continue this analysis by considering the impact of proposed price
regulations within the megafund framework. Finally, I simulate the performance of an
orphan drug megafund under the constraints of price controls. I find that the megafund
proves resilient to a moderate level of price regulation. Price controls do not materially
influence the megafund’s default rate on debt securities, but lead to a 25 – 70% decline in
equity returns on average. I conclude by considering the policy implications these results
may carry.
The remainder of the paper is organized as follows. Chapter 2 establishes the
financial theory underlying the megafund model. Chapter 3 analyzes the relationship
between price controls and R&D investment. Chapter 4 expands the existing megafund
framework to include ODA incentives. Chapter 5 outlines the price control simulations.
Chapter 6 presents the results of those simulations. Chapter 7 discusses the findings and
their implications. Chapter 8 concludes.

7
2. Literature Review
2.1 Research & Development Investment
Economic theory has long propagated the belief that innovation is difficult to
finance in a perfectly competitive capital market. First proposed by Nelson (1959) and
Arrow (1962), and summarized by Hall and Lerner (2009), economic theory argues that
the knowledge produced by innovation is a non-rival good, and as such, the use of that
information cannot be restricted by the firm undertaking the capital investment to produce
it. Thus, the incentives for firms to invest are diminished, which ultimately generates a
socially suboptimal equilibrium level of R&D investment.
Market interventions, such as the protection of intellectual property through
patents, R&D tax incentives, government funding, etc., have successfully combatted these
problems. For example, Bloom et al. (2001) found that a 10% R&D tax credit led to a
10% increase in long-run R&D investment, while Varsakelis (2001) found that patent
protection is a universally strong determinant of R&D intensity.
However, Hall (2009) proposes an additional market failure contributing to R&D
underinvestment: the ‘wedge’ between the cost of capital from external financing sources
and the private rate of return required by the firm undertaking the project. It is possible
that the external cost of capital, the minimum return required to compensate third party
investors, exceeds the private rate of return, the internal rate of return (IRR) at which a
project’s net present value (NPV) is equal to zero. Thus, some projects, despite possessing
a positive NPV within a private financing structure, will not attract external investment.
The underpinning to this ‘wedge’ derives from the traditional components of information
asymmetry. In R&D markets, asymmetry between the researchers’ and the investors’
8
knowledge of the probability of success for a given project may contribute to the
development of an orthodox Akerlof (1970) ‘lemons market’ in which adverse selection
problems drive the least risky investments out of the market. Further, the separation of
firm management and ownership, as is standard among modern industrial firms, may
contribute to moral hazard and principal-agent problems.
Together, these asymmetry problems increase the cost of external capital, which
precludes some firms from participating in public capital markets. This phenomenon has
been supported empirically by analyzing the liquidity constraints of firms with respect to
R&D investment. If innovative firms were financially constrained, Brown and Haegler
(1997) argue, then their R&D expenditures should be highly correlated with fluctuations in
internal finances. Indeed, findings from both Hall (1992) and Brown and Haegler (1997)
exhibit a significant positive correlation between cash flows and R&D investment,
particularly amongst innovative firms, suggesting that imperfect public markets may
constrain firms to internal funding sources.
The aforementioned market failure is particularly acute for innovation-focused
firms like those I consider. The private sector has developed a solution in the form of
venture capital (VC), which are privately-managed capital funds specializing in equity
investments in high-growth firms. The literature has exhaustively outlined venture
capitalists’ potential to address information asymmetry problems via extensive screening,
active monitoring, exit incentives, and investment staging (Hall 2009). Indeed, the success
of the venture capital industry has been convincing. Bernstein et al. (2016) find that, on
average, heavy VC involvement leads to a 3.1% increase in produced patents by portfolio
companies and a 1.4% increase in the probability of a successful exit.

9
While venture capital successfully remediates the information asymmetry problems
in many such capital markets, I argue that, due to the investment scale and management
required for drug development, venture capital only serves to mitigate this market failure.
Drug development is risky and requires investment upfront while the returns are
unpredictable and volatile. Drug development, therefore, is perceived by investors to be
among the riskiest sectors in the economy. Consequently, biomedical technology is treated
differently by private sector investors like venture capitalists. Previous studies have
documented the difference in selection criteria employed by VCs when considering a non-
technology-based proposal vs. a technology-based proposal. For instance, UK venture
capitalists require higher hurdle rates for technology-based proposals2 (Lockett et al.
2002). Further, several VCs have been documented to exclude biotechnology proposals
out of principle, citing regulatory difficulties, financing size, and exit uncertainty (Baeyens
et al. 2006). Ultimately, these investment strategies have been justified, as life-sciences
venture capital investments generated an average return of -1% between 2001 and 2010
(Fernandez et al. 2012). Such observations indicate that, despite venture capitalists’ ability
to mediate information asymmetry problems, underinvestment in drug development
persists.
2.2 Portfolio Financing – A Generalized Solution
2.2.1 Diversification and Portfolio Theory
Before delving into the specifics of the megafund model, it is important to note the
statistical principle on which it is built: diversification. Cecchetti and Schoenholtz (2015)
2 The hurdle rate for an investment represents the potential return threshold beyond which a proposal is considered attractive.

10
outline the basic framework. Consider an equally weighted portfolio of n assets, the
expected return remains the same regardless of the value of n: 𝐸 𝑃 = 𝑤%𝐸(𝑥%))%*+ . The
variance of the portfolio’s return, however, depends on the value of n:
𝑉𝑎𝑟 𝑃 = 𝑤%/𝑉𝑎𝑟 𝑥% + 𝑤%𝑤1𝐶𝑜𝑣(𝑥%, 𝑥1))1*%6+
)%*+
)%*+
Since we are considering an equally weighted portfolio, wi = wj = 1/n. If we define
𝜎89 as the average covariance among all assets within the portfolio, then:
𝑉𝑎𝑟 𝑃 = +)𝑉𝑎𝑟 𝑥% + ):+
)𝜎89
And thus, as the number of assets, n, increases: lim)→?
𝑉𝑎𝑟 𝑃 = 𝜎89
This decomposition carries a powerful implication which is central to the megafund
model: for portfolios holding many assets, the variance of the portfolio tends to converge
to the average covariance between the assets. In the case of orphan drugs, the benefits of
this implication may exceed that of the average asset. Orphan diseases tend to exhibit
monogenic pathology, meaning they are caused by an anomaly in a single gene. As such,
we can safely assume that the biological mechanisms utilized by their treatments will tend
to be unrelated, and thus, that the covariance between orphan drug development programs
is modest. Mathematically, this implies that as the as the number assets in the portfolio, n,
increases, Var(P) will unambiguously converge to a small value.
2.2.2 Securitization
Securitization uses financial engineering to transform an illiquid asset, such as a
group of loans, into a security. The process typically involves two steps. First, the
originator, the owner of the assets to be securitized, pools the assets and transfers them to
an issuer, which often takes the form of a special purpose vehicle (SPV), an independent
legal entity which is restricted from any activity beyond owning and servicing the

11
securitized assets (Jobst 2008). Second, the SPV finances its acquisition of the assets by
issuing securities collateralized by the assets’ cash flows (Fabozzi and Kothari 2008). The
portfolio is often sliced into several tranches which are sold separately and correspond to
different maturities or levels of risk (Jobst 2008). Securitization, therefore, provides
financing to the originator while generating interest and principal payments for investors
corresponding to their specific risk-reward preferences (Telpner 2003).
In the wake of the 2007 financial crisis, asset-backed securitization has experienced
intense scrutiny. Several studies have documented the role of securitization in encouraging
lax lending standards which contributed, in part, to the credit crisis (Drucker and Mayer
2008, Nadauld and Sherlund 2009, Keys et al. 2010). Provided responsible oversight and
regulation, however, securitization offers benefits both for creditors and the wider
economy.
Most importantly, securitization lowers the cost of borrowing. Securitization
allows the separation of financial assets from the credit risk of the originator, and thus the
resulting securities are often of a higher credit quality than the secured debt of the
originator itself (Jobst 2008, Fabozzi and Kothari 2008). In addition, securitized assets are
more liquid than the assets underlying them, and therefore carry less of a liquidity
premium. For both reasons, securitization enables the movement of investment capital
from debt markets to more efficient capital markets, resulting in lower funding costs (Jobst
2008). For instance, several studies have concluded that the securitization of residential
mortgages has lowered the interest rates paid by borrowers (Jameson et al. 1990, Sirmans
and Benjamin 1992).

12
Ultimately, securitization lowers the cost of credit and expands financial markets,
both of which contribute to economic growth. Because of these benefits, the use of
securitization has expanded to a plethora of financial assets, including student and auto
loans, credit card receivables, litigation settlement payments, and cash flows from oil
reserves (Iacobucci and Winter 2005). A particularly poignant example of securitization’s
expansion was the issuance of $100 million of bonds by Yale University collateralized by
a royalty interest and licensing agreement between the University and Bristol-Myers
Squibb based on a pharmaceutical patent (Kramer and Patel, n.d.). Thus, the securitization
of intellectual property like drug development programs is quite plausible. Indeed, the
precedent has been set and reinforced many times over.
2.2.3 The Biomedical Megafund
The megafund model, as first proposed by Fernandez et al. (2012), is designed to
couple diversification and securitization to reduce the cost of borrowing for drug
developers and deliver large-scale financing to biomedical capital markets. The megafund
consists of two interdependent components: (1) The creation of a diversified portfolio of
drug development projects; and (2) The use of securitization to structure the portfolio’s
financing as a combination of equity and debt. In this case, Fernandez et al. (2012)
propose the use of future cash flow securitization, in which financial interests in drug
development projects and their associated intellectual property are used to collateralize
debt instruments called Research-Backed Obligations (RBOs). The megafund, in this
process, takes the form of a special purpose vehicle (SPV), an independent legal entity
through which the assets are purchased and the securities are issued. The development of
RBOs with attractive risk-reward profiles, though, necessitates scale. Diversification, in

13
turn, reduces portfolio risk to the extent that the megafund can raise funds by issuing both
equity and debt. Finally, the size of the debt market relative to the equity market enables
the megafund to raise capital at the scale necessary to achieve sufficient diversification.
Thus, the two components share a complementary relationship.
Fernandez et al. (2012) use a dataset of 733 anti-cancer drugs which entered
clinical trials between 1990 and 2011 to execute simulations that test the efficacy of the
megafund model. The researchers complete two 7.5-year simulations: (1) a portfolio with
$5 billion of initial capital (2x leverage) consisting of 100 preclinical and 100 Phase I
compounds; and (2) a portfolio with $15 billion of initial capital (2.5x leverage) consisting
of 100 Phase II compounds. In both cases, the financial structure of the portfolio consists
of three components: (1) Equity; (2) a senior RBO tranche which pays a 5% annual
coupon; and (3) a junior RBO tranche which pays an 8% annual coupon. The researchers
find that the megafund is almost always profitable. Specifically, the megafund yields
returns of 8.9 – 11.4% and 5 – 8% for equity investors and RBO investors, respectively,
while the rate of full RBO payment exceeds 99%. In comparison, an all-equity megafund
generates a comparable risk profile and yields average returns of only 7.2%.
2.2.4 The Orphan Drug Megafund
Fagnan et al. (2014) build on the results of Fernandez et al. (2012) by applying the
megafund model to orphan drugs. In their own simulations, the researchers use a large-
molecule drug data set to simulate a megafund of parallel tranche structure as Scenario 1 in
Fernandez et al. (2012), but with only $575 million in initial capital and a target portfolio
of 10 – 20 projects. Consistent with previous analyses, the megafund yielded average

14
returns of 13.4% for equity investors, while the rate of full RBO payment again exceeded
99%.
These results carry a significant implication: an orphan drug megafund can achieve
attractive returns with significantly less scale, which mitigates the operational challenges to
the cancer megafund proposed by Fernandez et al. (2012). Fagnan et al. (2014) suggest
multiple characteristics of orphan drugs which make them particularly suitable for
portfolio financing and may explain the intuition behind their results. Firstly, orphan
diseases are generally caused by individual genetic mutations (termed ‘monogenic
pathology’) and act through unrelated biological mechanisms. Consequently, the
pharmacological functions of orphan drugs tend to be unrelated, and thus, the success or
failure of individual orphan drug development projects is unlikely to be correlated across
diseases (Maher 2008). Further, again attributable to monogenic pathology, orphan drug
development enjoys a significantly higher rate of success than that for more complex
disease fields like neurodegeneration or oncology (Fagnan et al. 2014). Once the
underlying genetic defect has been identified, the development of a targeted therapy is
relatively straightforward. As such, the regulatory success rate of orphan compounds far
exceeds that of non-orphan compounds. For drugs entering clinical testing between 2003
and 2011, the probability of FDA approval for orphan candidates was 23% while it was
merely 15% for non-orphan candidates (Hay et al. 2014). Secondly, orphan drugs’ small
patient populations are often compensated for large per-patient revenues. Therefore,
orphan drugs tend to generate lifetime revenues comparable to those of non-orphan
therapies. For example, between 2000 and 2010, the same percentage (29%) of newly
approved orphan and non-orphan drugs achieved blockbuster status (Thomson Reuters

15
2012). Finally, orphan drug developers receive a host of financial and regulatory
incentives as stipulated by the ODA, which are further discussed in Chapter 4.
3. The Effect of Price Controls on Pharmaceutical R&D
From an ethical perspective, the morally optimal pricing regime is that which relieves
the most suffering and saves the most lives. This ethical framework is consistent with both
Rawls’ Difference Principle, in which the utility of society’s worst-off is maximized, and
Utilitarianism, in which society’s sum utility is maximized (Maitland 2002). In such a
society, any systematic exclusion from pharmaceutical care both violates the principles of
fairness and results in a suboptimal level of utility (Hemphill 2010). Price regulation,
Maitland (2002) argues, would oppose these ethical goals. Within a market economy,
binding regulation of prices reduces investment in that industry or product. Because price
controls would reduce expected returns, pharmaceutical R&D investment would decline,
resulting in the development of fewer products – today’s profits are tomorrow’s drugs
(Maitland 2002). Price regulation, though, may appear attractive myopically because its
benefits are observed immediately while its costs are deferred. Such a situation can be
represented graphically via an Access-Innovation Frontier, as shown in Figure 3.1.
Even within a regulatory regime in which drug producers are forced to supply
products below their average total cost, firms will continue to produce in the short-run
Figure 3.1 Access-Innovation Frontier (Vernon and Golec 2008)

16
because most of their costs are sunk. In the long-run, however, firms will invest until the
expected marginal efficiency of investment (MEI) is equal to the firm’s marginal cost of
capital (MCC). This market equilibrium can be visualized within a basic supply-demand
framework, in which the downward sloping MEI curve represents the aggregation of the
expected return for each individual project while the upward sloping MCC curve
represents the supply price of investment funds at the margin (Vernon 2005). Expected
profits and lagged cash flows are the principal determinants of firms’ sales-to-R&D ratios
(Grabowski and Vernon 2000, Scherer 2001, Lichtenberg 2001). Thus, price controls
influence firm investment through two primary channels: (1) By reducing the firm’s
expected returns to R&D (Figure 3.2); and (2) By limiting the supply of capital, also
referred to as a ‘cash-flow effect’ (Figure 3.3) (Vernon 2005).
Ceteris paribus, price controls will reduce the expected profitability of any given
investment project, resulting in a leftward shift in the MEI curve. Further, price controls
will limit the lagged profitability of the firms themselves, and thus the supply of funds for
Figure 3.2 Price controls lower the expected
returns to R&D, leading to a decline in equilibrium R&D investment
(Vernon and Golec 2008)
Figure 3.3 Price controls restrain cash flows from any given approved drug,
which limits the supply of internally-generated capital for
R&D investment (Vernon and Golec 2008)

17
investment, either from internally generated cash flows or from external investors, will
decline, generating a leftward shift in the MCC curve. Irrespective of which channel takes
precedence, aggregate R&D investment declines unambiguously, as shown in Figure 3.4.
This equilibrium model has been substantiated by various models of
pharmaceutical R&D investment. Simulations of an illustrative government-imposed price
control regime from 1980 to 2001 indicated that R&D investment would have fallen by
~30%, ultimately resulting in ~350 new medicines going undeveloped, which is more than
one-third of all new drugs brought to market over that period (Giaccotto et al. 2005). In
the long run, a similar model suggests that a 10% decline in drug prices would cause a 5 –
6% decline in pharmaceutical innovation (Lichtenberg 2006).
These theoretical predictions have been buttressed empirically by analyzing several
models in which price regulation has been threatened or enacted. Because of its regulatory
system, empirical analyses have primarily focused on Europe as a model. Since the early
1980s, nearly all European Union countries have employed demand and supply-side
mechanisms to regulate pharmaceutical prices. While there is significant regulatory
heterogeneity across countries, most exert some form of direct price control, and most have
Figure 3.4 Price controls lead to a leftward shift in either the MEI or MCC curve, or, in the worst case, both (Author’s Figures)

18
stated an identical objective: to limit pharmaceutical price inflation to the rate of overall
consumer price inflation (Sood et al. 2009, Golec and Vernon 2010). According to this
benchmark, the policies have been successful: EU real pharmaceutical prices did not
increase between 1986 and 2004 (Golec and Vernon 2010). Moreover, EU prices are 20 –
40% lower than those in the U.S (Danzon and Furukawa 2008).
A strictly price-focused analysis, however, is superficial and fails to investigate the
unintended consequences of regulation on firm profitability and R&D investment. Across
nineteen OECD countries, direct price controls have reduced pharmaceutical company
revenues by an average of 16.8%, which has contributed to an average difference of 4.9%
in aggregate profitability between U.S. and EU firms (Sood et al. 2009, Golec and Vernon
2010). Firm profitability is positively correlated with R&D investment (Sherer 2001,
Trushin 2011, Golec et al. 2010); and that relationship has held in this case. EU
pharmaceutical R&D spending was 24% higher than that of the U.S. in 1986, but by 2004,
following the widespread adoption of price controls, EU R&D spending trailed that of the
U.S. by 14% (Vernon and Golec 2008). The implications of Europe’s R&D paucity are
self-evident: EU firms introduced twice as many new pharmaceutical products as U.S.
firms between 1987 and 1991, but they introduced 20% fewer products between 2000 and
2004 (Vernon and Golec 2008). Eger and Mahlich (2014) further confirm these results
with more recent data. The findings are consistent with the predicted cash-flow effect, in
which a decline in firms’ profitability constrains the supply of funds for investment,
causing a leftward shift in the MCC curve and receding R&D investment.
Drug prices in the United States, on the other hand, have largely remained
unregulated. However, the domestic pharmaceutical industry has not been entirely

19
immune from the threat of price controls. The most preeminent threat came in 1993 with
the Clinton administration’s proposed Health Security Act (HSA). Although the proposal
was ultimately defeated in Congress, it has served as an experiment through which the
response of U.S. pharmaceutical firms to potential regulation can be observed. Under the
HSA, drug prices would have unambiguously declined in accordance with mandated
formulary restrictions, rebate negotiations, and generic substitution (Ellison and Mullin
2001). Further, the Act would have established an Advisory Council on Breakthrough
Drugs which would have had the authority to limit prices of newly developed
pharmaceuticals (Kutyavina 2010).
Although it was never passed, the HSA introduced a credible threat of price
controls within the U.S. market. In response, real pharmaceutical price inflation fell
abruptly in 1993 and lingered near zero for several years thereafter (Golec and Vernon
2010). I have previously discussed the positive correlation between drug prices and
overall financial performance. As such, one would expect firms and investors to integrate
their revised expectations into investment decisions a priori; and indeed, this was the case.
Expectations of firm profitability (using stock market valuations as a proxy) declined
significantly: a sample of stock performance from 1993 to 1995 for 111 pharmaceutical
and biotechnology companies revealed an average downturn of ~19% (Golec and Vernon
2010). The availability of external financing for biotechnology companies similarly
faltered (Lerner et al. 2003). Consistent with the theoretical predictions made heretofore,
aggregate pharmaceutical R&D investment declined in turn. Investment was 7.7% lower
in 1994 than 1993; but tellingly, R&D spending quickly recovered in 1995 following the
HSA’s rejection (Golec and Vernon 2010). This observation suggests that the short-term

20
decline in investment derived from lower expected returns and restricted external
financing, both of which are consistent with the market equilibrium detailed previously.
In summary, while there are multiple channels through which price controls
influence firms’ R&D investment decisions, they are unambiguously associated with
declining R&D investment. Declining investment, in turn, results in a dearth of
biomedical innovation and approved drugs. This reality carries significant implications not
only for human population health but also for the financial feasibility of the orphan drug
megafund, which is discussed hereafter.
4. Theoretical Integration of ODA Incentives
The Orphan Drug Act mandates five specific incentives to improve the economic
viability of orphan drug development: (1) Minimum 7-year post-approval market
exclusivity period; (2) Receipt of a 50% tax credit for clinical trial expenditures; (3) The
award of NIH grant funding to some drug developers3; (4) FDA clinical trial protocol
assistance; and (5) FDA application fee waivers. The ODA, however, remains
unconsidered in the orphan drug megafund proposed by Fagnan et al. (2014). While such
an approach may suffice for their purposes, a more accurate theoretical incorporation of
ODA incentives is necessary for a comprehensive analysis of orphan drug megafund
efficacy under the stress of price controls. As such, I integrate three of the five ODA
market incentives into the illustrative megafund framework developed in Fernandez et al.
(2012). The theoretical development begins by augmenting single-drug metrics, such as
revenues and costs, and concludes by expanding the analysis to portfolio performance.
3 Currently, the ODA guarantees up to $14 million in NIH funding per year. It is unclear how this amount may change given the Trump administration’s decision to significantly reduce the NIH’s budget. As such, I omit this incentive from the theoretical model.

21
Of the financial incentives mandated by the ODA, the guaranteed seven-year
market exclusivity period is the most significant. In effect, this provision grants the drug
developer monopoly privileges for seven years following the approval of an orphan drug.
This exclusivity, however, differs in important ways from a traditional patent. Patent
protection is often granted early in a drug candidate’s life cycle and encompasses a wide
variety of uses and indications. Moreover, patent protection for a given drug expires
exactly twenty years from the date of issue, regardless of the drug’s regulatory standing at
the time. In contrast, market exclusivity under the ODA grants exclusive marketing rights
for exactly seven years following approval, regardless of the drug’s patent status. Further,
market exclusivity only encompasses the indication for which the drug was approved and
is conditional on the developer’s ability to meet market demand (Rohde 2000).
Consequently, it is possible for the market exclusivity period granted by the ODA to act
concurrently or independently of a drug’s patent protection period; an intricacy that
warrants theoretical consideration.
Fernandez et al. (2012) assume a 10-year drug development period with post-
approval generation of income X from year 10 to year 204. For my purposes, however, the
assumption of a fixed income-generating period is overly simplistic. As such, I propose
the incorporation of a variable L which represents the residual patent exclusivity given a
clinical trial and approval period of TD for each drug. Thus, in the case of an approved
orphan drug, the modified framework should account both for the unconditional 7-year
market exclusivity granted by the FDA as well as any remaining post-approval patent
4 The twenty-year upper bound represents the maximum period of patent exclusivity.

22
exclusivity. This modification places a lower bound of seven on the market exclusivity for
orphan drugs while allowing patent protection to extend that period up to twenty years.
In the existing framework, the present value of cash flows from an approved drug,
given a cost of capital r and a marketing period of ten years, is:
𝑌+A =BC1 − +
+6C FG
The incorporation of residual patent exclusivity in relation to monopoly privileges
granted by the FDA augments this model as follows:
𝑌H =BC1 − +
+6C I
where 𝐿 = 20 − 𝑇N and is bound by 7 ≤ 𝐿 ≤ 20
Because the length of market exclusivity is a significant driver of lifetime cash
flows, the consideration of variable periods of exclusivity amongst drugs is critical. As
such, my framework better represents the reality for both orphan and non-orphan drugs.
Market exclusivity operates as a ‘pull’ incentive by generating market demand.
The other primary mandates of the ODA, in contrast, act as ‘push’ incentives by reducing
R&D costs (Grace and Kyle n.d.). The ODA’s push mechanisms are two-fold: (1) The
Orphan Drug Tax Credit (ODTC); and (2) FDA Application Fee Waivers.
The ODTC provides a tax credit to drug developers equal to 50% of the cost of
completed clinical trials. This tax credit can be applied immediately or carried forward for
up to twenty years, which is a significant distinction, as orphan drug developers are often
pre-revenue firms without existing tax liabilities (U.S. FDA 2016). Importantly, the
ODTC is provided regardless of the drug’s regulatory outcome. As clinical trial costs
often amount to hundreds of millions of dollars, the approval-independent nature of the
ODTC serves to alleviate some of the risk of orphan drug development and lower the

23
effective cost of capital for developers (Ernst & Young 2015). Thus, considering the
overall costs of development for orphan drugs necessitates the incorporation of the ODTC.
The final incentive provided by the ODA is the remittance of FDA application fees.
Specifically, this provision mandates that the developer’s application fee, as established by
the Prescription Drug User Fee Act (PDUFA), is waived for any product which has
received orphan drug designation. In 2016, the fee for a drug application totaled
$2,038,100 (U.S. FDA 2016). While, the fee waiver provision is far less significant than
the ODTC, it is an important distinction between orphan and non-orphan drug candidates,
and thus merits consideration in the theoretical framework.
To incorporate these incentives into the model, it seems intuitive to begin with the
framework’s measure of costs. However, because Fernandez et al. (2012) assume a pre-
discounted cost metric, considering these incentives as sources of income avoids
overcomplicating the model. Thus, I propose the integration of a variable F which
represents both the variable tax credit and fixed fee waiver granted to the drug developer.
The integration follows:
𝐹 = .5𝛼𝐶 + 𝑤 where 𝛼 = UV%)%UWVYC%WVUZ[Y[YZYWV\]^]VZ_`])YUZ[Y[
and 𝑤 = 𝑓𝑖𝑥𝑒𝑑𝑐𝑜𝑠𝑡𝑜𝑓𝐹𝐷𝐴𝑎𝑝𝑝𝑙𝑖𝑐𝑎𝑡𝑖𝑜𝑛𝑓𝑒𝑒
In the existing framework, if C represents the present value cost of development
associated with an approval, the total investment return, Rs, between t=0 and t=10 for a
single approved drug is as follows:
𝑌+A =BC1 − +
+6C FG
𝑅[ =nFGo− 1 = B
Co1 − +
+6C FG − 1
24
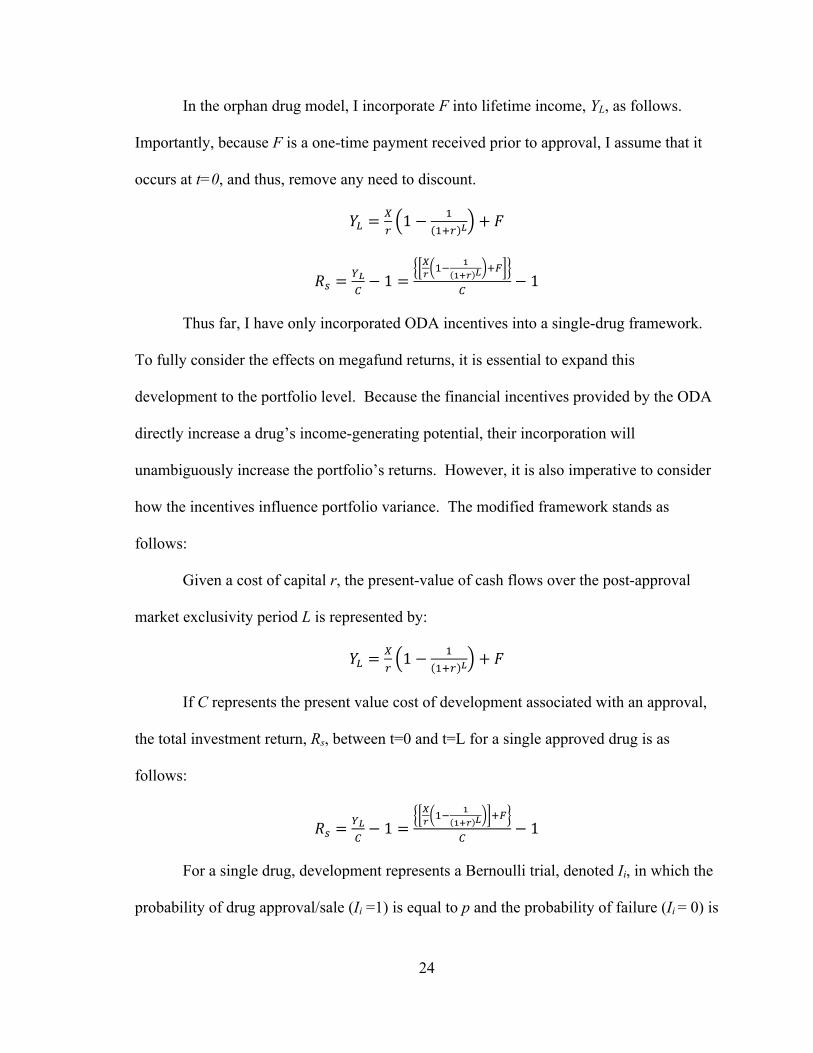
In the orphan drug model, I incorporate F into lifetime income, YL, as follows.
Importantly, because F is a one-time payment received prior to approval, I assume that it
occurs at t=0, and thus, remove any need to discount.
𝑌H =BC1 − +
+6C I + 𝐹
𝑅[ =nIo− 1 =
pq +: F
Frq I 6s
o− 1
Thus far, I have only incorporated ODA incentives into a single-drug framework.
To fully consider the effects on megafund returns, it is essential to expand this
development to the portfolio level. Because the financial incentives provided by the ODA
directly increase a drug’s income-generating potential, their incorporation will
unambiguously increase the portfolio’s returns. However, it is also imperative to consider
how the incentives influence portfolio variance. The modified framework stands as
follows:
Given a cost of capital r, the present-value of cash flows over the post-approval
market exclusivity period L is represented by:
𝑌H =BC1 − +
+6C I + 𝐹
If C represents the present value cost of development associated with an approval,
the total investment return, Rs, between t=0 and t=L for a single approved drug is as
follows:
𝑅[ =nIo− 1 =
pq +: F
Frq I 6s
o− 1
For a single drug, development represents a Bernoulli trial, denoted Ii, in which the
probability of drug approval/sale (Ii =1) is equal to p and the probability of failure (Ii = 0) is

25
equal to 1-p. Therefore, the rate of return, R, from t=0 to t=L for one drug is a random
variable given by:
𝑅 = 𝑅[𝑤𝑖𝑡ℎ𝑎𝑝𝑟𝑜𝑏𝑎𝑏𝑖𝑙𝑖𝑡𝑦𝑜𝑓𝑝−1𝑤𝑖𝑡ℎ𝑎𝑝𝑟𝑜𝑏𝑎𝑏𝑖𝑙𝑖𝑡𝑦𝑜𝑓(1 − 𝑝)
The mean and standard deviation for the return on one drug, R, then, are given by:
𝐸 𝑅 = 𝑝 1 + 𝑅[ − 1
𝑆𝐷 𝑅 = 𝑉𝑎𝑟 𝑅 = (1 + 𝑅[) 𝑝(1 − 𝑝)
When applied to a portfolio, Rp, of n independent5 and identical projects, we find:
𝑅_ = nI xiy
z{F )o
− 1 = +6|})
𝐼i)%*+ − 1
𝐸 𝑅_ = 𝑝 1 + 𝑅[ − 1
𝑆𝐷 𝑅_ = +6|} �
)𝑝 1 − 𝑝 = 1 + 𝑅[
_ +:_)
= nIo
_ +:_)
While the portfolio’s total asset return is paramount, because the megafund is also
debt-financed, it is essential to consider its default probability. Doing so necessitates the
probability distribution of drug failures/approvals, 𝐼i)%*+ . Ii is a binomial random
variable, thus its cumulative distribution function is:
Pr 𝐼i)%*+ ≤ 𝑘 =
𝑛𝑗 𝑝1 1 − 𝑝 ):1�
1*A
Assuming a zero-coupon RBO at t=0 which pays Z upon maturity at t=L, the
probability of default on that security then follows:
Pr 𝑌H 𝐼i)%*+ < 𝑍 = Pr 𝐼i)
%*+ < �nI
=𝑛𝑗 𝑝1 1 − 𝑝 ):1
��I
:+
1*A
5 Fernandez at al. (2012) assume insignificant covariance for simplicity. While this may not accurately represent reality, the simulations executed hereafter explicitly account for pair-wise correlation between projects.

26
By making some basic assumptions about the drug development process, the
preceding framework can be used to illustrate the benefits of portfolio financing. The
following examples follow the structure of those presented in Fernandez et al. (2012), but I
extend them to consider the effects of ODA incentives. Consider a single drug with
development costs (C) of $200 million over a period of ten years. Assume the drug has a
5% chance of approval, and if approved, will generate net income of $2 billion for the ten
remaining years of its patent protection period. At a 10% cost of capital (r), the present
value of the drug upon approval (YL) is $12.3 billion. At that valuation, the implied
compound annual rate of return over years 11 to 20 (L) is equal to ��_]UY]\�WV�]oZ[Y
Fy − 1,
and thus, �%∗$+/.�$A./
FFG − 1 = 11.9%. The expected return may seem attractive on the
surface, but the returns are largely dichotomous. While investors enjoy a 5% likelihood of
earning 51% returns, they also have a 95% chance of returning -100%. The annualized
standard deviation in this scenario is equal to 423.5%. Such an all-or-nothing risk-reward
profile is unlikely to appeal to the overwhelming majority of investors, and is particularly
unlikely to satisfy the criteria of investors with $200 million in free capital. Indeed, this
situation is indicative of the reality in drug development today.
Now consider a portfolio of investments in 150 such projects (n=150). As
previously illustrated by portfolio theory, the expected rate of return is still 11.9%. The
standard deviation, meanwhile, decreases by a factor of +). Thus, while the annualized
standard deviation of returns was 423.5% for a single investment, it is merely 34.6%
�/�%+�A
in the case of 150 investments.
27
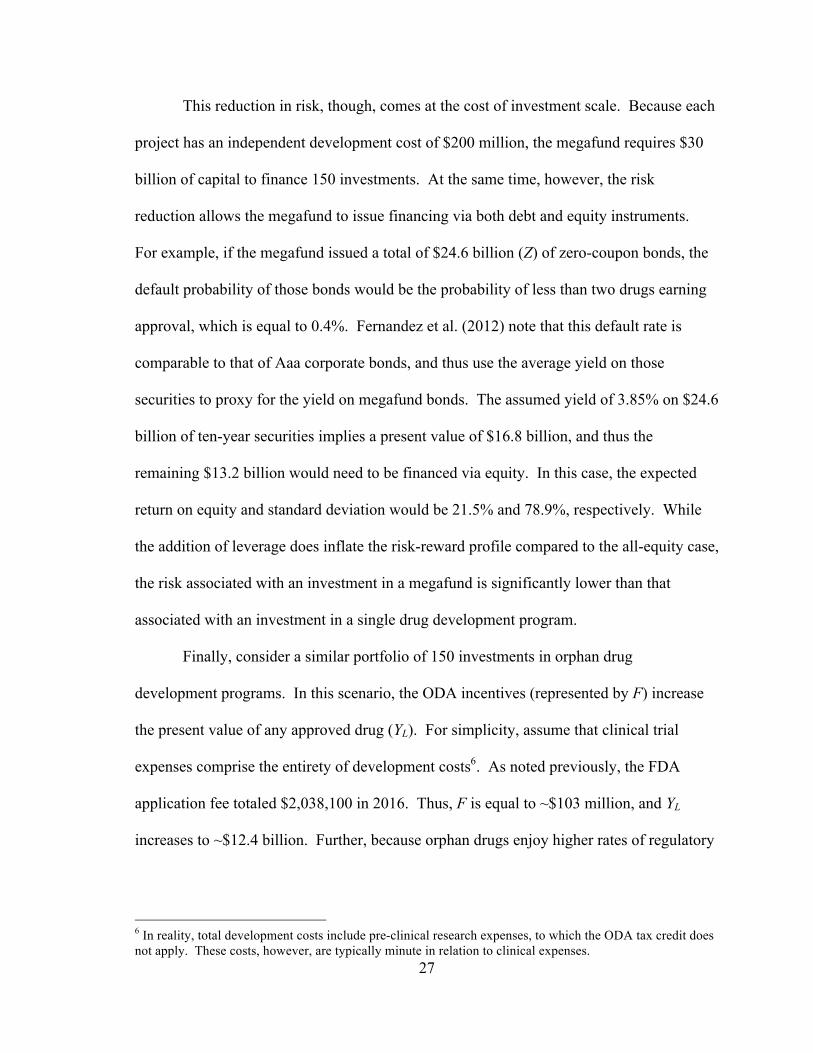
This reduction in risk, though, comes at the cost of investment scale. Because each
project has an independent development cost of $200 million, the megafund requires $30
billion of capital to finance 150 investments. At the same time, however, the risk
reduction allows the megafund to issue financing via both debt and equity instruments.
For example, if the megafund issued a total of $24.6 billion (Z) of zero-coupon bonds, the
default probability of those bonds would be the probability of less than two drugs earning
approval, which is equal to 0.4%. Fernandez et al. (2012) note that this default rate is
comparable to that of Aaa corporate bonds, and thus use the average yield on those
securities to proxy for the yield on megafund bonds. The assumed yield of 3.85% on $24.6
billion of ten-year securities implies a present value of $16.8 billion, and thus the
remaining $13.2 billion would need to be financed via equity. In this case, the expected
return on equity and standard deviation would be 21.5% and 78.9%, respectively. While
the addition of leverage does inflate the risk-reward profile compared to the all-equity case,
the risk associated with an investment in a megafund is significantly lower than that
associated with an investment in a single drug development program.
Finally, consider a similar portfolio of 150 investments in orphan drug
development programs. In this scenario, the ODA incentives (represented by F) increase
the present value of any approved drug (YL). For simplicity, assume that clinical trial
expenses comprise the entirety of development costs6. As noted previously, the FDA
application fee totaled $2,038,100 in 2016. Thus, F is equal to ~$103 million, and YL
increases to ~$12.4 billion. Further, because orphan drugs enjoy higher rates of regulatory
6 In reality, total development costs include pre-clinical research expenses, to which the ODA tax credit does not apply. These costs, however, are typically minute in relation to clinical expenses.

28
success than non-orphan drugs, a 10% probability of success better represents the realities
of orphan drug development.
Given these assumptions, an all-equity portfolio of 150 orphan drug investments
would generate an expected compound annual rate of return of +A%∗$+/.�$A./
FFG − 1 = 20%
with an annualized standard deviation of 48%. While the promise of higher returns does
increase the portfolio’s risk, the relative increase in expected returns exceeds that in
expected standard deviation, implying that the overall risk-reward profile of an all-equity
portfolio is generally more attractive for orphan drugs than non-orphan drugs. Further,
assume that the megafund issued $24.8 billion in zero-coupon bonds. Like before, the
probability of default on those bonds is the probability of less than two drugs earning
approval, which is equal to .0002%, 200x smaller than that in the non-orphan drug
scenario. This value is consistent with (and in most cases, lower than) the default rates
among the safest debt securities available, and largely results from the increased rate of
regulatory success for orphan drugs.
The preceding analysis suggests that, ceteris paribus, ODA incentives serve to
increase overall portfolio expectations and performance. This model, however, is
illustrative and presents an overtly stylized exemplar of drug development. Further, the
model assumes that the drug development programs comprising the portfolio are
statistically independent. While this is convenient mathematically, it is unlikely to hold in
practice. Thus, the framework presented in exposition may overstate the diversification
benefits of portfolio financing (Fernandez et al. 2012). Pairwise correlation, while not
considered here, is incorporated explicitly in the megafund simulations presented hereafter.

29
Irrespective of its simplifications, my modified framework successfully
incorporates the financial incentives mandated by the Orphan Drug Act within the
megafund model. While purely for illustrative purposes, the integration of these elements
demonstrates the quantitative benefits of orphan drug development while adding
qualitative depth to the model. The combination of these incentives, as well as the
pathological characteristics mentioned previously, suggest that orphan drugs may be
particularly apt for large-scale, portfolio financing. But, an important question remains: in
the case of government-imposed price controls, is the orphan drug megafund still a viable
solution to the suboptimal accessibility of capital for biomedical research? Can the
benefits of portfolio financing outweigh the detriments of invariably-restrained returns?
Ostensibly, the answers are ambiguous. The definitive resolution of these questions
necessitates expanding this analysis beyond the illustrative. The remainder of this paper
attempts to answer these questions analytically via the simulation of portfolio performance
in price control scenarios.
5. Price Control Simulations
Within the wider drug pricing debate, the ODA has been the subject of extensive
legislative dispute. For example, the act was amended in 1994, ’95, and ’98, all of which
remain in place today, while countless further revisions have fallen short in Congress. The
proffered restraints vary in their severity and structure, but generally fall within one of two
silos: fixed, in which one specific restraint is applied to all relevant goods, and variable, in
which the extent or type of control is dependent on a subset of traits specific to each good.
As such, I consider a proposed orphan drug price control from each silo. I then use

30
statistical simulations to analyze the effects of each price control regime on the megafund’s
performance. Specific details regarding the simulations and price control policies follow.
5.1 Simulation Framework and Parameters
Following the structure of Fagnan et al. (2014), I simulate the performance of an
orphan drug megafund under the pressure of price controls. These simulations embody a
purely probabilistic model, and thus are independent of the illustrative framework
presented previously. The model takes the form of a Discrete-Time Markov Process, a
type of stochastic process in which the transition from state n to state n+1 is independent
of the transition from n-1 to n. In other words, the past is conditionally independent of the
future given the present state. Within the simulations completed here, and consistent with
Fernandez et al. (2012), the Markov process takes the following form:
For each stage in the drug approval process, a vector of transition probabilities is
generated which represents the probability that a drug candidate transitions from state n to
state n+1 at any given time t. At each simulation period and for each drug candidate in the
portfolio, a random number is generated and assigned from a uniform distribution. The
value of this number is then compared to the probability vector to determine if the
candidate transitions to the next state. This process continues through fourteen iterations
for a total of fifteen simulation periods. Throughout the simulation, cash flow waterfall
rules delineate the allocation of funds at each iteration. At the beginning of each period,
proceeds from sales in the previous period are added to the portfolio’s cash balance. That
cash is then used, in order, for the following: payment of the megafund management fee,
senior bond interest payments, senior bond principal payments, junior bond interest
payments, and junior bond principal payments. If the sum of these liabilities exceeds the

31
current cash balance, the outstanding bonds default and the portfolio’s assets are
liquidated. If the megafund is not in default, a cash reserve is set aside for future debt
payments, and any surplus cash is used to finance clinical trials for those compounds that
have successfully transitioned. Once all outstanding bond payments have been satisfied,
the assets are liquidated and the residual proceeds are allocated to the equity holders.
While the preceding description is a gross simplification, it suffices for my
purposes. I encourage curious readers to refer to Fernandez at al. (2012) for further
clarification.
I simulate the performance of a megafund with an initial capital of $575 million
which invests in sixteen orphan drug candidates. The fund is simulated under two distinct
price control regimes, as described in subsequent chapters. In both cases, the fund’s
performance is simulated over fifteen consecutive six-month periods during which
acquired drug candidates are either advanced to the next clinical stage, sold, or withdrawn.
An equal number of pre-clinical and Phase I candidates are acquired with a projected
liquidation following the completion of Phase II trials, but candidates can be sold
beforehand to service outstanding RBO liabilities. To isolate the effects of price controls
and ensure comparability between my results and those presented in Fagnan et al. (2014),
unrelated parameters are left unchanged. In addition, a series of assumptions are made
regarding the nature of the drug development process, including clinical trial costs and
duration, phase transition probabilities, and drug valuations. These assumptions, as
presented in Table 5.1, are discussed at length hereafter.
The drug development process consists of five stages: (1) Pre-clinical testing; (2)
Phase I clinical trials; (3) Phase II; (4) Phase III; and (5) New Drug Application (NDA).
32
Timelines for this process were generated from the wider literature. Paul et al. (2010)
provide pre-clinical timeline data across all drug classes. While these data are not specific
to orphan drugs, the primary objective of pre-clinical testing is the verification of a drug’s
safety and toxicity profile, which should not vary significantly across drug classes.
Clinical trial length, on the other hand, often differs for orphan drugs because trials must
be structured to accommodate small, often dispersed, patient populations. Kaitin and
DiMasi (2010) provide data for the average length of orphan drug trials from Phase I to
NDA (5.9 years) and from NDA to regulatory decision (0.8 years). From there, the
distribution of trial lengths by phase from Fernandez et al. (2012) is used to stratify the
averages across the regulatory phases. The resulting timeline follows in Table 5.1.
The results of Paul et al. (2010) and Kaitin and DiMasi (2010) were also used to
inform the success probabilities for each stage. Orphan drugs have proven to have higher
rates of regulatory success in aggregate, but little has been done to isolate success
probabilities by stage. As such, data for biologic drugs is used as an alternative. While
this extrapolation is not perfect, biologics comprised 40% of approved orphan drugs in
2013, and thus serve as a reasonable proxy (Fagnan et al. 2014). The resulting success
rates by stage can be found in Table 5.1. Compounding these values generates an overall
approval probability of 0.218, or 21.8%, which is analogous to the results of Hay et al.
(2014).
Clinical trial costs were similarly gleaned from previous analyses. Pre-clinical
costs were taken from Paul et al. (2010), again under the assumption that pre-clinical
development does not differ significantly between orphan and non-orphan drugs. Clinical
costs were calculated by multiplying average trial sizes by estimates of per patient costs.

33
Orfali et al. (2012) report average clinical trial sizes for approved orphan drugs between
2001 and 2011. Using estimates of average costs per patient from Mathieu (2009), Fagnan
et al. (2014) generate a distribution of costs by phase, as presented in Table 5.1.
Lastly, the simulations utilize a valuation matrix to assign drug candidates a present
value at each stage of development. Assuming average annual revenues of $200 million,
per Thomson Reuters (2012), an average 11.7-year exclusivity period, per Seoane-Vazquez
(2008), and a 10% cost of capital, per Harrington (2012), the present value of an approved
orphan drug is ~$2 billion. Fagnan et al. (2014) then reduce this value by 40% to account
for marketing and selling expenses, yielding a final valuation of $818 million per approved
orphan drug. Finally, the average success rates discussed previously were used to calculate
valuations corresponding to each development phase. The resulting valuations are shown
in Table 5.1. In addition, the simulations assume a pairwise correlation of 20% amongst
asset valuations, which was calculated from Bloomberg market data on the mean
correlation of equity returns of small biopharmaceutical firms (Fernandez et al. 2012).
Within my simulations, it is through drug valuations that the implementation of
price controls influence portfolio performance. Specific details regarding the controls and
their dynamics are discussed below.

34
5.2 The Kassebaum/Metzenbaum Sales Trigger
The first orphan drug price control efforts were championed by Senators Nancy
Kassebaum (R-KS) and Howard Metzenbaum (D-OH). Proposed to the 102nd Congress in
1991-92, the Kassebaum/Metzenbaum Initiative stipulated the implementation of a ‘sales
trigger’ beyond which a drug would lose its market exclusivity privileges. The amendment
guarantees market exclusivity for a period of two years, after which and for the following
five years, it would be revoked if cumulative net sales surpassed a threshold of $200
million (Garcia 2004). Cognizant of potential unintended consequences, more recent
iterations of the legislation have tempered its injunctions. In the proposed amendments of
1993-94, the guaranteed period of exclusivity was extended to four years, with a potential
three-year extension given demonstrated ‘limited commercial value’ (Waxman 1994).
Additionally, proponents have argued that the sales trigger be set at $200 million in annual
sales (as opposed to cumulative sales) to reflect inflationary changes since the legislation
was conceived. These efforts at modernization display the broad support behind the sales
trigger approach, and as such, it is likely that prospective ODA reform would, at minimum,
build off its ideology. For this reason, integration of the Kassebaum/Metzenbaum

35
Initiative is essential when considering the impact of price controls on the orphan drug
megafund model. Rather than the original, I consider the diluted, modernized version is in
the proceeding analysis, as it is more likely to garner bipartisan legislative support going
forward.
Within the illustrative framework, the sales trigger manifests itself in two ways: (1)
By imposing an upper bound on annual cash flows, X, such that 0 ≤ 𝑋 ≤ 200,000. For
simplicity, I assume that X=0 following the loss of exclusivity; and (2) By expanding the
lower bound of market exclusivity, L, from seven to four years. To discuss the
repercussions of such an intervention, one must revisit the model developed previously:
Given a cost of capital, r, and a present value cost of development, C, the total
investment return, Rs, between t=0 and t=L for a single approved drug is as follows:
𝑅[ =nIo− 1 =
pq +: F
Frq I 6s
o− 1
where X and YL are now bound such that 0 ≤ 𝑋 ≤ 200,000 and 4 ≤ 𝐿 ≤ 20
Thus, the mathematical structure of the illustrative model will not change, but its
distribution will. By establishing an upper bound, the sales trigger approach will
effectively restrain YL. This, in turn, will decrease the portfolio’s mean return, Rp, and
increase the number of successes (Ii=1) necessary to service its debt liability, Z.
Meanwhile, expanding the range of market exclusivity, L, will increase the portfolio’s
variance. Thus, I expect that the implementation of a price trigger will adversely affect all
three measures of portfolio performance. The magnitude of this effect, however, is harder
to ascertain.
To do so, these restraints must be incorporated within the simulation’s parameters.
As noted previously, price controls operate via drug valuations. Because the valuations
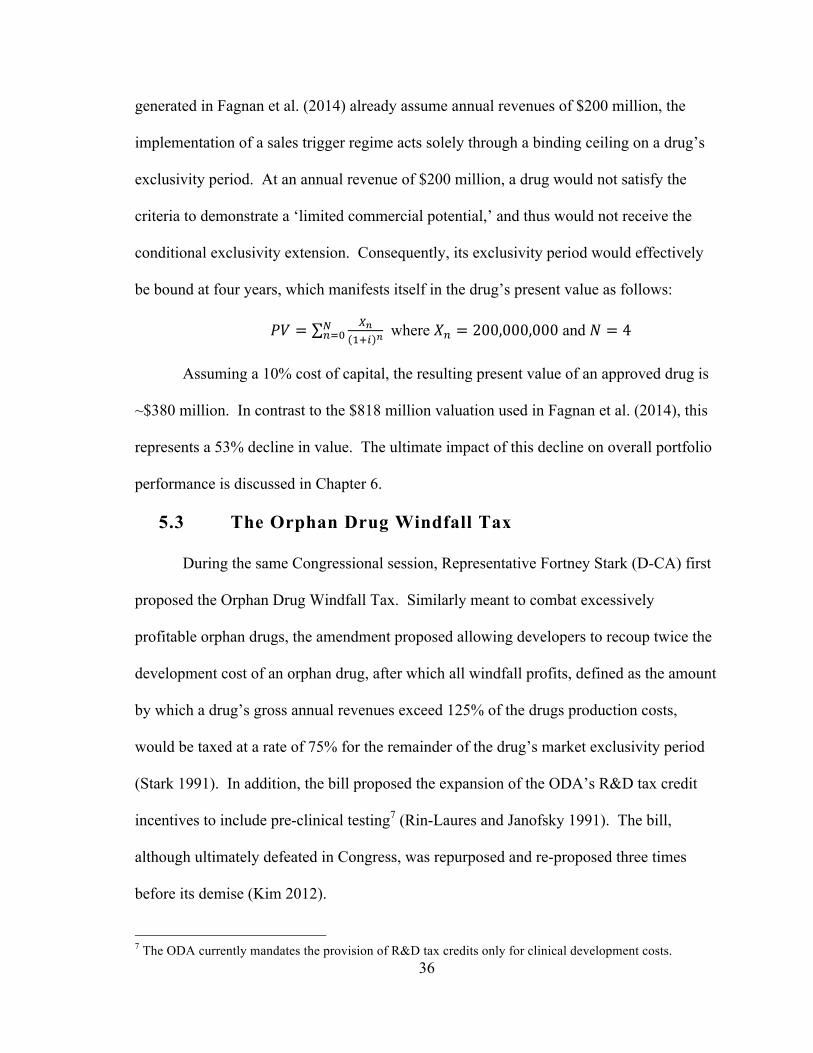
36
generated in Fagnan et al. (2014) already assume annual revenues of $200 million, the
implementation of a sales trigger regime acts solely through a binding ceiling on a drug’s
exclusivity period. At an annual revenue of $200 million, a drug would not satisfy the
criteria to demonstrate a ‘limited commercial potential,’ and thus would not receive the
conditional exclusivity extension. Consequently, its exclusivity period would effectively
be bound at four years, which manifests itself in the drug’s present value as follows:
𝑃𝑉 = By+6% y
�)*A where 𝑋) = 200,000,000 and 𝑁 = 4
Assuming a 10% cost of capital, the resulting present value of an approved drug is
~$380 million. In contrast to the $818 million valuation used in Fagnan et al. (2014), this
represents a 53% decline in value. The ultimate impact of this decline on overall portfolio
performance is discussed in Chapter 6.
5.3 The Orphan Drug Windfall Tax
During the same Congressional session, Representative Fortney Stark (D-CA) first
proposed the Orphan Drug Windfall Tax. Similarly meant to combat excessively
profitable orphan drugs, the amendment proposed allowing developers to recoup twice the
development cost of an orphan drug, after which all windfall profits, defined as the amount
by which a drug’s gross annual revenues exceed 125% of the drugs production costs,
would be taxed at a rate of 75% for the remainder of the drug’s market exclusivity period
(Stark 1991). In addition, the bill proposed the expansion of the ODA’s R&D tax credit
incentives to include pre-clinical testing7 (Rin-Laures and Janofsky 1991). The bill,
although ultimately defeated in Congress, was repurposed and re-proposed three times
before its demise (Kim 2012).
7 The ODA currently mandates the provision of R&D tax credits only for clinical development costs.
37
Because it simultaneously extends one of the existing ODA incentives, the windfall
tax proposal garnered support as a less severe alternative to the sales trigger approach. The
two are not mutually exclusive, but rather, occupy different sides of the same coin. As
such, the integration of a sales trigger regime within the megafund model necessitates a
parallel consideration of the windfall tax. To do so, one must return to the equation for a
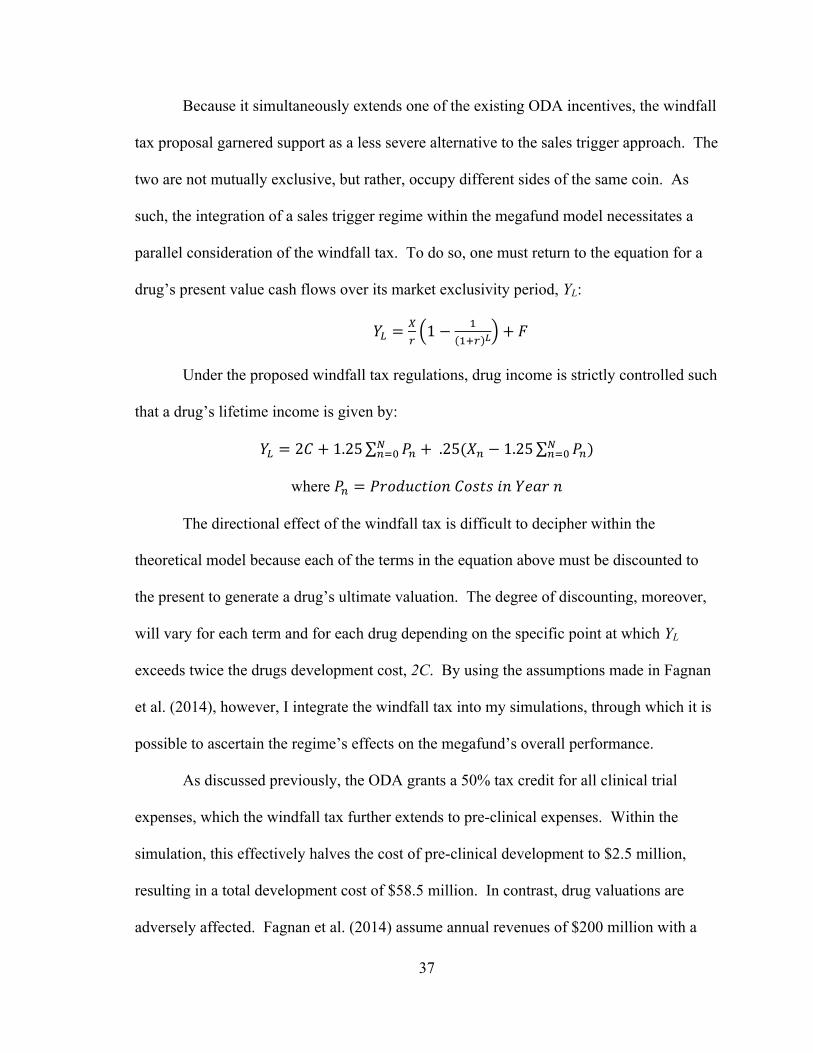
drug’s present value cash flows over its market exclusivity period, YL:
𝑌H =BC1 − +
+6C I + 𝐹
Under the proposed windfall tax regulations, drug income is strictly controlled such
that a drug’s lifetime income is given by:
𝑌H = 2𝐶 + 1.25 𝑃) + .25(𝑋) − 1.25 𝑃))�)*A
�)*A
where 𝑃) = 𝑃𝑟𝑜𝑑𝑢𝑐𝑡𝑖𝑜𝑛𝐶𝑜𝑠𝑡𝑠𝑖𝑛𝑌𝑒𝑎𝑟𝑛
The directional effect of the windfall tax is difficult to decipher within the
theoretical model because each of the terms in the equation above must be discounted to
the present to generate a drug’s ultimate valuation. The degree of discounting, moreover,
will vary for each term and for each drug depending on the specific point at which YL
exceeds twice the drugs development cost, 2C. By using the assumptions made in Fagnan
et al. (2014), however, I integrate the windfall tax into my simulations, through which it is
possible to ascertain the regime’s effects on the megafund’s overall performance.
As discussed previously, the ODA grants a 50% tax credit for all clinical trial
expenses, which the windfall tax further extends to pre-clinical expenses. Within the
simulation, this effectively halves the cost of pre-clinical development to $2.5 million,
resulting in a total development cost of $58.5 million. In contrast, drug valuations are
adversely affected. Fagnan et al. (2014) assume annual revenues of $200 million with a

38
profit margin of 60%, which implies an $80 million per annum cost of goods sold (COGS)
per approved drug. At this level, an approved drug’s revenue exceeds twice its
development cost ($117 million) in the first year, after which, and for the remainder of the
drug’s exclusivity period, any revenue beyond $100 million (125% of production costs, Pn)
are taxed at a rate of 75%. The present value of the resulting stream of cash flows is given
by:
𝑃𝑉 = ++�+6C
+ ./�∗ /AA:++�+6C
+ +AA+6C I +H
H*A./�∗+AA+6C I
HH*A
Thus, in the first year, the drug generates a net cash flow of $137.75 million,
followed by a net cash flow of $125 million every year thereafter. In line with Fagnan et
al. (2014), I assume a 10% discount rate, a market exclusivity period of 12 years, and a
40% marketing and selling write-down, which ultimately yields a present value of ~$518
million per approved drug. The ultimate impact of this decline on portfolio performance is
discussed in Chapter 6.
The relevant simulation parameters for each scenario are listed in full on the
following page (Table 5.2).

39
6. Results
The simulation results largely correspond to intuitive predictions: in both cases, the
implementation of price controls significantly reduces the portfolio’s annualized return on
equity (referred to as ROE hereafter). In the sales trigger scenario, the resulting ROE is
4.0%, representing a 70% decline from the base case returns. The decline is less severe in
the windfall tax scenario, amounting to an ROE of 9.9%, a 26% drop.
Interestingly, under both price control scenarios, the megafund outperformed the
base case in terms of debt fulfillment. While the RBO default probabilities in Fagnan et al.
(2014) were 0.8 and 56 basis points for the senior and junior RBO tranches, respectively,
they were <.01 and <30 bp under both price control scenarios. While the differences are
not quantitatively material, this is a qualitatively unexpected result. I suspect that it may

40
be attributable to a rightward shift in the distribution for drug sale period. In the base case
scenario, the ratio of drug candidates sold in Phase II vs. Phase III was ~1:2. The ratio
rose to ~1:2.4 and ~1:2.6 in the sales trigger and windfall tax scenarios, respectively. This
shift illustrates the cash flow pressure exerted by diminished drug valuation. Because the
value of any given drug falls in a price control scenario, the megafund must increase its
average investment horizon with the hope of liquidating drug candidates at larger, later
valuations. The results suggest that, at the valuation parameters used here, this shift is
consequential only for the equity tranche. However, one would expect that default risk is
decreasing in valuation, and thus past a certain threshold valuation, the megafund’s ability
to service its debt liabilities would be materially influenced.
To test this theory, I execute the simulations using a valuation of $100 million to
proxy for extreme cash flow pressure. In this case, the default probabilities jumped to 10
and 660 basis points for the senior and junior tranches, respectively. Thus, the negligible
default rates generated in the price control scenarios suggest that the RBO risk profiles are
relatively insensitive to drug valuations.
The results are presented in Table 6.1. The table is comprised of three sections.
The megafund’s research impact refers to the number of compounds which were
successfully advanced through clinical trials and sold in each drug development phase.
The equity performance subheading contains a variety of performance metrics for the
megafund’s equity tranche. While the average annualized ROE is the preferred measure of
performance, I also include a variety of probability measures for different ranges of ROE.
Finally, the RBO performance subheading contains default the probability and expected
loss, presented in basis points, for both the senior and junior RBO tranches.
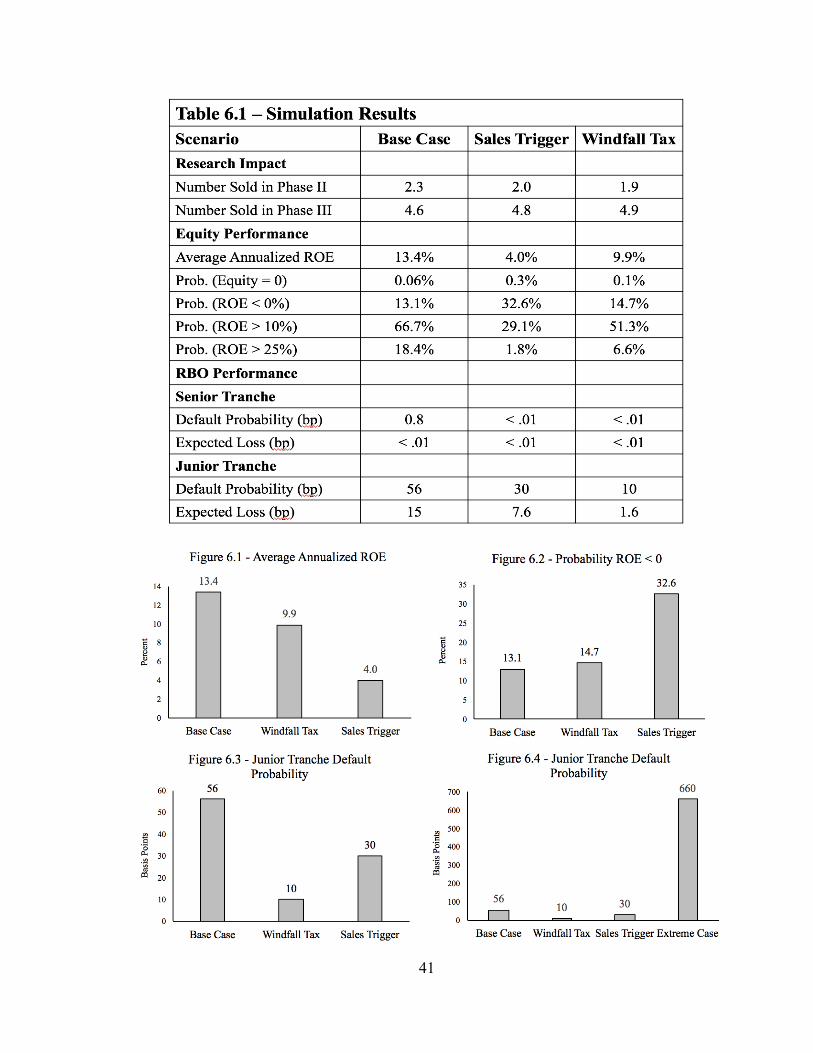
41
42
7. Discussion
The orphan drug megafund, by addressing information asymmetry problems and
providing large-scale financing, increases the amount of loanable funds available for
biomedical R&D, which may ultimately stimulate long-run medical innovation. My
results suggest that price controls significantly obscure the feasibility of such a model.
Interestingly, though, only in the sales trigger scenario do price controls implicate its
feasibility entirely. It is likely that the megafund, under the downward pressure of a sales
trigger price control regime, would fail to provide sufficient risk-adjusted returns to attract
the scope of investment necessary for proper implementation. Conversely, in the windfall
tax scenario, the megafund proved particularly resilient. At an annualized ROE of 9.9%
and a 14.7% probability of a negative return, the megafund still offers a risk-reward profile
comparable to many historically attractive equity instruments. For example, the geometric
average return on the S&P 500 stock market index from 1928 – 2016 was 9.52% while the
probability of a negative return was ~27% (Damodaran 2017).
These results, and in particular, the disparity between the megafund’s performance
across the two price control scenarios, carry implications which could inform policy
decisions regarding drug prices. The most salient of these concern the differential merits
of various price control structures. In general terms, the simulations measure the
megafund’s performance under both a multidimensional, fixed regime and a
unidimensional, variable regime. The sales trigger represents a multidimensional, fixed
price control, as it targets both drug profits and market exclusivity, and is implemented at a
rigid threshold regardless of the circumstances. The windfall tax, in contrast, takes the

43
form of a unidimensional, variable price control, as it targets only drug profits, and its
extent is dependent on a subset of traits specific to each drug.
The results here suggest that the economic incentives for drug development may be
further restrained under a multidimensional, fixed price control regime as opposed to a
unidimensional, variable regime. It seems intuitive that multidimensional restraints would
be more distortionary than unidimensional controls. One would expect several
simultaneous restraints to act multiplicatively, resulting in a significant reduction in
commercial potential; and indeed, this is what my findings suggest. The second argument
is less intuitive. It may be that variable price control regimes are more akin to case-by-
case regulation, and grant the governing entity more flexibility to allow for moderate
producer surplus while preventing exploitation.
In sum, the results suggest that, despite a marginal reduction in overall
performance, the orphan drug megafund model proves resilient to a moderate level of price
regulation, and thus may remain a solution to the suboptimal accessibility of capital for
biomedical research despite government intervention. Importantly, though, megafund
performance declines with increasing regulatory rigor. Such a finding illustrates the
potential for extreme constraints to smother biomedical innovation, and suggests that,
conditional on government intervention, a moderate, unidimensional price control regime
may represent an optimal strategy.
While these considerations are imperative for a strictly financial discussion of drug
pricing policy, my analysis does not address the welfare implications of price regulation
and its various forms. On the surface, it seems that the megafund model could effectively
address market failures in biomedical capital markets despite moderate price controls,

44
which may represent a Pareto improvement in net. Detailed welfare considerations are
beyond the scope of this analysis, but should be an important concern in any market
intervention strategy.
In addition, this paper fails to address a host of administrative challenges which
must be overcome for the megafund model to be implemented. These challenges include,
but are not limited to, the intellectual capacity of the biomedical research sector, secondary
market liquidity for biopharmaceutical compounds, the megafund’s ability to provide
managerial and industry-specific expertise (à la venture capitalists), and the uncertainty
associated with the potential repeal or restructuring of the Affordable Care Act. While
these issues lie outside the realm of my analysis, I encourage interested readers to refer to
Fernandez at al. (2012) for a more detailed discussion.
8. Conclusion
Financing drug development is a complex and imperfect process. Biomedical
capital markets experience more severe information asymmetry problems than most capital
markets, and are largely devoid of financial innovation to ameliorate such imperfections.
The biomedical megafund, by providing large-scale financing and mediating scale
misalignment, offers a potential solution to the suboptimal accessibility of capital for
biomedical research. In this paper, I have shown that pharmaceutical price controls
restrain the financial efficacy of this model. I have tailored and expanded the megafund
theoretical framework to better represent the realities of orphan drug development. I have
illustrated how the integration of ODA incentives suggests that orphan drugs may be
particularly apt for portfolio financing. Finally, I have compared the performance of an

45
orphan drug megafund under the status quo to an identical megafund under two price
control regimes.
My results indicate that megafund performance is relatively insensitive to moderate
price controls, and thus may remain a solution to the suboptimal accessibility of capital for
biomedical research despite government intervention. Further, they suggest that variable,
unidimensional price controls may represent a financially optimal drug pricing policy with
respect to the trade-off between managing drug expenditures and incentivizing R&D.
Overly restrictive price controls, conversely, may exacerbate underinvestment in R&D and
render financing alternatives like the megafund implausible.
These results, however, are merely suggestive rather than conclusive. The
simulations rely on a host of assumptions about the drug development process and market.
While I believe my assumptions are accurate and conservative, the pharmaceutical industry
evolves in parallel with biomedical innovation, and thus the realities of drug development
tomorrow may look different than they do today. Further, any implications for drug
pricing policy are strictly financial, and do not encompass the welfare analyses which any
proposal would necessitate.
Finally, it is important to note the precision of my analysis. The megafund is
merely one of several alternative financing models, including Drug Royalty Investment
Funds, ‘Regulated Investment’ Business Development Companies, and Health Care Loan
Securitization, among others. Moreover, the price controls considered here are only two of
an innumerable array. Indeed, the threat of price controls has contributed to the growing
popularity of other pricing alternatives, including value-based and indication-specific
pricing regimes. Regardless of the financing model and pricing structure used, it is a

46
foregone conclusion that the existing model of drug development and market pricing will
be forced to evolve in the immediate future. As this paper illustrates, the balance between
drug affordability and economic allure is tenuous, but optimizing this trade-off is
paramount for ensuring both access and innovation. Straying too far in either direction
may have grave consequences.

47
References
Akerlof, George. 1995. “The Market for ‘Lemons’: Quality Uncertainty and the Market Mechanism.” In Essential Readings in Economics, 175–88. Springer.
Arrow, Kenneth. 1962. “Economic Welfare and the Allocation of Resources for Invention.” In The Rate and Direction of Inventive Activity: Economic and Social Factors, 609–26. Princeton University Press.
Baeyens, K., T. Vanacker, and S. Manigart. 2006. “Venture Capitalists’ Selection Process: The Case of Biotechnology Proposals.” International Journal of Technology Management 34 (1-2): 28–46.
Bernstein, Shai, Xavier Giroud, and Richard R. Townsend. 2016. “The Impact of Venture Capital Monitoring.” The Journal of Finance 71 (4): 1591–1622.
Bloom, Nick, Rachel Griffith, and John Van Reenen. 2002. “Do R&D Tax Credits Work? Evidence from a Panel of Countries 1979–1997.” Journal of Public Economics 85 (1): 1–31.
Brown, Ward, and Urs Haegler. 1997. “R&D Intensity and Finance: Are Innovative Firms Financially Constrained?” Economic & Social Research Council.
Cecchetti, Stephen, and Kermit Schoenholtz. 2015. Money, Banking, and Financial Markets. Fourth. New York: McGraw-Hill Education.
Damodaran, Aswath. 2017. “Historical Returns: Stocks, T. Bonds & T. Bills with Premiums.” NYU Stern.
Danzon, Patricia M., and Michael F. Furukawa. 2008. “International Prices And Availability Of Pharmaceuticals In 2005.” Health Affairs 27 (1): 221–33.
DiMasi, Joseph A., Henry G. Grabowski, and Ronald W. Hansen. 2016. “Innovation in the Pharmaceutical Industry: New Estimates of R&D Costs.” Journal of Health Economics 47 (May): 20–33.
Drucker, Steven, and Christopher Mayer. 2008. “Inside Information and Market Making in Secondary Mortgage Markets.” Unpublished Working Paper. Columbia Business School, The Paul Milstein Center for Real Estate, New York.
Eger, Stephan, and Jörg C Mahlich. 2014. “Pharmaceutical Regulation in Europe and Its Impact on Corporate R&D.” Health Economics Review 4 (October).
Ellison, Sara Fisher, and Wallace P. Mullin. 2001. “Gradual Incorporation of Information: Pharmaceutical Stocks and the Evolution of President Clinton’s Health Care Reform.” The Journal of Law and Economics 44 (1): 89–129.
Ernst & Young. 2015. “Impact of the Orphan Drug Tax Credit on Treatment for Rare Diseases.” Biotechnology Industry Organization.
Express Scripts. 2016. “Express Scripts 2015 Drug Trend Report Executive Summary.” Express Scripts Lab.
Fabozzi, Frank, and Vinod Kothari. 2008. Introduction to Securitization. Hoboken, NJ: John Wiley & Sons, Inc.
Fagnan, David E., Austin A. Gromatzky, Roger M. Stein, Jose-Maria Fernandez, and Andrew W. Lo. 2014. “Financing Drug Discovery for Orphan Diseases.” Drug Discovery Today 19 (5): 533–38.
Fernandez, Jose-Maria, Roger M. Stein, and Andrew W. Lo. 2012. “Commercializing Biomedical Research through Securitization Techniques.” Nature Biotechnology 30 (10): 964–75.

48
Garber, Alan M. 1994. “Benefits versus Profits: Has the Orphan Drug Act Gone Too Far?” PharmacoEconomics 5 (2): 88–92.
Garcia, Anton Leis. 2004. “Is the Copy Better than the Original? The Regulation of Orphan Drugs: A US-EU Comparative Perspective.” Harvard University.
Giaccotto, Carmelo, Rexford E. Santerre, and John A. Vernon. 2005. “Drug Prices and Research and Development Investment Behavior in the Pharmaceutical Industry.” The Journal of Law & Economics 48 (1): 195–214.
Golec, Joseph, Shantaram Hegde, and John A. Vernon. 2010. “Pharmaceutical R&D Spending and Threats of Price Regulation.” Journal of Financial & Quantitative Analysis 45 (1): 239–64.
Golec, Joseph, and John A. Vernon. 2010. “Financial Effects of Pharmaceutical Price Regulation on R&D Spending by EU versus US Firms.” PharmacoEconomics 28 (8): 615–28.
Grabowski, Henry, and John Vernon. 2001. “The Determinants of Pharmaceutical Research and Development Expenditures.” In Capitalism and Democracy in the 21st Century, 207–21. Springer.
Grace, Cheri, and Margaret Kyle. n.d. “Comparative Advantages of Push and Pull Incentives for Technology Development: Lessons for Neglected Disease Technology Development.”
Hall, Bronwyn H. 1992. “Investment and Research and Development at the Firm Level: Does the Source of Financing Matter?” Working Paper 4096. National Bureau of Economic Research.
Hall, Bronwyn H., and Josh Lerner. 2010. “The Financing of R&D and Innovation.” Handbook of the Economics of Innovation 1: 609–39.
Harrington, S. 2012. “Cost of Capital for Pharmaceutical, Biotechnology, and Medical Device Firms.” In The Oxford Handbook of the Economics of the Biopharmaceutical Industry, edited by P. Danzon and S. Nicholson, 75–99. Oxford University Press.
Hay, Michael, David W. Thomas, John L. Craighead, Celia Economides, and Jesse Rosenthal. 2014. “Clinical Development Success Rates for Investigational Drugs.” Nature Biotechnology 32 (1): 40–51.
Hemphill, Thomas. 2010. “Extraordinary Pricing of Orphan Drugs: Is It a Socially Responsible Strategy for the U.S. Pharmaceutical Industry?” Journal of Business Ethics 94 (2): 225–42.
Hirschler, Ben. 2017. “New Drug Approvals Fall to Six-Year Low in 2016.” Reuters, January 2.
Iacobucci, Edward M., and Ralph A. Winter. 2005. “Asset Securitization and Asymmetric Information.” The Journal of Legal Studies 34 (1): 161–206.
Jameson, Mel, S Dewan, and C.F. Sirmans. 1992. “Measuring Welfare Effects of ‘unbundling’ Financial Innovations: The Case of Collateralized Mortgage Obligations.” Journal of Urban Economics 31 (1).
Jobst, Andreas. 2008. “Back to Basics-What Is Securitization?” Finance & Development 45 (3): 48.
Kassebaum, Nancy. 1992. “S.2060 - 102nd Congress (1991-1992): Orphan Drug Amendments of 1992.” Legislation. August 4.
Kim, Sumin. 2012. “Orphan Drug Act: How the FDA Unlawfully Usurped Market Exclusivity, The.” Nw. J. Tech. & Intell. Prop. 11: v.

49
Kramer, William, and Chirag Patel. n.d. “Securitisation of Intellectual Property Assets in the US Market.” Marshall, Gerstein & Borun.
Kutyavina, Marina. 2010. The Effect of Price Control Threats on Pharmaceutical R&D Investments.
Lichtenberg, Frank R. 2001. “Probing The Link Between Gross Profitability And R&D Spending.” Health Affairs 20 (5): 221–22.
———. 2006. “Importation and Innovation.” Working Paper 12539. National Bureau of Economic Research.
Lockett, Andy, Gordon Murray, and Mike Wright. 2002. “Do UK Venture Capitalists Still Have a Bias against Investment in New Technology Firms.” Research Policy 31 (6): 1009–30.
Maher, Paul. 2008. “Pharmacogenomics of Rare and Monogenic Disorders.” In Pharmacogenomics and Personalized Medicine, edited by N. Cohen. Humana Press.
Maitland, Ian. 2002. “Priceless Goods: How Should Life-Saving Drugs Be Priced?” Business Ethics Quarterly 12 (4): 451–80.
Mathieu, M. 2009. “PAREXEL Biopharmaceutical Statistical Sourcebook 2009–2010.” Meekings, Kiran N., Cory S. M. Williams, and John E. Arrowsmith. 2012. “Orphan Drug
Development: An Economically Viable Strategy for Biopharma R&D.” Drug Discovery Today 17 (13–14): 660–64.
Nelson, Richard R. 1959. “The Simple Economics of Basic Scientific Research.” Journal of Political Economy 67.
Orfali, M, L Feldman, V Bhattacharjee, P Harkins, S Kadam, C Lo, M Ravi, et al. 2012. “Raising Orphans: How Clinical Development Programs of Drugs for Rare and Common Diseases Are Different.” Clinical Pharmacology & Therapeutics 92 (2): 262–64.
Pammolli, Fabio, Laura Magazzini, and Massimo Riccaboni. 2011. “The Productivity Crisis in Pharmaceutical R&D.” Nature Reviews Drug Discovery, no. 6: 428.
Paul, Steven M., Daniel S. Mytelka, Christopher T. Dunwiddie, Charles C. Persinger, Bernard H. Munos, Stacy R. Lindborg, and Aaron L. Schacht. 2010. “How to Improve R&D Productivity: The Pharmaceutical Industry’s Grand Challenge.” Nature Reviews Drug Discovery, November.
PhRMA. 2015. “Biopharmaceutical Research & Development: The Process Behind New Medicines.”
Rau, Jordan. 2016. “Poll Finds Majority Of Americans Want Restraints On Drug Prices.” Kaiser Health News. September 29.
Rin-Laures, Li-Hsien, and Diane Janofsky. 1991. “Recent Developments Concerning the Orphan Drug Act.” Harv. J. Law & Tec 4: 269–99.
Rohde, David Duffield. 2000. “The Orphan Drug Act: An Engine of Innovation-At What Cost.” Food & Drug LJ 55: 125.
Scherer, F. M. 2001. “The Link Between Gross Profitability And Pharmaceutical R&D Spending.” Health Affairs 20 (5): 216–20.
Seoane-Vazquez, Enrique, Rosa Rodriguez-Monguio, Sheryl L. Szeinbach, and Jay Visaria. 2008. “Incentives for Orphan Drug Research and Development in the United States.” Orphanet Journal of Rare Diseases 3 (1): 1–7.
Sirmans, C.F., and John D. Benjamin. 1990. “Pricing Fixed Rate Mortgages: Some Empirical Evidence.” Journal of Financial Services Research 4 (3): 191–202.

50
Sood, N., H. de Vries, I. Gutierrez, D. N. Lakdawalla, and D. P. Goldman. 2009. “The Effect Of Regulation On Pharmaceutical Revenues: Experience In Nineteen Countries.” Health Affairs 28 (1): w125–37.
Stark, Fortney. 1991. “H.R. 3551.” GovTrack.us. Telpner, Joel. 2003. “A Securitisation Primer for First Time Issuers.” Global Securitisation
and Structured Finance, Greenberg Taurig. Thomson Reuters. 2012. “The Economic Power of Orphan Drugs.” Thomson Reuters. Trushin, Eshref. 2011. “Do Liquidity Constraints Matter for R&D in the Pharmaceutical
Industry.” Global Economy and Finance Journal 4 (1): 112–22. U.S. Food and Drug Administration. 2013. “Orphan Drug Act.” Web. October 4. ———. 2016. “Prescription Drug User Fee Act (PDUFA).” Web. October 4. Varsakelis, Nikos C. 2001. “The Impact of Patent Protection, Economy Openness and
National Culture on R&D Investment: A Cross-Country Empirical Investigation.” Research Policy 30 (7): 1059–68.
Vernon, John A. 2005. “Examining the Link between Price Regulation and Pharmaceutical R&D Investment.” Health Economics 14 (1): 1–16.
Vernon, John A., and Joseph Golec. 2008. Pharmaceutical Price Regulation: Public Perceptions, Economic Realities, and Empirical Evidence. Washington, D.C. : Blue Ridge Summit, PA: AEI Press ; Distributed to the trade by National Book Network.
Waxman, Henry. 1994. “H.R.4865 - 103rd Congress (1993-1994): Orphan Drug Act Amendments of 1994.” Legislation. September 26.
Wellman-Labadie, Olivier, and Youwen Zhou. 2010. “The US Orphan Drug Act: Rare Disease Research Stimulator or Commercial Opportunity?” Health Policy 95 (2–3): 216–28.