Pharmaceutical innovation and the longevity of Australians ... · NBER Working Paper No. 14009 May...
23
NBER WORKING PAPER SERIES PHARMACEUTICAL INNOVATION AND THE LONGEVITY OF AUSTRALIANS: A FIRST LOOK Frank R. Lichtenberg Gautier Duflos Working Paper 14009 http://www.nber.org/papers/w14009 NATIONAL BUREAU OF ECONOMIC RESEARCH 1050 Massachusetts Avenue Cambridge, MA 02138 May 2008 We are grateful to Peter Sheehan and his colleagues at the Centre for Strategic Economic Studies, Victoria University (Melbourne, Australia) for supporting this research. The views expressed herein are those of the author(s) and do not necessarily reflect the views of the National Bureau of Economic Research. NBER working papers are circulated for discussion and comment purposes. They have not been peer- reviewed or been subject to the review by the NBER Board of Directors that accompanies official NBER publications. © 2008 by Frank R. Lichtenberg and Gautier Duflos. All rights reserved. Short sections of text, not to exceed two paragraphs, may be quoted without explicit permission provided that full credit, including © notice, is given to the source.
Transcript of Pharmaceutical innovation and the longevity of Australians ... · NBER Working Paper No. 14009 May...
NBER WORKING PAPER SERIES
PHARMACEUTICAL INNOVATION AND THE LONGEVITY OF AUSTRALIANS:A FIRST LOOK
Frank R. LichtenbergGautier Duflos
Working Paper 14009http://www.nber.org/papers/w14009
NATIONAL BUREAU OF ECONOMIC RESEARCH1050 Massachusetts Avenue
Cambridge, MA 02138May 2008
We are grateful to Peter Sheehan and his colleagues at the Centre for Strategic Economic Studies,Victoria University (Melbourne, Australia) for supporting this research. The views expressed hereinare those of the author(s) and do not necessarily reflect the views of the National Bureau of EconomicResearch.
NBER working papers are circulated for discussion and comment purposes. They have not been peer-reviewed or been subject to the review by the NBER Board of Directors that accompanies officialNBER publications.
© 2008 by Frank R. Lichtenberg and Gautier Duflos. All rights reserved. Short sections of text, notto exceed two paragraphs, may be quoted without explicit permission provided that full credit, including© notice, is given to the source.
Pharmaceutical innovation and the longevity of Australians: a first lookFrank R. Lichtenberg and Gautier DuflosNBER Working Paper No. 14009May 2008JEL No. H51,I12,J11,O33,O56
ABSTRACT
We examine the impact of pharmaceutical innovation on the longevity of Australians during the period1995-2003. Due to the government's Pharmaceutical Benefits Scheme, Australia has much better dataon drug utilization than most other countries. We find that mean age at death increased more for diseaseswith larger increases in mean drug vintage. The estimates indicate that increasing the mean vintageof drugs by 5 years would increase mean age at death by almost 11 months. The estimates also indicatethat using newer drugs reduced the number of years of potential life lost before the ages of 65 and70 (but not before age 75). During the period 1995-2003, mean age at death increased by about 2.0years, from 74.4 to 76.4. The estimates imply that, in the absence of any increase in drug vintage, meanage at death would have increased by only 0.7 years. The increase in drug vintage accounts for about65% of the total increase in mean age at death. We obtain a rough estimate of the cost per life-yeargained from using newer drugs. Under our assumptions, using newer drugs (increasing drug vintage)increased life expectancy by 1.23 years and increased lifetime drug expenditure by $12,976; the costper life-year gained from using newer drugs is $10,585. An estimate made by other investigators ofthe value of a statistical Australian life-year ($70,618) is 6.7 times as large as our estimate of the costper life-year gained from using newer drugs. We discuss several reasons why our estimate of the costper life-year gained from using newer drugs could be too high or too low.
Frank R. LichtenbergGraduate School of BusinessColumbia University3022 Broadway, 614 Uris HallNew York, NY 10027and [email protected]
Gautier DuflosUniversity Of Paris 1 Pantheon Sorbonne106 - 112 Boulevard De L'HopitalParis CEDEX [email protected]

3
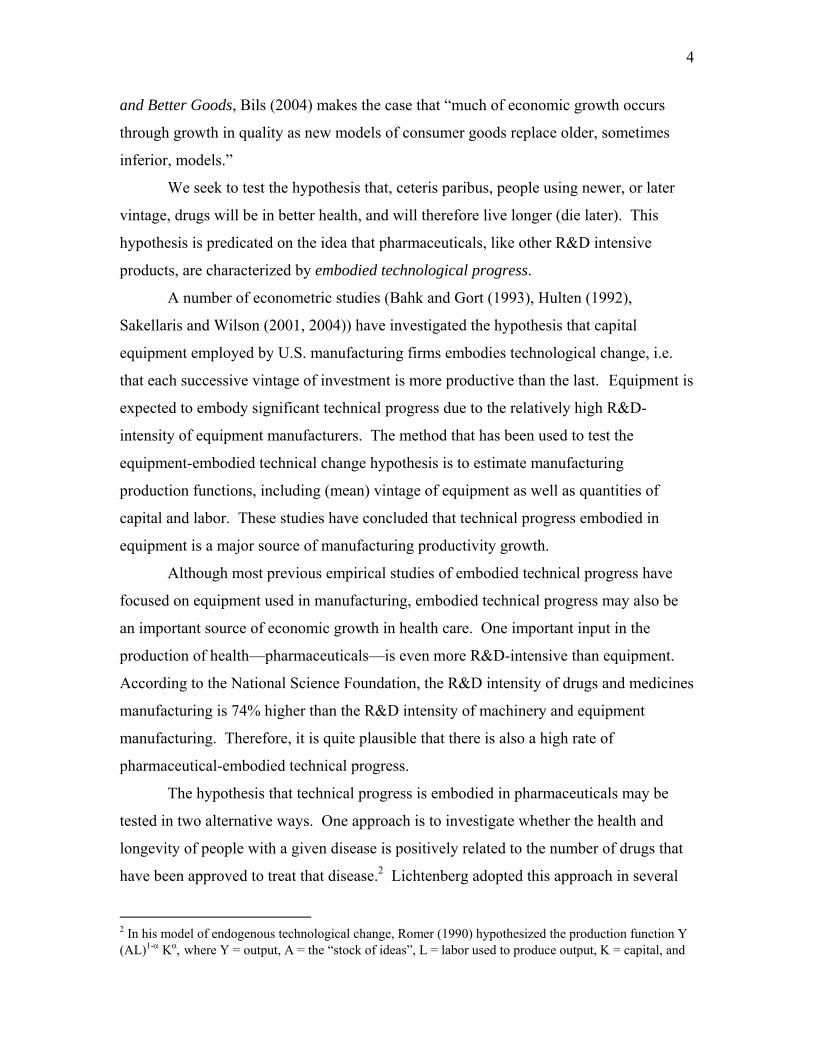
In previous papers, Lichtenberg (2005a, 2005b) has examined the impact of
pharmaceutical innovation on longevity in the United States and in a group of developed
and developing countries. Due to data limitations, the measure of pharmaceutical
innovation used in these studies was the cumulative number of drugs launched. These
studies provided support for the hypothesis that the introduction of new drugs has played
an important role in increasing longevity.
In this paper, we will examine the impact of pharmaceutical innovation on the
longevity of Australians during the period 1995-2003. In one important respect, the data
available for Australia are much better than those used in the previous studies. Rather
than merely knowing whether a given drug has been launched in Australia by a certain
date, we know how frequently that drug is used in each year. Combining these data with
data from other sources enables us to calculate the mean vintage1 of drugs utilized in
Australia, by disease and year.
Section I contains a discussion of the “embodied technological progress
hypothesis”. Section II describes an econometric model to test this hypothesis. Data
sources and descriptive statistics are presented in Section III. Empirical results are
presented in Section IV. Section V contains a summary and discussion.
I. Embodied technological progress hypothesis
Economists believe that the development of new products is the main reason why
people are better off today than they were several generations ago. In their 1993 book,
Innovation and Growth in the Global Economy, Grossman and Helpman argued that
“innovative goods are better than older products simply because they provide more
‘product services’ in relation to their cost of production.” In their 1996 book, The
Economics of New Goods, Bresnahan and Gordon stated simply that “new goods are at
the heart of economic progress.” In a recent paper, Measuring the Growth from Better
1 The dictionary contains several different definitions of vintage. The definition we use is: “a period of origin or manufacture”. We define the vintage of a drug as the year in which the U.S. Food and Drug Administration (FDA) first approved the drug’s active ingredient. (The FDA, which has been in existence since 1938, provides the most complete data on drug vintage.) For example, the vintage of Pharmaceutical Benefits Scheme items 8213G, 8214H, 8215J, and 8521L is 1997, the year the active ingredient of all these items (atorvastatin calcium) was approved by the FDA. (These items correspond to 10, 20, 40, and 80 mg tablets, respectively.)
4
and Better Goods, Bils (2004) makes the case that “much of economic growth occurs
through growth in quality as new models of consumer goods replace older, sometimes
inferior, models.”
We seek to test the hypothesis that, ceteris paribus, people using newer, or later
vintage, drugs will be in better health, and will therefore live longer (die later). This
hypothesis is predicated on the idea that pharmaceuticals, like other R&D intensive
products, are characterized by embodied technological progress.
A number of econometric studies (Bahk and Gort (1993), Hulten (1992),
Sakellaris and Wilson (2001, 2004)) have investigated the hypothesis that capital
equipment employed by U.S. manufacturing firms embodies technological change, i.e.
that each successive vintage of investment is more productive than the last. Equipment is
expected to embody significant technical progress due to the relatively high R&D-
intensity of equipment manufacturers. The method that has been used to test the
equipment-embodied technical change hypothesis is to estimate manufacturing
production functions, including (mean) vintage of equipment as well as quantities of
capital and labor. These studies have concluded that technical progress embodied in
equipment is a major source of manufacturing productivity growth.
Although most previous empirical studies of embodied technical progress have
focused on equipment used in manufacturing, embodied technical progress may also be
an important source of economic growth in health care. One important input in the
production of health—pharmaceuticals—is even more R&D-intensive than equipment.
According to the National Science Foundation, the R&D intensity of drugs and medicines
manufacturing is 74% higher than the R&D intensity of machinery and equipment
manufacturing. Therefore, it is quite plausible that there is also a high rate of
pharmaceutical-embodied technical progress.
The hypothesis that technical progress is embodied in pharmaceuticals may be
tested in two alternative ways. One approach is to investigate whether the health and
longevity of people with a given disease is positively related to the number of drugs that
have been approved to treat that disease.2 Lichtenberg adopted this approach in several
2 In his model of endogenous technological change, Romer (1990) hypothesized the production function Y (AL)1-α Kα, where Y = output, A = the “stock of ideas”, L = labor used to produce output, K = capital, and
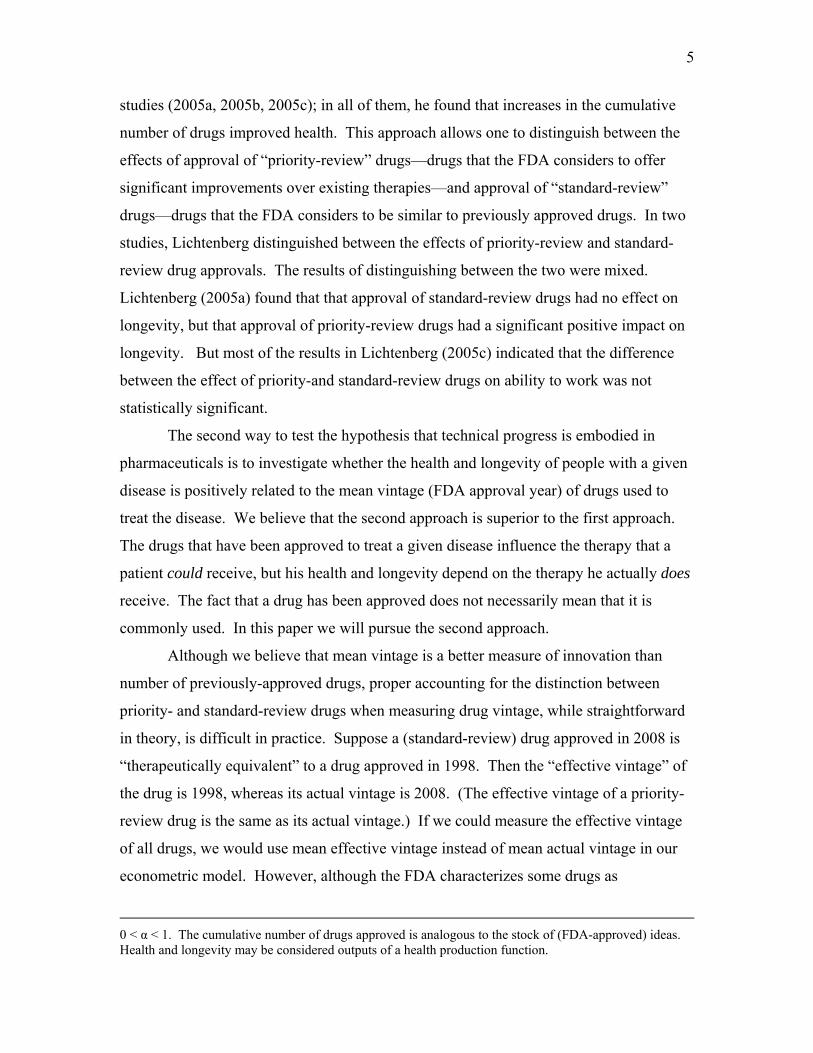
5
studies (2005a, 2005b, 2005c); in all of them, he found that increases in the cumulative
number of drugs improved health. This approach allows one to distinguish between the
effects of approval of “priority-review” drugs—drugs that the FDA considers to offer
significant improvements over existing therapies—and approval of “standard-review”
drugs—drugs that the FDA considers to be similar to previously approved drugs. In two
studies, Lichtenberg distinguished between the effects of priority-review and standard-
review drug approvals. The results of distinguishing between the two were mixed.
Lichtenberg (2005a) found that that approval of standard-review drugs had no effect on
longevity, but that approval of priority-review drugs had a significant positive impact on
longevity. But most of the results in Lichtenberg (2005c) indicated that the difference
between the effect of priority-and standard-review drugs on ability to work was not
statistically significant.
The second way to test the hypothesis that technical progress is embodied in
pharmaceuticals is to investigate whether the health and longevity of people with a given
disease is positively related to the mean vintage (FDA approval year) of drugs used to
treat the disease. We believe that the second approach is superior to the first approach.
The drugs that have been approved to treat a given disease influence the therapy that a
patient could receive, but his health and longevity depend on the therapy he actually does
receive. The fact that a drug has been approved does not necessarily mean that it is
commonly used. In this paper we will pursue the second approach.
Although we believe that mean vintage is a better measure of innovation than
number of previously-approved drugs, proper accounting for the distinction between
priority- and standard-review drugs when measuring drug vintage, while straightforward
in theory, is difficult in practice. Suppose a (standard-review) drug approved in 2008 is
“therapeutically equivalent” to a drug approved in 1998. Then the “effective vintage” of
the drug is 1998, whereas its actual vintage is 2008. (The effective vintage of a priority-
review drug is the same as its actual vintage.) If we could measure the effective vintage
of all drugs, we would use mean effective vintage instead of mean actual vintage in our
econometric model. However, although the FDA characterizes some drugs as
0 < α < 1. The cumulative number of drugs approved is analogous to the stock of (FDA-approved) ideas. Health and longevity may be considered outputs of a health production function.
6
therapeutically equivalent to previously approved drugs, it does not specify the drugs to
which they are therapeutically equivalent. Hence measurement of mean effective vintage
is not feasible.
II. Econometric model
To test the hypothesis that pharmaceutical innovation has increased the longevity
of Australians, we will estimate the following econometric model:
Yit = β [Σd N_RXdit FDA_YEARd / Σd N_RXdit] + αi + δt + εit
or Yit = β Vit + αi + δt + εit (1)
where
Yit = a measure based on the age distribution of deaths from disease i in year t
N_RXdit = the number of times drug d was used to treat patients with disease i in year t
FDA_YEARd = the FDA approval year of the active ingredient of drug d Vit = Σd Ndit FDA_YEARd / Σd Ndit
= the mean vintage of drugs used to treat disease i in year t αi = fixed disease effects δt = fixed year effects
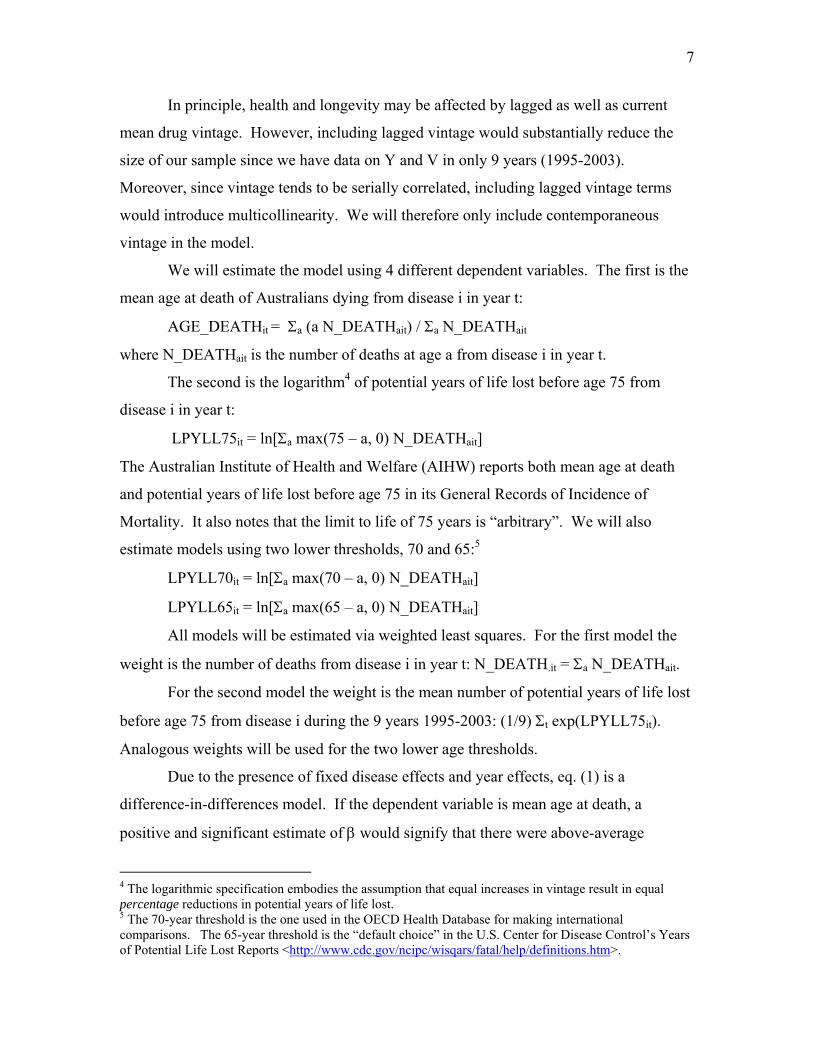
There are both practical and theoretical reasons to define the vintage of a drug as
the year the drug was approved by the U.S. FDA rather than the year the drug was listed
(approved for reimbursement) in Australia’s Pharmaceutical Benefits Sceme (PBS). Data
on PBS listing dates are quite incomplete. We obtained unpublished data on listing dates
of drugs listed by the PBS after 1990.3 Based on a sample of 311 drugs for which both
FDA approval dates and PBS listing dates were available, we estimate that the mean lag
between FDA approval and PBS listing is 3.6 years. However we believe that the FDA
approval date is theoretically superior to the PBS listing date as a measure of vintage
(which is intended to indicate year of (global) market introduction or first use). The
vintage of a wine is the year the wine was bottled, not the year it was opened!
3 We are grateful to Kim Sweeny of Victoria University for sharing these data with us.
7
In principle, health and longevity may be affected by lagged as well as current
mean drug vintage. However, including lagged vintage would substantially reduce the
size of our sample since we have data on Y and V in only 9 years (1995-2003).
Moreover, since vintage tends to be serially correlated, including lagged vintage terms
would introduce multicollinearity. We will therefore only include contemporaneous
vintage in the model.
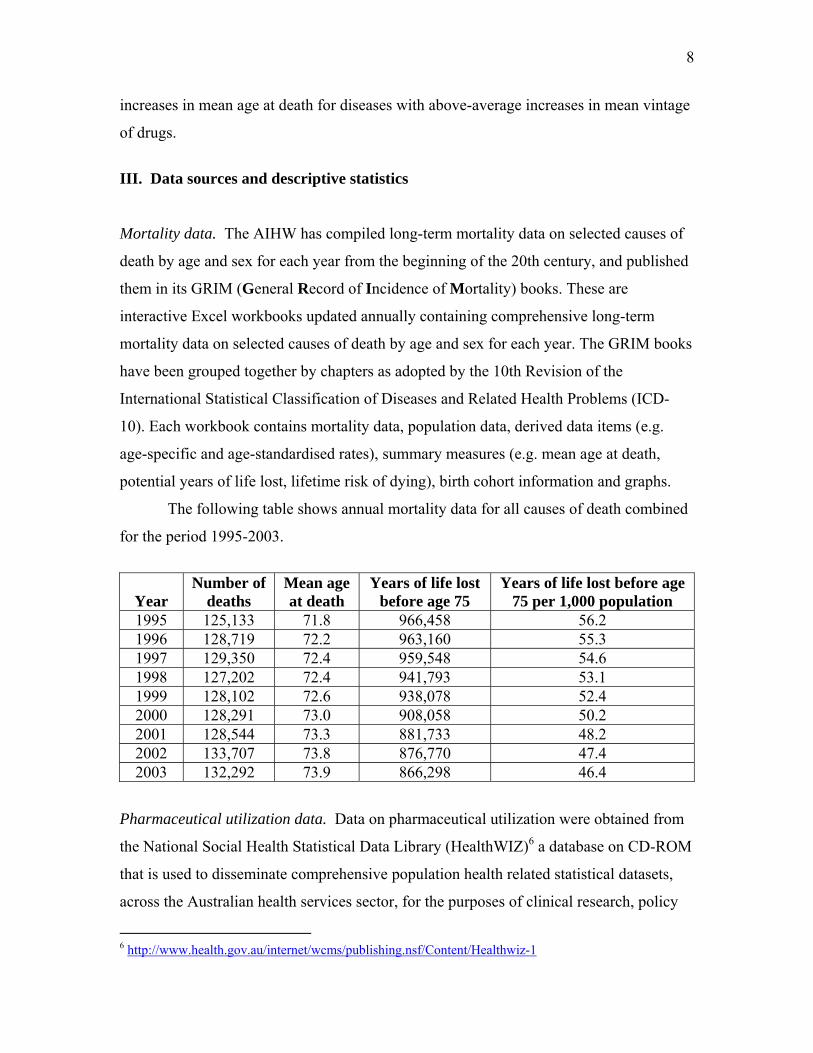
We will estimate the model using 4 different dependent variables. The first is the
mean age at death of Australians dying from disease i in year t:
AGE_DEATHit = Σa (a N_DEATHait) / Σa N_DEATHait
where N_DEATHait is the number of deaths at age a from disease i in year t.
The second is the logarithm4 of potential years of life lost before age 75 from
disease i in year t:
LPYLL75it = ln[Σa max(75 – a, 0) N_DEATHait]
The Australian Institute of Health and Welfare (AIHW) reports both mean age at death
and potential years of life lost before age 75 in its General Records of Incidence of
Mortality. It also notes that the limit to life of 75 years is “arbitrary”. We will also
estimate models using two lower thresholds, 70 and 65:5
LPYLL70it = ln[Σa max(70 – a, 0) N_DEATHait]
LPYLL65it = ln[Σa max(65 – a, 0) N_DEATHait]
All models will be estimated via weighted least squares. For the first model the
weight is the number of deaths from disease i in year t: N_DEATH.it = Σa N_DEATHait.
For the second model the weight is the mean number of potential years of life lost
before age 75 from disease i during the 9 years 1995-2003: (1/9) Σt exp(LPYLL75it).
Analogous weights will be used for the two lower age thresholds.
Due to the presence of fixed disease effects and year effects, eq. (1) is a
difference-in-differences model. If the dependent variable is mean age at death, a
positive and significant estimate of β would signify that there were above-average
4 The logarithmic specification embodies the assumption that equal increases in vintage result in equal percentage reductions in potential years of life lost. 5 The 70-year threshold is the one used in the OECD Health Database for making international comparisons. The 65-year threshold is the “default choice” in the U.S. Center for Disease Control’s Years of Potential Life Lost Reports <http://www.cdc.gov/ncipc/wisqars/fatal/help/definitions.htm>.
8
increases in mean age at death for diseases with above-average increases in mean vintage
of drugs.
III. Data sources and descriptive statistics
Mortality data. The AIHW has compiled long-term mortality data on selected causes of
death by age and sex for each year from the beginning of the 20th century, and published
them in its GRIM (General Record of Incidence of Mortality) books. These are
interactive Excel workbooks updated annually containing comprehensive long-term
mortality data on selected causes of death by age and sex for each year. The GRIM books
have been grouped together by chapters as adopted by the 10th Revision of the
International Statistical Classification of Diseases and Related Health Problems (ICD-
10). Each workbook contains mortality data, population data, derived data items (e.g.
age-specific and age-standardised rates), summary measures (e.g. mean age at death,
potential years of life lost, lifetime risk of dying), birth cohort information and graphs.
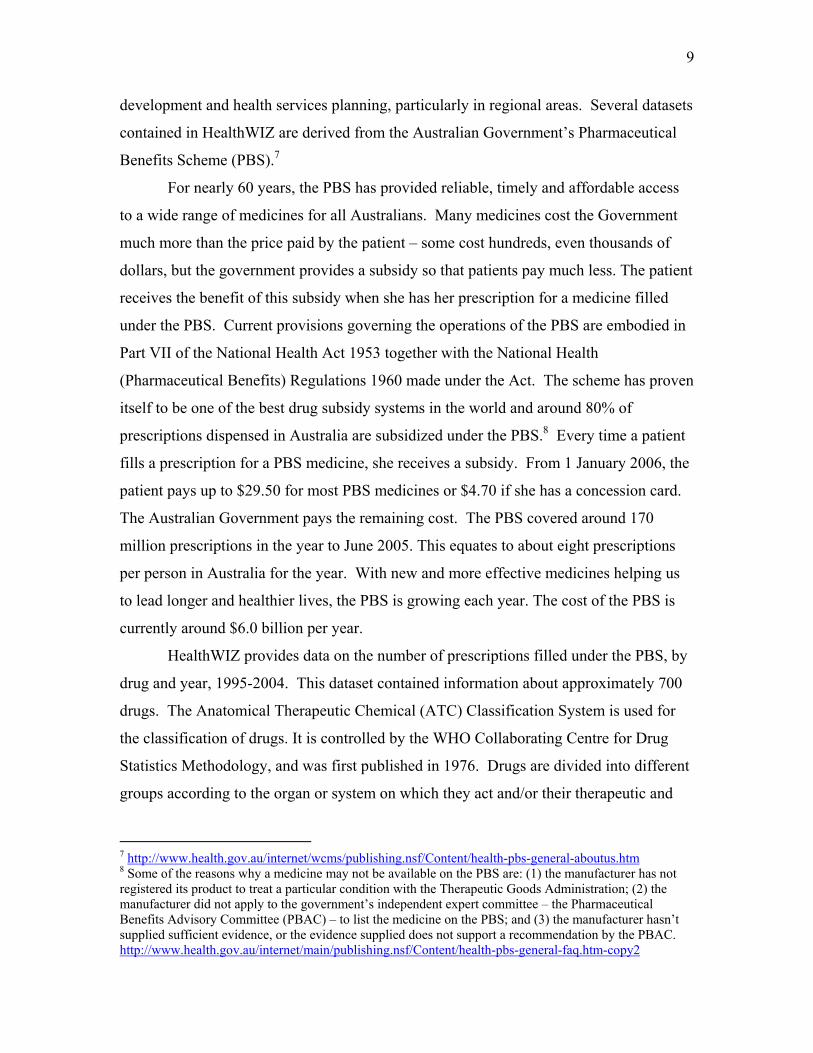
The following table shows annual mortality data for all causes of death combined
for the period 1995-2003.
Year Number of
deaths Mean age at death
Years of life lost before age 75
Years of life lost before age 75 per 1,000 population
1995 125,133 71.8 966,458 56.2 1996 128,719 72.2 963,160 55.3 1997 129,350 72.4 959,548 54.6 1998 127,202 72.4 941,793 53.1 1999 128,102 72.6 938,078 52.4 2000 128,291 73.0 908,058 50.2 2001 128,544 73.3 881,733 48.2 2002 133,707 73.8 876,770 47.4 2003 132,292 73.9 866,298 46.4
Pharmaceutical utilization data. Data on pharmaceutical utilization were obtained from
the National Social Health Statistical Data Library (HealthWIZ)6 a database on CD-ROM
that is used to disseminate comprehensive population health related statistical datasets,
across the Australian health services sector, for the purposes of clinical research, policy
6 http://www.health.gov.au/internet/wcms/publishing.nsf/Content/Healthwiz-1
9
development and health services planning, particularly in regional areas. Several datasets
contained in HealthWIZ are derived from the Australian Government’s Pharmaceutical
Benefits Scheme (PBS).7
For nearly 60 years, the PBS has provided reliable, timely and affordable access
to a wide range of medicines for all Australians. Many medicines cost the Government
much more than the price paid by the patient – some cost hundreds, even thousands of
dollars, but the government provides a subsidy so that patients pay much less. The patient
receives the benefit of this subsidy when she has her prescription for a medicine filled
under the PBS. Current provisions governing the operations of the PBS are embodied in
Part VII of the National Health Act 1953 together with the National Health
(Pharmaceutical Benefits) Regulations 1960 made under the Act. The scheme has proven
itself to be one of the best drug subsidy systems in the world and around 80% of
prescriptions dispensed in Australia are subsidized under the PBS.8 Every time a patient
fills a prescription for a PBS medicine, she receives a subsidy. From 1 January 2006, the
patient pays up to $29.50 for most PBS medicines or $4.70 if she has a concession card.
The Australian Government pays the remaining cost. The PBS covered around 170
million prescriptions in the year to June 2005. This equates to about eight prescriptions
per person in Australia for the year. With new and more effective medicines helping us
to lead longer and healthier lives, the PBS is growing each year. The cost of the PBS is
currently around $6.0 billion per year.
HealthWIZ provides data on the number of prescriptions filled under the PBS, by
drug and year, 1995-2004. This dataset contained information about approximately 700
drugs. The Anatomical Therapeutic Chemical (ATC) Classification System is used for
the classification of drugs. It is controlled by the WHO Collaborating Centre for Drug
Statistics Methodology, and was first published in 1976. Drugs are divided into different
groups according to the organ or system on which they act and/or their therapeutic and
7 http://www.health.gov.au/internet/wcms/publishing.nsf/Content/health-pbs-general-aboutus.htm 8 Some of the reasons why a medicine may not be available on the PBS are: (1) the manufacturer has not registered its product to treat a particular condition with the Therapeutic Goods Administration; (2) the manufacturer did not apply to the government’s independent expert committee – the Pharmaceutical Benefits Advisory Committee (PBAC) – to list the medicine on the PBS; and (3) the manufacturer hasn’t supplied sufficient evidence, or the evidence supplied does not support a recommendation by the PBAC. http://www.health.gov.au/internet/main/publishing.nsf/Content/health-pbs-general-faq.htm-copy2
10
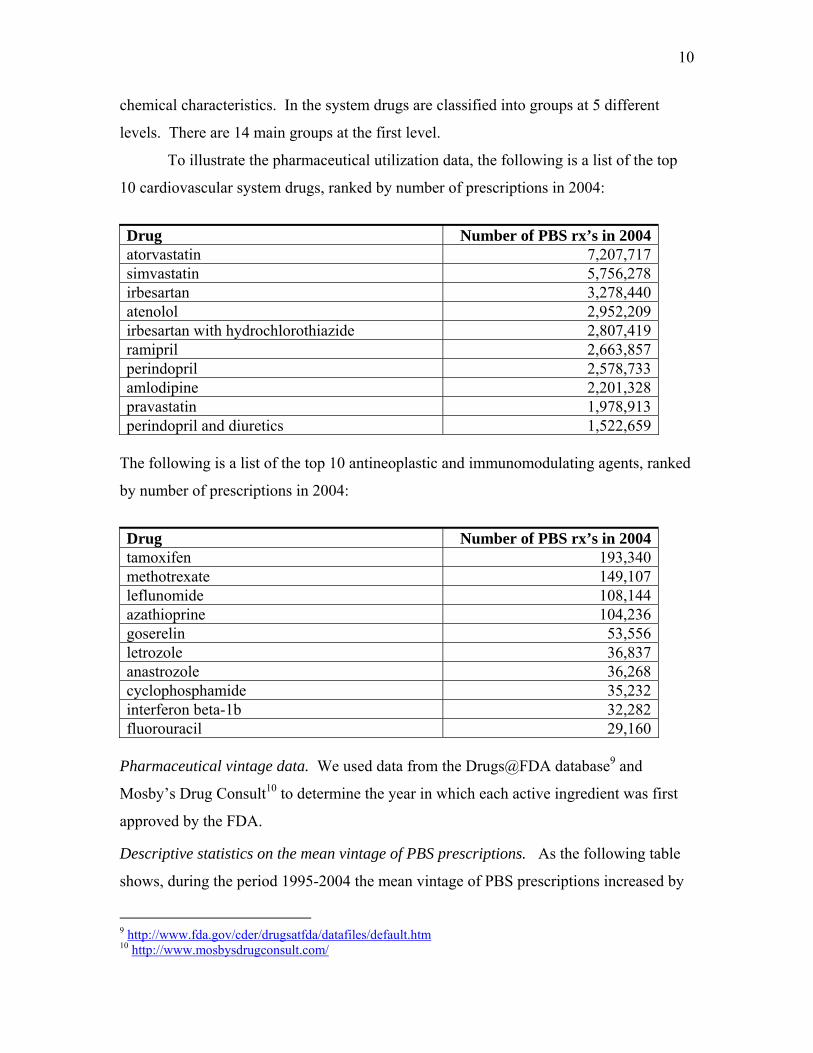
chemical characteristics. In the system drugs are classified into groups at 5 different
levels. There are 14 main groups at the first level.
To illustrate the pharmaceutical utilization data, the following is a list of the top
10 cardiovascular system drugs, ranked by number of prescriptions in 2004:
Drug Number of PBS rx’s in 2004 atorvastatin 7,207,717 simvastatin 5,756,278 irbesartan 3,278,440 atenolol 2,952,209 irbesartan with hydrochlorothiazide 2,807,419 ramipril 2,663,857 perindopril 2,578,733 amlodipine 2,201,328 pravastatin 1,978,913 perindopril and diuretics 1,522,659
The following is a list of the top 10 antineoplastic and immunomodulating agents, ranked
by number of prescriptions in 2004:
Drug Number of PBS rx’s in 2004 tamoxifen 193,340 methotrexate 149,107 leflunomide 108,144 azathioprine 104,236 goserelin 53,556 letrozole 36,837 anastrozole 36,268 cyclophosphamide 35,232 interferon beta-1b 32,282 fluorouracil 29,160
Pharmaceutical vintage data. We used data from the Drugs@FDA database9 and
Mosby’s Drug Consult10 to determine the year in which each active ingredient was first
approved by the FDA.
Descriptive statistics on the mean vintage of PBS prescriptions. As the following table
shows, during the period 1995-2004 the mean vintage of PBS prescriptions increased by
9 http://www.fda.gov/cder/drugsatfda/datafiles/default.htm 10 http://www.mosbysdrugconsult.com/
11
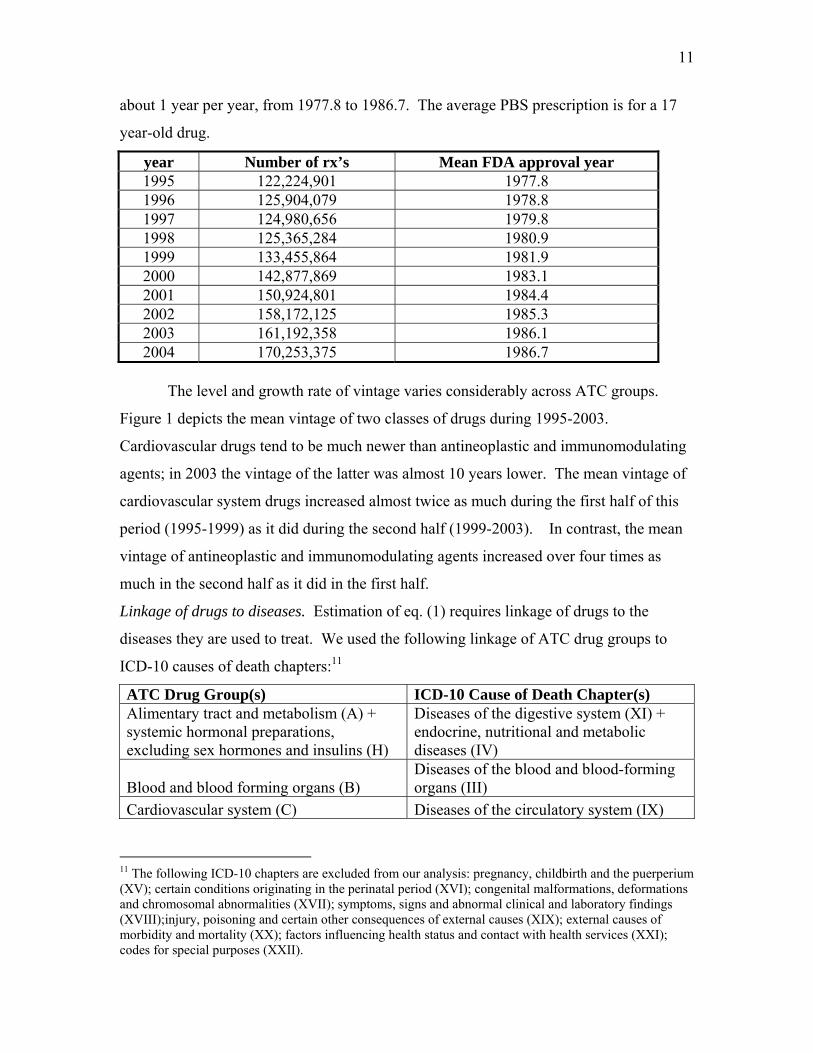
about 1 year per year, from 1977.8 to 1986.7. The average PBS prescription is for a 17
year-old drug.
year Number of rx’s Mean FDA approval year 1995 122,224,901 1977.8 1996 125,904,079 1978.8 1997 124,980,656 1979.8 1998 125,365,284 1980.9 1999 133,455,864 1981.9 2000 142,877,869 1983.1 2001 150,924,801 1984.4 2002 158,172,125 1985.3 2003 161,192,358 1986.1 2004 170,253,375 1986.7
The level and growth rate of vintage varies considerably across ATC groups.
Figure 1 depicts the mean vintage of two classes of drugs during 1995-2003.
Cardiovascular drugs tend to be much newer than antineoplastic and immunomodulating
agents; in 2003 the vintage of the latter was almost 10 years lower. The mean vintage of
cardiovascular system drugs increased almost twice as much during the first half of this
period (1995-1999) as it did during the second half (1999-2003). In contrast, the mean
vintage of antineoplastic and immunomodulating agents increased over four times as
much in the second half as it did in the first half.
Linkage of drugs to diseases. Estimation of eq. (1) requires linkage of drugs to the
diseases they are used to treat. We used the following linkage of ATC drug groups to
ICD-10 causes of death chapters:11
ATC Drug Group(s) ICD-10 Cause of Death Chapter(s) Alimentary tract and metabolism (A) + systemic hormonal preparations, excluding sex hormones and insulins (H)
Diseases of the digestive system (XI) + endocrine, nutritional and metabolic diseases (IV)
Blood and blood forming organs (B) Diseases of the blood and blood-forming organs (III)
Cardiovascular system (C) Diseases of the circulatory system (IX)
11 The following ICD-10 chapters are excluded from our analysis: pregnancy, childbirth and the puerperium (XV); certain conditions originating in the perinatal period (XVI); congenital malformations, deformations and chromosomal abnormalities (XVII); symptoms, signs and abnormal clinical and laboratory findings (XVIII);injury, poisoning and certain other consequences of external causes (XIX); external causes of morbidity and mortality (XX); factors influencing health status and contact with health services (XXI); codes for special purposes (XXII).
12
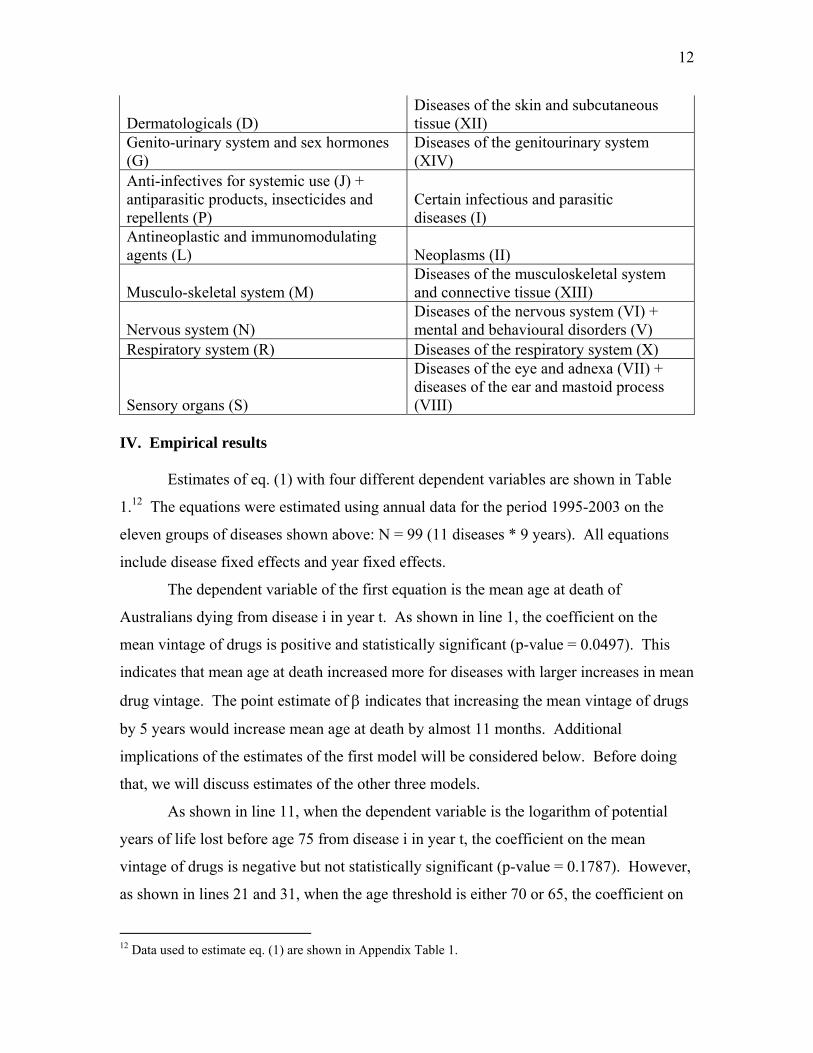
Dermatologicals (D) Diseases of the skin and subcutaneous tissue (XII)
Genito-urinary system and sex hormones (G)
Diseases of the genitourinary system (XIV)
Anti-infectives for systemic use (J) + antiparasitic products, insecticides and repellents (P)
Certain infectious and parasitic diseases (I)
Antineoplastic and immunomodulating agents (L) Neoplasms (II)
Musculo-skeletal system (M) Diseases of the musculoskeletal system and connective tissue (XIII)
Nervous system (N) Diseases of the nervous system (VI) + mental and behavioural disorders (V)
Respiratory system (R) Diseases of the respiratory system (X)
Sensory organs (S)
Diseases of the eye and adnexa (VII) + diseases of the ear and mastoid process (VIII)
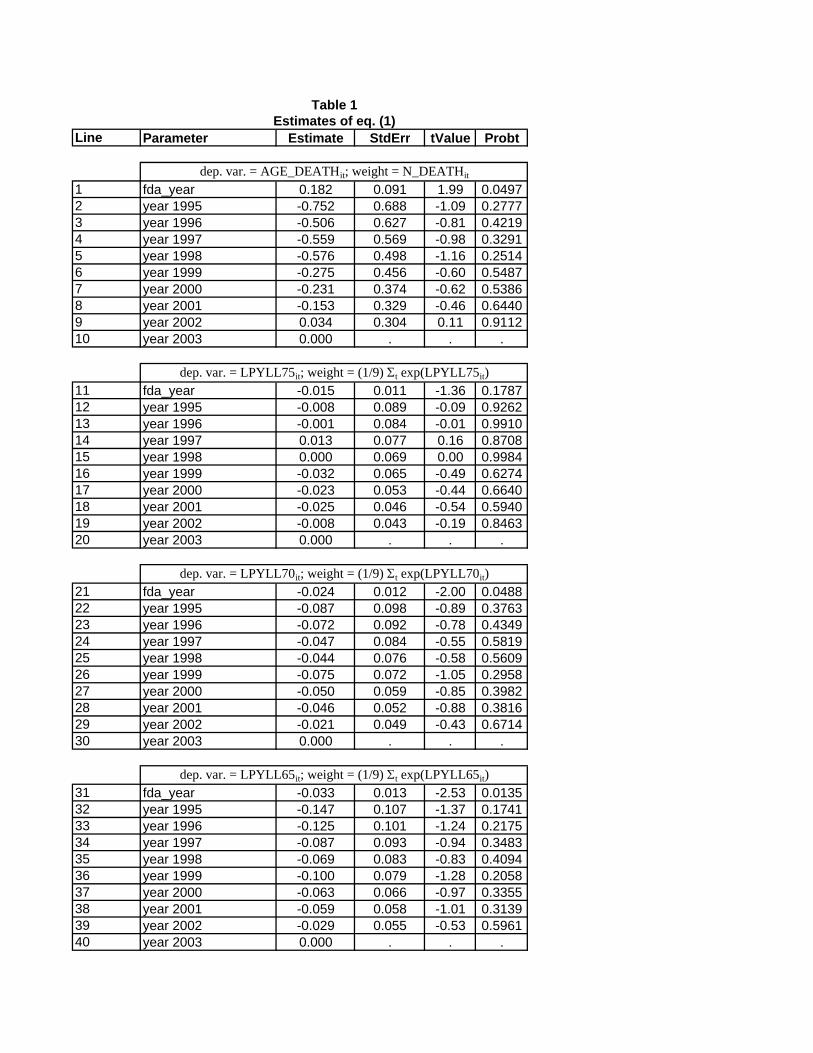
IV. Empirical results Estimates of eq. (1) with four different dependent variables are shown in Table
1.12 The equations were estimated using annual data for the period 1995-2003 on the
eleven groups of diseases shown above: N = 99 (11 diseases * 9 years). All equations
include disease fixed effects and year fixed effects.
The dependent variable of the first equation is the mean age at death of
Australians dying from disease i in year t. As shown in line 1, the coefficient on the
mean vintage of drugs is positive and statistically significant (p-value = 0.0497). This
indicates that mean age at death increased more for diseases with larger increases in mean
drug vintage. The point estimate of β indicates that increasing the mean vintage of drugs
by 5 years would increase mean age at death by almost 11 months. Additional
implications of the estimates of the first model will be considered below. Before doing
that, we will discuss estimates of the other three models.
As shown in line 11, when the dependent variable is the logarithm of potential
years of life lost before age 75 from disease i in year t, the coefficient on the mean
vintage of drugs is negative but not statistically significant (p-value = 0.1787). However,
as shown in lines 21 and 31, when the age threshold is either 70 or 65, the coefficient on
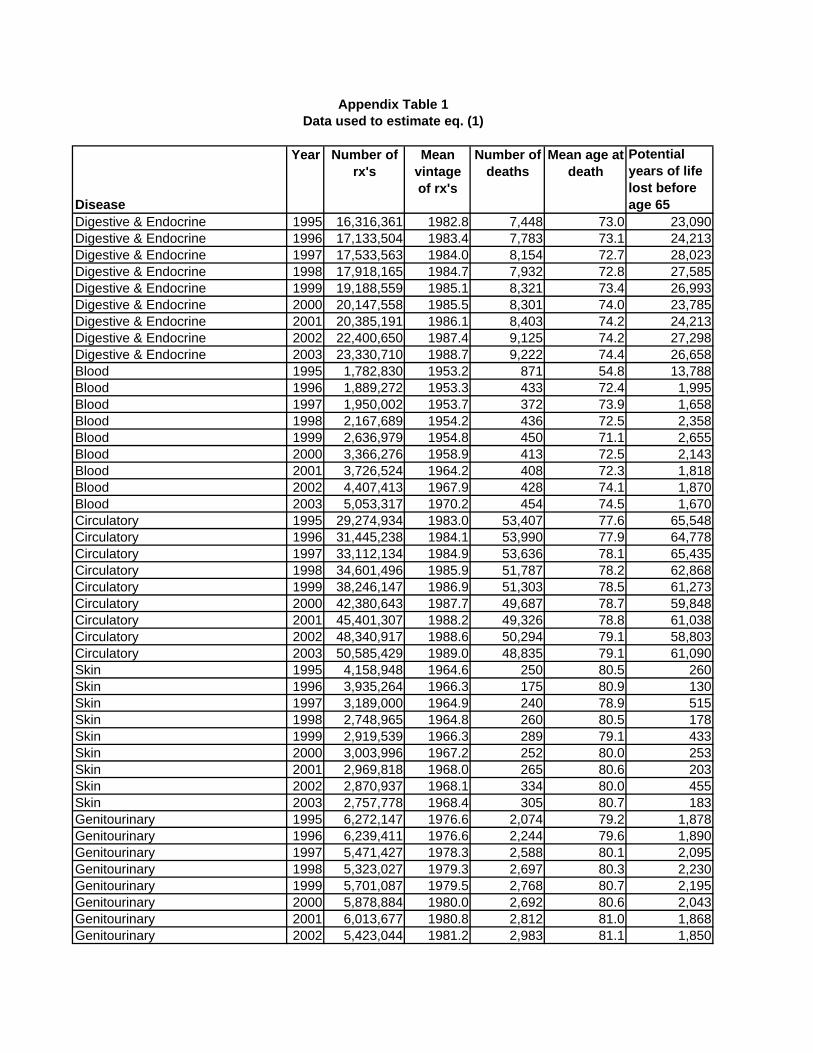
12 Data used to estimate eq. (1) are shown in Appendix Table 1.
13
the mean vintage of drugs is negative and statistically significant (p-value = 0.0488 and
0.0135, respectively). This implies that using newer drugs has reduced premature
mortality—especially mortality before age 65—in the Australian population.13 The
estimates of the three potential years of life lost equations tend to confirm the estimates
of the mean age at death equation.
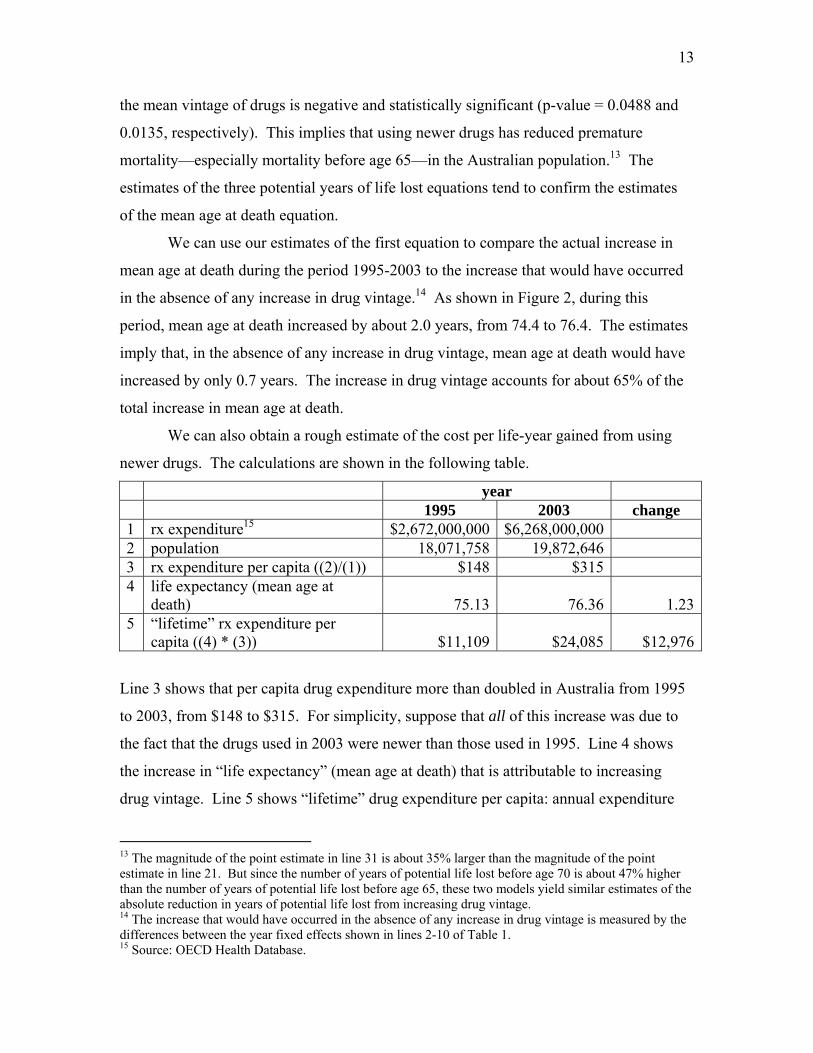
We can use our estimates of the first equation to compare the actual increase in
mean age at death during the period 1995-2003 to the increase that would have occurred
in the absence of any increase in drug vintage.14 As shown in Figure 2, during this
period, mean age at death increased by about 2.0 years, from 74.4 to 76.4. The estimates
imply that, in the absence of any increase in drug vintage, mean age at death would have
increased by only 0.7 years. The increase in drug vintage accounts for about 65% of the
total increase in mean age at death.
We can also obtain a rough estimate of the cost per life-year gained from using
newer drugs. The calculations are shown in the following table.
year 1995 2003 change 1 rx expenditure15 $2,672,000,000 $6,268,000,000 2 population 18,071,758 19,872,646 3 rx expenditure per capita ((2)/(1)) $148 $315 4 life expectancy (mean age at
death) 75.13 76.36 1.235 “lifetime” rx expenditure per
capita ((4) * (3)) $11,109 $24,085 $12,976
Line 3 shows that per capita drug expenditure more than doubled in Australia from 1995
to 2003, from $148 to $315. For simplicity, suppose that all of this increase was due to
the fact that the drugs used in 2003 were newer than those used in 1995. Line 4 shows
the increase in “life expectancy” (mean age at death) that is attributable to increasing
drug vintage. Line 5 shows “lifetime” drug expenditure per capita: annual expenditure
13 The magnitude of the point estimate in line 31 is about 35% larger than the magnitude of the point estimate in line 21. But since the number of years of potential life lost before age 70 is about 47% higher than the number of years of potential life lost before age 65, these two models yield similar estimates of the absolute reduction in years of potential life lost from increasing drug vintage. 14 The increase that would have occurred in the absence of any increase in drug vintage is measured by the differences between the year fixed effects shown in lines 2-10 of Table 1. 15 Source: OECD Health Database.
14
times life expectancy. Under our assumptions, using newer drugs (increasing drug
vintage) increased life expectancy by 1.23 years and increased lifetime drug expenditure
by $12,976. The cost per life-year gained from using newer drugs is $10,585 (=
$12,976/1.23).
Viscusi (2005), citing Kniesner and Leeth (1991), estimates that the value of a
statistical Australian life is 4.2 million USD, which is equal to $A 5.4 million at the
current exchange rate (1.2839 $A/USD). This implies that the value of a statistical
Australian life-year is $70,618 (=$A 5.4 million / 76.4). This value is 6.7 times as large
as our estimate of the cost per life-year gained from using newer drugs.
V. Summary and discussion
We have examined the impact of pharmaceutical innovation on the longevity of
Australians during the period 1995-2003. Due to the government’s Pharmaceutical
Benefits Scheme, Australia has much better data on drug utilization than most other
countries.
We found that mean age at death increased more for diseases with larger increases
in mean drug vintage. The estimates indicated that increasing the mean vintage of drugs
by 5 years would increase mean age at death by almost 11 months. The estimates also
indicated that using newer drugs reduced the number of years of potential life lost before
the ages of 65 and 70 (but not before age 75).
During the period 1995-2003, mean age at death increased by about 2.0 years,
from 74.4 to 76.4.16 The estimates implied that, in the absence of any increase in drug
vintage, mean age at death would have increased by only 0.7 years. The increase in drug
vintage accounts for about 65% of the total increase in mean age at death.
We obtained a rough estimate of the cost per life-year gained from using newer
drugs. Under our assumptions, using newer drugs (increasing drug vintage) increased life
expectancy by 1.23 years and increased lifetime drug expenditure by $12,976; the cost
16 Lichtenberg (2005a) found that, in the U.S., within-disease increases in mean age at death accounted for about 80% of the aggregate long-term increase in mean age at death; the remaining 20% was due to a shift in the distribution of fatal diseases.
15
per life-year gained from using newer drugs is $10,585.17 An estimate made by other
investigators of the value of a statistical Australian life-year ($70,618) is 6.7 times as
large as our estimate of the cost per life-year gained from using newer drugs.
For several reasons, our estimate of the cost per life-year gained from using newer
drugs could be too high or too low. Studies based on U.S. data (Lichtenberg (2001,
2005c, 2006)) indicate that use of newer drugs reduces admissions to hospitals and
nursing homes, and increases ability to work. By not accounting for this, we may have
overestimated the cost per Australian life-year gained.
Use of newer drugs may have cross-disease spillover effects: using newer drugs
for one disease may either increase or decrease mortality from other diseases (in part due
to “competing risks”). Such spillovers could be either negative or positive. For example,
using a newer drug to treat cancer might reduce cancer mortality but increase life-years
lost due to cardiovascular disease. On the other hand, using a newer drug to treat
depression and other mental disorders might lead to better management of cardiovascular
disease.
Finally, innovation in medical devices and procedures, as well as in drugs, have
undoubtedly contributed to Australian longevity increase.18 The models we have
estimated control (via year fixed effects) for device/procedure innovation that is common
to all diseases, but not for disease-specific device/procedure innovation: measuring
disease-specific device/procedure innovation is far more challenging than measuring
disease-specific drug innovation. Since device/procedure innovation may either
substitute for or complement drug innovation, controlling for disease-specific
device/procedure innovation could either decrease or increase our estimate of the cost per
life-year gained from using newer drugs.
Our findings, which are based on aggregate data, are broadly consistent with
previous findings based on individual-level data. Lichtenberg and Virabhak (2007)
examined the impact of drug vintage on health and longevity using data on (American)
individuals before and after the drugs were consumed. They found that people who used 17 This is an estimate of the cost per life-year gained from using newer drugs in general. It is likely that the cost per life-year gained from some newer drugs is higher, and from other newer drugs is lower, than this average. 18 However, the biopharmaceutical industry is much more R&D-intensive than the medical device and equipment industry.
16
newer drugs had better post-treatment health than people using older drugs for the same
condition, controlling for pre-treatment health, age, sex, race, marital status, education,
income, and insurance coverage: they were more likely to survive, their perceived health
status was higher, and they experienced fewer activity, social, and physical limitations.
Most of the health measures indicated that the effect of drug vintage on health is higher
for people with low initial health than it is for people with high initial health. This
suggests that pharmaceutical-embodied technical progress has a tendency to reduce
inequality as well as promote economic growth, broadly defined.
References
Bahk, Byong-Hyong and Michael Gort (1993), Decomposing Learning by Doing in New Plants. Journal of Political Economy, 101, 561-583. Bils, Mark (2004), Measuring the Growth from Better and Better Goods. NBER working paper no.10606, July, http://www.nber.org/papers/w10606. Bresnahan, Timothy F., and Robert J. Gordon (1996), The Economics of New Goods (Chicago: University of Chicago Press). Grossman, Gene M., and Elhanan Helpman (1993), Innovation and Growth in the Global Economy (Cambridge: MIT Press). Hulten, Charles R. (1992), Growth accounting when technical change is embodied in capital. The American Economic Review, Vol. 82, No. 4. (Sep., 1992), pp. 964-980. Kniesner, T. J. and Leeth, J. D. (1991). Compensating wage differentials for fatal injury risk in Australia, Japan, and the United States. Journal of Risk and Uncertainty 4: 75-90. Lichtenberg, Frank (2001), Are the Benefits of Newer Drugs Worth Their Cost? Evidence from the 1996 MEPS. Health Affairs 20(5), September/October, 241-51. Lichtenberg, Frank (2005a), Pharmaceutical knowledge-capital accumulation and longevity, in Measuring capital in the new economy, ed. by Carol Corrado, John Haltiwanger, and Dan Sichel, 237-269 (University of Chicago Press). Lichtenberg, Frank (2005b), The impact of new drug launches on longevity: evidence from longitudinal disease-level data from 52 countries, 1982-2001, International Journal of Health Care Finance and Economics 5, 47-73.
17
Lichtenberg, Frank (2005c), Availability of new drugs and Americans' ability to work, Journal of Occupational and Environmental Medicine 47 (4), April, 373-380. Lichtenberg, Frank (2006), The effect of using newer drugs on admissions of elderly Americans to hospitals and nursing homes: state-level evidence from 1997-2003, Pharmacoeconomics 24 Suppl 3:5-25. Lichtenberg, Frank, and Suchin Virabhak (2007), “Pharmaceutical-embodied technical progress, longevity, and quality of life: drugs as ‘equipment for your health,’” Managerial and Decision Economics 28: 371–392. Romer, Paul (1990), “Endogenous technical change," Journal of Political Economy 98, S71-S102. Sakellaris, Plutarchos and Dan Wilson (2001), The production-side approach to estimating embodied technological change. Finance and Economics Discussion Series 2001-20, Board of Governors of the Federal Reserve System. Sakellaris, Plutarchos and Dan Wilson (2004). Quantifying Embodied Technological Change. Review of Economic Dynamics 7(1), pp. 1-26. Viscusi, W. Kip. (2005), The value of life. Discussion Paper No. 517, Harvard Law School, http://www.law.harvard.edu/programs/olin_center/papers/pdf/Viscusi_517.pdf
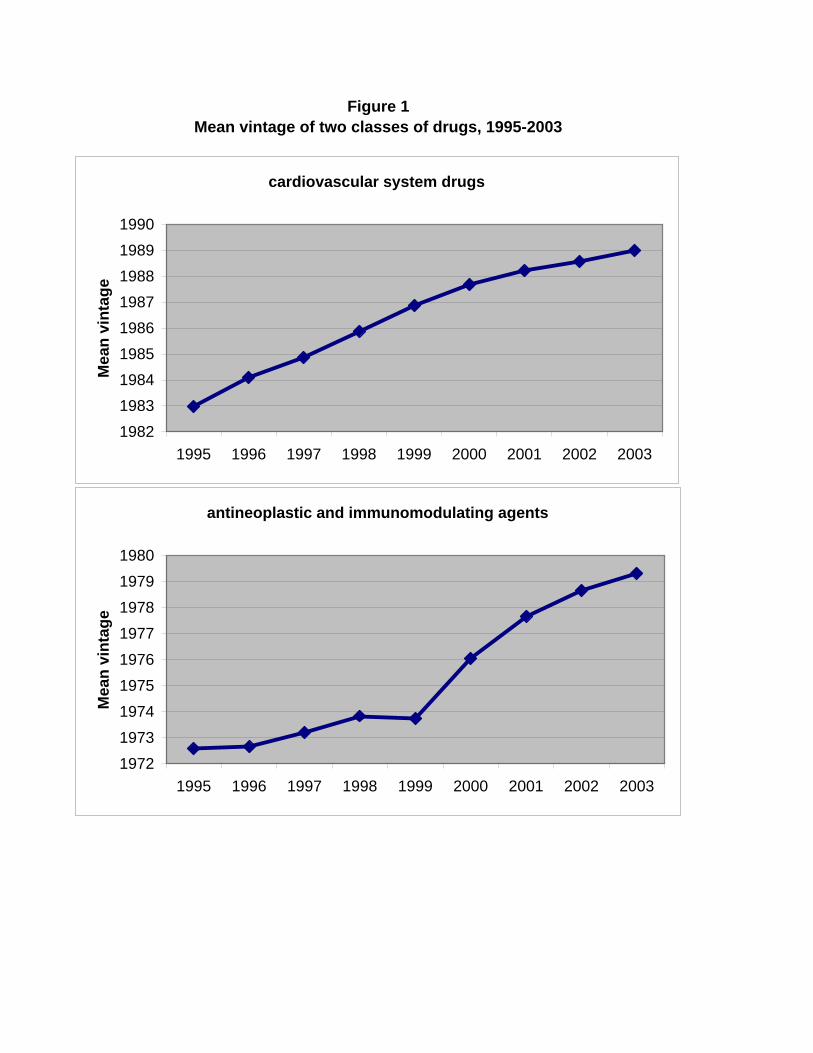
Figure 1Mean vintage of two classes of drugs, 1995-2003
cardiovascular system drugs
198219831984198519861987198819891990
1995 1996 1997 1998 1999 2000 2001 2002 2003
Mea
n vi
ntag
e
antineoplastic and immunomodulating agents
19721973197419751976
1977197819791980
1995 1996 1997 1998 1999 2000 2001 2002 2003
Mea
n vi
ntag
e
Line Parameter Estimate StdErr tValue Probt
1 fda_year 0.182 0.091 1.99 0.04972 year 1995 -0.752 0.688 -1.09 0.27773 year 1996 -0.506 0.627 -0.81 0.42194 year 1997 -0.559 0.569 -0.98 0.32915 year 1998 -0.576 0.498 -1.16 0.25146 year 1999 -0.275 0.456 -0.60 0.54877 year 2000 -0.231 0.374 -0.62 0.53868 year 2001 -0.153 0.329 -0.46 0.64409 year 2002 0.034 0.304 0.11 0.911210 year 2003 0.000 . . .
11 fda_year -0.015 0.011 -1.36 0.178712 year 1995 -0.008 0.089 -0.09 0.926213 year 1996 -0.001 0.084 -0.01 0.991014 year 1997 0.013 0.077 0.16 0.870815 year 1998 0.000 0.069 0.00 0.998416 year 1999 -0.032 0.065 -0.49 0.627417 year 2000 -0.023 0.053 -0.44 0.664018 year 2001 -0.025 0.046 -0.54 0.594019 year 2002 -0.008 0.043 -0.19 0.846320 year 2003 0.000 . . .
21 fda_year -0.024 0.012 -2.00 0.048822 year 1995 -0.087 0.098 -0.89 0.376323 year 1996 -0.072 0.092 -0.78 0.434924 year 1997 -0.047 0.084 -0.55 0.581925 year 1998 -0.044 0.076 -0.58 0.560926 year 1999 -0.075 0.072 -1.05 0.295827 year 2000 -0.050 0.059 -0.85 0.398228 year 2001 -0.046 0.052 -0.88 0.381629 year 2002 -0.021 0.049 -0.43 0.671430 year 2003 0.000 . . .
31 fda_year -0.033 0.013 -2.53 0.013532 year 1995 -0.147 0.107 -1.37 0.174133 year 1996 -0.125 0.101 -1.24 0.217534 year 1997 -0.087 0.093 -0.94 0.348335 year 1998 -0.069 0.083 -0.83 0.409436 year 1999 -0.100 0.079 -1.28 0.205837 year 2000 -0.063 0.066 -0.97 0.335538 year 2001 -0.059 0.058 -1.01 0.313939 year 2002 -0.029 0.055 -0.53 0.596140 year 2003 0.000 . . .
dep. var. = LPYLL65it; weight = (1/9) Σt exp(LPYLL65it)
Table 1Estimates of eq. (1)
dep. var. = AGE_DEATHit; weight = N_DEATHit
dep. var. = LPYLL75it; weight = (1/9) Σt exp(LPYLL75it)
dep. var. = LPYLL70it; weight = (1/9) Σt exp(LPYLL70it)
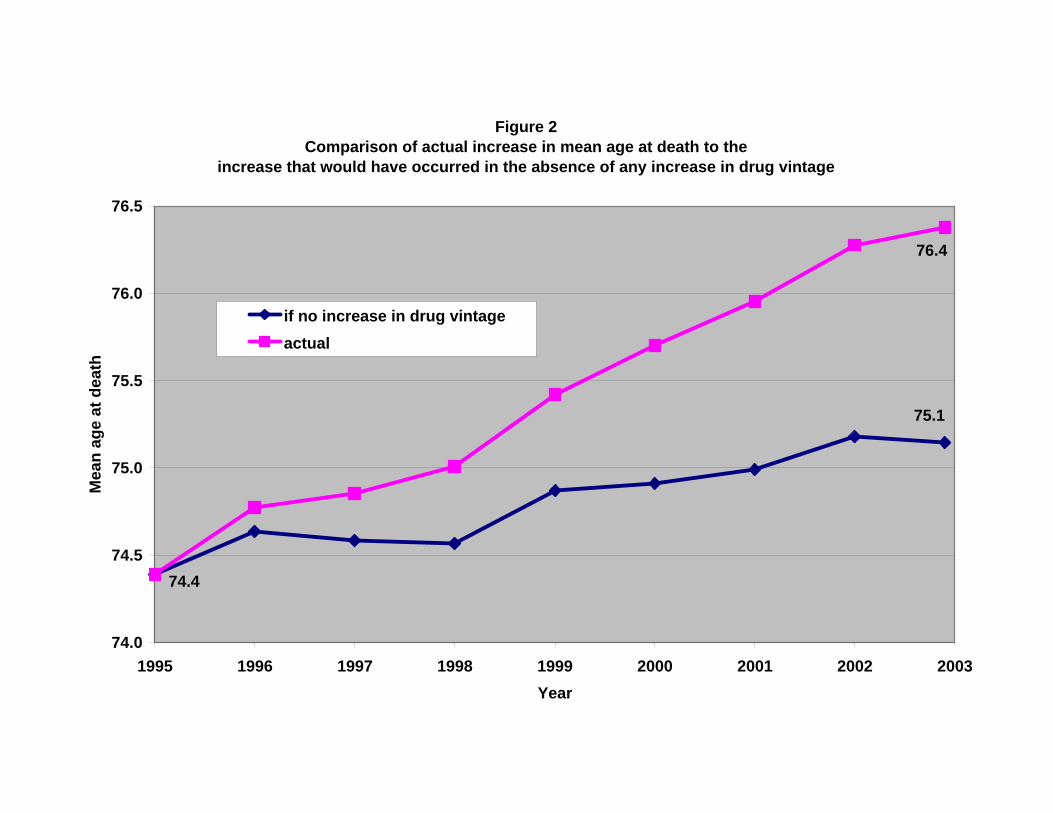
Figure 2Comparison of actual increase in mean age at death to the
increase that would have occurred in the absence of any increase in drug vintage
75.1
74.4
76.4
74.0
74.5
75.0
75.5
76.0
76.5
1995 1996 1997 1998 1999 2000 2001 2002 2003Year
Mea
n ag
e at
dea
th
if no increase in drug vintageactual
Disease
Year Number of rx's
Mean vintage of rx's
Number of deaths
Mean age at death
Potential years of life lost before age 65
Digestive & Endocrine 1995 16,316,361 1982.8 7,448 73.0 23,090Digestive & Endocrine 1996 17,133,504 1983.4 7,783 73.1 24,213Digestive & Endocrine 1997 17,533,563 1984.0 8,154 72.7 28,023Digestive & Endocrine 1998 17,918,165 1984.7 7,932 72.8 27,585Digestive & Endocrine 1999 19,188,559 1985.1 8,321 73.4 26,993Digestive & Endocrine 2000 20,147,558 1985.5 8,301 74.0 23,785Digestive & Endocrine 2001 20,385,191 1986.1 8,403 74.2 24,213Digestive & Endocrine 2002 22,400,650 1987.4 9,125 74.2 27,298Digestive & Endocrine 2003 23,330,710 1988.7 9,222 74.4 26,658Blood 1995 1,782,830 1953.2 871 54.8 13,788Blood 1996 1,889,272 1953.3 433 72.4 1,995Blood 1997 1,950,002 1953.7 372 73.9 1,658Blood 1998 2,167,689 1954.2 436 72.5 2,358Blood 1999 2,636,979 1954.8 450 71.1 2,655Blood 2000 3,366,276 1958.9 413 72.5 2,143Blood 2001 3,726,524 1964.2 408 72.3 1,818Blood 2002 4,407,413 1967.9 428 74.1 1,870Blood 2003 5,053,317 1970.2 454 74.5 1,670Circulatory 1995 29,274,934 1983.0 53,407 77.6 65,548Circulatory 1996 31,445,238 1984.1 53,990 77.9 64,778Circulatory 1997 33,112,134 1984.9 53,636 78.1 65,435Circulatory 1998 34,601,496 1985.9 51,787 78.2 62,868Circulatory 1999 38,246,147 1986.9 51,303 78.5 61,273Circulatory 2000 42,380,643 1987.7 49,687 78.7 59,848Circulatory 2001 45,401,307 1988.2 49,326 78.8 61,038Circulatory 2002 48,340,917 1988.6 50,294 79.1 58,803Circulatory 2003 50,585,429 1989.0 48,835 79.1 61,090Skin 1995 4,158,948 1964.6 250 80.5 260Skin 1996 3,935,264 1966.3 175 80.9 130Skin 1997 3,189,000 1964.9 240 78.9 515Skin 1998 2,748,965 1964.8 260 80.5 178Skin 1999 2,919,539 1966.3 289 79.1 433Skin 2000 3,003,996 1967.2 252 80.0 253Skin 2001 2,969,818 1968.0 265 80.6 203Skin 2002 2,870,937 1968.1 334 80.0 455Skin 2003 2,757,778 1968.4 305 80.7 183Genitourinary 1995 6,272,147 1976.6 2,074 79.2 1,878Genitourinary 1996 6,239,411 1976.6 2,244 79.6 1,890Genitourinary 1997 5,471,427 1978.3 2,588 80.1 2,095Genitourinary 1998 5,323,027 1979.3 2,697 80.3 2,230Genitourinary 1999 5,701,087 1979.5 2,768 80.7 2,195Genitourinary 2000 5,878,884 1980.0 2,692 80.6 2,043Genitourinary 2001 6,013,677 1980.8 2,812 81.0 1,868Genitourinary 2002 5,423,044 1981.2 2,983 81.1 1,850
Appendix Table 1Data used to estimate eq. (1)
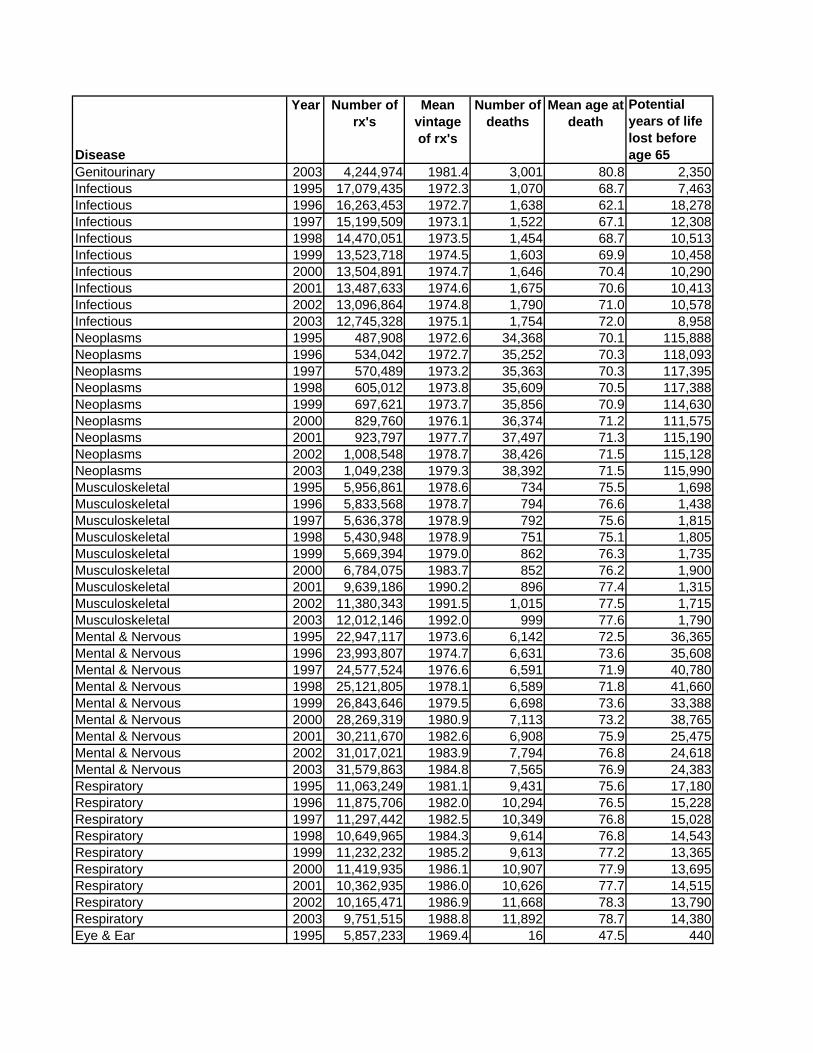
Disease
Year Number of rx's
Mean vintage of rx's
Number of deaths
Mean age at death
Potential years of life lost before age 65
Genitourinary 2003 4,244,974 1981.4 3,001 80.8 2,350Infectious 1995 17,079,435 1972.3 1,070 68.7 7,463Infectious 1996 16,263,453 1972.7 1,638 62.1 18,278Infectious 1997 15,199,509 1973.1 1,522 67.1 12,308Infectious 1998 14,470,051 1973.5 1,454 68.7 10,513Infectious 1999 13,523,718 1974.5 1,603 69.9 10,458Infectious 2000 13,504,891 1974.7 1,646 70.4 10,290Infectious 2001 13,487,633 1974.6 1,675 70.6 10,413Infectious 2002 13,096,864 1974.8 1,790 71.0 10,578Infectious 2003 12,745,328 1975.1 1,754 72.0 8,958Neoplasms 1995 487,908 1972.6 34,368 70.1 115,888Neoplasms 1996 534,042 1972.7 35,252 70.3 118,093Neoplasms 1997 570,489 1973.2 35,363 70.3 117,395Neoplasms 1998 605,012 1973.8 35,609 70.5 117,388Neoplasms 1999 697,621 1973.7 35,856 70.9 114,630Neoplasms 2000 829,760 1976.1 36,374 71.2 111,575Neoplasms 2001 923,797 1977.7 37,497 71.3 115,190Neoplasms 2002 1,008,548 1978.7 38,426 71.5 115,128Neoplasms 2003 1,049,238 1979.3 38,392 71.5 115,990Musculoskeletal 1995 5,956,861 1978.6 734 75.5 1,698Musculoskeletal 1996 5,833,568 1978.7 794 76.6 1,438Musculoskeletal 1997 5,636,378 1978.9 792 75.6 1,815Musculoskeletal 1998 5,430,948 1978.9 751 75.1 1,805Musculoskeletal 1999 5,669,394 1979.0 862 76.3 1,735Musculoskeletal 2000 6,784,075 1983.7 852 76.2 1,900Musculoskeletal 2001 9,639,186 1990.2 896 77.4 1,315Musculoskeletal 2002 11,380,343 1991.5 1,015 77.5 1,715Musculoskeletal 2003 12,012,146 1992.0 999 77.6 1,790Mental & Nervous 1995 22,947,117 1973.6 6,142 72.5 36,365Mental & Nervous 1996 23,993,807 1974.7 6,631 73.6 35,608Mental & Nervous 1997 24,577,524 1976.6 6,591 71.9 40,780Mental & Nervous 1998 25,121,805 1978.1 6,589 71.8 41,660Mental & Nervous 1999 26,843,646 1979.5 6,698 73.6 33,388Mental & Nervous 2000 28,269,319 1980.9 7,113 73.2 38,765Mental & Nervous 2001 30,211,670 1982.6 6,908 75.9 25,475Mental & Nervous 2002 31,017,021 1983.9 7,794 76.8 24,618Mental & Nervous 2003 31,579,863 1984.8 7,565 76.9 24,383Respiratory 1995 11,063,249 1981.1 9,431 75.6 17,180Respiratory 1996 11,875,706 1982.0 10,294 76.5 15,228Respiratory 1997 11,297,442 1982.5 10,349 76.8 15,028Respiratory 1998 10,649,965 1984.3 9,614 76.8 14,543Respiratory 1999 11,232,232 1985.2 9,613 77.2 13,365Respiratory 2000 11,419,935 1986.1 10,907 77.9 13,695Respiratory 2001 10,362,935 1986.0 10,626 77.7 14,515Respiratory 2002 10,165,471 1986.9 11,668 78.3 13,790Respiratory 2003 9,751,515 1988.8 11,892 78.7 14,380Eye & Ear 1995 5,857,233 1969.4 16 47.5 440
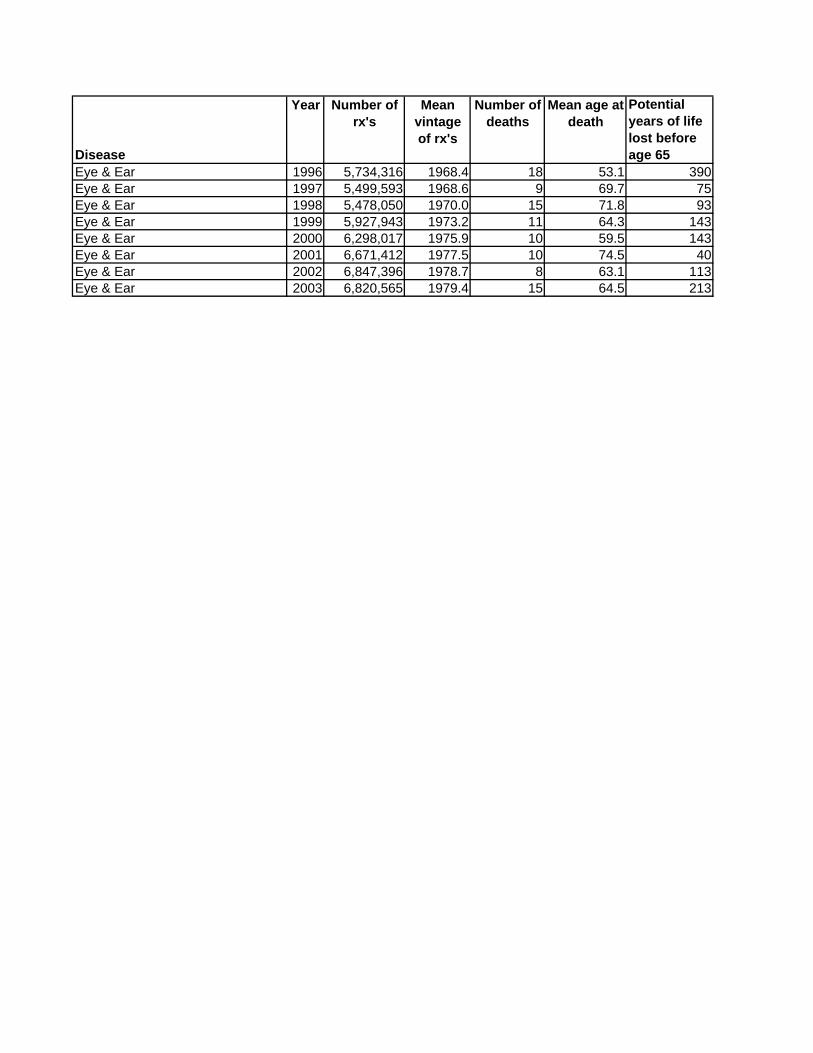
Disease
Year Number of rx's
Mean vintage of rx's
Number of deaths
Mean age at death
Potential years of life lost before age 65
Eye & Ear 1996 5,734,316 1968.4 18 53.1 390Eye & Ear 1997 5,499,593 1968.6 9 69.7 75Eye & Ear 1998 5,478,050 1970.0 15 71.8 93Eye & Ear 1999 5,927,943 1973.2 11 64.3 143Eye & Ear 2000 6,298,017 1975.9 10 59.5 143Eye & Ear 2001 6,671,412 1977.5 10 74.5 40Eye & Ear 2002 6,847,396 1978.7 8 63.1 113Eye & Ear 2003 6,820,565 1979.4 15 64.5 213