PHARMACEUTICAL ENGINEERING January/February...
6
Resource Planning in QC Laboratories JANUARY/FEBRUARY 2012 PHARMACEUTICAL ENGINEERING Online Exclusive 1 This article presents a methodology and approach to resource planning, including both analysts and instruments in QC laboratories. Resource Planning in QC Laboratories by Rafi Maslaton Figure 1. Managing labs operation: strategic level and daily operation. Introduction E very year when budget time comes, the pressure rises to cut costs, cut spending, and reduce staff; however, improvements in service level and throughput continue to be expected. Lean and Six Sigma in some cases fall short when it comes to QC labs mainly due to its complexity. The savings in packaging and manufacturing could not be matched by the quality operation which increases the pressure even further. The largest single expense item in the QC lab is labor (analysts/chemists), which are relatively high paid positions; therefore, it would be beneficial to use an advanced resource modeling tool to more accurately project the expected number of people needed in the QC lab to support the business based on a given forecast. Without the proper modeling tool, the lab could end up with either too many analysts, leading to cost increase or too few that leads to an increase in overtime, resulting in higher costs and additional stress. Scheduling for QC labs can be quite complex; both standards de- velopment and translation of the commercial and especially non-commercial forecast into QC samples. Furthermore, with the increased pressure on sites/labs consolidation, space also becomes a constraint, i.e., space for instrumen- tation, flows, etc. Despite the importance of the above, the modeling capabilities in the lab are very limited or non-existent. Often budgets are based on the senior manager’s experience, esti- mates, using a factor of let’s say 10% more than last year and occasionally the use of MS Excel, but not based on verified data driven models. This article is focused on the methodology and approach to build resources modeling, includ- ing both analysts and instruments in the QC labs. The proven approach and methodology for laboratories modeling described in this article is based on a resource planning and schedul- ing software solution (Smart-QC). This article contains examples of actual case studies and projects that have been successfully completed by one of the top three pharmaceutical, biotech, and generic companies that have embraced this methodology for their QC laboratories planning and scheduling. One of the key reasons why QC laboratories do not have advanced model- ing tools is the complexity in both standards development and translation of the commercial and especially non-commercial forecast into QC demands. This is mainly an issue for raw materials and New Products Introductions (NPI) that is usually not well defined when it comes to QC and harder to estimate in terms of labor and instrument require- ments. In addition to the operational sig- nificance of having accurate resource modeling and the financial aspects, resource modeling Online Exclusive from PHARMACEUTICAL ENGINEERING ® The Official Magazine of ISPE January/February 2012, Vol. 32 No. 1 www.PharmaceuticalEngineering.org ©Copyright ISPE 2012
Transcript of PHARMACEUTICAL ENGINEERING January/February...
Resource Planning in QC Laboratories
JanuaRy/FebRuaRy 2012 PHARMACEUTICAL ENGINEERING Online Exclusive 1
This article presents a methodology and approach to resource planning, including both analysts and instruments in QC laboratories.
Resource Planning in QC Laboratories
by Rafi Maslaton
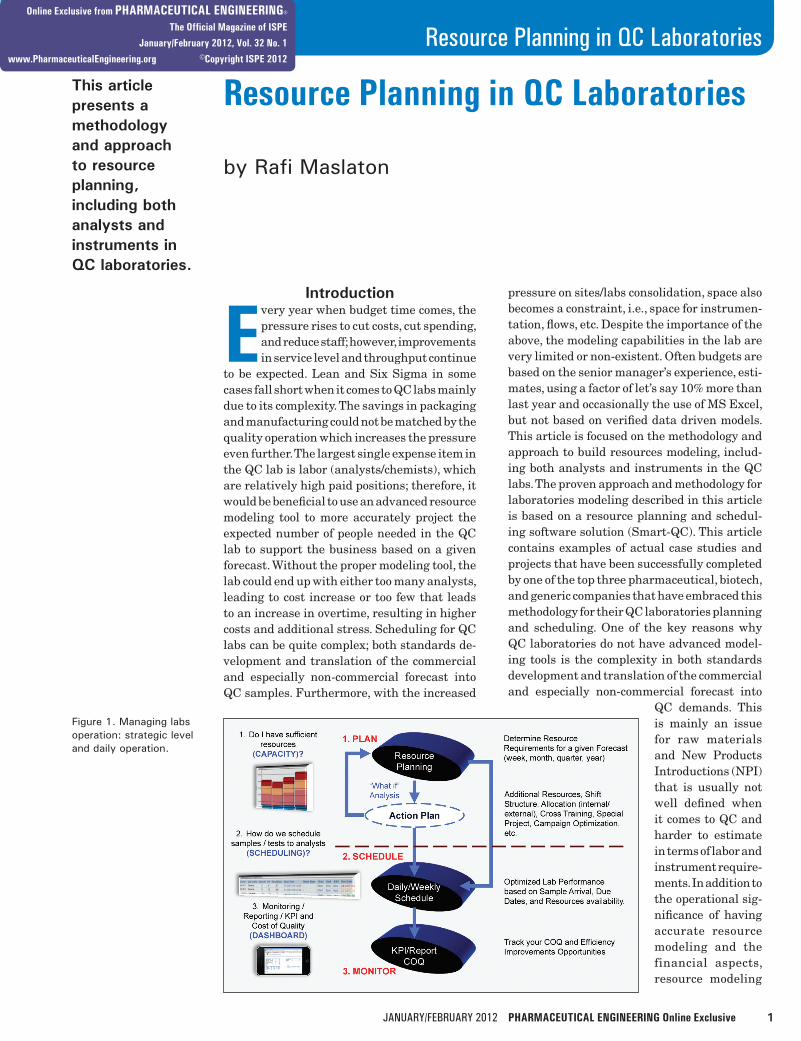
Figure 1. Managing labs operation: strategic level and daily operation.
Introduction
Every year when budget time comes, the pressure rises to cut costs, cut spending, and reduce staff; however, improvements in service level and throughput continue
to be expected. Lean and Six Sigma in some cases fall short when it comes to QC labs mainly due to its complexity. The savings in packaging and manufacturing could not be matched by the quality operation which increases the pressure even further. The largest single expense item in the QC lab is labor (analysts/chemists), which are relatively high paid positions; therefore, it would be beneficial to use an advanced resource modeling tool to more accurately project the expected number of people needed in the QC lab to support the business based on a given forecast. Without the proper modeling tool, the lab could end up with either too many analysts, leading to cost increase or too few that leads to an increase in overtime, resulting in higher costs and additional stress. Scheduling for QC labs can be quite complex; both standards de-velopment and translation of the commercial and especially non-commercial forecast into QC samples. Furthermore, with the increased
pressure on sites/labs consolidation, space also becomes a constraint, i.e., space for instrumen-tation, flows, etc. Despite the importance of the above, the modeling capabilities in the lab are very limited or non-existent. Often budgets are based on the senior manager’s experience, esti-mates, using a factor of let’s say 10% more than last year and occasionally the use of MS Excel, but not based on verified data driven models. This article is focused on the methodology and approach to build resources modeling, includ-ing both analysts and instruments in the QC labs. The proven approach and methodology for laboratories modeling described in this article is based on a resource planning and schedul-ing software solution (Smart-QC). This article contains examples of actual case studies and projects that have been successfully completed by one of the top three pharmaceutical, biotech, and generic companies that have embraced this methodology for their QC laboratories planning and scheduling. One of the key reasons why QC laboratories do not have advanced model-ing tools is the complexity in both standards development and translation of the commercial and especially non-commercial forecast into
QC demands. This is mainly an issue for raw materials and New Products Introductions (NPI) that is usually not well defined when it comes to QC and harder to estimate in terms of labor and instrument require-ments. In addition to the operational sig-nificance of having accurate resource modeling and the financial aspects, resource modeling
Online Exclusive from PHARMACEUTICAL ENGINEERING®
The Official Magazine of ISPE
January/February 2012, Vol. 32 No. 1
www.PharmaceuticalEngineering.org ©Copyright ISPE 2012
2 PHARMACEUTICAL ENGINEERING Online Exclusive JanuaRy/FebRuaRy 2012
Resource Planning in QC Laboratories
could become a major compliance risk. As outlined in the Code of Federal Regulations (CFR) Title 21 (c) “…there shall be an adequate number of qualified personnel to perform and supervise the manufacture, processing, packing, or holding of each drug product.” This is applied to QC as well as other parts of the organization. For example, if the required QC resources are underestimated and significant pressure is applied on the QC personnel to get a timely release; that can lead to excessive overtime, which then leads to increase in stress level and eventually can result in human errors and a major compliance risk.1
Resource Planning: Instrument and Analyst in QC Laboratories
QC resource modeling is one of three major steps in managing lab operations. As can be seen in Figure 1, Step 1 is resource planning (the main focus of this article), which allows a com-pany to determine if there are sufficient resources for both analysts and equipment to meet customer/business demands. There may be short term gaps that could be managed via over time, temporary work force, outside lab services. There may be more long term gaps that may require adding improvements in operational excellence, hiring, and/or outsourcing. Once the evaluation of resources is completed, Step 2 begins, which includes daily scheduling. This is the day to day lab opera-tion scheduling effort performed primarily by the supervisor with lack of computerized solution. In Step 2, the incoming samples/tests are scheduled to the various analysts based on their qualifications, proficiency, experience level, availability, due date, priority, etc. Unlike Step 1 (resource planning), which is strategic level in managing the lab operations, this is the tactical level and requires a detailed and constant effort to schedule and maintain. Step 3 is reporting, which includes the development of Key Performance Indicators (KPI), dashboard, and overall monitoring of the lab performance. What is com-mon to all steps is the data set required for the lab resource modeling that is the foundation for planning, scheduling, and reporting. This planning step (Step 1) presents even greater opportunities when dealing with multiple labs across multiple geography; being able to distribute some of the samples (i.e., stability) to other labs within the network to optimize the overall company supply chain and meet customers’ (internal/external) demands.
How to Model the Lab ResourceAs stated above, the strategic level of the lab’s operation is resource planning and the first step in planning is resource modeling. The key in modeling QC environment is simplify-ing the labs complexity while maintaining the desired level of accuracy. Also critical is how to avoid falling into the trap of collecting data for 12 months via time studies and other time consuming techniques that usually do not lead to the expected results. The main area in terms of simplification is the test time standards collection and often throughout the industry, companies are making a huge investment in performing time studies and having few internal/external consultants running around with a stop watch collecting data. Due to the multi-tasking and concurrent activities in the labs, trying to perform time studies can be highly challeng-ing. Unlike manufacturing, where for example, change over for a compression suite could take four to eight hours for two people and is a very similar flow for most products (minor/major); in the QC lab, most of the activities are short and varied between products/technique/instruments, so without proper grouping and upfront work as outlined in the method-ology, a time study can be a major waste of effort and usually does not result in meaningful standards as expected. Once the methodology outlined in the next paragraph is followed, a targeted time study for activities that are time consuming and frequent could take place in an effort to streamline these processes and improve overall efficiency. Table A presents the key steps to effectively collect stan-dards (data) for the lab which are the foundation for resource modeling. Companies that have followed the process described in this article to obtain the data in Table A managed to collect the required information effectively and in a timely manner. The following are some of the key steps to initiate this process of data collection:
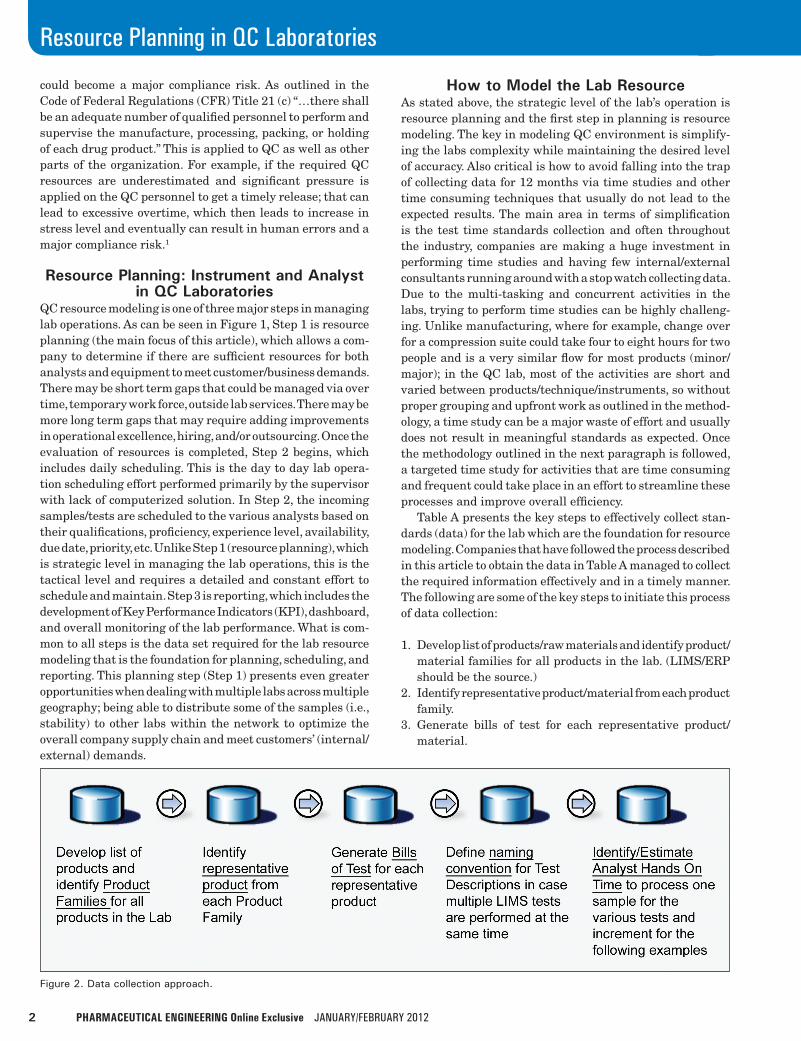
1. Develop list of products/raw materials and identify product/material families for all products in the lab. (LIMS/ERP should be the source.)
2. Identify representative product/material from each product family.
3. Generate bills of test for each representative product/material.
Figure 2. Data collection approach.
Resource Planning in QC Laboratories
JanuaRy/FebRuaRy 2012 PHARMACEUTICAL ENGINEERING Online Exclusive 3
4. Define naming convention for test descriptions in case multiple LIMS tests are performed at the same time (could be consolidated and renamed).
5. Identify/estimate analyst Hands on Time (HOT) to process one sample for the various tests and increment HOT for the following samples.
This section outlines the detailed methodology for the data collection.
A. Identify product families for all products in the lab. 1. Develop a product/material list. (LIMS/ERP should be
the source.) 2. Define potential product/material families based on
similarities in testing, product/material name and strength, etc.
3. Identify a product/material family for each product/material in the product material list.
B. Identify representative product from each product family. (This is to simplify the overall data collection process.)
1. Review list of products/materials in each family for similarities and differences in products in terms of testing.
2. Identify one product/material that has most of the tests performed for all products/materials in that family to be the representative of the family.
C. Define naming convention for test descriptions. 1. Identify test descriptions that will provide adequate
information on the type of test to the analysts when reviewing the developed standards:
• Dissolution-UVandDissolution-HPLCversusDis-solution only
• Assay-HPLCandAssay-UPLCversusAssayonly • IdentificationA, Identification B, Identification C
versus Identification only (e.g., same product may have multiple ID tests).
• Assay and Description versus Assay only if it ispreferred to perform both tests together by the same analyst. (Revised test description for combined tests column is used to identify these.)
2. Similar examples can exist for Assay and CU, Assay/Degradant, and Assay/Impurity.
D. Generate bills of test for each representative product. 1. Using the representative product/material identified
for each family, the laboratory product/material test specification, and the test naming rules defined in step C, generates the product/material-test relationships. (LIMS to be the source if available.)
2. Include and mark the tests performed for release/finished product samples.
3. Include and mark the tests performed for stability samples.
4. Include and mark the tests performed for in process samples.
5. Include and mark tests performed for full raw material testing vs. reduced testing.
E. Identify/estimate analyst hands on time to process one sample for the various tests.
1. For each type of test, identify/estimate the total hands on time required by analyst to 1. prepare the sample, 2. set-up the instrument, 3. monitor/operate the instrument run, 4. perform post-run analysis and calculations, and 5. audit the results if applicable for a one sample run (Table A).
2. The time should include only the hands on time spent by the analyst and exclude instrument time, e.g., HPLC may run for 10 hours, but the analyst may only be monitoring/checking the run hands on for 30 minutes during that time.
3. For each of these tests, add the increment time required to test additional samples (i.e., one test would take six hours to perform all the HOT and any additional sample with the same test/method added would take an additional one hour vs. the six hours).
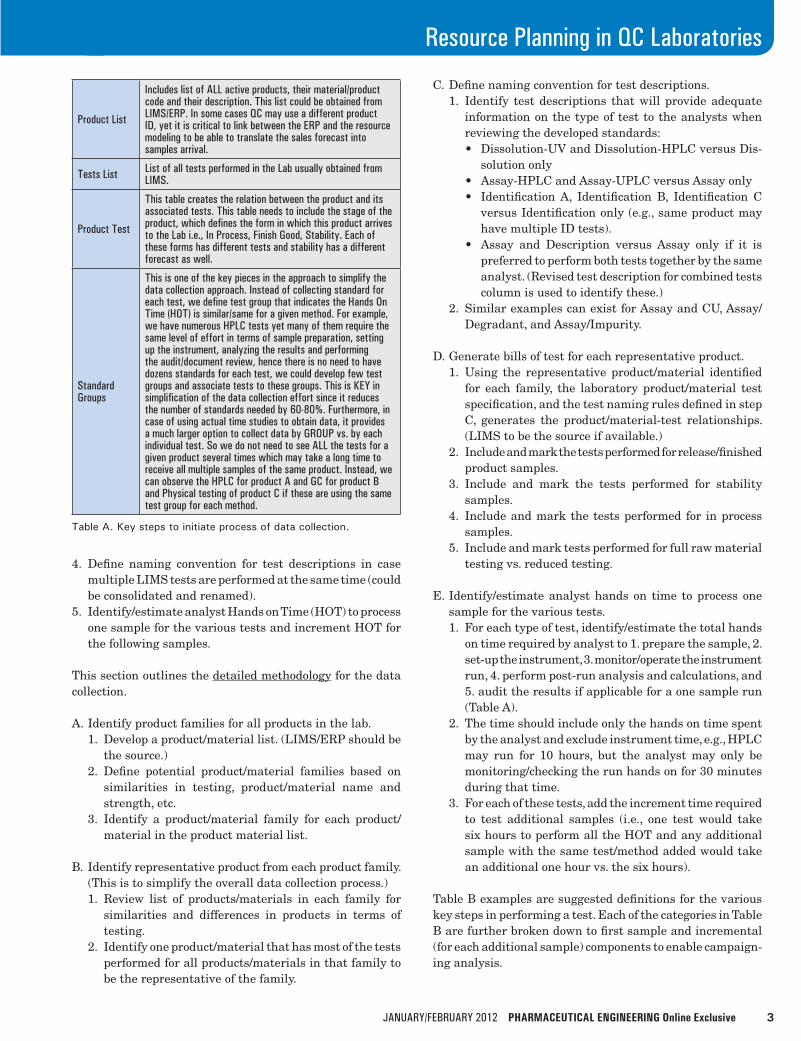
Table B examples are suggested definitions for the various key steps in performing a test. Each of the categories in Table B are further broken down to first sample and incremental (for each additional sample) components to enable campaign-ing analysis.
Product List
Includes list of aLL active products, their material/product code and their description. This list could be obtained from LIMS/eRP. In some cases QC may use a different product ID, yet it is critical to link between the eRP and the resource modeling to be able to translate the sales forecast into samples arrival.
Tests List List of all tests performed in the Lab usually obtained from LIMS.
Product Test
This table creates the relation between the product and its associated tests. This table needs to include the stage of the product, which defines the form in which this product arrives to the Lab i.e., In Process, Finish Good, Stability. each of these forms has different tests and stability has a different forecast as well.
Standard Groups
This is one of the key pieces in the approach to simplify the data collection approach. Instead of collecting standard for each test, we define test group that indicates the Hands On Time (HOT) is similar/same for a given method. For example, we have numerous HPLC tests yet many of them require the same level of effort in terms of sample preparation, setting up the instrument, analyzing the results and performing the audit/document review, hence there is no need to have dozens standards for each test, we could develop few test groups and associate tests to these groups. This is Key in simplification of the data collection effort since it reduces the number of standards needed by 60-80%. Furthermore, in case of using actual time studies to obtain data, it provides a much larger option to collect data by GROUP vs. by each individual test. So we do not need to see aLL the tests for a given product several times which may take a long time to receive all multiple samples of the same product. Instead, we can observe the HPLC for product A and GC for product B and Physical testing of product C if these are using the same test group for each method.
Table A. Key steps to initiate process of data collection.
4 PHARMACEUTICAL ENGINEERING Online Exclusive JanuaRy/FebRuaRy 2012
Resource Planning in QC Laboratories
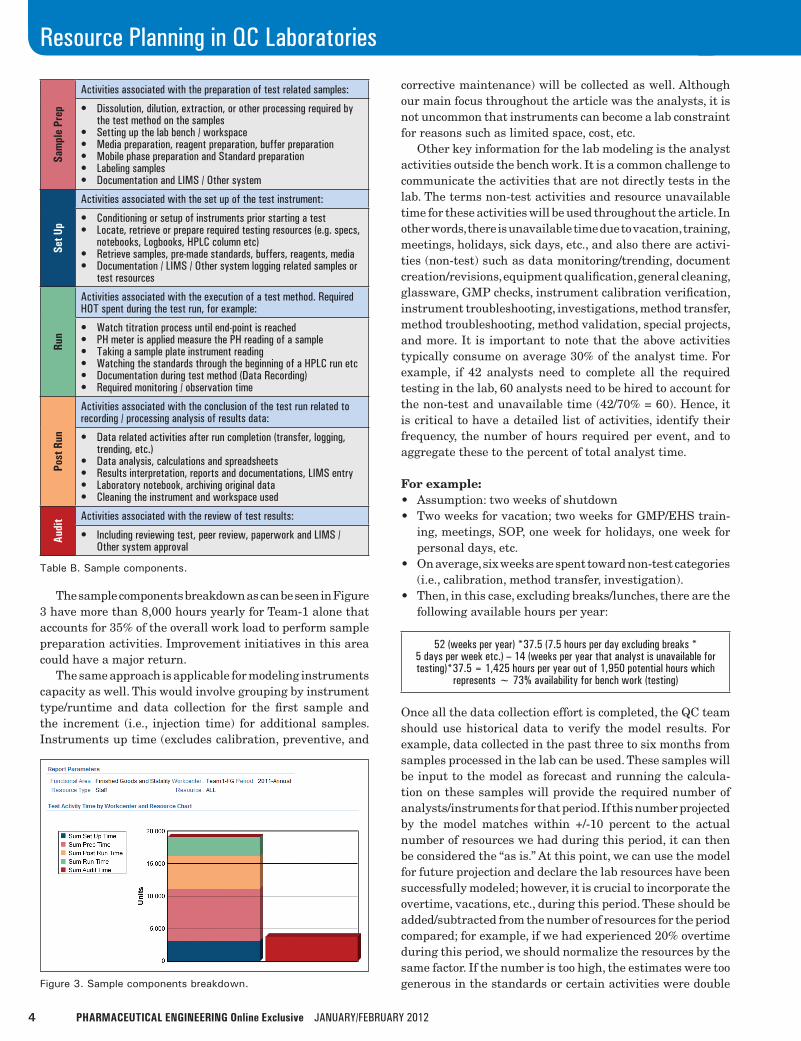
The sample components breakdown as can be seen in Figure 3 have more than 8,000 hours yearly for Team-1 alone that accounts for 35% of the overall work load to perform sample preparation activities. Improvement initiatives in this area could have a major return. The same approach is applicable for modeling instruments capacity as well. This would involve grouping by instrument type/runtime and data collection for the first sample and the increment (i.e., injection time) for additional samples. Instruments up time (excludes calibration, preventive, and
corrective maintenance) will be collected as well. Although our main focus throughout the article was the analysts, it is not uncommon that instruments can become a lab constraint for reasons such as limited space, cost, etc. Other key information for the lab modeling is the analyst activities outside the bench work. It is a common challenge to communicate the activities that are not directly tests in the lab. The terms non-test activities and resource unavailable time for these activities will be used throughout the article. In other words, there is unavailable time due to vacation, training, meetings, holidays, sick days, etc., and also there are activi-ties (non-test) such as data monitoring/trending, document creation/revisions, equipment qualification, general cleaning, glassware, GMP checks, instrument calibration verification, instrument troubleshooting, investigations, method transfer, method troubleshooting, method validation, special projects, and more. It is important to note that the above activities typically consume on average 30% of the analyst time. For example, if 42 analysts need to complete all the required testing in the lab, 60 analysts need to be hired to account for the non-test and unavailable time (42/70% = 60). Hence, it is critical to have a detailed list of activities, identify their frequency, the number of hours required per event, and to aggregate these to the percent of total analyst time.
For example:• Assumption:twoweeksofshutdown• Twoweeksforvacation;twoweeksforGMP/EHStrain-
ing, meetings, SOP, one week for holidays, one week for personal days, etc.
• Onaverage,sixweeksarespenttowardnon-testcategories(i.e., calibration, method transfer, investigation).
• Then,inthiscase,excludingbreaks/lunches,therearethefollowing available hours per year:
52 (weeks per year) *37.5 (7.5 hours per day excluding breaks * 5 days per week etc.) – 14 (weeks per year that analyst is unavailable for testing)*37.5 = 1,425 hours per year out of 1,950 potential hours which
represents ~ 73% availability for bench work (testing)
Once all the data collection effort is completed, the QC team should use historical data to verify the model results. For example, data collected in the past three to six months from samples processed in the lab can be used. These samples will be input to the model as forecast and running the calcula-tion on these samples will provide the required number of analysts/instruments for that period. If this number projected by the model matches within +/-10 percent to the actual number of resources we had during this period, it can then be considered the “as is.” At this point, we can use the model for future projection and declare the lab resources have been successfully modeled; however, it is crucial to incorporate the overtime, vacations, etc., during this period. These should be added/subtracted from the number of resources for the period compared; for example, if we had experienced 20% overtime during this period, we should normalize the resources by the same factor. If the number is too high, the estimates were too generous in the standards or certain activities were double Figure 3. Sample components breakdown.
Sam
ple
Prep
activities associated with the preparation of test related samples:
• Dissolution, dilution, extraction, or other processing required by the test method on the samples
• Setting up the lab bench / workspace• Media preparation, reagent preparation, buffer preparation• Mobile phase preparation and Standard preparation• Labeling samples• Documentation and LIMS / Other system
Set U
p
activities associated with the set up of the test instrument:
• Conditioning or setup of instruments prior starting a test• Locate, retrieve or prepare required testing resources (e.g. specs,
notebooks, Logbooks, HPLC column etc)• Retrieve samples, pre-made standards, buffers, reagents, media• Documentation / LIMS / Other system logging related samples or
test resources
Run
Activities associated with the execution of a test method. Required HOT spent during the test run, for example:
• Watch titration process until end-point is reached• PH meter is applied measure the PH reading of a sample• Taking a sample plate instrument reading• Watching the standards through the beginning of a HPLC run etc• Documentation during test method (Data Recording)• Required monitoring / observation time
Post
Run
activities associated with the conclusion of the test run related to recording / processing analysis of results data:
• Data related activities after run completion (transfer, logging, trending, etc.)
• Data analysis, calculations and spreadsheets• Results interpretation, reports and documentations, LIMS entry • Laboratory notebook, archiving original data• Cleaning the instrument and workspace used
Audi
t activities associated with the review of test results:
• Including reviewing test, peer review, paperwork and LIMS / Other system approval
Table B. Sample components.
Resource Planning in QC Laboratories
JanuaRy/FebRuaRy 2012 PHARMACEUTICAL ENGINEERING Online Exclusive 5
counted and it will need to be reviewed/investigated. The other extreme could be in the same way the need for 40 analysts was estimated for the last three to six months, yet there are 80 in the lab, so this means the estimates were too aggres-sive or some of the activities that are performed in the lab were missed. Once it is established within +/-10% that the model reflects the “as is,” this could be the baseline for the lab model. As mentioned at the beginning, if the lab would like to perform a time study, once the grouping is completed and the forecast is entered, the time study could focus on the biggest hits, the highest contributing tests to the overall staffing/instrument requirements. Without these steps listed before, any time study may be focused on insignificant test methods and the value as a result will be limited. When looking at the complexity and the significant effort required for building a resource model tool, one might ques-tion the benefits from such a model other than estimating the number of analysts and instruments needed for the QC lab. Although it is important enough as it stands by itself, there are many other benefits that are part of this effort and help identify opportunities for improvements and help refine some of the operating model companies have become accustomed to use:
• IdentifytestsmethodsthatcontributemostoftheHOT/FTE and work on improving these.
• Identifydesiredcampaignsizemethod/productandworkwith the supply chain and manufacturing on alignment/synergy to improve the lab efficiency. (For example, allow the lab to hold a sample for three days before starting with the testing so other samples could arrive to enhance the campaign size.)
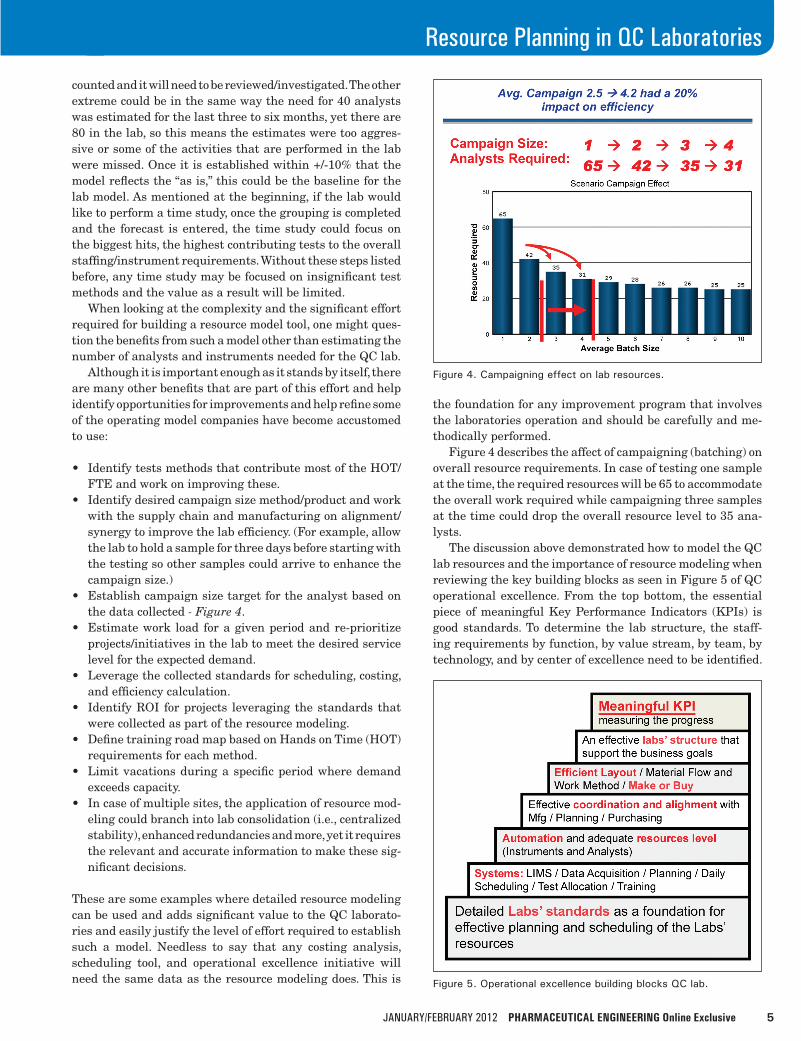
• Establishcampaignsizetargetfortheanalystbasedonthe data collected - Figure 4.
• Estimatework load foragivenperiodandre-prioritizeprojects/initiatives in the lab to meet the desired service level for the expected demand.
• Leveragethecollectedstandardsforscheduling,costing,and efficiency calculation.
• IdentifyROI forprojects leveraging thestandards thatwere collected as part of the resource modeling.
• DefinetrainingroadmapbasedonHandsonTime(HOT)requirements for each method.
• Limitvacationsduringaspecificperiodwheredemandexceeds capacity.
• Incaseofmultiplesites,theapplicationofresourcemod-eling could branch into lab consolidation (i.e., centralized stability), enhanced redundancies and more, yet it requires the relevant and accurate information to make these sig-nificant decisions.
These are some examples where detailed resource modeling can be used and adds significant value to the QC laborato-ries and easily justify the level of effort required to establish such a model. Needless to say that any costing analysis, scheduling tool, and operational excellence initiative will need the same data as the resource modeling does. This is
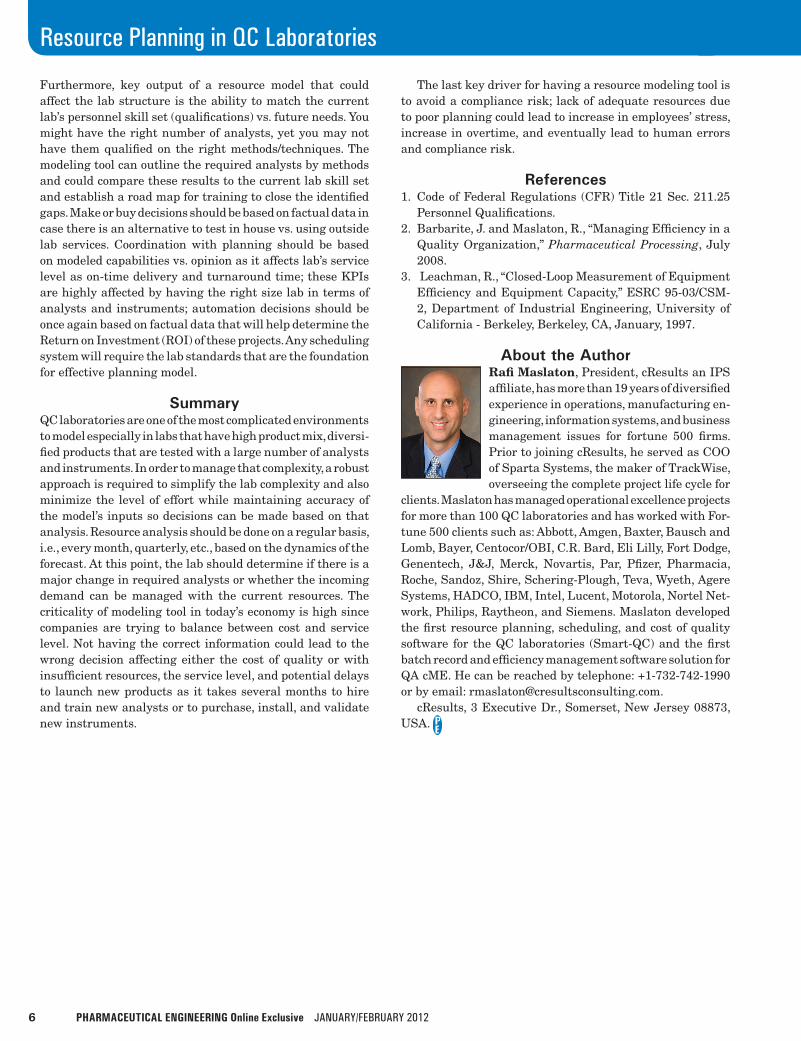
the foundation for any improvement program that involves the laboratories operation and should be carefully and me-thodically performed. Figure 4 describes the affect of campaigning (batching) on overall resource requirements. In case of testing one sample at the time, the required resources will be 65 to accommodate the overall work required while campaigning three samples at the time could drop the overall resource level to 35 ana-lysts. The discussion above demonstrated how to model the QC lab resources and the importance of resource modeling when reviewing the key building blocks as seen in Figure 5 of QC operational excellence. From the top bottom, the essential piece of meaningful Key Performance Indicators (KPIs) is good standards. To determine the lab structure, the staff-ing requirements by function, by value stream, by team, by technology, and by center of excellence need to be identified.
Figure 4. Campaigning effect on lab resources.
Figure 5. Operational excellence building blocks QC lab.
6 PHARMACEUTICAL ENGINEERING Online Exclusive JanuaRy/FebRuaRy 2012
Resource Planning in QC Laboratories
Furthermore, key output of a resource model that could affect the lab structure is the ability to match the current lab’s personnel skill set (qualifications) vs. future needs. You might have the right number of analysts, yet you may not have them qualified on the right methods/techniques. The modeling tool can outline the required analysts by methods and could compare these results to the current lab skill set and establish a road map for training to close the identified gaps. Make or buy decisions should be based on factual data in case there is an alternative to test in house vs. using outside lab services. Coordination with planning should be based on modeled capabilities vs. opinion as it affects lab’s service level as on-time delivery and turnaround time; these KPIs are highly affected by having the right size lab in terms of analysts and instruments; automation decisions should be once again based on factual data that will help determine the Return on Investment (ROI) of these projects. Any scheduling system will require the lab standards that are the foundation for effective planning model.
SummaryQC laboratories are one of the most complicated environments to model especially in labs that have high product mix, diversi-fied products that are tested with a large number of analysts and instruments. In order to manage that complexity, a robust approach is required to simplify the lab complexity and also minimize the level of effort while maintaining accuracy of the model’s inputs so decisions can be made based on that analysis. Resource analysis should be done on a regular basis, i.e., every month, quarterly, etc., based on the dynamics of the forecast. At this point, the lab should determine if there is a major change in required analysts or whether the incoming demand can be managed with the current resources. The criticality of modeling tool in today’s economy is high since companies are trying to balance between cost and service level. Not having the correct information could lead to the wrong decision affecting either the cost of quality or with insufficient resources, the service level, and potential delays to launch new products as it takes several months to hire and train new analysts or to purchase, install, and validate new instruments.
The last key driver for having a resource modeling tool is to avoid a compliance risk; lack of adequate resources due to poor planning could lead to increase in employees’ stress, increase in overtime, and eventually lead to human errors and compliance risk.
References1. Code of Federal Regulations (CFR) Title 21 Sec. 211.25
Personnel Qualifications.2. Barbarite, J. and Maslaton, R., “Managing Efficiency in a
Quality Organization,” Pharmaceutical Processing, July 2008.
3. Leachman, R., “Closed-Loop Measurement of Equipment Efficiency and Equipment Capacity,” ESRC 95-03/CSM-2, Department of Industrial Engineering, University of California - Berkeley, Berkeley, CA, January, 1997.
About the AuthorRafi Maslaton, President, cResults an IPS affiliate, has more than 19 years of diversified experience in operations, manufacturing en-gineering, information systems, and business management issues for fortune 500 firms. Prior to joining cResults, he served as COO of Sparta Systems, the maker of TrackWise, overseeing the complete project life cycle for
clients. Maslaton has managed operational excellence projects for more than 100 QC laboratories and has worked with For-tune 500 clients such as: Abbott, Amgen, Baxter, Bausch and Lomb, Bayer, Centocor/OBI, C.R. Bard, Eli Lilly, Fort Dodge, Genentech, J&J, Merck, Novartis, Par, Pfizer, Pharmacia, Roche, Sandoz, Shire, Schering-Plough, Teva, Wyeth, Agere Systems, HADCO, IBM, Intel, Lucent, Motorola, Nortel Net-work, Philips, Raytheon, and Siemens. Maslaton developed the first resource planning, scheduling, and cost of quality software for the QC laboratories (Smart-QC) and the first batch record and efficiency management software solution for QA cME. He can be reached by telephone: +1-732-742-1990 or by email: [email protected]. cResults, 3 Executive Dr., Somerset, New Jersey 08873, USA.