PG&E’s Perspective on Demand Response under the Smart Grid
32
1 PG&E PG&E ’ ’ s Perspective on s Perspective on Demand Response under Demand Response under the Smart Grid Paradigm the Smart Grid Paradigm Kenneth E. Abreu Principal Regulatory Analyst PG&E March 17, 2009 2009 Power Systems Conference & Exposition Seattle, Wa.
Transcript of PG&E’s Perspective on Demand Response under the Smart Grid

1
PG&EPG&E’’s Perspective on s Perspective on Demand Response under Demand Response under the Smart Grid Paradigmthe Smart Grid Paradigm
Kenneth E. Abreu Principal Regulatory Analyst
PG&EMarch 17, 2009
2009 Power Systems Conference & ExpositionSeattle, Wa.

2
Outline of Presentation
PG&E’s Smart Energy Web VisionSmartMeter DeploymentPG&E’s 2009-11 Demand Response PlanPG&E’s Demand Response PilotsDynamic RatesDemand Response, SmartGrid and RenewablesSummary

3
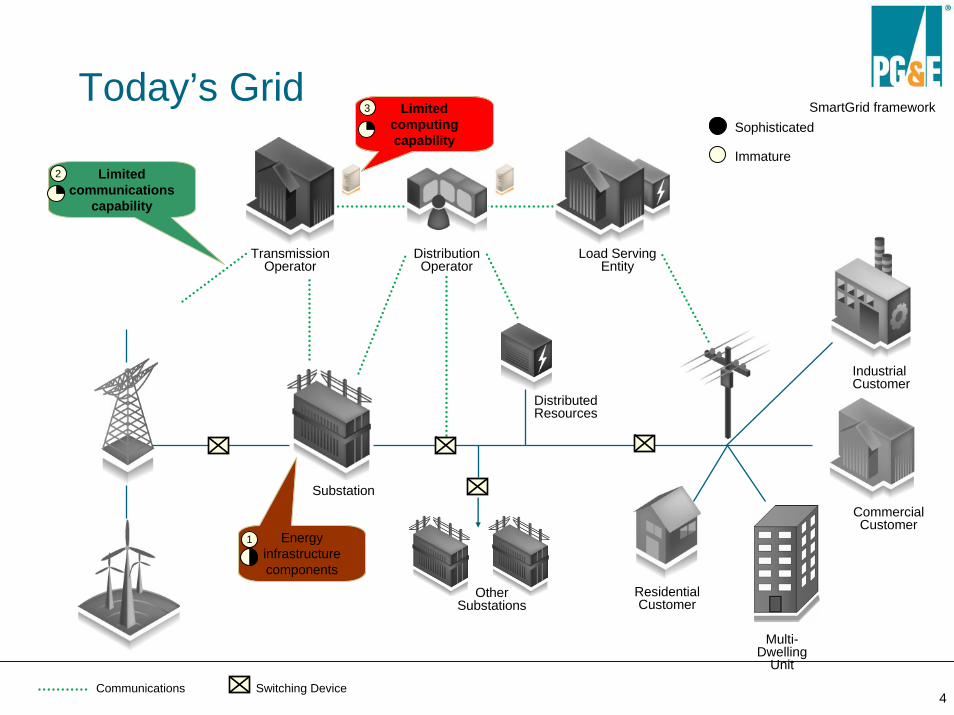
What is Changing in Smart Grid to Advance DR?
T&D GridWill continue evolutionary change thru technology
Customer Beyond the MeterOld world: no linkage
New World: Lots of linkages
Wholesale MarketOld World: No linkage to retail customers
New World: Linkage all the way thru customer
4
TransmissionOperator
DistributedResources
OtherSubstations
DistributionOperator
Load ServingEntity
Substation
ResidentialCustomer
CommercialCustomer
Industrial Customer
Energy infrastructure components
1
Limited communications
capability
2
Limited computing capability
3Today’s Grid
Communications Switching Device
SmartGrid frameworkSophisticated
Immature
Multi-Dwelling
Unit

5
Smart Grid Components:Pervasive Sensing Devices
SmartMeter™Electric Meter
Distribution Load Sensor
Appliance-level Electric Usage
Monitor
Grid Premise In the Home

6
SmartMeter™Electric Meter
Network AccessPoint
Smart Grid Components:An Advanced Communications Network
Public WirelessNetwork
In-Home Network

7
Smart Grid Components:Robust Computing Capability
Both centralized and distributed
110,000 gigahertz of processing capability
65,000 gigabytes of stored data per year

8
TransmissionOperator
DistributionOperator
Load ServingEntity
Substation
Sensor Advanced ComputingSmart Switching DeviceCommunications
Future Smart Grid SmartGrid frameworkDetail on next page
OtherSubstations
ResidentialCustomer Multi-
Dwelling Unit
IndustrialCustomer
CommercialCustomer
DistributedResources
Microgrid / sustainable communities
EnergyStorage
Advanced applications
4
Comprehensivecommunications
capability
2
Distributed computing
3
Increased capacity and flexibility (e.g.
bidirectional flow) of energy infrastructure
components
1

9
DistributedGeneration & Storage
SmartEnd-Use Devices
Plug-InHybrids
AdvancedMetering
Consumer Portal& Building EMS
Internet
Renewables
Efficient BuildingSystems
Photovoltaic / solar
ControlInterface
Smart Grid Customer Opportunities
Plug-InHybrids
AdvancedMetering
Photovoltaic / solar
DistributedGeneration & Storage
Information exchange
Single home example
Multi-Dwelling Unit example
Informati
on exch
ange

10
A little more detailAll systems are interdependent. New systems must consider how they need to communicate across systems in a distributed way

11
Smart Grid Vision
We do not need to define the end stateDefine a minimum base set of architectural boundariesLegacy systems migrate into these overtime as much as possibleOvertime we evolve into PG&Es SmartGridOpen Standards are key to Smart Grid:
Without open standards a SmartGrid will not be achievedWithout industry compliance a SmartGrid will not be achieved

12
Automated meter reading
10 Million meter upgrades
A network to collect meter reads remotely
Frequent meter reads - daily for gas, hourly or 15 minute interval for electric
Enables demand response rates and customer home/premise automation
Enhanced capabilities over time
The PG&E SmartMeter Program

13
SmartMeter Upgrade Technology

14
5,000
7,000
9,000
11,000
13,000
15,000
17,000
19,000
21,000
Jan Feb Mar Apr May Jun Jul Aug Sep Oct Nov Dec
Electric Demand Is Seasonally Variable
MW
s
PG&E Peak LoadJuly 25 @ 1700 hours
2006 Annual Usage

15
20
30
35
40
45
1 2 3 4 5 6 7 8 9 10 11 12 1 2 3 4 5 6 7 8 9 10 11 12
CA
ISO
Ele
ctric
Dem
and
in G
igaw
atts
(GW
)
AM PM
Typical Summer Demand
Electric Demand Varies Significantly Over The Course Of Each Day

16
Utilities Must Maintain Enough Generation To Supply Peak Demand

17
Peak Generation Capacity Sits Idle Much Of The Time
Source: California Independent System Operator Corporation
0
5,000
10,000
15,000
20,000
25,000
30,000
35,000
40,000
45,000
50,000
0 500 1,000 1,500 2,000 2,500 3,000 3,500 4,000 4,500 5,000 5,500 6,000 6,500 7,000 7,500 8,000 8,500
MW
Hours per Year
Last 25% of capacity needed less than 10% of
the time
Last 5% (2,500 MW) needed less than 50 hours
per year

18
Smart Grid EnablesAutomated Demand Management
Home Area Network communication
SmartMeter communication

19
Automated Demand Management Generates Negawatts
Martinez, CA office building electricity use with and without automated demand response, June 21, 2006
20
PG&E’s 2009-11 Demand Response Plan
Several price responsive programs are included in PG&E’s program.DR Service Provider (Aggregator) programs are a major and growing part of the DR portfolio.Emergency programs will continue to be an important part of PG&E DR programs as well.Auto DR is a program that provides for an automated system to signal customers Energy Management Systems to initiate a DR event. This program has been successful for PG&E in the past and it is planned for growth. Automation is a key to significant, reliable, cost–effective DR.

21
2009-2011 Major DR Trends
Integration of DR with MRTU
Integration of DR with Energy Efficiency and Distributed Generation
Integration of DR with Smart Meter, HAN and future Dynamic Pricing Tariffs

22
2009-11 growth (per filing)
0.0
200.0
400.0
600.0
800.0
1,000.0
1,200.0
1,400.0
1 2 3
Peak Choice BEC CBP
DWR Large CPP Demand Bidding (DBP)
Aggregator Managed Portfolio (AMP) Small Customer Price Triggered Program (AMI) BIP
A/C Cycling

23
DR pilot projects
PG&E is planning two Ancillary Services (AS) pilot projects.
Also two pilots to help with integrating renewables:
Also a pilot on aggregating small commercial/industrial customers'
24
Ancillary Services (AS) pilot projects
One for Commercial & Industrial (C&I) customers that is targeted for summer of 2009
3 to 4 sitesTelemetry at each siteAuto DR technologyBid AS to CAISO market
Residential air conditioning customers in our DR program provide a potential AS product.
2 climate regions3 feeders eachEach feeder has different technologyVisible to CAISO at feeder level

25
Pilots to help with integrating renewables
Provide regulation/load following using distributed storage.
Refrigerated Warehouse (thermal)Batteries (electric)
Plug-In Hybrid Electric Vehicle (PHEV) and Electric Vehicle Smart Charging pilot projects will be an additional pilot.
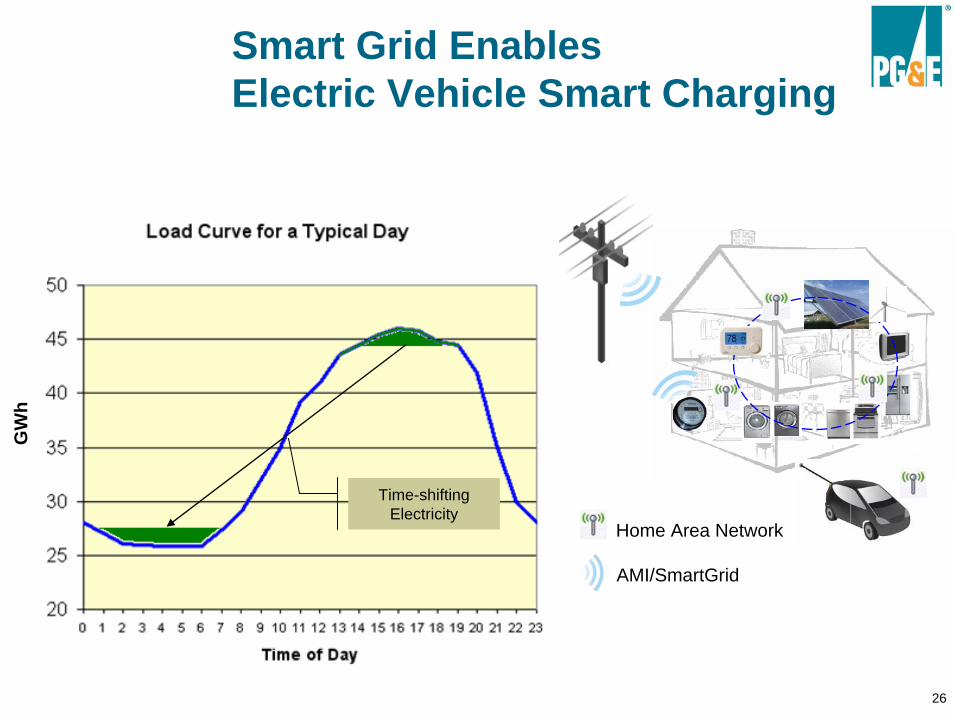
26
Home Area Network
AMI/SmartGrid
Time-shifting Electricity
GW
hSmart Grid EnablesElectric Vehicle Smart Charging

27
Electric Vehicles (EV) – Potential major Advancement
Old Rules“Electricity can’t be stored economically – so generation must meet load in real time”
EVs could change this rule and thus the nature of the grid
The storage is now “paid for” by someone else.Possible charging and discharging to signals

28
Dynamic Rates
A recent CPUC decision on Dynamic Rates will have all non-residential customers eventually defaulted into a DR program by 2011-12. The decision includes the implementation of Real Time Pricing for major classes of customers.
Initially the CAISO day ahead prices will be utilized to determine these rates.

29
33% Renewable Portfolio Standard by 2020!
Smart Grid Necessary for Integrating Renewable Energy into the Grid

30
Wind Is Highly Variable And Difficult To Predict
0
100
200
300
400
Meg
awat
ts
500
600
700
1 2 3 4 5 6 7 8 9 10 11 12 13 14 15 16 17 18 19 20 21 22 23 24
−Average
Each Day is a different color.
−Day 29
−Day 5−Day 26
−Day 9
Source: Cal ISO

31
This Variability Can SeriouslyThreaten Reliability
Texas, February 2008
Wind generation dropped from1,700 MW to 300 MW (~80%)
Required demand curtailment of 1,100 MWin 10 minutes

32
Summary
SmartGrid and Smart Meters will open up more opportunities for Demand ResponseTransparent wholesale markets will further expand DR opportunitiesDR as AS has potentialDR may allow more renewables into gridThe ability for communications and control linkages between customers and both the T &D grid and wholesale market creates major new opportunities for DR.