PG4049-LET.03 - Groundwater Monitoring Pro
21
May 24, 2018 File: PG4049-LET.03 Mattamy Homes 50 Hines Road, Suite 100 Ottawa, Ontario K2K 2M5 Attention: Ms. Jillian Normand Subject: Sump Pump Feasibility Review Summerside West Residential Development - Phases 4, 5 and 6 Tenth Line Road - Ottawa, Ontario Dear Madam, Paterson Group Inc. (Paterson) has prepared the following letter to detail the results of our sump pump feasibility review for the undeveloped area within Summerside West Community. The letter report was prepared to provide available soil and groundwater information for the subject site to determine the applicability of sump pumps for the residential buildings. It should be noted that post-development groundwater levels will be well below the currently reported groundwater levels based on the effect that development has on groundwater levels within a former agricultural field over a low permeability soil, such as a deep silty clay deposit. Paterson also completed a supplemental soil review, consisting of a series of sieve and hydrometer tests on selected soil samples. The results of our sieve and hydrometer testing are attached to the present letter report. For additional details regarding soil profiles encountered within the proposed Summerside West development reference should be made to our geotechnical report presented under cover Report PG4049-2 dated May 14, 2018. Falling head (slug) testing was also completed as part of our review to determine hydraulic conductivity of the underlying soils. The results of our falling head testing are attached to the present letter report. Consulting Engineers 154 Colonnade Road South Ottawa, Ontario Canada, K2E 7J5 Tel: (613) 226-7381 Fax: (613) 226-6344 Geotechnical Engineering Environmental Engineering Hydrogeology Geological Engineering Materials Testing Building Science Archaeological Services www.patersongroup.ca patersongroup Ottawa Kingston North Bay
Transcript of PG4049-LET.03 - Groundwater Monitoring Pro

May 24, 2018
File: PG4049-LET.03
Mattamy Homes
50 Hines Road, Suite 100
Ottawa, Ontario
K2K 2M5
Attention: Ms. Jillian Normand
Subject: Sump Pump Feasibility Review
Summerside West Residential Development - Phases 4, 5 and 6
Tenth Line Road - Ottawa, Ontario
Dear Madam,
Paterson Group Inc. (Paterson) has prepared the following letter to detail the results of our
sump pump feasibility review for the undeveloped area within Summerside West
Community. The letter report was prepared to provide available soil and groundwater
information for the subject site to determine the applicability of sump pumps for the
residential buildings.
It should be noted that post-development groundwater levels will be well below the currently
reported groundwater levels based on the effect that development has on groundwater
levels within a former agricultural field over a low permeability soil, such as a deep silty clay
deposit.
Paterson also completed a supplemental soil review, consisting of a series of sieve and
hydrometer tests on selected soil samples. The results of our sieve and hydrometer testing
are attached to the present letter report. For additional details regarding soil profiles
encountered within the proposed Summerside West development reference should be
made to our geotechnical report presented under cover Report PG4049-2 dated May 14,
2018. Falling head (slug) testing was also completed as part of our review to determine
hydraulic conductivity of the underlying soils. The results of our falling head testing are
attached to the present letter report.
Consulting Engineers
154 Colonnade Road SouthOttawa, OntarioCanada, K2E 7J5Tel: (613) 226-7381Fax: (613) 226-6344
Geotechnical EngineeringEnvironmental EngineeringHydrogeologyGeological EngineeringMaterials TestingBuilding ScienceArchaeological Services
www.patersongroup.ca
patersongroup
Ottawa Kingston North Bay

Ms. Jillian NormandPage 2File: PG4049-LET.03
1.0 Groundwater Monitoring Program
The groundwater monitoring wells installed for the monitoring program within Phases 4, 5
and 6 of Summerside West were completed by a licensed well contractor under the
supervision of Paterson personnel in February 2017. At that time, the well contractor
installed two (2) groundwater monitoring wells at each of the seven (7) well cluster locations
(MW 1 to MW 7). Two monitoring wells are installed at each well cluster location, a shallow
and deep screen interval. The MW “A” designation indicates the deep installation and the
MW “B” designation indicates the shallow installation. The monitoring well locations within
Summerside West are presented in Drawing PG4049-1 - Test Hole Location Plan attached.
Monitoring Well Installation
Typical monitoring well construction details are described below:
‘ 1.5 m of slotted 51 mm diameter PVC screen at the base of the aforementioned
boreholes.
‘ 51 mm diameter PVC riser pipe from the top of the screen to the ground surface.
‘ No.3 silica sand backfill within annular space around screen.
‘ A minimum of 300 mm thick bentonite hole plug directly above PVC slotted screen.
‘ Clean backfill from top of bentonite plug to the ground surface.
The monitoring well details are also presented in the Soil Profile and Test Data sheets
attached.
Groundwater Monitoring Results
Paterson personnel completed the initial groundwater readings at MW 1 to MW 7 on
May 2, 2017. Follow-up groundwater level readings were taken in August 10 and
October 25, 2017 and May 11, 2018. The measured groundwater levels (GWLs) in the
monitoring wells installed in the boreholes are summarized in Table 1 on the following
page.
It should be noted that groundwater level observations based on our recovered soil
samples at our borehole locations indicate the long-term groundwater level (pre-
development) is located approximately 1.5 to 2.5 m below original ground surface (~85.5
to 83.5 m).
patersongroup

Ms. Jillian NormandPage 3File: PG4049-LET.03
Table 1 - Summary of Groundwater Level Readings
Test
Hole
Number
Ground
Surface
Elevation,
m
Groundwater Levels, m
May 2, 2017 August 10, 2017 October 25, 2017 May 11, 2018
Depth Elevation Depth Elevation Depth Elevation Depth Elevation
MW 1A 86.76 0.19 86.57 1.03 85.73 0.30 86.46 - -
MW 1B 86.76 0.20 86.56 0.83 85.93 0.23 86.53 0.54 86.22
MW 2A 86.40 0.29 86.11 0.44 85.96 0.42 85.98 - -
MW 2B 86.40 0.30 86.10 0.77 85.63 0.08 86.32 0.71 85.69
MW 3A 86.82 0.12 86.70 1.03 85.79 0.30 86.52 - -
MW 3B 86.82 0.28 86.54 0.80 86.02 0.44 86.38 0.81 86.01
MW 4A 86.41 0.48 85.93 0.76 85.65 1.16 85.25 - -
MW 4B 86.41 0.34 86.07 0.73 85.68 0.63 85.78 0.62 85.79
MW 5A 86.55 0.60 85.95 0.62 85.93 0.60 85.95 - -
MW 5B 86.55 0.38 86.17 0.75 85.80 0.49 86.06 0.42 86.13
MW 6A 86.17 0.62 85.55 0.37 85.80 0.45 85.72 - -
MW 6B 86.17 0.10 86.07 0.40 85.77 0.18 85.99 0.25 85.92
MW 7A 86.60 0.38 86.22 0.45 86.15 0.48 86.12 - -
MW 7B 86.60 0.17 86.43 0.75 85.85 0.16 86.44 0.30 86.30
Note: - The ground surface elevations at each borehole location were provided by J. D. Barnes Limited.
patersongroup

Ms. Jillian NormandPage 4File: PG4049-LET.03
Hydraulic Conductivity Testing Results
Falling Head (Slug) testing was completed at the shallow well locations (MW1B, MW2B,
MW3B, MW4B, MW5B, MW6B and MW7B) on May 11 and 16, 2018. Based on our
testing results, a horizontal hydraulic conductivity varying between 5.07 x10⁻⁷ m/sec to
5.07 x10⁻⁸ m/sec was observed at the selected monitoring well locations. The results of
our testing are attached to the present letter report.
The range of fluctuations in groundwater elevations is consistent with expectations given
the general composition of overburden materials on site. Silty clay has a typical hydraulic
conductivity in the range of 1 x 10⁻⁷ to 1 x 10⁻⁹ m/sec, with the variability provided to account
for differences in compaction and majority composition of the material at a given location.
Similarly, the transmissivity of the soil, which is dependant on hydraulic conductivity, is also
low, resulting in a limited ability for water to travel through the clay. The result of these low
hydraulic properties is a minimal potential for groundwater elevation fluctuations, and an
elevated probability that surface water will remain at surface rather than infiltrate the low
permeability clay soils.
Based on the results of our falling head (slug) testing program, the soils below the
proposed founding elevation are considered to have adequately met the requirement for
a low permeability soil to be present below design underside of footing level for the subject
buildings where sump pumps are required.
2.0 Summary and Recommendations
These pre-development groundwater level readings recorded at our well cluster
locations (Table 1) should not be considered for design of footing level for the
proposed development due to the anticipated dewatering of the ‘perched’ water
within the upper portion of the silty clay deposit. This dewatering effect will occur once
development of the site has initiated and service pipe alignments are installed. Typically,
the recorded groundwater levels within the developed area are approximately located at
or below spring level of the adjacent storm sewer pipes. It is anticipated that this same
level of dewatering will occur within Summerside West, once service pipes have been
installed. It is further expected that the proposed building sump pumps will handle water
flows from precipitation events and during spring melt only, as per City guidelines.
patersongroup

Ms. Jillian NormandPage 5File: PG4049-LET.03
Based on the results of our groundwater review and observations within developed
sites over clay deposits, the proposed design underside of footing elevations should
be placed above the spring line of the storm service pipe for the subject site if sump
pumps are to be used within the residential dwellings.
It is further recommended that a post-development groundwater monitoring program be
initiated for the development. A series of monitoring wells should be installed adjacent to
foundations under construction to monitoring the dewatering activity, which occurs during
the construction period. Long-term monitoring wells can be installed in public right-of-ways
to further monitor the groundwater level lowering. Periodic reports summarizing
groundwater levels can be submitted for discussion purposes. Additional details can be
provided at a later date.
We trust the current submission meets your immediate requirements.
Paterson Group Inc.
May 25-2018
Michael Laflamme, GIT David J. Gilbert, P.Eng.
patersongroup

CLIENT:
CONTRACT NO.:
DATE SAMPLED:
SAMPLED BY:
Identification MC(%) LL PL PI Cc Cu
28.2
D100 D60 D30 D10
BH OR TP No.: BH46-18 LAB NO: 99000
2447591 Ontario IncDEPTH: 2.6' - 4.6' FILE NO: PG4049
14-Mar-18
DATE TESTED: 16-Mar-18PROJECT:
Summerside West PH. 4 &
5
DATE RECEIVED:
Paterson Group TESTED BY: D. Bertrand
22-Feb-18 DATE REPORTED: 19-Mar-18
Soil Classification
Gravel (%) Sand (%) Clay (%)
0.0 0.3
Comments
25.2 74.5
Silt (%)
���
����
����
����
����
����
����
���
���
����
�����
����� ���� ��� � �� ���
�
������������
� ������
� �� ��� ������ ������
������
� ��� ��
����
� ��������
��� �� ������ ������
������
� ������

CLIENT: DEPTH: FILE NO.: PG4049
PROJECT: BH OR TP No.: DATE SAMPLED: 22-Feb-18
LAB No. : TESTED BY: DATE RECEIVED: 14-Mar-18
SAMPLED BY: DATE REPT'D: DATE TESTED: 16-Mar-18
SAMPLE MASS
2.700
Tare No.
TARE Wt. 50.00 ACTUAL Wt.
AIR DRY (Wa) 150.00 100.00
OVEN DRY (Wo) 145.55 95.55
F=(Wo/Wa)
INITIAL Wt. (Ma)
Wt. CORRECTED
0.2
40 g / L
0.0
1 7:20 54.0 6.0 21.0 0.0355 99.3
2 7:21 53.5 6.0 21.0 0.0252 98.3
5 7:24 53.0 6.0 21.0 0.0161 97.2
15 7:34 52.0 6.0 21.0 0.0094 95.2
30 7:49 50.0 6.0 21.0 0.0068 91.0
60 8:19 48.0 6.0 21.0 0.0049 86.9
250 11:29 44.0 6.0 21.0 0.0025 78.6
1440 7:19 37.0 6.0 21.0 0.0011 64.1
2.0
Pan
0.850
0.425
63.0
53.0
37.5
26.5
19.0
16.0
13.2
9.5
4.75
WEIGHT RETAINED (g)
0.0
125.1
0.00
0.00
0.00
0.080.0
0.20
MAX = 0.3%
HYDROMETER DATA
0.0
0.0
0.0
100.0
100.0
100.0
100.0
0.2
0.3
99.8
99.7
0.250
0.106
0.075
Pan
SIEVE CHECK
0.13
SPECIFIC GRAVITY (Gs)
0.956
HYGROSCOPIC MOISTURE
PERCENT PASSING
SOLUTION CONCENTRATION
Wt. AFTER WASH BACK SIEVE
PERCENT RETAINEDSIEVE DIAMETER (mm)
HYDROMETER
LS-702 ASTM-422
2447591 Ontario Inc
Summerside West PH. 4 & 5
99000
2.6' - 4.6'
BH46-18
D. Bertrand
GRAIN SIZE ANALYSIS
Paterson Group
50.02
SAMPLE INFORMATION
REMARKS
47.79
50.02
125.1
19-Mar-18
REVIEWED BY: APPROVED BY:
Curtis Beadow Joe Forsyth, P. Eng.
Moisture Content = 28.2%
DIAMETER (P)ELAPSED
TIME
(24 hours)Hs Hc Temp. (
oC)
COMMENTS
TOTAL PERCENT PASSING
99.3
98.3
97.2
95.2
91.0
86.9
78.6
64.1
CLIENT:
CONTRACT NO.:
DATE SAMPLED:
SAMPLED BY:
Identification MC(%) LL PL PI Cc Cu
45.4
D100 D60 D30 D10
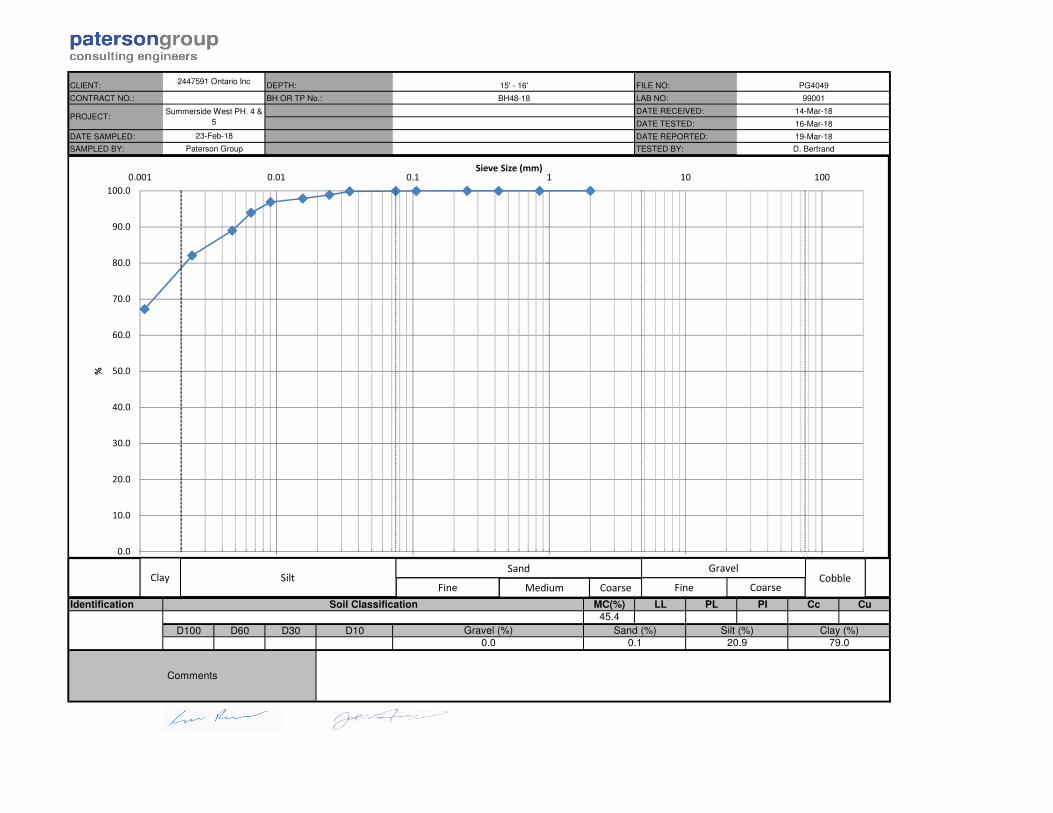
BH OR TP No.: BH48-18 LAB NO: 99001
2447591 Ontario IncDEPTH: 15' - 16' FILE NO: PG4049
14-Mar-18
DATE TESTED: 16-Mar-18PROJECT:
Summerside West PH. 4 &
5
DATE RECEIVED:
Paterson Group TESTED BY: D. Bertrand
23-Feb-18 DATE REPORTED: 19-Mar-18
Soil Classification
Gravel (%) Sand (%) Clay (%)
0.0 0.1
Comments
20.9 79.0
Silt (%)
���
����
����
����
����
����
����
���
���
����
�����
����� ���� ��� � �� ���
�
������������
� ������
� �� ��� ������ ������
������
� ��� ��
����
� ��������
��� �� ������ ������
������
� ������
CLIENT: DEPTH: FILE NO.: PG4049
PROJECT: BH OR TP No.: DATE SAMPLED: 23-Feb-18
LAB No. : TESTED BY: DATE RECEIVED: 14-Mar-18
SAMPLED BY: DATE REPT'D: DATE TESTED: 16-Mar-18
SAMPLE MASS
2.700
Tare No.
TARE Wt. 50.00 ACTUAL Wt.
AIR DRY (Wa) 150.00 100.00
OVEN DRY (Wo) 150.00 100.00
F=(Wo/Wa)
INITIAL Wt. (Ma)
Wt. CORRECTED
0.05
40 g / L
0.0
1 7:32 56.5 6.0 21.0 0.0344 99.9
2 7:33 56.0 6.0 21.0 0.0245 98.9
5 7:36 55.5 6.0 21.0 0.0156 97.9
15 7:46 55.0 6.0 21.0 0.0091 96.9
30 8:01 53.5 6.0 21.0 0.0065 93.9
60 8:31 51.0 6.0 21.0 0.0047 89.0
250 11:41 47.5 6.0 21.0 0.0024 82.1
1440 7:31 40.0 6.0 21.0 0.0011 67.2
2.0
Pan
0.850
0.425
63.0
53.0
37.5
26.5
19.0
16.0
13.2
9.5
4.75
WEIGHT RETAINED (g)
0.0
95.8
0.00
0.00
0.00
0.020.0
0.05
MAX = 0.3%
HYDROMETER DATA
0.0
0.0
0.0
100.0
100.0
100.0
100.0
0.0
0.1
100.0
99.9
0.250
0.106
0.075
Pan
SIEVE CHECK
0.03
SPECIFIC GRAVITY (Gs)
1.000
HYGROSCOPIC MOISTURE
PERCENT PASSING
SOLUTION CONCENTRATION
Wt. AFTER WASH BACK SIEVE
PERCENT RETAINEDSIEVE DIAMETER (mm)
HYDROMETER
LS-702 ASTM-422
2447591 Ontario Inc
Summerside West PH. 4 & 5
99001
15' - 16'
BH48-18
D. Bertrand
GRAIN SIZE ANALYSIS
Paterson Group
50.00
SAMPLE INFORMATION
REMARKS
50.00
50.00
95.8
19-Mar-18
REVIEWED BY: APPROVED BY:
Curtis Beadow Joe Forsyth, P. Eng.
Moisture Content = 45.4%
DIAMETER (P)ELAPSED
TIME
(24 hours)Hs Hc Temp. (
oC)
COMMENTS
TOTAL PERCENT PASSING
99.9
98.9
97.9
96.9
93.9
89.0
82.1
67.2

CLIENT:
CONTRACT NO.:
DATE SAMPLED:
SAMPLED BY:
Identification MC(%) LL PL PI Cc Cu
27.1
D100 D60 D30 D10
BH OR TP No.: BH413-18 LAB NO: 99002
2447591 Ontario IncDEPTH: 2.6' - 4.6' FILE NO: PG4049
14-Mar-18
DATE TESTED: 16-Mar-18PROJECT:
Summerside West PH. 4 &
5
DATE RECEIVED:
Paterson Group TESTED BY: D. Bertrand
23-Feb-18 DATE REPORTED: 19-Mar-18
Soil Classification
Gravel (%) Sand (%) Clay (%)
0.0 0.4
Comments
25.1 74.5
Silt (%)
���
����
����
����
����
����
����
���
���
����
�����
����� ���� ��� � �� ���
�
������������
� ������
� �� ��� ������ ������
������
� ��� ��
����
� ��������
��� �� ������ ������
������
� ������

CLIENT: DEPTH: FILE NO.: PG4049
PROJECT: BH OR TP No.: DATE SAMPLED: 23-Feb-18
LAB No. : TESTED BY: DATE RECEIVED: 14-Mar-18
SAMPLED BY: DATE REPT'D: DATE TESTED: 16-Mar-18
SAMPLE MASS
2.700
Tare No.
TARE Wt. 50.00 ACTUAL Wt.
AIR DRY (Wa) 150.00 100.00
OVEN DRY (Wo) 150.00 100.00
F=(Wo/Wa)
INITIAL Wt. (Ma)
Wt. CORRECTED
0.2
40 g / L
0.0
1 7:45 55.0 6.0 21.0 0.0351 96.9
2 7:46 54.0 6.0 21.0 0.0251 94.9
5 7:49 53.0 6.0 21.0 0.0161 92.9
15 7:59 51.0 6.0 21.0 0.0095 89.0
30 8:14 49.0 6.0 21.0 0.0069 85.0
60 8:44 47.0 6.0 21.0 0.0049 81.1
250 11:54 45.0 6.0 21.0 0.0025 77.1
1440 7:44 39.0 6.0 21.0 0.0011 65.2
2.0
Pan
0.850
0.425
63.0
53.0
37.5
26.5
19.0
16.0
13.2
9.5
4.75
WEIGHT RETAINED (g)
0.0
128
0.01
0.03
0.06
0.140.1
0.20
MAX = 0.3%
HYDROMETER DATA
0.0
0.0
0.1
100.0
100.0
99.9
99.9
0.3
0.4
99.7
99.6
0.250
0.106
0.075
Pan
SIEVE CHECK
0.19
SPECIFIC GRAVITY (Gs)
1.000
HYGROSCOPIC MOISTURE
PERCENT PASSING
SOLUTION CONCENTRATION
Wt. AFTER WASH BACK SIEVE
PERCENT RETAINEDSIEVE DIAMETER (mm)
HYDROMETER
LS-702 ASTM-422
2447591 Ontario Inc
Summerside West PH. 4 & 5
99002
2.6' - 4.6'
BH413-18
D. Bertrand
GRAIN SIZE ANALYSIS
Paterson Group
50.01
SAMPLE INFORMATION
REMARKS
50.01
50.01
128
19-Mar-18
REVIEWED BY: APPROVED BY:
Curtis Beadow Joe Forsyth, P. Eng.
Moisture Content = 27.1%
DIAMETER (P)ELAPSED
TIME
(24 hours)Hs Hc Temp. (
oC)
COMMENTS
TOTAL PERCENT PASSING
96.9
94.9
92.9
89.0
85.0
81.1
77.1
65.2

CLIENT:
CONTRACT NO.:
DATE SAMPLED:
SAMPLED BY:
Identification MC(%) LL PL PI Cc Cu
27.1
D100 D60 D30 D10
BH OR TP No.: BH416-18 LAB NO: 99003
2447591 Ontario IncDEPTH: 10' - 11' FILE NO: PG4049
14-Mar-18
DATE TESTED: 16-Mar-18PROJECT:
Summerside West PH. 4 &
5
DATE RECEIVED:
Paterson Group TESTED BY: D. Bertrand
23-Feb-18 DATE REPORTED: 19-Mar-18
Soil Classification
Gravel (%) Sand (%) Clay (%)
0.0 0.1
Comments
30.4 69.5
Silt (%)
���
����
����
����
����
����
����
���
���
����
�����
����� ���� ��� � �� ���
�
������������
� ������
� �� ��� ������ ������
������
� ��� ��
����
� ��������
��� �� ������ ������
������
� ������

CLIENT: DEPTH: FILE NO.: PG4049
PROJECT: BH OR TP No.: DATE SAMPLED: 23-Feb-18
LAB No. : TESTED BY: DATE RECEIVED: 14-Mar-18
SAMPLED BY: DATE REPT'D: DATE TESTED: 16-Mar-18
SAMPLE MASS
2.700
Tare No.
TARE Wt. 50.00 ACTUAL Wt.
AIR DRY (Wa) 150.00 100.00
OVEN DRY (Wo) 150.00 100.00
F=(Wo/Wa)
INITIAL Wt. (Ma)
Wt. CORRECTED
0.07
40 g / L
0.0
1 7:56 56.5 6.0 21.0 0.0344 99.8
2 7:57 56.0 6.0 21.0 0.0245 98.8
5 8:00 55.5 6.0 21.0 0.0156 97.9
15 8:10 55.0 6.0 21.0 0.0091 96.9
30 8:25 53.0 6.0 21.0 0.0066 92.9
60 8:55 50.0 6.0 21.0 0.0048 87.0
250 12:05 45.0 6.0 21.0 0.0025 77.1
1440 7:55 32.0 6.0 21.0 0.0012 51.4
2.0
Pan
0.850
0.425
63.0
53.0
37.5
26.5
19.0
16.0
13.2
9.5
4.75
WEIGHT RETAINED (g)
0.0
107.1
0.00
0.01
0.01
0.030.0
0.07
MAX = 0.3%
HYDROMETER DATA
0.0
0.0
0.0
100.0
100.0
100.0
100.0
0.1
0.1
99.9
99.9
0.250
0.106
0.075
Pan
SIEVE CHECK
0.04
SPECIFIC GRAVITY (Gs)
1.000
HYGROSCOPIC MOISTURE
PERCENT PASSING
SOLUTION CONCENTRATION
Wt. AFTER WASH BACK SIEVE
PERCENT RETAINEDSIEVE DIAMETER (mm)
HYDROMETER
LS-702 ASTM-422
2447591 Ontario Inc
Summerside West PH. 4 & 5
99003
10' - 11'
BH416-18
D. Bertrand
GRAIN SIZE ANALYSIS
Paterson Group
50.02
SAMPLE INFORMATION
REMARKS
50.02
50.02
107.1
19-Mar-18
REVIEWED BY: APPROVED BY:
Curtis Beadow Joe Forsyth, P. Eng.
Moisture Content = 41.1%
DIAMETER (P)ELAPSED
TIME
(24 hours)Hs Hc Temp. (
oC)
COMMENTS
TOTAL PERCENT PASSING
99.8
98.8
97.9
96.9
92.9
87.0
77.1
51.4

Report: PG4049-1
Project: PG4049 - Summerside West
Test Location: MW1B
Test: Falling Head
Date: May 11, 2018
Hvorslev Horizontal Hydraulic Conductivity Hvorslev Shape Factor
Valid for L>>D
Hvorslev Shape Factor F: 2.33409
Well Parameters:
L 1.52 m Saturated length of screen or open hole
D 0.0508 m Diameter of well
rc 0.0254 m Radius of well
Data Points (from plot):
t*: 346.591 minutes ΔH*/ΔH0: 0.37
Horizontal Hydraulic Conductivity
K = 4.15E-08 m/sec
Hvorslev Hydraulic Conductivity Analysis
0.001
0.010
0.100
1.000
0.00 100.00 200.00 300.00 400.00 500.00 600.00 700.00 800.00
ΔH
/ΔH
0
Time (min)
Semi-Log Drawdown vs. Time Plot for MW1B - Falling Head Test
0
2*
ln*
1
H
H
tF
rK c
D
L
LF
2ln
2
patersongroup
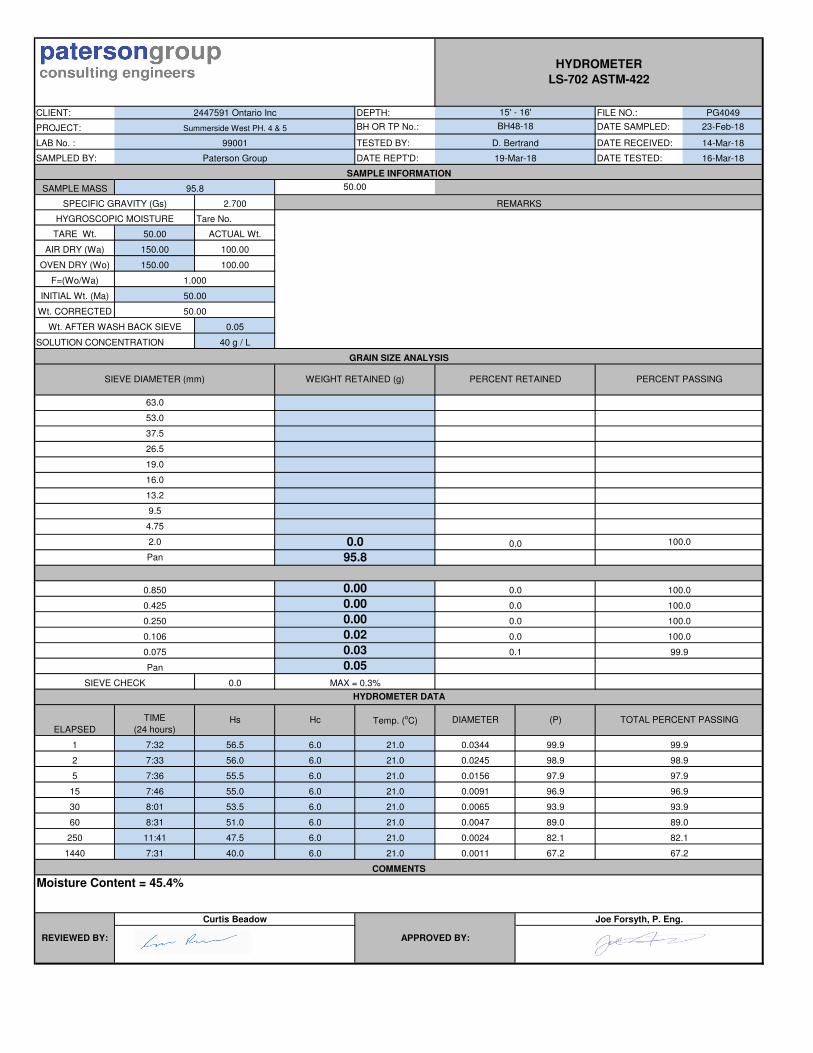
Report: PG4049-1
Project: PG4049 - Summerside West
Test Location: MW2B
Test: Falling Head
Date: May 16, 2018
Hvorslev Horizontal Hydraulic Conductivity Hvorslev Shape Factor
Valid for L>>D
Hvorslev Shape Factor F: 2.33409
Well Parameters:
L 1.52 m Saturated length of screen or open hole
D 0.0508 m Diameter of well
rc 0.0254 m Radius of well
Data Points (from plot):
t*: 28.386 minutes ΔH*/ΔH0: 0.37
Horizontal Hydraulic Conductivity
K = 5.07E-07 m/sec
Hvorslev Hydraulic Conductivity Analysis
0.001
0.010
0.100
1.000
0.00 10.00 20.00 30.00 40.00 50.00 60.00 70.00 80.00
ΔH
/ΔH
0
Time (min)
Semi-Log Drawdown vs. Time Plot for MW2B - Falling Head Test
0
2*
ln*
1
H
H
tF
rK c
D
L
LF
2ln
2
patersongroup

Report: PG4049-1
Project: PG4049 - Summerside West
Test Location: MW3B
Test: Falling Head
Date: May 16, 2018
Hvorslev Horizontal Hydraulic Conductivity Hvorslev Shape Factor
Valid for L>>D
Hvorslev Shape Factor F: 2.33409
Well Parameters:
L 1.52 m Saturated length of screen or open hole
D 0.0508 m Diameter of well
rc 0.0254 m Radius of well
Data Points (from plot):
t*: 563.204 minutes ΔH*/ΔH0: 0.37
Horizontal Hydraulic Conductivity
K = 2.55E-08 m/sec
Hvorslev Hydraulic Conductivity Analysis
0.001
0.010
0.100
1.000
0.00 200.00 400.00 600.00 800.00 1000.00 1200.00 1400.00
ΔH
/ΔH
0
Time (min)
Semi-Log Drawdown vs. Time Plot for MW3B - Falling Head Test
0
2*
ln*
1
H
H
tF
rK c
D
L
LF
2ln
2
patersongroup

Report: PG4049-1
Project: PG4049 - Summerside West
Test Location: MW4B
Test: Falling Head
Date: May 16, 2018
Hvorslev Horizontal Hydraulic Conductivity Hvorslev Shape Factor
Valid for L>>D
Hvorslev Shape Factor F: 2.33409
Well Parameters:
L 1.52 m Saturated length of screen or open hole
D 0.0508 m Diameter of well
rc 0.0254 m Radius of well
Data Points (from plot):
t*: 1085.013 minutes ΔH*/ΔH0: 0.37
Horizontal Hydraulic Conductivity
K = 1.33E-08 m/sec
Hvorslev Hydraulic Conductivity Analysis
0.001
0.010
0.100
1.000
0.00 500.00 1000.00 1500.00 2000.00 2500.00 3000.00
ΔH
/ΔH
0
Time (min)
Semi-Log Drawdown vs. Time Plot for MW4B - Falling Head Test
0
2*
ln*
1
H
H
tF
rK c
D
L
LF
2ln
2
patersongroup

Report: PG4049-1
Project: PG4049 - Summerside West
Test Location: MW5B
Test: Falling Head
Date: May 11, 2018
Hvorslev Horizontal Hydraulic Conductivity Hvorslev Shape Factor
Valid for L>>D
Hvorslev Shape Factor F: 2.33409
Well Parameters:
L 1.52 m Saturated length of screen or open hole
D 0.0508 m Diameter of well
rc 0.0254 m Radius of well
Data Points (from plot):
t*: 1063.982 minutes ΔH*/ΔH0: 0.37
Horizontal Hydraulic Conductivity
K = 1.35E-08 m/sec
Hvorslev Hydraulic Conductivity Analysis
0.010
0.100
1.000
0.00 500.00 1000.00 1500.00 2000.00
ΔH
/ΔH
0
Time (min)
Semi-Log Drawdown vs. Time Plot for MW5B - Falling Head Test
0
2*
ln*
1
H
H
tF
rK c
D
L
LF
2ln
2
patersongroup

Report: PG4049-1
Project: PG4049 - Summerside West
Test Location: MW6B
Test: Falling Head
Date: May 16, 2018
Hvorslev Horizontal Hydraulic Conductivity Hvorslev Shape Factor
Valid for L>>D
Hvorslev Shape Factor F: 2.33409
Well Parameters:
L 1.52 m Saturated length of screen or open hole
D 0.0508 m Diameter of well
rc 0.0254 m Radius of well
Data Points (from plot):
t*: 9.260 minutes ΔH*/ΔH0: 0.37
Horizontal Hydraulic Conductivity
K = 1.55E-06 m/sec
Hvorslev Hydraulic Conductivity Analysis
0.001
0.010
0.100
1.000
0.00 5.00 10.00 15.00 20.00 25.00
ΔH
/ΔH
0
Time (min)
Semi-Log Drawdown vs. Time Plot for MW6B - Falling Head Test
0
2*
ln*
1
H
H
tF
rK c
D
L
LF
2ln
2
patersongroup

Report: PG4049-1
Project: PG4049 - Summerside West
Test Location: MW7B
Test: Falling Head
Date: May 11, 2018
Hvorslev Horizontal Hydraulic Conductivity Hvorslev Shape Factor
Valid for L>>D
Hvorslev Shape Factor F: 2.33409
Well Parameters:
L 1.52 m Saturated length of screen or open hole
D 0.0508 m Diameter of well
rc 0.0254 m Radius of well
Data Points (from plot):
t*: 283.934 minutes ΔH*/ΔH0: 0.37
Horizontal Hydraulic Conductivity
K = 5.07E-08 m/sec
Hvorslev Hydraulic Conductivity Analysis
0.001
0.010
0.100
1.000
0.00 200.00 400.00 600.00 800.00 1000.00 1200.00
ΔH
/ΔH
0
Time (min)
Semi-Log Drawdown vs. Time Plot for MW7B - Falling Head Test
0
2*
ln*
1
H
H
tF
rK c
D
L
LF
2ln
2
patersongroup