P&G Beats First Quarter Earnings Expectations on Record Volume and Sales
13
News Release The Procter & Gamble Company One P&G Plaza Cincinnati, OH 45202 FOR IMMEDIATE RELEASE P&G BEATS FIRST QUARTER EARNINGS EXPECTATIONS ON RECORD VOLUME AND SALES CINCINNATI, Oct. 27, 2003 – The Procter & Gamble Company (NYSE:PG) today announced excellent top line results and double-digit earnings growth for the July-September quarter, beating analysts’ consensus earnings expectations. Volume and sales results were a new record. “We’re off to a very strong start this year. Business strength is broad based across leading brands, top countries and top customers,” said Chairman of the Board, President and Chief Executive A. G. Lafley. “We’re delivering strong sales growth and strong gross margin improvement, which enabled investments in new products like Olay Regenerist® and Prilosec OTC®. Strong first quarter results give us confidence we will again deliver our fiscal year target of double-digit earnings per share growth.” For the quarter ended Sept. 30, 2003, the company achieved double-digit volume, sales and earnings growth against strong base period comparisons. Unit volume increased 12 percent, including the impact of the recently completed acquisition of Wella AG. Organic volume, which excludes the impact of acquisitions and divestitures from year-over-year comparisons, increased nine percent. Health care led the business segments with unit volume growth of 23 percent; developing markets posted double-digit volume growth. Net sales increased 13 percent to $12.20 billion. Foreign exchange had a positive impact of three percent, which was partially offset by pricing investments and mix effects, primarily from higher than expected growth in developing markets and continued portfolio expansion into mid-tier brands. Organic sales – excluding acquisitions and divestitures and the impact of foreign exchange from year-over-year comparisons – increased seven percent. This
-
Upload
finance3 -
Category
Economy & Finance
-
view
496 -
download
0
Transcript of P&G Beats First Quarter Earnings Expectations on Record Volume and Sales

News Release
The Procter & Gamble Company One P&G Plaza Cincinnati, OH 45202
FOR IMMEDIATE RELEASE
P&G BEATS FIRST QUARTER EARNINGS EXPECTATIONS ON
RECORD VOLUME AND SALES
CINCINNATI, Oct. 27, 2003 – The Procter & Gamble Company (NYSE:PG) today
announced excellent top line results and double-digit earnings growth for the July-September
quarter, beating analysts’ consensus earnings expectations. Volume and sales results were a
new record.
“We’re off to a very strong start this year. Business strength is broad based across
leading brands, top countries and top customers,” said Chairman of the Board, President and
Chief Executive A. G. Lafley. “We’re delivering strong sales growth and strong gross margin
improvement, which enabled investments in new products like Olay Regenerist® and Prilosec
OTC®. Strong first quarter results give us confidence we will again deliver our fiscal year target
of double-digit earnings per share growth.”
For the quarter ended Sept. 30, 2003, the company achieved double-digit volume, sales
and earnings growth against strong base period comparisons. Unit volume increased 12
percent, including the impact of the recently completed acquisition of Wella AG. Organic
volume, which excludes the impact of acquisitions and divestitures from year-over-year
comparisons, increased nine percent. Health care led the business segments with unit volume
growth of 23 percent; developing markets posted double-digit volume growth.
Net sales increased 13 percent to $12.20 billion. Foreign exchange had a positive
impact of three percent, which was partially offset by pricing investments and mix effects,
primarily from higher than expected growth in developing markets and continued portfolio
expansion into mid-tier brands. Organic sales – excluding acquisitions and divestitures and the
impact of foreign exchange from year-over-year comparisons – increased seven percent. This

2
solid growth reflects the combination of base business growth, strong innovation and the
expansion of developing market businesses.
For the quarter, net earnings grew 20 percent to $1.76 billion. Earnings growth was
primarily driven by volume, the absence of restructuring program charges due to its completion
last year – $113 million in July-September 2002 – and lower manufacturing costs. This was
partially offset by marketing investments to support base business growth and new initiatives.
Net earnings increased 12 percent when compared to core net earnings in the base period,
which excludes restructuring program charges.
Net earnings per share increased 21 percent to $1.26. When compared to core results
for the base period, net earnings per share grew 13 percent. The Wella acquisition did not have
a significant impact on net earnings, consistent with earlier guidance.
Key Financial Highlights
• Gross margin expanded 260 basis points. Excluding restructuring charges in the prior
period of $88 million, gross margin expanded 180 basis points driven by the scale effect of
volume and base business cost savings.
• Marketing, Research, Administrative and Other Costs (MRA&O) as a percentage of net
sales increased 110 basis points. Excluding restructuring charges in the base period of $63
million, MRA&O as a percentage of net sales increased 170 basis points. This primarily
reflects investments behind the base business and in support of initiatives such as Prilosec
OTC®, Crest Whitestrips® and Night Effects®, Olay Regenerist® and Swiffer®.
Approximately one third of the basis point increase is due to Wella. This reflects the current
ratio of marketing expenses to sales and initial post-acquisition costs. MRA&O also was
impacted by costs associated with on-going actions to maintain a competitive cost structure
(for example, organizational streamlining).
• The company’s operating cash flow for the quarter was $1.61 billion versus $2.01 billion for
the base period. The change in operating cash flow was driven by increases in working
capital largely due to a number of short term impacts, such as initiative-related activities.
Operating cash flow was also lower due to one-time impacts in the base period, including
joint venture dividends. Capital spending as a percent of sales was three percent – a slight

3
increase versus prior year, but still well below target levels. Free cash flow, defined as
operating cash flow less capital expenditures, was $1.24 billion.
• In September, the company completed the previously announced agreement to acquire a
majority ownership position in Wella AG. The company closed the purchase agreement with
the majority shareholders and completed the purchase of shares through the tender offer
launched in April 2003. P&G now owns 99 percent of Wella’s outstanding voting shares and
81 percent of outstanding registered shares.
Business Segment Discussion
The following provides perspective on the company’s July-September results by
business segment.
• Fabric and home care delivered record volume, sales and profit. Volume was up eight
percent behind strong growth in fabric care in the developing regions and double-digit
growth in global home care. The continued success of the Swiffer WetJet® and Duster®,
Dawn Complete® and Dawn Power Dissolver®, and Febreze Anti-Allergen® initiatives were
key contributors to the home care growth. Net sales increased eight percent to $3.39 billion.
Three percent positive foreign exchange was offset by mix and pricing effects. Double-digit
growth in developing geographies, including the expansion of Tide® in China, and the
continuing expansion of mid-tier brands, including the growth of Bold® in Japan, resulted in
negative mix impact on sales of two percent. Net earnings increased to $562 million – three
percent growth against a very strong base period comparison of 22 percent growth. Mix
impacts and increased marketing investments to support product initiatives also impacted
earnings growth rates. Fabric and home care earnings growth is expected to improve over
the remainder of the fiscal year.
• Beauty care posted strong double-digit earnings growth. Volume increased 21 percent,
including the benefit from acquisitions and divestitures, primarily Wella. Excluding
acquisitions and divestitures, beauty care volume increased eight percent. Net sales
increased 20 percent to $3.75 billion, including a positive foreign exchange impact of three
percent. Negative mix of three percent was driven by the impact of Wella and developing
market growth. Organic sales, which exclude acquisitions and divestitures and foreign
exchange impacts, increased six percent despite heavy competitive activity in North

4
America. The solid base business results were driven by continued global strength of the
Pantene®, Head & Shoulders®, Always/Whisper® and Olay® brands. Net earnings for
beauty care increased 12 percent to $616 million driven by volume growth and lower
manufacturing costs. Marketing spending increased to support initiatives, including Pantene
Daily Moisture Renewal® in Japan, the expansion of Olay Regenerist® and continued
support of Tampax Pearl®, as well as defense against competitive entries in the hair care
and skin care categories.
• Baby and family care delivered very strong results this quarter with robust volume, sales and
earnings growth. Unit volume increased six percent, driven primarily by baby care. Baby
care volume growth was driven by continued momentum in the Baby Stages of
Development® line in Western Europe and North America, growth in Japan, and broadening
of the diaper product line in Latin America. Net sales grew seven percent to $2.61 billion,
including a positive foreign exchange impact of three percent, partially offset by pricing
investments of one percent and mix of one percent. Pricing was driven by continued high
competitive promotional activity in North America family care. Earnings increased 22
percent to $295 million, reflecting strong volume growth and lower costs.
• Health care delivered outstanding volume, sales and earnings growth. Volume growth of 23
percent was driven by the Prilosec OTC® launch in September, the continued success of
Actonel®, Crest Whitestrips® and Night Effects® and base business strength across
multiple categories. Net sales increased 23 percent to $1.73 billion as volume growth and a
positive three percent foreign exchange impact were offset by mix and pricing, primarily on
Crest Whitestrips taken in November 2002. Even without the Prilosec OTC launch, health
care delivered double-digit volume, sales and earnings growth. Net earnings increased 41
percent to $276 million on strong volume, sales and margin expansion. While double-digit
top line growth is expected for the fiscal year, results in the remaining quarters are expected
to return to consumption levels following the one-time pipeline impact from Prilosec OTC.
• Snacks & Beverages delivered strong sales and earnings progress behind solid top line
growth. Volume was up three percent. Both Pringles® and Folgers® delivered solid growth
in the quarter. Net sales were $896 million, an increase of nine percent, including a three
percent impact from foreign exchange and price and mix impact of three percent. Positive
pricing includes a partial pass-through of higher commodity costs. For the balance of the
fiscal year, the company expects pricing will have a neutral or slightly negative impact on
5
sales based on the aggressive pricing environment of the coffee category. Net earnings
increased 20 percent to $109 million behind volume and sales growth and margin expansion
due to base business savings.
October – December Quarter and Fiscal Year Guidance
For the December quarter, the company expects total sales to increase 14 to 19 percent.
Organic sales are expected to grow five to eight percent versus year-ago. Organic sales
exclude the impacts of acquisitions and divestitures and foreign exchange from year-over-year
comparisons. The Wella acquisition is expected to add sales growth of six to seven percent.
Foreign exchange is expected to add three to four percent to sales growth. Pricing and mix is
expected to have about a negative one percent impact on total sales growth.
The company confirmed it is comfortable with the current range of analysts’ earnings
estimates, despite the fact that the Wella acquisition is expected to be slightly dilutive on the
quarter.
For the fiscal year, total sales are expected to increase by 13 to 16 percent. Organic
sales are expected to increase five to seven percent. Wella is expected to add sales growth of
six to seven percent. At current rates, foreign exchange is expected to have a positive two
percent impact on sales, while pricing and mix will combine for a negative one percent impact.
Diluted net earnings per share are expected to increase in-line with analysts’ current
consensus estimate.
Non-GAAP Measures
All references to "core" financial measures contained in this news release exclude
restructuring charges from base period results. The restructuring program began in 1999 as
part of the company’s Organization 2005 initiative and was substantially completed at the end of
fiscal year 2003. The company believes investors gain additional perspective of underlying
business trends and results by providing a measure of earnings excluding restructuring charges.
The attached income statement provides a reconciliation of the restructuring charges in the
base period to the most comparable GAAP measure. A historical reconciliation of reported-to-
core financials during the Organization 2005 initiative is available on the company’s website at

6
www.pg.com/investor. Going forward, the company will continue to conduct projects consistent
with the focus of productivity improvement and margin expansion. Charges associated with
these future projects will be absorbed in normal operating costs. Additionally, the company
provides organic volume and organic sales growth, which exclude the impact of acquisitions and
divestitures and foreign exchange from year-over-year comparisons. The company believes
this provides investors with a more complete understanding of underlying results and trends of
the base businesses.
FORWARD-LOOKING STATEMENTS
All statements, other than statements of historical fact included in this release, are
forward-looking statements, as that term is defined in the Private Securities Litigation Reform
Act of 1995. In addition to the risks and uncertainties noted in this release, there are certain
factors that could cause actual results to differ materially from those anticipated by some of the
statements made. These include: (1) the ability to achieve business plans, including growing
existing sales and volume profitably despite high levels of competitive activity, especially with
respect to the product categories and geographical markets (including developing markets) in
which the company has chosen to focus; (2) successfully executing, managing and integrating
key acquisitions (including Wella) and completing planned divestitures (including the potential
divestiture of the company’s juice business), (3) the ability to manage and maintain key
customer relationships; (4) the ability to maintain key manufacturing and supply sources
(including sole supplier and plant manufacturing sources); (5) the ability to successfully manage
regulatory, tax and legal matters (including product liability matters), and to resolve pending
matters within current estimates; (6) the ability to successfully implement, achieve and sustain
cost improvement plans in manufacturing and overhead areas, including successful completion
of the company’s outsourcing projects; (7) the ability to successfully manage currency (including
currency issues in volatile countries), interest rate and certain commodity cost exposures; (8)
the ability to manage the continued global political and/or economic uncertainty, especially in
the company’s significant geographical markets, as well as any political and/or economic
uncertainty due to terrorist activities; and (9) the ability to successfully manage increases in the
prices of raw materials used to make the company’s products. If the company's assumptions
and estimates are incorrect or do not come to fruition, or if the company does not achieve all of
these key factors, then the company's actual results might differ materially from the forward-
looking statements made herein. For additional information concerning factors that could cause
7
actual results to materially differ from those projected herein, please refer to our most recent 10-
K, 10-Q and 8-K reports.
About Procter & Gamble Two billion times a day, P&G brands touch the lives of people around the world. The
company has one of the largest and strongest portfolios of trusted, quality brands, including
Pampers®, Tide®, Ariel®, Always®, Whisper®, Pantene®, Bounty®, Pringles®, Folgers®,
Charmin®, Downy®, Lenor®, Iams®, Crest®, Actonel®, Olay® and Clairol Nice ‘n Easy®. The
P&G community consists of nearly 98,000 employees working in almost 80 countries worldwide.
Please visit www.pg.com for the latest news and in-depth information about P&G and its brands.
# # #
P&G Contacts: Media
P&G Corporate Media Center:
US media call: 1-(866) PROCTER (1-866-776-2837)
Media outside the US call: +1-(513) 945-9087
Investor Relations
John P. Goodwin - (513) 983-2414
P&G will webcast its conference call on Monday, Oct. 27, 2003, at 8:30 a.m. ET to
review its first quarter 2003/04 results. The call will last approximately one hour. You may
receive the webcast by going to our web site at: http://www.pg.com/investors
We suggest you check in at least ten minutes in advance of the start time to complete
the brief registration process and ensure you are set up to receive the webcast.
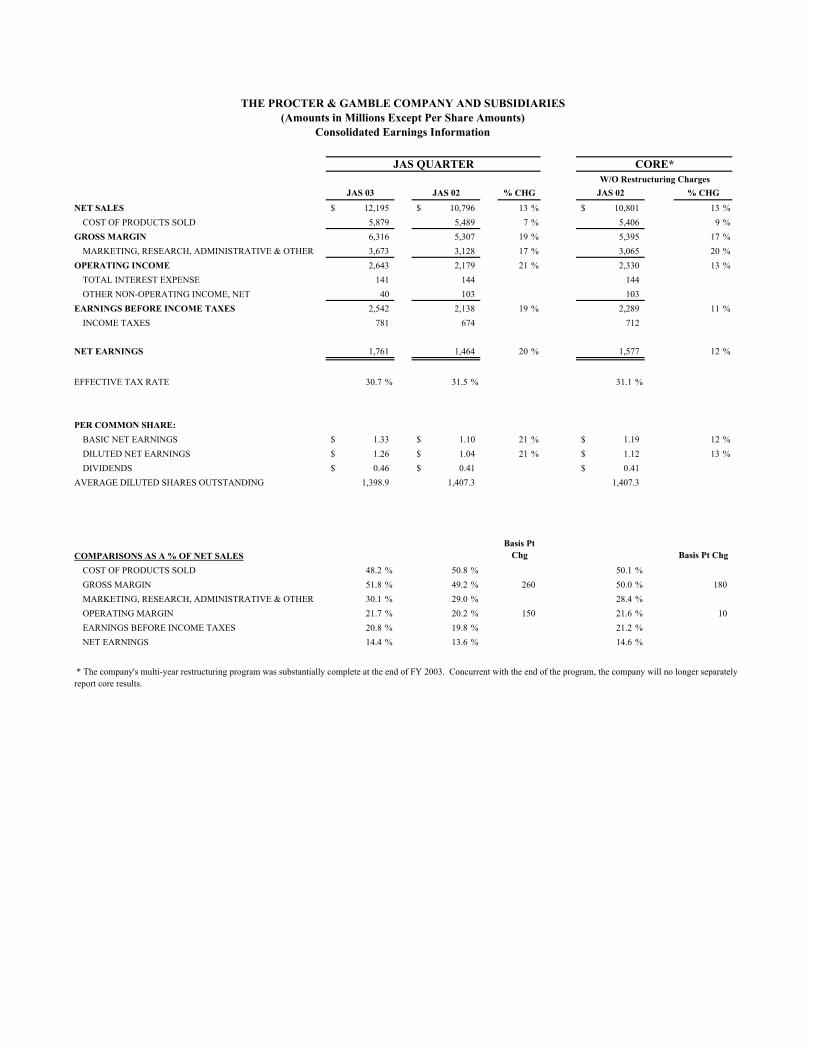
JAS 03 JAS 02 % CHG JAS 02 % CHG
NET SALES 12,195$ 10,796$ 13 % 10,801$ 13 % COST OF PRODUCTS SOLD 5,879 5,489 7 % 5,406 9 %
GROSS MARGIN 6,316 5,307 19 % 5,395 17 % MARKETING, RESEARCH, ADMINISTRATIVE & OTHER 3,673 3,128 17 % 3,065 20 %
OPERATING INCOME 2,643 2,179 21 % 2,330 13 % TOTAL INTEREST EXPENSE 141 144 144 OTHER NON-OPERATING INCOME, NET 40 103 103
EARNINGS BEFORE INCOME TAXES 2,542 2,138 19 % 2,289 11 % INCOME TAXES 781 674 712
NET EARNINGS 1,761 1,464 20 % 1,577 12 %
EFFECTIVE TAX RATE 30.7 % 31.5 % 31.1 %
PER COMMON SHARE:BASIC NET EARNINGS 1.33$ 1.10$ 21 % 1.19$ 12 % DILUTED NET EARNINGS 1.26$ 1.04$ 21 % 1.12$ 13 % DIVIDENDS 0.46$ 0.41$ 0.41$
AVERAGE DILUTED SHARES OUTSTANDING 1,398.9 1,407.3 1,407.3
COMPARISONS AS A % OF NET SALESBasis Pt
Chg Basis Pt Chg
COST OF PRODUCTS SOLD 48.2 % 50.8 % 50.1 % GROSS MARGIN 51.8 % 49.2 % 260 50.0 % 180 MARKETING, RESEARCH, ADMINISTRATIVE & OTHER 30.1 % 29.0 % 28.4 % OPERATING MARGIN 21.7 % 20.2 % 150 21.6 % 10 EARNINGS BEFORE INCOME TAXES 20.8 % 19.8 % 21.2 % NET EARNINGS 14.4 % 13.6 % 14.6 %
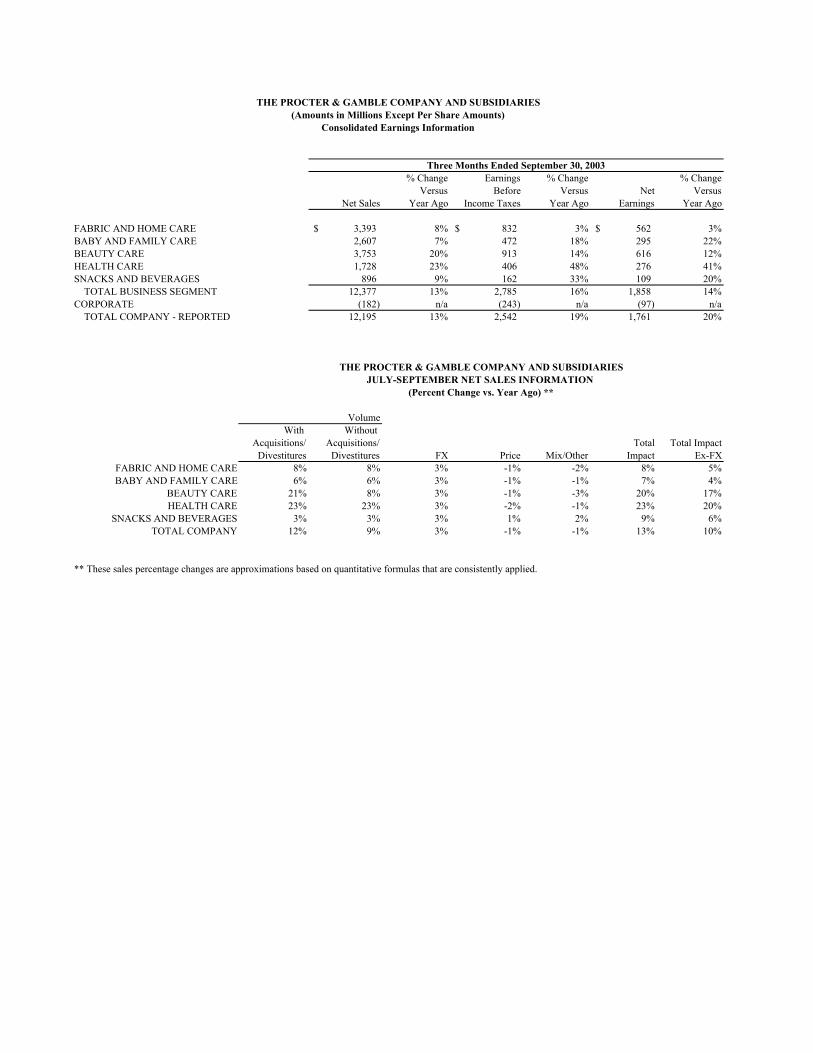
THE PROCTER & GAMBLE COMPANY AND SUBSIDIARIES(Amounts in Millions Except Per Share Amounts)
Consolidated Earnings Information
* The company's multi-year restructuring program was substantially complete at the end of FY 2003. Concurrent with the end of the program, the company will no longer separately report core results.
W/O Restructuring ChargesCORE*JAS QUARTER
% Change Earnings % Change % Change Versus Before Versus Net Versus
Net Sales Year Ago Income Taxes Year Ago Earnings Year Ago
FABRIC AND HOME CARE 3,393$ 8% 832$ 3% 562$ 3%BABY AND FAMILY CARE 2,607 7% 472 18% 295 22%BEAUTY CARE 3,753 20% 913 14% 616 12%HEALTH CARE 1,728 23% 406 48% 276 41%SNACKS AND BEVERAGES 896 9% 162 33% 109 20% TOTAL BUSINESS SEGMENT 12,377 13% 2,785 16% 1,858 14%CORPORATE (182) n/a (243) n/a (97) n/a TOTAL COMPANY - REPORTED 12,195 13% 2,542 19% 1,761 20%
With Without Acquisitions/ Acquisitions/ Total Total Impact
Divestitures Divestitures FX Price Mix/Other Impact Ex-FXFABRIC AND HOME CARE 8% 8% 3% -1% -2% 8% 5%BABY AND FAMILY CARE 6% 6% 3% -1% -1% 7% 4%
BEAUTY CARE 21% 8% 3% -1% -3% 20% 17%HEALTH CARE 23% 23% 3% -2% -1% 23% 20%
SNACKS AND BEVERAGES 3% 3% 3% 1% 2% 9% 6% TOTAL COMPANY 12% 9% 3% -1% -1% 13% 10%
(Percent Change vs. Year Ago) **
** These sales percentage changes are approximations based on quantitative formulas that are consistently applied.
Volume
THE PROCTER & GAMBLE COMPANY AND SUBSIDIARIES(Amounts in Millions Except Per Share Amounts)
Consolidated Earnings Information
Three Months Ended September 30, 2003
THE PROCTER & GAMBLE COMPANY AND SUBSIDIARIESJULY-SEPTEMBER NET SALES INFORMATION

2003 2002OPERATING ACTIVITIES NET EARNINGS 1,761$ 1,464$ DEPRECIATION AND AMORTIZATION 407 410 DEFERRED INCOME TAXES 108 142 CHANGES IN: ACCOUNTS RECEIVABLE (295) (44) INVENTORIES (174) (105) ACCOUNTS PAYABLE, ACCRUED AND OTHER LIABILITIES (76) (15) OTHER OPERATING ASSETS & LIABILITIES (57) 65 OTHER (68) 93
TOTAL OPERATING ACTIVITIES 1,606 2,010
CAPITAL EXPENDITURES (364) (281)
FREE CASH FLOW BEFORE DIVIDENDS 1,242$ 1,729$
Sept 30, 2003 June 30, 2003
CASH AND CASH EQUIVALENTS 4,049$ 5,912$ INVESTMENTS SECURITIES 330 300 ACCOUNTS RECEIVABLE 4,134 3,038 TOTAL INVENTORIES 4,536 3,640 OTHER 2,624 2,330 TOTAL CURRENT ASSETS 15,673 15,220
NET PROPERTY, PLANT AND EQUIPMENT 13,654 13,104 NET GOODWILL AND OTHER INTANGIBLE ASSETS 19,288 13,507 OTHER NON-CURRENT ASSETS 1,881 1,875
TOTAL ASSETS 50,496$ 43,706$
ACCOUNTS PAYABLE 2,957$ 2,795$ ACCRUED AND OTHER LIABILITIES 5,986 5,512 TAXES PAYABLE 2,583 1,879 DEBT DUE WITHIN ONE YEAR 5,286 2,172 TOTAL CURRENT LIABILITIES 16,812 12,358
LONG-TERM DEBT 11,993 11,475 OTHER 4,320 3,687 TOTAL LIABILITIES 33,125 27,520
TOTAL SHAREHOLDERS' EQUITY 17,371 16,186
TOTAL LIABILITIES & SHAREHOLDERS' EQUITY 50,496$ 43,706$
Consolidated Balance Sheet Information
THE PROCTER & GAMBLE COMPANY AND SUBSIDIARIES
Three Months Ended September 30
THE PROCTER & GAMBLE COMPANY AND SUBSIDIARIES(Amounts in Millions)
(Amounts in Millions)
Consolidated Cash Flows Information

The Procter & Gamble Company and Subsidiaries In accordance with the SEC’s Regulation G, the following provides definitions of the non-GAAP measures used in the earnings release and the reconciliation to the most closely related GAAP measure. Organic Unit Volume Growth Measures unit volume growth excluding the impact due to acquisitions and divestitures in year-over-year comparisons.
July – September Total Volume Growth 12% Less: Volume due to Acquisitions/Divestitures 3% Organic Unit Volume Growth 9%
Organic Sales Growth Measures sales growth excluding the impact of acquisitions and divestitures and the impact of foreign exchange in year-over-year comparisons.
July – September Total Sales Growth 13% Less: Foreign Exchange Impact 3%
Less: Sales due to Acquisitions/Divestitures 3% Organic Sales Growth 7%
Free Cash Flow Free cash flow is defined as: operating cash flow less capital spending. The Company views free cash flow as an important measure because it indicates the amount of cash available for discretionary investment.
Operating Capital Free
($MM) Cash Flow Spending Cash Flow JAS ‘02 2,010 281 1,729
JAS ‘03 1,606 364 1,242
Free Cash Flow Productivity Free cash flow productivity is defined as: free cash flow divided by net earnings.
Free Net Free Cash Flow ($MM) Cash Flow Earnings Productivity
JAS ’02 1,729 1,464 118% JAS ’03 1,242 1,761 71%
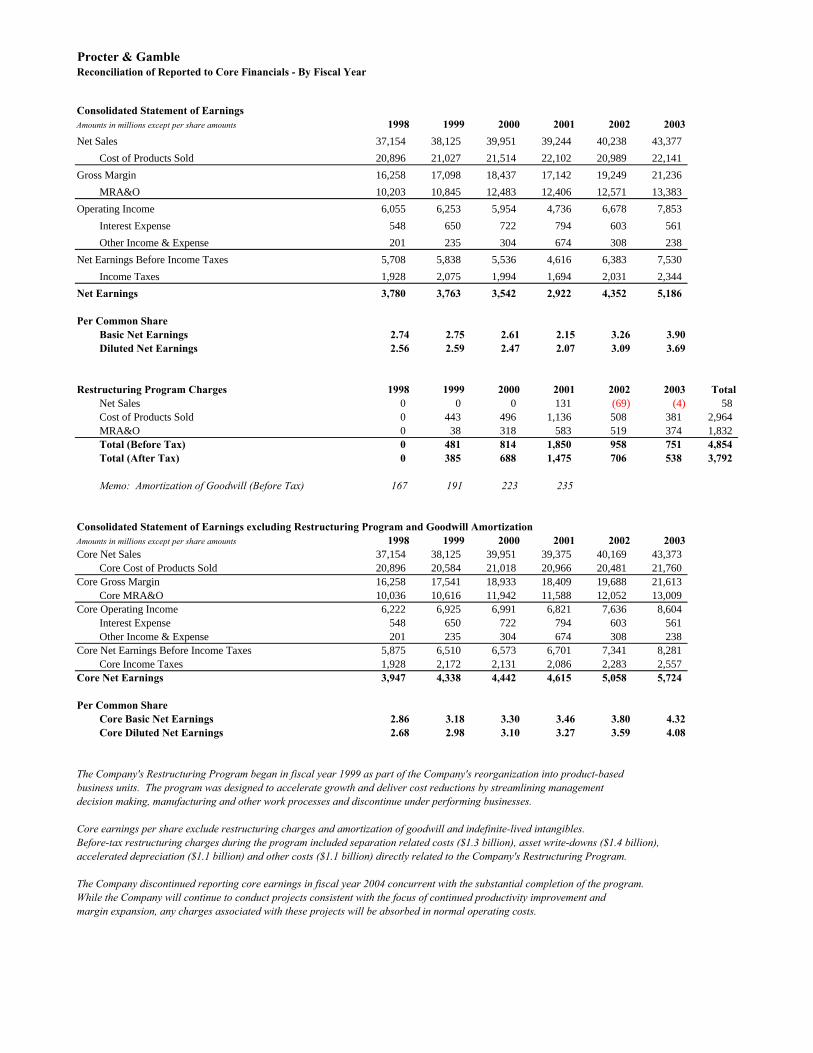
Procter & Gamble Reconciliation of Reported to Core Financials - By Fiscal Year
Consolidated Statement of Earnings Amounts in millions except per share amounts 1998 1999 2000 2001 2002 2003
Net Sales 37,154 38,125 39,951 39,244 40,238 43,377
Cost of Products Sold 20,896 21,027 21,514 22,102 20,989 22,141
Gross Margin 16,258 17,098 18,437 17,142 19,249 21,236
MRA&O 10,203 10,845 12,483 12,406 12,571 13,383
Operating Income 6,055 6,253 5,954 4,736 6,678 7,853
Interest Expense 548 650 722 794 603 561
Other Income & Expense 201 235 304 674 308 238
Net Earnings Before Income Taxes 5,708 5,838 5,536 4,616 6,383 7,530
Income Taxes 1,928 2,075 1,994 1,694 2,031 2,344
Net Earnings 3,780 3,763 3,542 2,922 4,352 5,186
Per Common ShareBasic Net Earnings 2.74 2.75 2.61 2.15 3.26 3.90Diluted Net Earnings 2.56 2.59 2.47 2.07 3.09 3.69
Restructuring Program Charges 1998 1999 2000 2001 2002 2003 TotalNet Sales 0 0 0 131 (69) (4) 58Cost of Products Sold 0 443 496 1,136 508 381 2,964MRA&O 0 38 318 583 519 374 1,832Total (Before Tax) 0 481 814 1,850 958 751 4,854Total (After Tax) 0 385 688 1,475 706 538 3,792
Memo: Amortization of Goodwill (Before Tax) 167 191 223 235
Consolidated Statement of Earnings excluding Restructuring Program and Goodwill AmortizationAmounts in millions except per share amounts 1998 1999 2000 2001 2002 2003Core Net Sales 37,154 38,125 39,951 39,375 40,169 43,373
Core Cost of Products Sold 20,896 20,584 21,018 20,966 20,481 21,760Core Gross Margin 16,258 17,541 18,933 18,409 19,688 21,613
Core MRA&O 10,036 10,616 11,942 11,588 12,052 13,009Core Operating Income 6,222 6,925 6,991 6,821 7,636 8,604
Interest Expense 548 650 722 794 603 561Other Income & Expense 201 235 304 674 308 238
Core Net Earnings Before Income Taxes 5,875 6,510 6,573 6,701 7,341 8,281Core Income Taxes 1,928 2,172 2,131 2,086 2,283 2,557
Core Net Earnings 3,947 4,338 4,442 4,615 5,058 5,724
Per Common ShareCore Basic Net Earnings 2.86 3.18 3.30 3.46 3.80 4.32Core Diluted Net Earnings 2.68 2.98 3.10 3.27 3.59 4.08
The Company's Restructuring Program began in fiscal year 1999 as part of the Company's reorganization into product-basedbusiness units. The program was designed to accelerate growth and deliver cost reductions by streamlining management decision making, manufacturing and other work processes and discontinue under performing businesses.
Core earnings per share exclude restructuring charges and amortization of goodwill and indefinite-lived intangibles. Before-tax restructuring charges during the program included separation related costs ($1.3 billion), asset write-downs ($1.4 billion), accelerated depreciation ($1.1 billion) and other costs ($1.1 billion) directly related to the Company's Restructuring Program.
The Company discontinued reporting core earnings in fiscal year 2004 concurrent with the substantial completion of the program.While the Company will continue to conduct projects consistent with the focus of continued productivity improvement andmargin expansion, any charges associated with these projects will be absorbed in normal operating costs.

Procter & Gamble Reconciliation of Reported to Core Financials - By Quarter JAS'02 to JAS'03
Consolidated Statement of Earnings Amounts in millions except per share amounts JAS02 OND02 JFM03 AMJ03 JAS03Net Sales 10,796 11,005 10,656 10,920 12,195
Cost of Products Sold 5,489 5,490 5,394 5,768 5,879Gross Margin 5,307 5,515 5,262 5,152 6,316
MRA&O 3,128 3,267 3,305 3,683 3,673Operating Income 2,179 2,248 1,957 1,469 2,643
Interest Expense 144 143 138 136 141Other Income & Expense 103 74 37 24 40
Net Earnings Before Income Taxes 2,138 2,179 1,856 1,357 2,542Income Taxes 674 685 583 402 781
Net Earnings 1,464 1,494 1,273 955 1,761
Per Common ShareBasic Net Earnings 1.10 1.13 0.96 0.71 1.33Diluted Net Earnings 1.04 1.06 0.91 0.68 1.26
Restructuring Program Charges JAS02 OND02 JFM03 AMJ03 JAS03Net Sales 5 (9) 0 0 0Cost of Products Sold 83 84 46 168 0MRA&O 63 57 41 213 0Total (Before Tax) 151 132 87 381 0Total (After Tax) 113 98 66 261 0
Consolidated Statement of Earnings excluding Restructuring Program and Goodwill AmortizationAmounts in millions except per share amounts JAS02 OND02 JFM03 AMJ03 JAS03Core Net Sales 10,801 10,996 10,656 10,920 12,195
Core Cost of Products Sold 5,406 5,406 5,348 5,600 5,879Core Gross Margin 5,395 5,590 5,308 5,320 6,316
Core MRA&O 3,065 3,210 3,264 3,470 3,673Core Operating Income 2,330 2,380 2,044 1,850 2,643
Interest Expense 144 143 138 136 141Other Income & Expense 103 74 37 24 40
Core Net Earnings Before Income Taxes 2,289 2,311 1,943 1,738 2,542Core Income Taxes 712 719 604 522 781
Core Net Earnings 1,577 1,592 1,339 1,216 1,761
Per Common ShareCore Basic Net Earnings 1.19 1.20 1.01 0.92 1.33Core Diluted Net Earnings 1.12 1.13 0.96 0.87 1.26