PFC Light Commercial Vehicles - upcommons.upc.edu
103
Analysis and Improvement of Security Concerning Light Commercial Vehicles PFC Enrique Garcia Orte Supervisor: Adrian Gomila May 6th 2009
Transcript of PFC Light Commercial Vehicles - upcommons.upc.edu
Analysis and Improvement of
Security Concerning Light
Commercial Vehicles
PFC
Enrique Garcia Orte
Supervisor: Adrian Gomila
May 6th 2009

II
Analysis and Improvement of Security
Concerning Light Commercial Vehicles

III
Analysis and Improvement of Security
Concerning Light Commercial Vehicles

IV
Analysis and Improvement of Security
Concerning Light Commercial Vehicles

V
Analysis and Improvement of Security
Concerning Light Commercial Vehicles
Abstract Statistics confirm that there is a need to study the safety of vans with a permissible maximum
laden mass between 2000 and 3500 kg. as well as develop strategies for improvement. The
number of fatalities in accidents involving vans has been constant during the last 10 years, not
following the diminishing tendency shown by the general accidents. Not only efficient, but also
safer road freight transport is required.
This report analyses the security of the light commercial vehicles across the study of the
influence from load distribution and the effectiveness of ESC (Electronic Stability Control).
Through the medium of simulations made with Pc-Crash software, it has been analysed if the
implementation of ESC in vans can at some extent compensate the influence of inaccurate
load distributions.
Furthermore, due to van’s relatively high centre of gravity and its load, vans may have less
avoidance properties than a passenger car. Also (in addition) the differences of braking and
dynamic properties between passenger cars and light commercial vehicles have been studied.
Neither through literature review nor through own tests, the widespread opinion that vans
have much worse active safety systems (brakes, driving stability when negotiating a turn) than
passenger cars could not be verified.
Effectiveness of ESC implementation was proved just on specific load configurations,
highlighting the importance of proper load distribution. On the other hand, Cost-Benefit
analysis considering the installation of the ESC shows positive Social benefits for both
countries, Denmark and Spain.

VI
Analysis and Improvement of Security
Concerning Light Commercial Vehicles
Contents Abstract ......................................................................................................................................... V
Contents ....................................................................................................................................... VI
Chapter 1. Introduction ................................................................................................................. 1
1.1 Origin of the project ...................................................................................................... 1
1.1.1 Statistics from Denmark and Spain ....................................................................... 1
1.2 Motivation of the project .............................................................................................. 3
1.2.1 Euro NCAP valuation of ESC .................................................................................. 3
1.3 Objectives and structure of the project ........................................................................ 4
1.4 Project limitations ......................................................................................................... 5
Chapter 2. General description of a VAN (Opel Movano) ....................................................... 6
2.1 Dimensions .................................................................................................................... 6
2.1.1 Exterior .................................................................................................................. 6
2.1.2 Interior ................................................................................................................... 6
2.2 Wheelbase, tracks and free distance to the ground ..................................................... 7
2.3 Interior distribution and distance from front axle to H point ....................................... 7
2.4 Volume and distance from the load space to the front axle ........................................ 7
2.5 Kerb weight and plated weights.................................................................................... 8
2.5.1 Characteristics Kerb weight Van ........................................................................... 8
2.5.2 Characteristics with a loaded Van ....................................................................... 10
Chapter 3. Car/Van comparative .......................................................................................... 14
3.1 Tested Vehicles ............................................................................................................ 14
3.2 Simulations .................................................................................................................. 16
3.2.1 Deceleration test ................................................................................................. 17
3.2.2 Lane changing test ............................................................................................... 19
3.2.3 Over steering test ................................................................................................ 21
3.3 Conclusions ................................................................................................................. 23
3.3.1 Deceleration Test ................................................................................................ 23
3.3.2 Lane changing test ............................................................................................... 24
3.3.3 Over steering test ................................................................................................ 24
Chapter 4. Load Distribution/ESC influence on Vans ............................................................ 25
4.1 Load configurations ..................................................................................................... 25
4.1.1 Validation of CoG ................................................................................................ 27
4.2 Introduction to the Electronic Stability Control .......................................................... 28

VII
Analysis and Improvement of Security
Concerning Light Commercial Vehicles
4.2.1 Stabilizing concept............................................................................................... 28
4.2.2 Brief explanation of ESC system technical aspects ............................................. 29
4.3 Description of the simulation ...................................................................................... 31
Results ..................................................................................................................................... 33
4.4 Low load distribution: Sliding + barrier crash tendency ............................................. 33
4.4.1 Crash Parameters ................................................................................................ 33
4.4.2 Center load .......................................................................................................... 36
4.4.3 Front load ............................................................................................................ 40
4.4.4 Rear axle load ...................................................................................................... 41
4.4.5 Center load vs. Front load vs. Rear axle load at 90km/h .................................... 42
4.5 High load distribution: Rollover tendency .................................................................. 47
4.5.1 Rollover and Static Stability Factor ..................................................................... 47
4.5.2 High Center load ................................................................................................. 48
4.5.3 High load on rear axle ......................................................................................... 52
4.5.4 High front load .................................................................................................... 53
4.6 Conclusions ................................................................................................................. 55
4.6.1 Regarding ESC ...................................................................................................... 55
4.6.2 Regarding ESC: Possible solution......................................................................... 56
4.6.3 Regarding Load Distribution ................................................................................ 57
4.6.4 Regarding Load Distribution: Possible solution................................................... 59
Chapter 5. Unsecured load .......................................................................................................... 62
5.1 Simulation description ................................................................................................ 62
5.2 Secured: ....................................................................................................................... 63
5.3 Unsecured cargo: ........................................................................................................ 64
5.3.1 Load type. Friction coefficient. ............................................................................ 64
5.4 Results ......................................................................................................................... 65
5.4.1 Euro-pallet ........................................................................................................... 65
5.4.2 Metal sheet ......................................................................................................... 66
5.4.3 Partition wall ....................................................................................................... 66
Chapter 6. Cost-Benefit Analysis ................................................................................................. 67
6.1 Effectiveness of the ESC. Estimation for vans. ............................................................ 67
6.2 Effectiveness of ESC on the reduction of victims for vans .......................................... 68
6.3 Social benefit from the implementation of ESC for vans ............................................ 70
6.4 Evaluation of the Cost-Benefit of ESC in Spain and Denmark ..................................... 72

VIII
Analysis and Improvement of Security
Concerning Light Commercial Vehicles
Conclusions ................................................................................................................................. 73
Environmental impact ................................................................................................................. 74
References ................................................................................................................................... 75
Acknowledgments ....................................................................................................................... 77
Appendices ..................................................................................................................................... i
A. Pc-Crash software description ........................................................................................... i
1. Physical assumptions of the program ................................................................................ i
2. Co-ordinate systems ........................................................................................................... i
3. Forces and moments acting on the vehicle ...................................................................... ii
a. Air resistance ................................................................................................................. ii
b. Grade resistance............................................................................................................ ii
c. Roadway-wheel reactive forces .................................................................................... ii
4. Correction of braking forces ............................................................................................. iii
5. Tire model ......................................................................................................................... v
6. Wet friction between tire and road ..................................................................................vi
7. Moment of inertia .............................................................................................................vi
8. Impact Model ................................................................................................................... vii
9. Coefficient of restitution. Impact force impulse. ............................................................ viii
10. Equivalent Energy Speed ............................................................................................... ix
B. Osterseminar 2009 ............................................................................................................ x
1. Crash Test Day ............................................................................................................... x
2. Workshop ...................................................................................................................... xi
List of Tables ................................................................................................................................ xiii
List of figures ................................................................................................................................ xv
Acronyms ................................................................................................................................... xviii

1
Analysis and Improvement of Security
Concerning Light Commercial Vehicles
Chapter 1. Introduction
1.1 Origin of the project Worldwide traffic is increasing with more and more vehicles on the road. With further
economical growth (after the global crisis), it will be possible to see more increase in mobility
and in traffic density throughout the world. This will require efforts to furthermore enhance
the road safety. Thus, these changes are having a serious effect on one specific type of vehicle,
the delivery van with a maximum allowed weight between 2-3,5 tons.
The statistics for the European Union demonstrate alarming results. In 2001, in the UE died
976 occupants of vans. Since that date, this figure fall to 795 deaths in 2005, this means a
decrease of 18.5%. However, this is still far from the reduction achieved on passenger cars,
where the difference between 2005 and 2001 is 25,6% less. A further study has been carried
out comparing the two specific countries where this thesis has been done, Denmark and Spain.
1.1.1 Statistics from Denmark and Spain
- Spain
From the data of 2007 that has been obtained from the Dirección General de Tráfico DGT, in
Spain there is a total of 2.435.706 which means an increase of 50% from 1999. Figure 1 shows
a positive tendency on the number of registered vans per year.
Figure 1: Vans registered in Spain per year
On the other hand, by analysing the accident data it can be concluded that the general
decrease on accidents and fatal injuries produced on the last years have not been translated to
the light commercial vehicles
Source: DGT Injured
Victim role Total Dead Total Severe Slight
Driver 3.534 154 3.380 526 2.854
Passenger 2.679 81 2.598 380 2.218
Total 2004 6.213 235 5.978 906 5.072
Diver 3.543 133 3.410 597 2.813
Passenger 2.452 72 2.380 398 1.982
Total 2005 5.995 205 5.790 995 4.795
Diver 4.030 153 3.877 618 3.259
Passenger 2.954 77 2.877 451 2.426
Total 2006 6.984 230 6.754 1.069 5.685
Table 1: Van victims in Spain 2006
0
20.000
40.000
60.000
80.000
100.000
120.000
140.000
160.000
2000 2001 2002 2003 2004 2005 2006 2007

2
Analysis and Improvement of Security
Concerning Light Commercial Vehicles
Figure 2: Van fatalities in Spain Figure 3: General fatalities in Spain
During 2006 there were 15% more drivers of vans dead, while in the same period there was a
general decrease of 8%. No further data for years 2007 and 2008 has been found in relation
with drivers and passenger of vans.
- Denmark
Figure 4 shows, as happened in Spain, an increase of the number of vans registered. On 2008
there are a total of 485.786 vans in Denmark. Obviously, the population in Spain is bigger
(44.708.964) than in Denmark (5.447.084) so also the total number of registered vans.
Proportionately, this represents a fatality rate of 9.44·10-5 dead person per van in Spain, while
in Denmark the number decrease to 4.94·10-5. This may show that is safer to drive a van in
Denmark, but in both countries the same problem has been found. Van fatalities do not
diminish or even increase not following the tendency shown by the general accidents.
Figure 4: Total number of vans registered in Denmark
0
50
100
150
200
250
2004 2005 2006
0
500
1000
1500
2000
2500
3000
3500
4000
2004 2005 2006 2007 2008
100.000
150.000
200.000
250.000
300.000
350.000
400.000
450.000
500.000
2003 2004 2005 2006 2007 2008
Table 2: Van victims in Denmark 2006
Source: statisk banken Injured
Victim role Total Dead Total Severe Slight
Driver 20
Passenger 2
Total 2005 352 22 330 132 198
Diver 21
Passenger 3
Total 2006 330 24 306 110 196
Diver 22
Passenger 2
Total 2007 305 24 281 99 182

3
Analysis and Improvement of Security
Concerning Light Commercial Vehicles
The data provided by CARE (EU road accidents database) in figures 5 and 6 for Denmark, lead
us to different conclusions but to the same target. While in Spain the general fatalities have
decreased, in Denmark has increased from 306 fatalities in 2006 to 406 in 2007. On the other
hand, it is possible to observe a decrease tendency between 2003 and 2006. Finally, the
number of dead persons inside a van remains almost constant between 2005 and 2007 with a
value close to 24.
Figure 5: Van fatalities in Denmark Figure 6: General fatalities in Denmark
1.2 Motivation of the project The origin of this project has been the increasing concern and the relative small number of
studies that have been carried out regarding vans. Statistics confirm that there is a need to
study the safety of light commercial vehicles, as well as develop strategies for improvement.
The aim is to examine vans security by simulating the most common accidents suffered by light
commercial vehicles. Often, van accidents begin with a dangerous sliding, ending with a
rollover, crashing against a roadside barrier or colliding against moving vehicles in the opposite
direction. With the Electronic Stability Control (ESC), it would be possible to avoid such
accidents, or at least significantly mitigate their effects. The main problem is that there is a low
percentage of currently available models of vans equipped with ESC.
1.2.1 Euro NCAP valuation of ESC
By using the data provided by Euro NCAP it is possible to analyse de availability of the ESC for
new cars in Europe. This has been calculated as follows: In each country, e.g. car model is
available with two different body, two engines and five different specification level – this
means twenty alternatives available to the public. The ESC is incorporated in two series (10
percent) of these variants, as an option on ten (50 percent) and is not available in eight (40
percent) [1]. The proportion of the ESC as standard equipment is shown in green, optional
equipment in yellow and if it is not available in red. Figure 7 shows the total of vehicles while
figure 8 shows the proportion of the type of vehicles with closer properties to light commercial
vehicles.
0
5
10
15
20
25
2005 2006 2007
0
50
100
150
200
250
300
350
400
450
2003 2004 2005 2006 2007

4
Analysis and Improvement of Security
Concerning Light Commercial Vehicles
Figure 7: ESC availability total of vehicles [RACC] Figure 8: ESC availability big Minivan [RACC]
There is a big difference between countries. Denmark appears as the first country with 76% of
the vehicles with ESC as standard equipment, whereas Ireland has just 51%. Spain is in the
tenth position with 63%. Furthermore, it has been found the availability of the ESC for the
most common van models in both countries.
Figure 9:Vans ESC availability in Spain Figure 10: Vans ESC availability in Denmark
Contrary to what happens on passenger cars, it has been found that regarding vans, availability
of the ESC is common for every version of each model. The only difference between countries
has been found on the Iveco Daily. This poor availability of such important system for security
as the ESC has also served as motivation for the study of this project
Finally, it has been also a motivation to involve a human factor on the study of vans security.
Different load configurations and how different positions may aggravate collision
consequences have been studied. In fact, is the driver or the personal related with that decides
how the load must be positioned.
1.3 Objectives and structure of the project Paying particular attention to active and passive safety, several tests have been done in order
to understand the potential improvements that could be achieved with the introduction of
driver assistance systems (ESC mainly), a correct load distribution or the study of unsecured
load. This has been done by following those steps:
VW CrafterRenault Master
Opel MovanoNissan Interstar
Mercedes SprinterIveco Daily
Citroen Jumper
VW CrafterRenault Master
Opel MovanoNissan Interstar
Mercedes SprinterIveco Daily
Citroen Jumper

5
Analysis and Improvement of Security
Concerning Light Commercial Vehicles
- Technical description of the vehicle studied. Opel Movano.
- Comparison between the dynamic behavior of a Van and a Passenger car. - Study of how ESC can prevent an accident or mitigate the consequences for different
cargo configurations.
- Analysis of the consequences of unsecured cargo.
First of all, it has been described the most relevant parameters and characteristics of a Van.
Those parameters are required by the software used for all of the simulations, the Pc-Crash.
This program helps to simulate motions and collisions of vehicles and biomechanical objects
after setting all the parameters necessary.
Afterwards, it has been compared the unloaded van in front of four different passenger cars;
urban, compact, sedan and a SUV (Sports Utility Vehicle). On the issue of vans, has always
been a widespread belief that they are much more insecure than a conventional tourism.
Doing a little analysis of the results achieved in different simulations, it has been tried to find
out if this idea is well founded or not.
Moreover, it has been studied how different load configurations for the van affects to the
dynamic behavior. This has been done by changing the load position along the longitudinal
axle of the vehicle and also varying the height. At this point, it has also been studied how ESC
can avoid or mitigate collision consequences.
Finally, unsecured cargo scenario has been simulated. Two different loads without lashing have
been introduced on a multibody system in order to an analyse changes produced by the
unsecured load on the vehicle. Also, it has been studied the forces acting on the partition wall.
1.4 Project limitations The limitations of this project are basically two reasons. One is the software, PC-Crash, which
despite being considered one of the best systems for the reconstruction of accidents and
validated in numerous studies, must be consider as what it is, a program for reconstruction of
accidents. Results can be considered realistic, but these results therefore need to be
interpreted with caution.
On the other hand, studies like New Sliding Tests and their Evaluation The ESC Simulation
Model in PC-Crash [2], carried out by the creators of the software Dr.Andreas Moser and
Dr.Hermann Steffan, shows that the PC-Crash vehicle dynamics model and ESC model are
valuable tools in reproducing the vehicle movement and dynamics for the tests with and
without ESC. Also it shows that excellent correlation has been achieved between simulation
and test data.
Finally, this project has tried to reproduce common situation while analyzing vans security. On
the contrary, there are multitudes of cases and scenarios, which obviously can not be studied
entirely.

6
Analysis and Improvement of Security
Concerning Light Commercial Vehicles
Chapter 2. General description of a VAN (Opel Movano)
For this project, the Opel Mavano has been chosen to do all the simulations and tests in PC-
Crash regarding active and passive security of Vans.
The Opel Movano is a mid-sized commercial vehicle sold in Europe from year 1999 and
underwent its first facelift in late 2003. The vehicle is available in a wide range of variants,
including a choice of three wheelbases, three roof heights and three gross vehicle weights. As
well as cargo carrying panel vans, there are also six and nine seat Combi variants, a seven seat
crew cab and chassis cabs models. A sixteen seat bus model is also available.
The development of Movano was undertaken by French manufacturer Renault and is also sold
as the Renault Master and Nissan Interstar.
Finally, the model that has been chosen is the Opel Movano 2.5 CDTI L2H2. Following tables
and schemes shows the most relevant parameters needed to define each simulation.
2.1 Dimensions
2.1.1 Exterior
Total length 5399 mm
Total height 2721 mm
Total width 1990 mm
Table 3: Opel Movano exterior dimensions
2.1.2 Interior
Effective front head space 1216 mm
Effective back space 1708 mm
Effective hips space 1578 mm
Table 4: Opel Movano interior dimensions
Figure 11: Opel Movano Schemes in mm. [Opel/Vauxhall]

7
Analysis and Improvement of Security
Concerning Light Commercial Vehicles
2.2 Wheelbase, tracks and free distance to the ground The distance values between axles, tracks, front overhang and free distance to the ground are
the following:
Wheelbase = 3578 mm
Front overhang = 862 mm
Rear overhang = 959 mm
Track-axle 1 = 1740 mm
Track-axle 2 = 1725 mm
2.3 Interior distribution and distance from front axle to H point There is just one row of seats on the front part of the vehicle. H point distance is referred to
the front axle in x direction and distance to the ground.
Figure 12: Opel Movano H Point [mm]
2.4 Volume and distance from the load space to the front axle In relation with the dimensions of the vehicle, is it possible to calculate the maximum loading
space, which is approximately:
Vtotal= 12.000 dm³
Figure 13: Opel Movano Load Volume [mm]

8
Analysis and Improvement of Security
Concerning Light Commercial Vehicles
Where:
A= 3134 mm;
B= 1764 mm;
C= 2146 mm;
D= 1282 mm.
2.5 Kerb weight and plated weights It is important to know the position of the gravity center (CoG) for each situation. In this case
when the van is empty and also when it is fully loaded.
2.5.1 Characteristics Kerb weight Van
Plated weights and kerbweights [Kg]
Front Axle Rear Axle Total Payload kg
GCW
Model Plated Kerb Plated Kerb Plated Kerb
2.5 CDTI L2H2
1750 1213 1900 658 3300 1871 1429 5300
Table 5: Opel Movano Plated weight and Kerbweights
Table 6: Kerbweight axle distribution
Those values represent a load distribution of 64,7% for the front axle and 35,3% for the rear
axle.
Front axle = 1213 kg
Rear axle = 659 kg
Kerb weight = 1871kg
Figure 14: Opel Movano Load Compartment Dimensions [mm]

9
Analysis and Improvement of Security
Concerning Light Commercial Vehicles
Note: Kerb weight for standard vehicles includes coolant, oil, 90% full fuel tank and spare
wheel. The maximum authorised mass should be shown on the departments manufacturing
plate fitted to the vehicle. This means the marking on a goods vehicle, by means of a ministry
plate, showing the maximum weights for that particular vehicle eg maximum authorised mass,
and in certain cases, train weight.
FARA FFKerb
1213 · 𝑋𝐶𝑜𝐺 = 659 · 3578 − 𝑋𝐶𝑜𝑔
XCoG = 1260 mm
CoG position (Kerbweight)
Weight distribution
FA 64,7%
RR 35,3%
Distance [mm]
L1 (CoG to FA) 1259,6
L2 (CoG to RA) 2319,4
HCoG 0,419
Axle Load [Kg]
FA 1213
RA 659
Table 7: Opel Movano Kerweight parameters
1259,6 mm
419 mm
Figure 15: Opel Movano Kerb Weight Center of gravity [mm]

10
Analysis and Improvement of Security
Concerning Light Commercial Vehicles
2.5.2 Characteristics with a loaded Van
In Chapter 4 it will be studied how different load position may affect Van’s dynamic behavior,
so this point should be taken as an example on how de CoG has been calculated for the
different simulations.
Maximum authorised mass
Figure 16: Opel Movano Load distribution
Figure 16 shows a possible load distribution. This vehicle can represent a Van used for road
assistance in case of any mechanic failure on a car. In this case, it will be assumed that there
are two occupants on unique row of seats. As mentioned before, Payload figures do not allow
for the weight of the driver, or any passengers, which should therefore be deducted from the
figures shown.
Table 8 shows that the load admitted on the back part is 1279 kg. Due to the purpose of this
vehicle, there should be some space for a workbench, tools or spare parts. This is as example
of the possible load:
1. Space for a compressor and tools = 335 Kg.
2. Welding/hydraulic equipment = 335 Kg.
3. Random parts = 149 kg.
4. Spare parts and tires = 460kg.
Kerb weight 1871 kg.
Occupants 2 · 75 = 150 kg.
Load 1429 – 150 = 1279 kg.
Total 3300 kg.
Table 8: Total Load
1
2
3
4

11
Analysis and Improvement of Security
Concerning Light Commercial Vehicles
Zone Mass (kg) XCoG (mm)* hCoG(mm)**
1 335 3352 1041
2 335 3622 1291
3 149 1827,5 1441
4 460 1827,5 1041
Table 9: Load Distribution
(*) Referred to FA
(**) Referred to the ground
Center of gravity of the load:
mmxCoG 8,26961279
5,1827·4605,1827·1493622·3353352·335
mmhCoG 1,11531279
1041·4601441·1491291·3351041·335
Load distribution
DISTANCE TO FA [mm]
1st ROW* 753
CoG (Kerbweight) 1259,6
LOAD 2697
LOAD [Kg]
1st ROW 150
CoG (Kerbweight) 2182
LOAD 1279
Table 10: Load parameters
(*) 100 mm has been discounted from the original value due to normative calculations [3]

12
Analysis and Improvement of Security
Concerning Light Commercial Vehicles
With those values it is possible to find the CoG of Maximum authorized mass Van:
mmxCoG 7,19143300
2697·12791260·1871753·150
mmhCoG 1,7803300
1153·1279419·18711235·150
Now is possible to find the front and rear axle reactions and compare it to the plated values:
kgFFMAM RAFA 3300
kgL
MAMXF CoG
RA 17663578
3300·7,1914
101
·
kgFMAMF RAFA 153417663300
Axle reactions [Kg]
MAM Plated
Front Axle 1534 1750
Rear Axle 1766 1900 Table 11: MAM situation Axle reaction
2697
1260
753
1235 1153
Kerbweight Load
419
Figure 17: Opel Movano. Kerbweight and Load CoG [mm]

13
Analysis and Improvement of Security
Concerning Light Commercial Vehicles
Load FA RA
KerbWeight 2182 64,7% 35.3%
MAM Center 3300 46,5% 53.5%
Table 12: Kerbewwight and MAM weight distribution

14
Analysis and Improvement of Security
Concerning Light Commercial Vehicles
Chapter 3. Car/Van comparative About Vans, there has been always a generalized thought that they are much more insecure
than a conventional car [4]. Making an analysis and collecting data from the simulations done
by Pc-Crash has been tried to prove if this is true. This analysis is based on the handling and
braking capabilities, which are the major components of a vehicle’s active safety.
3.1 Tested Vehicles For that study, lists of the most common sales for 2008 in Europe has been found in order to
make it as more generalized as possible.
Top sales car in Europe 2008 (number of vehicles)
Urban cars Compact Sedan SUVs and 4X4
Fiat Panda 173.026 VW Golf/Golf Plus 428.755 Audi A4 196.578 VW Tiguan 66.889
Fiat 500 138.953 Ford Focus/C-Max 382.336 VW Passat 192.498 Toyota Rav4 50.683
Renault Twingo 100.019 Citroën Xsara Picasso/C4 302.490 BMW Serie3 192.493 Honda CRV 44.595
Citroën C1 82.965 Vauxhall/Opel Astra 279.853 Mercedes Clase C 174.531 Suzuki SX4 43.788
Toyota Aygo 81.923 Renault Mégane/Scénic 269.016 Skoda Octavia 137.083 BMW X5 37.919 Table 13: Top sales car in Europe 2008
One car from each category has been compared with the Opel Movano van.
Those cars are:
-Citroen C1 1.0 55kw (2005)
Weight [ Kg] 790
Length [m] 3.44
Width [m] 1.63
Height [m] 1.47
Distance to C.G. from front axle [m] 0,695
C.G. height [m] 0.498
ABS Yes
ESC (CSC) Yes
Front Axle 60.5%
Rear Axle 39.5% Table 14: Citroen C1 parameters

15
Analysis and Improvement of Security
Concerning Light Commercial Vehicles
-Ford Focus 1.6 ti. (Sedan 85kw (2006)
Weight [ Kg] 1260
Length [m] 4.47
Width [m] 1.84
Height [m] 1.45
Distance to C.G. from front axle [m] 0,84
C.G. height [m] 0.515
ABS Yes
ESC Yes
Front Axle 62.5%
Rear Axle 37.5% Table 15: Ford Focus parameters
-VW Passat 1.9 Tdi 77Kw (2006)
Weight [ Kg] 1562
Length [m] 4.77
Width [m] 1.82
Height [m] 1.47
Distance to C.G. from front axle [m] 0,99
C.G. height [m] 0.496
ABS Yes
ESC Yes
Front Axle 57%
Rear Axle 43% Table 16: VW passat parameters
-BMW X5 3.0d 150kw (2005)
Weight [ Kg] 2230
Length [m] 4.67
Width [m] 1.88
Height [m] 1.71
Distance to C.G. from front axle [m] 1.25
C.G. height [m] 0.43
ABS Yes
ESC Yes
Front Axle 48%
Rear Axle 52% Table 17: BMW X5 parameters
Center of gravity and weight distribution of each vehicle has been calculated. The center of
gravity height [5], relative to the track, determines the load transfer and it’s related with the
weight distribution. Height of the center of gravity relative to the wheelbase determines load
transfer between front and rear axle. Those values are used to update the rear brake force
distribution.

16
Analysis and Improvement of Security
Concerning Light Commercial Vehicles
3.2 Simulations Three different tests have been done in order to represent situations that may occur on daily
use:
-Deceleration test
-Lane changing test
-Over steering test
For these tests some values will remain constant:
General conditions for all the tests:
- Friction coefficient: µ=0,8
- Maximum deceleration therefore : 7.85 m/s2
- ABS (Assisted Braking System): All vehicles
- ESC: All except the van
- Suspension properties: normal
- Tire model: Linear (Appendices I.5)
- Occupants and cargo: Front Occupant= 75 Kg.
It is important to notice that all vehicles except the van are equipped with ESC system. This is
due that ESC is included as standard equipment in all the vehicles except the Opel Movano.
Three generations of vans were manufactued in the past. At the present, the last two
generations of these vans are common on the road [4]:
-1st generation: rear drum brake, no ABS
-2nd generation: vans built between 1995 and 2005 with rear disc brakes, mainly with ABS but
without ESC.
-3rd generation. Vans built after the 2005, generally equipped with both ABS and ESC
During the last five years, different institutions conducted breaking tests. These show that the
vans’ deceleration capacity increased considerably between the first and the second
generation. This fact has been studied on the deceleration test.

17
Analysis and Improvement of Security
Concerning Light Commercial Vehicles
3.2.1 Deceleration test
Vans are usually implicated on accidents where the impact is against the back of a passenger
car. This fact is well known by the factories and is one of the mean reasons why almost all the
vans build nowadays have ABS as standard equipment.
The initial speed has been defined to 100 km/h for the first test and 130km/h for the second
one. Immediately afterwards, brake sequence has been defined as a fully brake pedal
situation. The same road and load conditions have been defined for all the vehicles.
Regarding Pc-Crash, the stop criterion it is defined to stop the vehicle when it reaches a really
low energy value. This value usually is between 0.3 and 0.4 km/h and is used to avoid the
inexactitude of results in velocities close to 0 km/h. It is possible to notice on a velocity-time
diagram that the curve never gets to cross the x-axle.
The first test that has been done is the deceleration evaluation from 100 km/h to 0. Figure 18
shows Distance-Velocity diagram.
Figure 18: Deceleration test at 100 km/h. Distance-Velocity diagram.
The breaking distance for the Opel is 55,42 m. The test starting at 130 km/h shows similar
relatitve results.
Stopping distance [m]
Initial speed 100 [km/h] 130 [km/h]
1- Opel Movano 55,42 93,60
2- Citroen C1 51,82 87,28
3- Ford Focus 50,58 85,49
4- VW Passat 49,99 84,56
5- BMW X5 49,41 83,32 Table 18: Braking distance

18
Analysis and Improvement of Security
Concerning Light Commercial Vehicles
Figure 19: Deceleration test at 130 km/h. Distance between cars at stopping positon.
This means that the van needs a 12.16% longer distance on the 100-0 test and a 12.33% on the
130-0 test. This is compared with the vehicle of most braking capability, in this case, the BMW
X5. Stopping distance needed by the van is really close to the rest of the passenger cars.
It is also important to analyze the maximum deceleration that each vehicle can reach. Figure
20 shows Longitudinal and Vertical acceleration for each vehicle. It is important to notice the
ABS regulation, especially during the building phase. Figure 21 shows how the acceleration
curve would look if no ABS system had been applied.
Figure 20: Deceleration test. Longitudinal and Vertical acceleration of each vehicle.
Maximum Acceleration [m/s2]
1- Opel Movano -6.96
2- Citroen C1 -7.53
3- Ford Focus -7.62
4- VW Passat -7.72
5- BMW X5 -7.85 Table 19: Maximum acceleration
Figure 21: ABS build up phase

19
Analysis and Improvement of Security
Concerning Light Commercial Vehicles
3.2.2 Lane changing test
Afterwards, an evasive action has been done in order to know the dynamic properties that a
vehicle can reach on a simple lane changing. It is no rare to drive at more than 100 km/h on a
motorway, and also is not the first time that happens that a heavy truck loses some load on
the causeway or that there is something on the middle of the lane. Without any time to stop
the vehicle before the impact, the driver has to react quickly by doing a simple lane changing.
This situation was conducted in this test, defined according to the ISO standard.
Figure shows the structure of the simulation.
For these tests a rapid steer angle change is required. In order to compare this value between
all the vehicles, speed of 40 km/h has been defined in order to not compromise the stability of
the vehicles.
Figure 22: Lane Changing Test. Steering angle.
Figure 22 shows the steering for both, left and right front wheel. On left turns, a bigger angle
of the left wheel is required.
1 Opel Movano
8 Citroen C1
10 Ford Focus
11 VW Passat
12 BMW X5
10 m 10 m 10 m
4 m
3 m 3 m

20
Analysis and Improvement of Security
Concerning Light Commercial Vehicles
It can be observed that the highest steering angle is needed on the van with a maximum value
of 7.97 degrees on the first turn, -9.10 on the second and 6,62 on the last one. On the first
turn, the slope of the curve indicates a steering angle velocity required on the van of 10,93
degrees/second.
By increasing vehicles speed at the test, it has been found what is the maximum speed that
each vehicle can reach without instabilities and without hitting any of the marks. It has been
found that lateral acceleration increases as velocity does.
At 55 km/h a maximum lateral acceleration up to 7 m/s2 has been reached on the van. On the
other hand, it is important to notice that at this speed, instabilities were achieved. Tire marks
were visible on the road due to combined longitudinal and lateral tire forces. That happens if
those forces are more than 95% of the available frictional force.
It can be predicted that in curves and when negotiating evasive actions, lateral accelerations of
approximately 6m/s2 without instabilities can be achieved by the Opel Movano.
Afterwards, speed was raised up until the first vehicle crashed with one of the marks. At 60
km/h at the entrance, the van hits the last mark. The crash happens after a sliding movement
of approximately 14 meters. The impact with a hypothetic obstacle would occur at 55.24 km/h.
Other vehicles maximum speed:
Maximum Speed [km/h]
Citroen C1 75
Ford Focus 73
VW Passat 72
BMW X5 69
Movano 59 Table 20: Maximum Speed
Due to the dynamic properties and the use of ESC, vehicles with more weight (like the BMW
X5) can go through the test with a higher speed than the van. BMW speed is a 15% higher than
the Opel Movano. On the other hand, and like happened with the deceleration results, the van
is still really close to the values achieved by the rest of the passenger cars.
Figure 23: Lane Changing test. Lateral acceleration

21
Analysis and Improvement of Security
Concerning Light Commercial Vehicles
It is important to remark, that by supplying ESC system to the van, the maximum speed would
have been 64 km/h, which is even closer to the other cars maximum velocity. On the other
hand, and as mentioned before, the main target of these tests is to compare common
situations on the road, which means a high percentage of passenger cars with ESC and a low
percentage of vans with that system.
Further studies of ESC application have been done in Chapter 4.
3.2.3 Over steering test
The following test is based on the exit that can be found in every motorway. Situation can be
described as the event that happens when the driver has not perceived the exit sign with
enough time to reduce the speed moderately. The driver either starts to brake due to the high
lateral acceleration or does not brake. This may cause a loss of grip and over steering.
No braking has been applied during the movement along the curve.
Following tests have been done assuming dry conditions, which means coefficient of friction
µ=0,8 and maximum deceleration of 7.85 m/s2. Figure shows over steering test structure.
For the different tests, Opel Movano and Citroen C1 have been used. This is due to the fact
that Opel is the only vehicle without ESC and the Citroen C1 is the vehicle with the shortest
wheelbase of all the vehicles tested. In cornering, because of the center of gravity, front-heavy
cars tend to under steer and rear-heavy cars to over steer.
Comparing the vehicle without ESC but with the longest wheelbase (with a higher under
steering tendency) and the vehicle with ESC but with the shortest wheelbase probably will
produce the closest values between passenger cars and vans.
*Understeer is a term for a car handling condition in which during cornering the circular path of the
vehicle's motion is of a greater radius than the circle indicated by the direction its wheels are pointed
Test Vehicles Speed
N01 Opel Movano/Citroen C1 30
N02 Opel Movano/Citroen C1 40
N03 Opel Movano/Citroen C1 50
Table 21: Test vehicles speed
50 m

22
Analysis and Improvement of Security
Concerning Light Commercial Vehicles
With increasing vehicle speed the yaw velocity also increases. In figure 24 the maximum yaw
velocity at 30 km/h assumes an asymptotic value of -0,4 rad/s.
As figure 25 shows, if the same test is done at 40 km/h it is possible to notice that the van’s
yaw velocity increases to -0.55 rad/s while on the passenger car remains on -0.45 rad/s.
The yaw angle is the angle between a vehicle's heading and a reference heading. During corner
entry the front tires, in addition to generating part of the lateral force required to accelerate
the car's center of mass into the turn, also generate a torque about the car's vertical axis that
starts the car rotating into the turn.
The yaw angular inertia tends to keep the geometrical direction changing at a constant rate.
This makes it slower to swerve or go into a tight curve, and it also makes it slower to turn
straight again. Those tests define the relation between the steering angle, vehicle speed and
yaw angular velocity. Using these data it is possible to define how the vehicle follows the ideal
trajectory.
Figures 26 and 27 show a comparison of the trajectories between vehicles on tests N01 and
N03. These trajectories show clearly that the Van can not follow the desired path at 50 km/h.
The van without ESC (Red) get into a slide movement wherein the vehicle with ESC switched
on follows the desired path.
Figure 24: Over steering test 30 km/h. Yaw velocity. Figure 25: Over steering test 40 km/h. Yaw velocity.
Figure 26: Over steering test 50 km/h. Trajectory. Figure 27: Over steering test 40 km/h. Trajectory.

23
Analysis and Improvement of Security
Concerning Light Commercial Vehicles
3.3 Conclusions The widespread opinion that vans have much worse active safety systems (brakes, driving
stability when negotiating a turn) than passenger cars could not be verified, neither through
literature review nor through own tests.
3.3.1 Deceleration Test
The results of this study show that the full deceleration achievable with vans of the 2nd
generation can be compared to the one of modern passenger cars. In both simulations ( 100
km/h and 130 km/h) the empty van needs around a 12% bigger distance. These findings of the
current study are consistent with several other studies [4] [6] [7]. On the other hand, it is
important to mention that for example, on the test with a starting velocity of 100 km/h, while
the BMW has already stopped the Opel Movano still has a residual velocity of 21, 56 km/h.
This can be the difference between hitting another vehicle or stopping without any
consequences.
This is a very common accident on vans, especially in queues of traffic congestion on
motorways. In the event of a collision against a passenger car, the loads for the occupants are
very high.
Figure 28: RACE Crash Test at 60 km/h
Through tests review done by the RACE (Real automóvil Club de España), the results were
catastrophic for tourism. The test speed was considerably higher than the residual velocity of
the simulation, but it can provide an idea o the possible consequences.
While the van was only slightly deformed in the engine compartment, welds in the roof
supports and feet were separated from tourism to the point where the vehicle was
considerably deformed. The driver's seat was completely distorted and twisted. The driver,
sliding backwards, deformed bracket and all of the headrest of the seat frame was badly
damaged. In this case, it has to be assumed that there is a high risk trauma throughout the
area of the spine. In this kind of accident, the risk of serious neck injury is very high. In
addition, injuries can occur in the legs and chest.
Although the deceleration distance needed by the van is close to any passenger car, this
difference may cause hard injures when colliding against a vehicle with a lower mass.

24
Analysis and Improvement of Security
Concerning Light Commercial Vehicles
3.3.2 Lane changing test
As happened with the breaking distance, in this test the van is also close to the values reached
by the passenger car, specially on the 3rd generation Van where a maximum speed of 64 km/h
was reached. Maximum lateral acceleration of 7 m/s2 has been reached by the van but with
important instabilities.
On the other hand, on the 2nd generation van (without ESC) the maximum speed stays at 59
km/h. In curves and when negotiating evasive actions lateral accelerations up to 6 m/s2 have
been achieved without causing instabilities. Due to the low weight and short total length, the
best vehicle in this test has been the Citroen C1 with a maximum entrance speed of 75 km/h.
3.3.3 Over steering test
This is one of the most demanding tests for a light commercial vehicle. Due to this fact, in this
simulation there is a bigger difference with the other cars. Maximum velocity of 40 km/h can
be reached by a 2nd generation van on a 50 m. radius curve. Yaw angle velocity increases faster
on a van than in a passenger car, which makes more difficult to follow the desired path. At 50
km/h the Citroën C1 keeps a safe trajectory whereas the Opel Movano invades the opposite
direction.
Results show that even the van is in the last position in all the simulations that have been
done, the values obtained can be compared to the one of a modern passenger car. This does
not mean that light commercial have similar dynamic properties than the rest of the vehicles,
specially when it is loaded, but indeed contradicts the widespread opinion that they are really
far from a passenger car.

25
Analysis and Improvement of Security
Concerning Light Commercial Vehicles
Chapter 4. Load Distribution/ESC influence on Vans In spite of improvements in passive safety and effort to alter driver behavior, the absolute
number of van fatalities has increased. In order to try to improve van’s security, several tests
have been done to understand how a bad load distribution may affect in a possible crash
situation. Also, the properties and influence of the ESC has been studied in these simulations.
For these test, Van described in chapter 2 has been used. The four possible loads spaces
created provides the opportunity to change the center of gravity of the total vehicle. By doing
that, it has been studied how different load position affect to the vehicle stability and also how
this fact can increase or decrease Van’s security.
Furthermore, the two last generations of Vans’ mentioned have been used in each test. This
pretends to show how active systems (like ESC) can avoid or reduce collision consequences.
-1st
generation: rear drum brake, no ABS
-2nd
generation: vans built between 1995 and 2005 with rear disc brakes, mainly with ABS but without ESC.
-3rd
generation. Vans built after the 2005, generally equipped with both ABS and ESC
4.1 Load configurations CoG position of the MAM Vans used on the simulations:
Center load: High Center load:
XCoG [mm] = 1914 XCoG [mm] = 1914
HCoG [mm] = 780 HCoG [mm] = 969
Load on rear axle: High load on rear axle
XCoG [mm] = 2100 XCoG [mm] = 2318
HCoG [mm] = 814 HCoG [mm] =1017
Front load: High front load:
XCoG [mm] = 1576 XCoG [mm] = 1576
HCoG [mm] = 805 HCoG [mm] =1012
Figure 29: CoG of the different load distributions

26
Analysis and Improvement of Security
Concerning Light Commercial Vehicles
The total load capacity is 1279 Kg. and has been positioned in different places, as figure 29
shows. The new centers of gravity have been calculated by positioning the load on the empty
spaces designed on Chapter 2. Due to the elevated center of gravity found on the vans with a
high load position, which augments the susceptibility to rollover, vans are the preferred target
for ESC applications. For example, in the rear configuration load has been distributed between
1-2:
Figure 30: Rear axle load configuration
Zone Mass (kg) XCoG (mm)* hCoG(mm)**
1 639.5 3352 1041
2 639.5 3622 1291
3 0 1827,5 1441
4 0 1827,5 1041
(*) Referred to FA (**) Referred to the ground
Center of gravity of the load:
mmxCoG 34871279
5,1827·05,1827·03622·5.6393352·5.639
mmhCoG 11161279
1041·01441·01291·5.6391041·5.639
CoG of Maximum authorized Mass (MAM) Van:
mmxCoG 21003300
2697·12791260·1871753·150
mmhcdi 8143300
1153·1279419·18711235·150
(*)150 kg refers to the two front occupants.
The same procedure has been used for the front cargo configuration, but in this case loading
spaces 3 and 4. High load position (red) has been reached by summing 600 mm. to the CoG of
each place and by repeating the calculations.
Zone hCoG(mm) hCoG(mm)
1 1041 1641
2 1291 1891
3 1441 2041
4 1041 1641

27
Analysis and Improvement of Security
Concerning Light Commercial Vehicles
By comparing the new CoG it is possible to observe the big difference with the kerbweight
situation where the center of gravity high is 0,419 m. and the distance to the front axle is
1,259m.
4.1.1 Validation of CoG
In order to verify if those new CoG are feasable it has been obtained data from maximum
permitted height for centre of gravity. It has not been possible to find for the exact van used
on the simulations (Opel Movano) but it has been possible for a van with similar
characteristics, the Volkswagen Transporter T5. The total length is 5290 mm in front of the
5399 mm of the Opel. Width is almost the same between both vans whereas the Transporter
height is 200 mm lower. Table 22 shows other important data.
Opel Movano Volkswagen T5
Wheelbase [mm] 3578 3400
Front overhang [mm] 862 894
Track-Axle [mm] 1740 1724
Kerbweight [Kg] 1871 1860
Of which on front axle [Kg] 1213 1162
Of which on rear axle [Kg] 658 707
MAM [kg] 3300 3200
Perm. axle load front [kg] 1750 1650
Perm. axle load rear [kg] 1900 1720
Load capacity [kg] 1279 1331 Table 22: Opel Movano – VW T5 comparative
Due to the similarity between both models, and also the fact are using similar technical
systems, following data can be extrapolated to the Movano. The following table shows the
height of the centre of gravity permissible on vehicles with standard equipment.
Version Centre of gravity on chassis X [mm]
Gross centre of gravity of vehicle Y1 [mm]
Max. perm. height of CoG for body and load Z [mm]
VW T5 730 920 1375 Table 23: VW T5 CoG position
VW Note: Subject to errors and technical amendments.
There is a strong advise by VW that these heights should not be exceeded. On the other hand,
in none of the three configurations with a high load, the CoG exceeds the maximum value of
1375 mm. The highest one, which is the load on the rear axle is still 358 under the limit fixed
by Volkswagen.
Figure 31: VW T5

28
Analysis and Improvement of Security
Concerning Light Commercial Vehicles
4.2 Introduction to the Electronic Stability Control
One of the main purpose of these test is to analyse how the presence of an ESC system aid the
driver in maintaining control of the vehicle in different load conditions and how this can avoid
or reduce collision consequences. Therefore it is important analyze the concept of stability
and describe what is ESC is and how it works.
4.2.1 Stabilizing concept
In critical driving situations most drivers are overburdened with the stabilizing task. The
average driver can neither judge the friction coefficient of the road nor the grip reserves of the
tires [8]. The drivers are typically startled by the altered vehicle behaviour in in-stable driving
situations; as a result, a well considered reaction of the driver can not be expected.
For that reason the ESC has to be designed to stabilize the vehicle even in situations with panic
reactions and driving failures like exaggerated steering. On these tests, this has been
represented by the fact that the driver does not press the brake pedal after the risk feeling has
been surpassed. The first reaction of the driver is to make an abrupt steering.
The characteristic side slip angles, where the steerability of the vehicle is vanishing, are
dependent on the road friction coefficient. On the simulations done the specified slip angle is
10o. For the linear tire model (which is the one used) different surface friction coefficients have
no effect on the stiffness of a tire, and thus a lower coefficient of friction, which cannot
produce as much side force on a tire, will result in a lower maximum slip angle. For example,
with a specified maximum tire slip angle of 10° on a surface with a coefficient of friction of 0.7,
the maximum tire slip angle possible is 7°. This is the angle at which the maximum lateral tire
force will be reached, which will be 70% of normal force in this case.
The reason why stabilizing a vehicle in critical situations is so challenging can be shown by
considering the physical effects. Steering of a vehicle yields in a yaw moment which results in
a directional change. The effect of a given steering angle depends on the actual side slip angle
of the tires. Only slight alterations of the yaw moment are possible at large side slip angels
even for extensive interventions which can be seen in figure 32.
Figure 32: Influence of side slip angle on yaw moment for different steering angles at high tire-road friction [Convergence Transportation Electronic Association]

29
Analysis and Improvement of Security
Concerning Light Commercial Vehicles
4.2.2 Brief explanation of ESC system technical aspects
It is important to describe how an ESC system works in order to understand how it benefits
crash avoidance. The system is performed on limit situations and tries not to exceed the limits
of control. By serving on the following variables:
- Steering angle, wheel velocity.
- Lateral acceleration.
- Angle with respect to the vertical axis (Yaw)
The ESC aims to enable the driver's intention is translated into a dynamic performance of the
car adapted to the characteristics of the road.
Figure 33: Operation of the ESC
The ESC includes the capabilities of ABS (Antilock Brake System) and TCS (Traction Control
System), allowing an active braking on four wheels with a high dynamic sensitivity. Control
with braking force and the lateral force is the main objective of the ESC in an attempt to
converge into an ideal vehicle's behaviour. The management system can vary the engine
output torque for adjust the ratio of the drive wheels slip. ESC allows to adjust the longitudinal
and lateral forces acting on it each wheel separately.
As figure 33 shows, ESC systems are based on steering angle, wheel speed, lateral acceleration
and yaw velocity to make a calculation between desired and actual vehicles’ behavior. (Values
were measured also in the chapter Car/Van Comparative). This tries to make as closely as
possible the response of the vehicle to the conditions response in the normal driving.
As you can not directly change the lateral force, it is impossible to vary the lateral acceleration
and slip angle. However, the lateral force caused by Yaw moment (which can be generated)
leads to the variation of the optimal slip angle. The ESC may also intervene in the relationship
of the sliding tires indirectly influence the longitudinal and transverse forces acting on each
wheel, which is done by the subordinated controllers ABS and TCS.
Electronic EstabilityControl
Measurament of steering angle and
wheel speed
Recording of theintended vehicle
direction
Calculation of thedeviation betweenactual and desiredvehicle behaviour
To counteractoversteer, breaking is
applied at the frontaxtle
To counteractundersteer, breaking isapplied at the rear axtle
Measurament of lateral acceleration
Recording of thevehicle’s actual
behaviour
Measurament of yawvelocity

30
Analysis and Improvement of Security
Concerning Light Commercial Vehicles
To generate the necessary Yaw angle the ESC transmits the necessary adjustments to the
wheels slip selected. ABS and TCS starts the actuators that control the hydraulic braking
system and engine management system using data generated by the ESC.
The ESC complete control system is usually based on those components:
1- Wheel brakes
2- Wheel speed sensors
3- ECU
4- Steering-wheel sensor
5- Hydraulic modulator with primary-pressure sensor
6- Yaw sensor with lateral-acceleration sensor
Figure 34: ESC control system
The hydraulic modulator with primary-pressure sensor uses the recognition of the emergency
braking as a step to increase the braking pressure beyond the call of the driver. Actually, it
increases braking pressure on all the wheels to reach the threshold of the block. At this point,
is when the ABS acts. Regarding the hierarchy of controls, the ESC has total priority, meaning
that defines the relationship of the sliding tires ideal for the ABS and TCS.
1-2
1-2
3
4
5
6

31
Analysis and Improvement of Security
Concerning Light Commercial Vehicles
4.3 Description of the simulation Those tests pretend to represent a common situation. The event occurs on a two lane road
(one for each direction) with a width of 3.3 meters for each lane. There is also left and right
margin, in this case with 1.7 meters each. Furthermore, a roadside barrier has been positioned
in order to represent possible off-roadway crashes, in where the first harmful event occurs off
the roadway after a vehicle departs the travel road due to loss of control or crossing the edge
of the roadway. Those barriers have a length of 1,9 meters each with a weight of 1755 Kg.
each. Road section parameters have been taken from the Vasc Country government, just as an
example of realistic values.
Figure 35: Road dimensions
The coefficient of friction is 0.7, which means that this test has been done in dry conditions.
Also, no wind or weather effects have been applied. Maximum deceleration that can
be reached in those conditions is 6,87 m/s2. The scenario represents an overtaking by a
BMW 320 Ci to a Mazda 6. Meanwhile, from the other lane, the Opel Movano is
cruising at constant speed.
Simulations proceeds as follows:
- At 0.6 seconds after the simulations has started, the BMW begins the overtake
maneuver
The overtake done by the BMW can be considered as standard regarding dynamic aspects. The
lateral offset is 3 meters with a maximum lateral acceleration of 4 m/s2. This acceleration is far
inside a passenger car’s capabilities (Car/Van comparative chapter) and will not be exceeded
while the steering wheel angle is being increased at the start of the lane change maneuver.
Steering angular velocity of 5 deg./s has been defined with a lateral rise distance of 2.5%. The
Lateral Steer Rise Distance, expressed as a percentage of the Lateral Offset, is the lateral
distance the vehicle moves while the steering angle of the front wheels is being increased.
Usual range for this value is 1%-4%, considering 1% smooth and 4% abrupt.
1,7 m
3,3 m
Roadside barrier
Mazda
Bmw
Figure 36: Simulation. Start of the overtake.

32
Analysis and Improvement of Security
Concerning Light Commercial Vehicles
- At 1.4 seconds, the Van's driver starts evasive action (reaction time 1-1.2 sec).
Figure 37: Simulation. Start of evasive action of the van.
- At 2.1 seconds, the BMW is totally invading the opposite lane with a speed of 84.8
km/h.
Constant values for velocity and acceleration have been defined for both, Mazda and BMW
cars. Mazda has a constant velocity of 65 km/h while the BMW starts the simulation at 80
km/h and accelerating. The shift has been defined between 1500 and 5000 rpm with a time
delay of 1 second. This time delay is due to the time that the driver needs to change the gear
On the other hand, as figure 39 shows there is no gear change while overtaking. The Bmw can
proceed with the maneuver in the same gear. Figure 40 corresponds to an acceleration test
done to the Bmw starting from 0 km/h. It is possible to find that this car can reach up to 105
km/h in third gear, which proves the fact explained before. The horizontal slopes of the curve
correspoond to the time delay between gears. The throttle pedal position is at 50% of
maximum.
Figure 40: BMW acceleration test
-At 3.6 sec after avoidance actions, Van's driver presses fully the brakes.
Figure 41: Vehicles trajectories. Results may vary depending on the simulation
Mazda Bmw
Van
Van
Figure 38: Simulation. Invasion of the opposite lane.
Figure 39: Bmw Velocity
33
Analysis and Improvement of Security
Concerning Light Commercial Vehicles
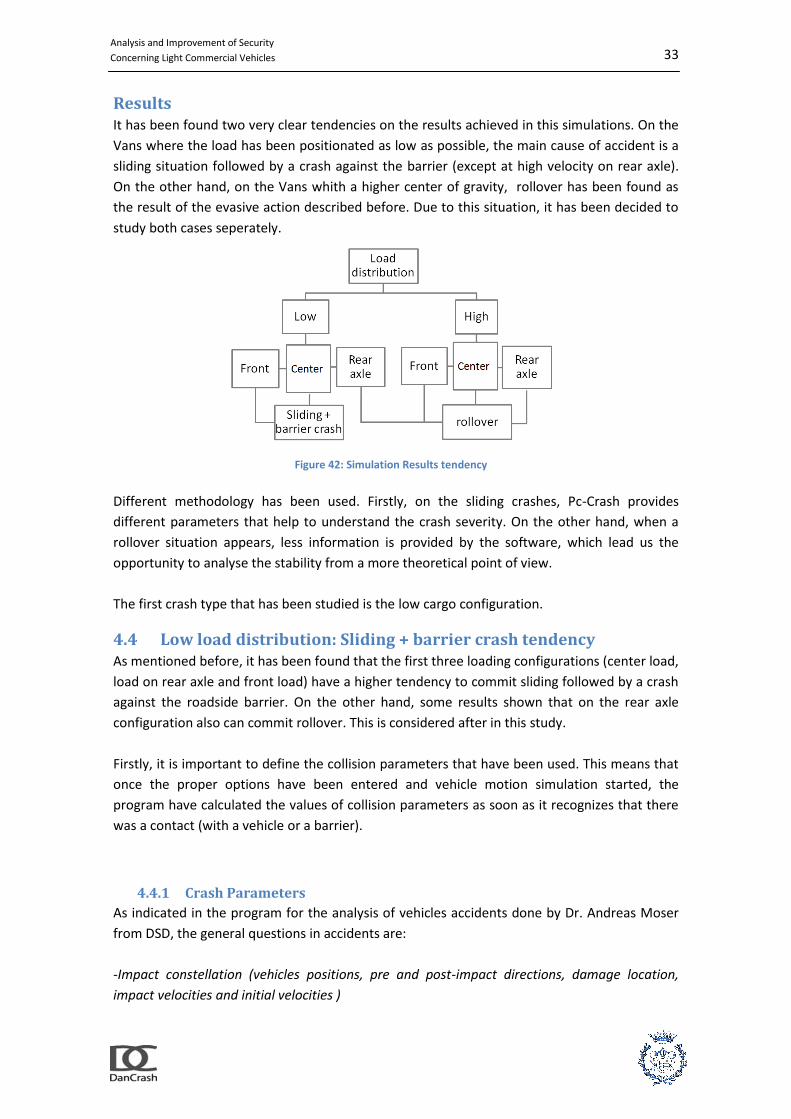
Results It has been found two very clear tendencies on the results achieved in this simulations. On the
Vans where the load has been positionated as low as possible, the main cause of accident is a
sliding situation followed by a crash against the barrier (except at high velocity on rear axle).
On the other hand, on the Vans whith a higher center of gravity, rollover has been found as
the result of the evasive action described before. Due to this situation, it has been decided to
study both cases seperately.
Different methodology has been used. Firstly, on the sliding crashes, Pc-Crash provides
different parameters that help to understand the crash severity. On the other hand, when a
rollover situation appears, less information is provided by the software, which lead us the
opportunity to analyse the stability from a more theoretical point of view.
The first crash type that has been studied is the low cargo configuration.
4.4 Low load distribution: Sliding + barrier crash tendency As mentioned before, it has been found that the first three loading configurations (center load,
load on rear axle and front load) have a higher tendency to commit sliding followed by a crash
against the roadside barrier. On the other hand, some results shown that on the rear axle
configuration also can commit rollover. This is considered after in this study.
Firstly, it is important to define the collision parameters that have been used. This means that
once the proper options have been entered and vehicle motion simulation started, the
program have calculated the values of collision parameters as soon as it recognizes that there
was a contact (with a vehicle or a barrier).
4.4.1 Crash Parameters
As indicated in the program for the analysis of vehicles accidents done by Dr. Andreas Moser
from DSD, the general questions in accidents are:
-Impact constellation (vehicles positions, pre and post-impact directions, damage location,
impact velocities and initial velocities )
Figure 42: Simulation Results tendency

34
Analysis and Improvement of Security
Concerning Light Commercial Vehicles
The driving conditions for both vehicles have been specified before the crash. Then,
from conservation of linear and angular momentum and the use of the Newtonian
Crash Hypothesis, the post-impact conditions are determined.
Below this heading the values provided by Pc-Crash for the post-impact phase are
shown:
- Vel. is the velocity of the vehicle.
- Dir. is the velocity vector direction of the vehicle.
- Δv is the velocity change.
The crash model used is characterized by the definition of the point of impact. The
point of impact is the point where the crash force is assumed to be exchanged.
-Accident Severity (EES, deformation depth)
As a control, the deformation depth of each vehicle, based on the defined positions of
the vehicles and point of impact, is also indicated. The deformation depth of each
vehicle, calculated in the direction of the crash force vector, is the distance from the
point of impact to the outside of the undeformed rectangular vehicle outline. The time
from the first contact between the rectangular vehicle outlines to when the impact is
calculated is from 30 to 60msec .
Furthermore, calculation of the deformation energy (EES, or Equivalent Energy Speed)
in the crash has been obtained. The total deformation energy will be distributed
between the vehicle and the barrier, based upon the relation of the masses of the
vehicles as well as of the respective deformation depths. The distribution of the
deformation energy between two vehicles in collision depends on the vehicle masses
and the deformation depths. [Appendices I.10]
In addition, pictures of real Van accidents have been found in order to represent the
EES value obtained on the simulation. Those pictures have been provided by
AutoExpert Hungary © and AGU Zürich database, where is possible to choose crashes
between different vehicle class, place of damage, product, type and obviously EES
value.
Figure 43: Capture of the EES 2005 [DSD]

35
Analysis and Improvement of Security
Concerning Light Commercial Vehicles
Finally, the elasticity of the collision is considered, based on a coefficient of restitution
(k). For most high energy impacts a k value of 0,1 can be used. If there is an unusual
deep penetration of a vehicle e.g. if a truck hits a Citroen 2CV it is possible to specify a
negative value. Higher positive values can be specified for low energy impacts (speeds
below 20-30 kmh). This model also considers the sliding of one vehicle along another
vehicle or a fixed object, based on a contact plane angle and friction coefficient.
[Appendices I.9]
-Injury potential (damage, injuries)
On the load distribution simulation, it has been calculated the acceleration suffered on
the vehicle by dividing the velocity change Δv by the known time of a crash, which is
between 0,12 and 0,14 seconds.
𝑎 =𝛥𝑣
𝑡
Where,
Δv : velocity change
t: estimated value for a collision (0,12-0,14 seconds and also related to the EES value)
Afterwards, those values have been compared with daily living accelerations suffered
by a person in order to understand the magnitude of the crash. Those data have been
provided by a DSD study done in 2005 where it is possible to find five daily actions like:
Sit on a chair Get down from a chair
Down stair Lay on the bed
Hit by a football ball
Figure 44: Daily living accelerations

36
Analysis and Improvement of Security
Concerning Light Commercial Vehicles
There were measured T1 (neck area), chest, and right-left head accelerations for each
action. It is important to mention that accelerations were taken on the three axis
directions (X, Y and Z) and measured in g forces.Each test was realized to people with
different weight and height, starting from a subject of 1,60 height and 60 Kg. to
another subject of 1,88m height and 96 Kg. According to the European average
(1,75m), it has been choosen the number 7, a 33 year old man of 1,74m height and 76
kg. This subject can adjust to a Van’s driver profile.
4.4.2 Center load
The first distribution that has been studied is the Van loaded on the center. This means a hCoG
of 780 mm. and a distance to the front axle of 1914 mm. Those values correspond to the
following loading position:
Figure 45: Center load configuration
The total load capacity (1279 Kg) is distributed in all the spaces described in point 2.3. This
provides a CoG as much centered as possible. Furthermore, same loaded Van has been tested
with and without ESC in order to understand how this system helps in critical crash situations.
The first thing that has been found is the maximum entrance speed that both Vans (the only
difference is the ESC) can reach without crashing. The Van without the stability system can
handle 89 km/h while the 3rd generation van (ABS+ESC) can reach up to 108 km/h. This means
a difference 19 km/h.
Figure 46 shows the simulations till stopping velocities. By comparing the final position of both
Vans after the simulation, it is possible to observe that even though the Van without ESC has
not crashed, this fact is more due to the braking capability than the ability to follow the
desired path. The 3rd generation Van would still have been able to continue the trip without
any additional maneuvers. It is also possible to observe the tire marks left by both vehicles. As
mentioned before, tire marks were visible on the road due to combined longitudinal and
lateral tire forces. That happens, as defined for these simulations, if those forces are more
than 95% of the available frictional force.
Figure 46: Final position. Blue: 2
nd Generation van. Red: 3
rd Generation van.

37
Analysis and Improvement of Security
Concerning Light Commercial Vehicles
In order to understand why the 3rd generation Van is capable to pass through the critical
situation without crashing against the roadside barrier (while the 2nd generation does), it has
been simulated both Vans passing at the same entrance speed of 90 km/h.
- 2nd and 3rd Generation vans at starting velocity of 90 km/h
It has been analysed how the ESC prevents the accident by comparing the lateral acceleration,
yaw rate and the brake factors. As was explained on the Electronic Stability Program
introduction, the main target of the ESC is to calculate the deviation between the actual and
desired vehicle behavior. In this case, ESC counteracts oversteering by applying brakes at the
front axle. Figure 48 shows the brake factors diagram for both Vans, understood brake factor
as the brake/acceleration forces applied to each wheel, in % of normal static force.
Figure 47: Center load configuration. ESC interaction.
Figure 48 : Center load. Brake Factor. Figure 49: Center load. Yaw angular velocity.
It is possible, by observing the red and dark blue curves, that the brakes are only applied on
the Van number 1. This is due to the ESC function because the driver does not press the pedal
brake until 3.6 seconds after the start of the simulation. Three different phases can be
perceived. On phase number two, from 1,67 to 2,29 seconds, instability can be perceived by
measuring yaw angular velocity. To counteract this fact, brakes are applied on the left-front
wheel. Afterwards, an opposite yaw angular is detected, so this time brakes are applied on the
right front wheel from 2,33 seconds to 3,6 second. At this moment of the simulation, and like
was defined on point 4.3, brakes are applied by the driver. Finally, the 3rd generation Van
keeps a safe position and ready to continue after avoiding the critical situation. On the other
hand, the 2nd generation Van has suffered a crash against the barrier.
1 2 3 1 3 2
1
2
3
Figure 50: Center load. 2nd
(red) and 3rd
Generation (blue) final position.

38
Analysis and Improvement of Security
Concerning Light Commercial Vehicles
Below it has been done a further study of 2nd generation van crash following the most
important questions regarding accidents.
- Impact Constellation
This crash occurs at 6.42 seconds with a pre-impact velocity of 18.65 km/h. After avoiding the
BMW, the van enters in a sliding movement that ends up with the front part colliding against
the roadside. The velocity vector direction Dir of the vehicle is -21.77º, which shows that the
severity of the crash is reduced by the fact of having a velocity almost parallel to the roadside
barrier. The velocity change Δv is 6.93 km/h. This value has been also used to calculate the
acceleration suffered on the crash.
Figure 51: Center Load. 2nd generation van impact.
-Accident Severity
Due to the low speed crash, the elasticity of the collision k has been considered by using a
coefficient of restitution of 0.2, which is higher positive value than the 0.1 used for high energy
impacts. If the vehicle and the barrier are still engaged and approaching each other, secondary
impacts appear. In this simulation 8 secondary impacts have been found. It has been defined a
value of 45 msec between each impact if the vehicles are still engaged and approaching each
other, which seems to be realistic.
The deformation depth of each vehicle is the distance from the point of impact to the outside
of the undeformed rectangular vehicle outline. The total deformation energy is distributed
between the van and the barrier, based upon the relation of the masses of the vehicles as well
as of the respective deformation depths. Taking into account that the mass of the Van is 3300
kg. and that each barrier portion is 1755 kg. the EES value results bigger on the roadside
barrier. In this simulation, EES value of 5,61 km/h has been obtained for the Van whereas the
barrier has registered 8,89 km/h. Those values reveal that this is not a severe accident but
both, EES and acceleration, have been compared with real crash tests.
CoG
Dir
Contact plane
Point of impact

39
Analysis and Improvement of Security
Concerning Light Commercial Vehicles
Real Crash figures show the post-crash situation between a Ford Galaxy and a Peugeot 206. In
this case, the vehicle’s pre-impact velocity was 14,6 km/h that resulted on EES value of 6 km/h.
Vehicle Ford Galaxy Peugeot 206
Year 1996 2000
Weight 1770 kg 988 kg
Pre-Impact Velocity 14.6 km/h 0 km/h
Velocity change Δv 6.8 km/h 12km/h
Acceleration 1.7g 3.1g
Place of damage Front Back
Collision direction -90º 90º
EES 6km/h 8km/h Table 24: Real crash parameters
Vehicle Simulation: Opel Movano Roadside Barrier
Year 2005 -
Weight 3300 kg. 1770 kg.
Pre-Impact Velocity 18.65 km/h 0 km/h
Velocity change Δv 6.93 km/h -
Acceleration 1,64g -
Place of damage Front Front
Collision direction -21.77º -90º
EES 5,61 km/h 8,89 km/h Table 25: Simulation parameters
Due to the difficult task of finding an identical situation to the simulation, this is the real
accident that most resembles. There is an important difference of the total weight of the
vehicle, and also, in one case the impact is against a roadside barrier while in the real scenario
is against another car. On the other hand, velocity change, acceleration and EES are
parameters with similar values.
Pictures should have been taken as a possible damage caused by the accident.
Figure 52: Center Load. Possible 2nd
generation van crash consequences.
[Wintherthur Versicherungen, Accident Research WPCA]

40
Analysis and Improvement of Security
Concerning Light Commercial Vehicles
-Injury potential
By knowing the velocity change Δv and the estimated time value for a collision t it is possible to
calculate the average acceleration suffered by the vehicle. The velocity change is Δv 6.93 km/h
(1,93 m/s) and the time is 0,12 seconds. This involves an acceleration of 16.06 m/s2 or 1,64g.
This values can be compared with the data obtained from real crash tests made by crashtest-
service.com ® for DanCrash. [Appendices]
If this value is taken to the daily living situations, it is possible to compare the average
acceleration suffered by the vehicle (1,64g) with the quotidian action of sitting. On the data
provided, it is possible to observe that the maximum acceleration is reached at 0.8299 sec.
with a value of 0.91596 g. It is important to notice that when talking about peak values in a
short time, which is an impulse, it is not considered a force as conventionally used. The
impulse is not as damaging, e.g. a pilot can handle only about 9g in his jet over a few seconds,
while a hummingbird smashed in the head doing 120 mph hardly affects him.
Due to this fact, has been calculated the average of acceleration during the same length of
time than the impact (0.12 sec.). It has been found that while sitting, an average acceleration
of 0.79g is suffered between 0.7619 and 0.8819 seconds. This means that on the crash the
driver suffers an acceleration just almost the double acceleration suffered while sitting, which
probably might not cause injuries. On the other hand, and when talking about accelerations,
the position of the body is very important at the instant of impact.
Figure 53: T1 acceleration suffered while sitting [DSD tests 2005]
4.4.3 Front load
The second distribution that has been studied is the Van loaded on the front. This means a hCoG
of 805 mm. and a distance to the front axle of 1576 mm. Those values correspond to the
following loading position:
Figure 54: Front load configuration.

41
Analysis and Improvement of Security
Concerning Light Commercial Vehicles
The total load capacity (1279 kg) is distributed just on the front spaces. As was done in the
previous simulation, the same loaded van has been tested with and without ESC in order to
understand how this system helps in critical crash situations.
By trying to reach the maximum entrance speed that both Vans can handle, it has been found
values really close to the center load configuration. The Van without the stability system can
handle 87 km/h while the 3rd generation Van (ABS+ESC) can reach up to 105 km/h. It is
possible to observe that the speed it is just 2 km/h and 3 km/h under compared with the
previous case. Afterwards it will possible to observe that these similarities also occurs on the
high load configurations (point 4.5), which may lead to the conclusion that there is not a big
difference between center and front configuration in this critical-crash situation.
On the other hand, and also like in the previous cargo configuration, the use of ESC allows the
Van an entrance speed considerably higher. In this case, a range of 20 km/h above the 2nd
generation Van can be perfectly corrected by the sole fact of equipping ESC.
A further study of this configuration crash has been carried on at the end of this chapter in
order to compare the three different load options.
4.4.4 Rear axle load
The last distribution that has been studied is the Van loaded on the rear axle. This results on a
hCoG of 814 mm. and a distance to the front axle of 2318 mm. Those values correspond to the
following loading position:
Figure 55: Rear axle load configuration.
The total load capacity is distributed evenly between the two back spaces, which means 639.5
in the space number 1 and 639.5 Kg. in the number 2.
A has been done with the two previous cargo configurations, maximum entrance speed of the
Van with and without ESC has been found. In this case, the Van without the stability system
can handle 72 km/h while the 3rd generation Van (ABS+ESC) can reach up to 84 km/h. It is
possible to observe a big difference between this load configuration and the center load
scenario. For example, by comparing the 2nd generation vehicles, there has been found a
reduction of 19% of the maximum allowed speed (89 km/h center - 72 km/h rear) whereas on
the 3rd generation it is even bigger 22% (108 km/h center – 84 km/h rear).
That proves the loading a van on the rear part is the worst option found. This statement is
increased by the fact that it has been found the rollover as cause of the accident instead of an
impact against the barrier. It is important to note that injury in such vehicles tend to be much
more severe in case of overturning, since in many cases the airbag for example, loses its
effectiveness as an element of passive safety.

42
Analysis and Improvement of Security
Concerning Light Commercial Vehicles
It is true that many passenger vehicles are equipped with the amount airbag or near windows,
which provides a degree of security in the event of overturning. Instead, this option is not
provided or extra equipment for commercial vehicles.
4.4.5 Center load vs. Front load vs. Rear axle load at 90km/h
Finally, simulation has been carried comparing the three possible load configurations on a 2nd
generation Van. At 90 km/h, the three vehicle crash against the roadside barrier. On point
4.4.2 has been studied how ESC can avoid an accident. Following the same procedure, it has
been proved that the load distribution may affect even in a harder way.
This test has been realized comparing the crash severity of three Vans with exactly the same
technical properties and entrance speed. The only difference between them is the load
distribution. It has been used the same methodology than before, which means that the
impact constellation, the accident severity and finally the injury potential parameters have
been measured.
-Impact Constellation
Center load
Crash values for center loaded Van were obtained on point 4.4.2. This crash occurred at 6.42
seconds with a pre-impact velocity of 18,65 km/h. The velocity vector direction Dir of the
vehicle was -21.77º with a velocity change of Δv 6.93 km/h.
Front load
On the other hand, with a front load the crash occurs at 6.045 seconds with a pre-impact
velocity of 29.54 km/h. After avoiding the BMW, the van enters in a sliding movement that
ends up with the front part colliding against the roadside with 11 km/h higher speed than in
the previous simulation. It is important to notice that the front load distribution subtracts
braking capability to the rear axle of the vehicle. The brake force distribution between the
front and rear wheels for each vehicle (center load: Red, front load: blue) can be observed in
figures 56 and 57.
These parameters identify the defined brake force distribution, as follows:
• Phi Slope of the first line
• z1 Point where slope changes
• m Slope of the second line.
Figure 57: Brake force distribution. Front load. Figure 56: Brake force distribution. Center load.

43
Analysis and Improvement of Security
Concerning Light Commercial Vehicles
Graphs show the proportion of rear brake force (qh) to the front brake force (z). The
theoretically ideal curve as well as the assumed or defined distribution is shown. Immediately
after entering a C.G. height a suggested distribution curve is calculated. This is because many
modern vans are equipped with automatic re-adjustment of brake distribution as a function of
vehicle cargo. Further explanation of correction of braking forces has been explained on point
Appendices I.4.
Start of the Brake sequence
Due to the different braking distribution mentioned before, it is possible to observe on figures
58 and 59 the relation between the yaw angular velocity and trajectory that has followed each
van. At 3.6 seconds the brake sequence starts (start is marked in both figures). After that point,
the blue curve (front cargo) separates from the red one (center cargo) showing the lower
capacity of the front cargo van to counteract the negative yaw velocity. The smaller braking
capacity on the rear axle causes greater tendency of this to advance the front axle, thus the
ability to follow the desired path is reduced. Figure 58 shows how both vehicles are following
exactly the same path just until the point where the brakes are applied. This is one of the
reasons of the increase of the damage suffered by the van with front cargo.
The velocity vector direction Dir of the front load vehicle is -18.15º. As happened on the
simulation with center cargo, the vehicle and the barrier are still engaged and approaching
each other after the first impact, which means that 7 secondary impacts have been found. On
the second one, the highest velocity change Δv is produced with a value of 8.31 km/h.
Rear axle Load
On the rear cargo configuration, it has been found a critical rollover situation. As mentioned
before, Pc-Crash provides less information regarding this type of accident, so is not possible to
provide the same parameters than in the center and front configuration. In this scenario, the
lateral forces create a large enough moment around the longitudinal roll axis, causing a
rollover instead of a sliding crash if necessary friction is available. With an entrance velocity of
90 km/h the van commits rollover at 2.9 seconds with a speed of 84.7 km/h. Considering a
friction between the van body and the ground of 0.5, it has been found that once the van hits
the asphalt slides for 34.44 m. until it gets stopped on the opposite lane. This crash has some
particularities in common with the high cargo configurations, which have been studied in point
4.5.
Figure 58: Yaw angular velocity. Front load (blue). Center load (red)

44
Analysis and Improvement of Security
Concerning Light Commercial Vehicles
-Accident Severity
Center load
Longer description has been done in point 4.4.2, but in order to compare with the other cargo
configurations, the most important parameters are remembered. The collision parameter
considered has been 0.2. There have been 8 secondary impacts. The EES obtained has been
5.61 km/h.
Front load
Even the speed in this crash is 60% higher than on the center load van, the elasticity of the
collision k has been considered the same by using a coefficient of restitution of 0.2. This is due
to the fact that accelerations are only comparable using EES if the coefficient of restitution is
the same in both (every) crash. Also, with an impact speed still lower than 30 km/h is still
feasible to use k=0.2.
As in the center load simulation, the vehicle and the barrier are still engaged and approaching
each other after the first impact. In this case, 7 secondary impacts have been found.
EES value of 8.36 km/h on the 2nd impact has been obtained. It refers to the most severe
impact which in most cases is the sum of the deformation energy e.g. if a car hits a tree
with 45 km/h the deformation will not get any deeper by hitting the tree another 10 times
with 10 km/h. It has not been possible to find a real crash test with similar characteristics as
happened on the front load configuration. On the other hand, on the Spring Seminar in Linz
organized by DSD [Appendices II], it was possible to obtain data from a front collision at 31
km/h which is close to the 29.54 km/h pre-impact velocity registered in this configuration.
It is important to mention that the sled test done in DSD facilities was performed with a
reinforced car body which means a total mass 570 kg. Also, it is possible to observe by
comparing figures 59 and 60 the difference between the angle of incidence of the real test and
the simulation.
Figure 59: Pc-Crash simulation Figure 60: Sled test at DSD
There is a difference of approximately 20º between both contact planes. Therefore, both
simulations should be compared cautiously.

45
Analysis and Improvement of Security
Concerning Light Commercial Vehicles
Rear axle Load
Finally, the rollover situation for the rear load configuration is shown on figure 63. This proves
again, that the rear load configuration produce much more severe consequences than the
center and front cargo positioning.
By comparing the accident severity based on the results obtained in Pc-Crash, it is possible to
observe the differences between de crash consequences on the three different configurations.
On figure 62, inside de the red box, slight damage is produced mainly on the right-front side
whereas on figure 61 the damage is more severe. Also, it is possible to see a bigger
deformation on the roadside barrier in the front load configuration.
Rollover is represented also in 3D view due to the complexity to understand 2D sketch
Injury potential
Center load
Previously, it has been found that with a center load distribution, the crash of the vehicle
against the roadside barrier produces an average acceleration of 1.64g. As mentioned before,
this means almost the double of the acceleration suffered while sitting, which is hardly
probable that may cause severe injuries neither on the driver nor on a hypothetic passenger.
Figure 61: Front Load crash Figure 62: Center Load crash
Figure 63: Rear axle load crash

46
Analysis and Improvement of Security
Concerning Light Commercial Vehicles
Front load
The injury potential for the front load configuration has been compared with the data
obtained from the sled test carried out by DSD at the Spring Seminar. Two tests have been
performed, with a belted/unbelted Dummy on the driver seat. In both cases it has been
analysed the x-axle acceleration suffered on the head and chest.
In the belted Dummy has been found a peak value of 3.5g on the head and 10.1g on the chest.
As has been done on the center load distribution, the average acceleration suffered on the
estimated crash duration (0.12 seconds) has been calculated. The acceleration suffered during
the collision time is 2.5g on the head whereas in the chest is 2.7g
In the unbelted Dummy, accelerations increase considerably. Peak value of 13.1g on the head
and 15.6g on the chest has been found. The average acceleration suffered on the estimated
between 0.0459 sec. and 0.1659 sec. of the crash the head suffers 8,18g whereas the neck gets
6,7g.
Figure 64: Belted Dummy rest position after 30 km/h crash.
Doing the analysis with the data obtained on the simulation, it is possible to find de average
deceleration by dividing the velocity change Δv 8.31 km/h by the collision time. Using the
formula Δv/ Δt it has been found an acceleration of 7.05g. This value is close to the ones
provided by the real sled test.
Finally, and again comparing this value with the daily living accelerations, it has been found
that the acceleration suffered in the front load distribution is almost 10 times the acceleration
suffered while sitting. In this case this may produce more severe consequences.
Rear Load
Again, due to the lack of information on rollover situations provided by PC-Crash, is not
possible to give data of the injury potential. Injuries in this type of accident depend a lot on the
use of the belt. If the driver is belted, the main injuries are caused on the head whereas if it is
unbelted, the accelerations may move the body along the inside the vehicle causing major
injuries.

47
Analysis and Improvement of Security
Concerning Light Commercial Vehicles
4.5 High load distribution: Rollover tendency
4.5.1 Rollover and Static Stability Factor
The rollover occurs when the lateral forces create a large enough moment around the
longitudinal roll axis of the van for a sufficient length of time. Critical lateral forces can be
generated under a variety of conditions. The vast majority of rollover crashes take place after a
driver lost control over the van [8]. By skidding off the road, the van may get in lateral contact
with a mechanical obstacle like a curb, a hole or a plowed furrow which yields a sudden large
roll moment. This results in a so called tripped rollover.
On the other hand, an un-tripped or friction rollover is the one that has been studied on the
simulation. This one takes place during severe steering maneuvers solely as a result of the
lateral cornering forces. Although the ratio of un-tripped to tripped rollovers is small, the un-
tripped rollovers account for the most severe crashes.
Has been found that the ratio of the track width T and the height of the center of gravity hCoG
gives a first indication for the rollover propensity of vehicles.
𝑆𝑆𝐹 = 𝑇
2 · 𝐶𝑜𝐺
The Static Stability Factor [8] is an important parameter affecting vehicle rollover risk and is
both relevant for tripped as well as un-tripped rollover. The track width is a fixed parameter
(T=1.74m) while the center of gravity height varies with subject to different load conditions.
Load Position SSF Star
Center load 1,13 ***
Load on rear axle 1,07 **
Front load: 1,08 **
High Center load 0,90 *
High load on rear axle 0,86 *
High front load 0,86 * Table 26: Vans’ load distribution SSF
Therefore, the SSF is used to get the star rating for a single vehicle according to the following
table:
SSF Star
> 1.45 *****
[1.25; 1.44] ****
[1.13; 1.24] ***
[1.04; 1.12] **
< 1.03 * Table 27: Star Rating [NHTS]
Just the van with center load, with a limit value of 1.13, can reach three stars. From that point,
the rest of vans (load on rear axle and front load) with a low load position reach two stars.

48
Analysis and Improvement of Security
Concerning Light Commercial Vehicles
On the other hand, all the vehicles loaded with an increase of 60 cm. on the load height have a
SSF value under 1.03. It can be predicted a really high rollover tendency for those vans.
How the load condition influence on the rollover propensity is shown in figure 65 in a
simplified manner for different types of vehicles and loading conditions. The static stability
factor for typical passenger cars is far above the lateral acceleration which can be transferred
by the maximum tire grip. This is the reason why passenger cars are usually not subject to un-
tripped rollovers even in extreme loading conditions. If the adhesion limit between the tires
and the road surface is reached before the lateral acceleration gets rollover critical, the vehicle
starts to skid over the front wheels. The situation is different especially for light commercial
vehicles, where elevated loading may play a major role.
Figure 65: Typical critical lateral accelerations to commit rollover on different types of vehicles. [NHTSA]
Figure shows that the lateral acceleration between a passenger car and a light truck in empty
conditions is not as big as in loaded situation. This is also reflected on point 3.2, where the
empty van was close to the registers obtained by passenger cars on the over steering and lane
changing tests.
On the other hand, and by analyzing the results that have been obtained from the simulations
done by Pc-Crash, it has been possible to see if high load configurations can be handled and
corrected by ESC systems.
4.5.2 High Center load
The first configuration has a hCog of 969 mm and a distance to the front axle of 1914 mm. This
means an increase of 189 mm. compared with the same load position but positioned as low as
possible. As observed in point 4.4.2, the van with a low configuration was able to bypass the
critical situation described without crashing or committing rollover at a maximum initial speed
of 108 km/h. This speed was reached using ESC system, while the maximum speed without it
was 89 km/h.
Figure 66: High center configuration.

49
Analysis and Improvement of Security
Concerning Light Commercial Vehicles
On the contrary, results have changed significantly in high load configuration. As mentioned
before, the lateral forces create a large enough moment around the longitudinal roll axis,
causing a rollover instead of a sliding crash if necessary friction is available. Simulation has
been done comparing high and low cargo configuration.
High center configuration vs. Low center configuration
- With ESC
Figure 67: High center configuration with ESP. Entrance speed=108 km/h. t= 2,38 sec
By using the same maximum speed reached for the low cargo simulation (with and without
ESC) it has been found that with an entrance velocity of 108 km/h and equipped with ESC, the
van with a high centered load at 2,38 seconds commits rollover with a speed of 101,4 km/h.
That proves that the speed that was possible to reach with the load in the same longitudinal
position but lower, is not possible to reach with a higher center of gravity even if the vehicle is
equipped with ESC.
Figure 68 shows the instant where both, left-front and left-rear tires lose contact with the
ground. At 2.38 seconds, the left-front wheel is the first one that reaches a normal force equal
to 0. Is it possible to observe also the force transfer to the right side wheel. Just before the 3
seconds all curves cross the x-axis which means that the van is on the ground. Since is the
major parameter to recognize rollover-critical in driving situations the lateral acceleration has
been also measured relative to the center of gravity. The vehicle reaction is usually expressed
in terms of lateral acceleration and yaw rate.
Mazda Bmw
Van
Figure 68: High center configuration.Tire normal forces.
Figure 69: High center configuration. Lateral acceleration
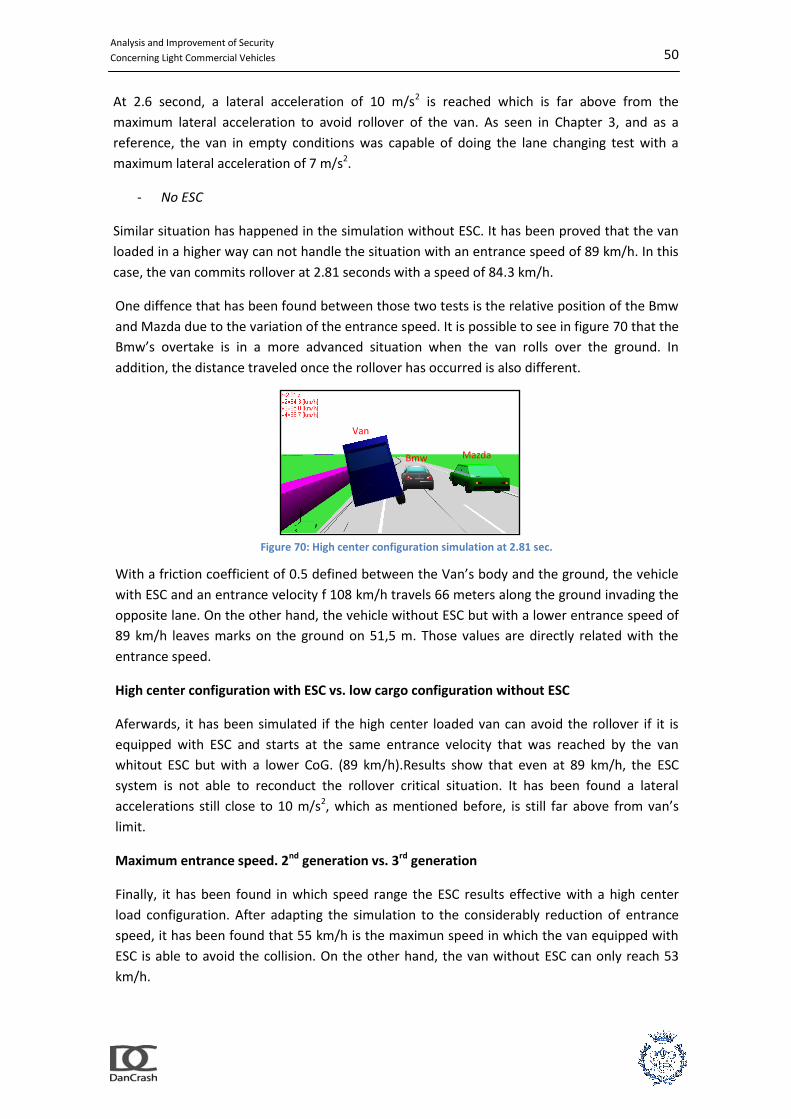
50
Analysis and Improvement of Security
Concerning Light Commercial Vehicles
At 2.6 second, a lateral acceleration of 10 m/s2 is reached which is far above from the
maximum lateral acceleration to avoid rollover of the van. As seen in Chapter 3, and as a
reference, the van in empty conditions was capable of doing the lane changing test with a
maximum lateral acceleration of 7 m/s2.
- No ESC
Similar situation has happened in the simulation without ESC. It has been proved that the van
loaded in a higher way can not handle the situation with an entrance speed of 89 km/h. In this
case, the van commits rollover at 2.81 seconds with a speed of 84.3 km/h.
One diffence that has been found between those two tests is the relative position of the Bmw
and Mazda due to the variation of the entrance speed. It is possible to see in figure 70 that the
Bmw’s overtake is in a more advanced situation when the van rolls over the ground. In
addition, the distance traveled once the rollover has occurred is also different.
With a friction coefficient of 0.5 defined between the Van’s body and the ground, the vehicle
with ESC and an entrance velocity f 108 km/h travels 66 meters along the ground invading the
opposite lane. On the other hand, the vehicle without ESC but with a lower entrance speed of
89 km/h leaves marks on the ground on 51,5 m. Those values are directly related with the
entrance speed.
High center configuration with ESC vs. low cargo configuration without ESC
Aferwards, it has been simulated if the high center loaded van can avoid the rollover if it is
equipped with ESC and starts at the same entrance velocity that was reached by the van
whitout ESC but with a lower CoG. (89 km/h).Results show that even at 89 km/h, the ESC
system is not able to reconduct the rollover critical situation. It has been found a lateral
accelerations still close to 10 m/s2, which as mentioned before, is still far above from van’s
limit.
Maximum entrance speed. 2nd generation vs. 3rd generation
Finally, it has been found in which speed range the ESC results effective with a high center
load configuration. After adapting the simulation to the considerably reduction of entrance
speed, it has been found that 55 km/h is the maximun speed in which the van equipped with
ESC is able to avoid the collision. On the other hand, the van without ESC can only reach 53
km/h.
Mazda Bmw
Van
Figure 70: High center configuration simulation at 2.81 sec.

51
Analysis and Improvement of Security
Concerning Light Commercial Vehicles
If two vans, one equipped with ESC (vehicle 1 red) and one without it (vehicle 2 blue), are
launched at the same initial speed of 55 km/h it is possible to observe in figure 71 how the
first one keeps following the path whereas the second one enters in rollover situation.
Important to mention that at this speed, both vehicles are reaching limit situations, and that
the van with ESC even lose contact with the ground on the two left side tires.
Figures 71 and 72 show how the curves are similar until the phase close to the 3.5 seconds of
the simulation. In that moment, which is represented by figure 74, the highest values of yaw
angular velocity and lateral acceleration are reached. At 3.5 seconds, the van number two gets
into a yaw angular velocity of 0,55 rad/s whereas the van number one remains at 0,50 rad/s.
Those can be compared with the results obtained on the over-steering test (point 3.2.3) where
van’s limit stability was reached also at 0,55 rad/s.
Lateral accelation of 7.91 m/s2 is suffered by van number two. On the other hand, the van
equipped with ESC gets a lateral acceleration of 7.03 m/s2. This can also be compared with the
tests done between cars and the van. In this case, on the lane changing simulation, the van
was capable to pass through the marks with an acceleration up to 7 m/s2.
Figure 71: High center configuration. 2nd
generation vs. 3rd
generation
Figure 74: High center configuration. Position.
Figure 72:High center configuration. Yaw angular velocity
Figure 73:High center configuration. Lateral acceleration

52
Analysis and Improvement of Security
Concerning Light Commercial Vehicles
4.5.3 High load on rear axle
In point 4.5.2 it has been demonstrated that is not possible to reach the same speed on the
simulation by positioning the load on a higher centered position. In this case, same results are
found. The van with high load on rear axle configuration is not able to achieve the same
results than the rear load configuration van.
Afterwards, it has been found the maximum speed that the van with a high rear position load
can achieve without committing rollover. With ESC, the van can pass through the critical
situation at 46 km/h whereas without ESC the speed is 45 km/h.
As it can be predicted, with a really high CoG value, there are slight differences between a van
equipped whit ESC and one without it.
On the other hand, a much important difference has been observed within the load
positioning. On the previous simulation, a maximum speed of 55 km/h has been reached
whereas in this case is 46 km/h. This makes a difference of almost 10 km/h just considering a
different load position.
High center load van configuration at maximum speed reached by the high load on rear axle
configuration.
It has been proved that the simple idea of loading the van in the center instead than in the rear
part allows reaching up to 10 km/h more on the same rollover critical situation. Because of it,
it has been decided to study the difference between both loading options at the speed where
the rear load configuration commits rollover. (47 km/h)
Both vans are equipped with the same ESC and ABS configuration. Also have the same tires,
suspension and geometry. All the parameters are exactly the same except the load positioning.
On the rear configuration, the CoG it is just 48 mm higher but with 404 mm more of distance
to the front axle (2318 mm against 1914 mm of the high center configuration). See figures 77
and 78.
Figure 75: High rear axle configuration
Figure 76: Maximum speed of the vans. 1-ESC 2-No ESC.

53
Analysis and Improvement of Security
Concerning Light Commercial Vehicles
Figure 78: High rear axle parameters
The program automatically calculates the moment of inertia using the formula described in
[Appendices I.7]. All the moments of inertia in this dialog box represent the unloaded vehicle.
Figure 79 shows how the red van (with center load) maintains control whereas the blue van
(rear load) commits rollover. It is important to mention that the red van does not even invade
the opposite lane, so there are no injuries or damages caused by the evasive action. This
simulation proves how a proper load distribution can help to avoid a really rollover critical
situation.
4.5.4 High front load
Finally it has been studied the van reaction with the load on a high front positioning.
Figure 80: High fron configuration
As previous simulations, the vans are not able to reach the same speed than with a lower load
positioning.
Figure 77: High center load parameters
Figure 79: High center configuration vs. High rear axle configuration

54
Analysis and Improvement of Security
Concerning Light Commercial Vehicles
Due to this fact, it has been studied further the different reactions with and without ESC and
also how this new loading configuration affects to the van’s dynamic behavior.
In this case, it has been found again a slightly difference on the maximum speed reached by
the van equipped with ESC. The van equipped with the stability program can reach 53 km/h
without committing rollover while the van without it can reach 51 km/h.
On the other hand, those values are similar to the results that have been found on the first
simulation with a high center load configuration. This can be compared with the similarities
that were found while comparing low center and low front cargo configurations. Again both
achieve similar results, leaving the rear as the worst option to load a light commercial vehicle.
On the other hand, while talking about high load configurations, rear positioning does not
mean a different type of crash as happened on the low configurations.

55
Analysis and Improvement of Security
Concerning Light Commercial Vehicles
4.6 Conclusions
4.6.1 Regarding ESC
The results of several studies show a consistent picture of the ESC with remarkable safety
benefits and proof the positive impact, especially on the low cargo configurations. On the
other hand, one of the more significant findings to emerge from this study is the slight effect
on the high CoG configurations, where ESC has not been able to counteract the high rollover
tendency.
Figure 81: Maximum entrance speed comparing load distribution and the use of ESC
These conclusions can be drawn from figure 81, where it is possible to observe that in all the
low cargo configurations the use of ESC allows to reach between 12 km/h and 19 km/h more
than on the 2nd generation van. This means that in that range of velocities, by just introducing
ESC as standard equipment of the vehicle, there would be no sort of consequences, neither for
the vehicle nor the passengers.
In contrast, on the high load configurations it is possible to observe that the difference of
adopting the stability system it just between 1 km/h and 2 km/h, therefore it seems that there
is not a positive effect of the ESC.
An implication of this is the possibility that, even the use of ESC results effective for some
cases, something else is needed to counteract the influence of the high load on the rollover
propensity. In highly dynamic manoeuvres like the simulation that has been done, a hybrid
dynamical system is required for a suitable anti-rollover control.
45
46
51
53
53
55
72
84
87
105
89
108
0 10 20 30 40 50 60 70 80 90 100 110
High rear no ESP
High rear ESP
High front no ESP
High front ESP
High center no ESP
High center ESP
Rear no ESP
Rear ESP
Front no ESP
Front ESP
Center no ESP
Center ESP
Max. entrance speed [km/h]

56
Analysis and Improvement of Security
Concerning Light Commercial Vehicles
4.6.2 Regarding ESC: Possible solution
The Bosch Rollover Mitigation Functions (RMF) is based on the standard ESC sensor set and
provides a scalable structure concerning the determination of rollover critical situations as has
been found on the high load configurations. [8]
Figure 82: Structure of the Rollover Mitigation System
Figure 82 shows the structure of the entire vehicle stabilizing system with the basic Electronic
Stability Program (ESC) and the Hybrid Rollover Mitigation Controller (HRMC). This system is
based on the statement that each turn or even a subset of the corresponding time interval is
characterized by a set of typical driver’s inputs as well as a typical vehicle response.
Consequently, each dynamic steering maneuver can be divided into several time slots which
follow each other in a specific manner. To get an appropriate stabilization, the controller must
provide suitable intervention strategy.
This is why for the detection of severe steering maneuvers and a suitable anti-rollover control,
a hybrid dynamical system is used (Figure 82). The input, output and state of such a system is
composed of a discrete and a continuous part; the discrete dynamics D and the continuous
dynamics C.
Transitions between the discrete states are essentially influenced by the driver’s input and the
vehicle reaction. Continuous states vary over time dependent on the discrete state. They are
influenced by continuous inputs like the steering wheel angle, the lateral acceleration, the yaw
rate, the longitudinal velocity, the body slip angle, and other reference variables essential for
the rollover prediction.
In summary, the ESC with Rollover mitigation functions helps the driver to stay on the road and
to avoid obstacles, e.g. a car overtaking, by a specific yaw control. It also supports the driver
with an optimized lateral acceleration control to manage rollover critical situations.
This research has thrown up many questions in need of further investigation. For example, a
deeper look into the Hybrid Rollover Mitigation Controller. Also, a reasonable approach to
tackle this issue could be to assess the effects of the use of the HRMC in the high load
configurations. As PC-Crash does not offer the possibility to simulate this system yet, probably
this should have to be studied by producing real tests.

57
Analysis and Improvement of Security
Concerning Light Commercial Vehicles
4.6.3 Regarding Load Distribution
- Crash avoidance
On the results achieved it is possible to observe two very clear tendencies. Depending on the
height and distance to the front axle of the load, the consequences of the crash vary. The main
cause of accident on low cargo configurations is a crash against the roadside barrier, whereas
for higher configurations rollover has been found as the main problem.
The results of this study indicate that, regarding crash avoidance, there is a bigger influence of
a correct load distribution than the use of ESC.
As above figures shows, if the cargo is distributed in such a way that the centre of gravity of
the total cargo lies as close as possible to the longitudinal axis and is kept as low as possible,
the difference of the entrance speed could be more than twice between the best and the
worst scenario. This also accords with our earlier observations, which showed that high load
configurations reached the worst calcification possible on the SSF (rollover risk parameter).
Load Position SSF Star
Center load 1,13 ***
Front load 1,08 **
Load on rear axle 1,07 **
High Center load 0,90 *
High front load 0,86 *
High load on rear axle 0,86 * Table 28: Vans’ load distribution SSF
On the high cargo configurations it has been found lateral accelerations up to 10 m/s2 which
are far above from vans’ limit. Vehicle rollover has been found as the most frequent accident
due to incorrect load distribution.
In both situations, high and low cargo configurations, rear position excels as the worst option
while loading a van. Minor differences have been found between center and front capabilities
to avoid a collision.
455153
728789
0 20 40 60 80 100 120
2nd Generation Van (No ESP) [km/h]
Center Front Rear
High center High front High rear
465355
84105
108
0 20 40 60 80 100 120
3rd Generation Van (ESP) [km/h]
Center Front Rear
High center High front High rear

58
Analysis and Improvement of Security
Concerning Light Commercial Vehicles
- Crash severity
In case that the impact is unavoidable, has also been studied how the different options of
loading may increase or decrease the impact of the consequences. Simulating three 2nd
generations vans, with the same speed of entry (90 km/h), has been possible to obtain the
impact constellation, accident severity and injury potential of the three different low load
distributions.
Impact Constellation
Load position
Pre-impact velocity [km/h] Dir Vel. Vector direction[º] Δv Velocity change [km/h]
Center 18, 65 -21,77 6,93
Front 29, 54 -18,15 8.31
Rear 84,7(*) ---(*) ---(*)
Table 29: Center, Front and Rear Load configurations. Impact constellation
Accident Severity
Load position
EES [km/h] Number secondary impacts K Coefficient of restitution
Center 5,61 8 0,2
Front 8,36 7 0,2
Rear ---(*) ---(*) ---(*)
Table 30: Center, Front and Rear Load configurations. Accident Severity
Injury potential
Load position
Average acceleration suffered [g]
Daily living acceleration (sitting on a chair)[g]
Number of time daily living acceleration suffered[g]
Center 1,64 0,79 2
Front 7,05 0,79 9
Rear ---(*) ---(*) ---(*)
Table 31: Center, Front and Rear Load configurations. Injury Potential
(*) Data missing from the rear configurations is due that in this case, the van commits rollover instead of sliding and
colliding against the roadside barrier [Point 4.4]. Because of this, the pre-impact velocity refers to the speed at
which the van commits rollover.

59
Analysis and Improvement of Security
Concerning Light Commercial Vehicles
4.6.4 Regarding Load Distribution: Possible solution
It is important to remark that still, up to 25% of accidents involving vans and trucks can be
attributable to inadequate cargo securing [9]. If the cargo is not positioned and
secured adequately it can be a danger to others and to the passengers. Not secured
cargo could fall off the vehicle, cause traffic congestion or as it has been analyzed on
chapter 5, could hurt or kill you during strong braking or a crash. Also it has been
possible to observe that the steering of a vehicle is also affected by how the cargo is
distributed and/or secured on the vehicle, making it more difficult to control the
vehicle.
Legal requirements and common sense demand that all load carried on vehicles are secured,
whatever porpoise of the trip. Van drivers should be aware of the additional risk of the loaded
vehicle, or parts of the load, moving when the vehicle is being driven.
On the other hand, it still common to find that when any load is placed upon the vehicle, the
maximum authorized dimensions or the axle and maximum authorized weights are exceeded.
In this project this has been reflected on the front and rear load configurations, where the
respective axles were overloaded.
Axle reactions Front Configuration [Kg]
MAM Plated
Front Axle 1847 1750
Rear Axle 1453 1900
Axle reactions Rear Configuration [Kg]
MAM Plated
Front Axle 1363 1750
Rear Axle 1937 1900
Table 32: Front and Rear configurations. Axle reactions
An implication of these findings is that both load distribution and cargo securing should be
taken into account when loading a van.
The driving license required for freight transportations in a vehicle with a MAM lower than
3500 kg. in Spain is the same than the license required for a passenger car. In addition, is
necessary to pass an exam called B priority Transport (BTP) (required for example for
ambulances or taxi drivers) or another one called Professional capacity (for transportation of
goods).
On the other hand, and by making a review of the contents required to pass the exams, it has
been found a lack of information regarding load distribution and cargo securing. Those are the
points related to the load security found in chapter 11 of the manual for the BTP exam. [10]
- People transportation
• General rules
• Location and arrangement of people
- Load transportation
• General commandments
• Load position
• Load dimension

60
Analysis and Improvement of Security
Concerning Light Commercial Vehicles
• Load securing
• Load/Unload
• Maximum dimension, MAM
• Traffic signs
This information is summarized in just 4 out of 144 pages that the manual has. This contrasts
with the 208 pages of the European Comission Guideline on Cargo Securing for trucks.
Obviously, there are big differences between vans with a MAM of 3500 kg. and trucks that can
reach up to 40.000 kg.
However, it would of interest to introduce some of the results of this project and contents of
the guideline into the minimum knowledge requirements for a van driver. According to
European Commission Directive 2000/56 EC “Safety factors relating to the vehicle, the load
and persons carried” have to be contents of the driver license test for all categories of vehicles.
According to Directive 2003/59 EC of 15 July 2003 the training for "professional drivers" has to
contain (among many other issues):
ability to load the vehicle with due regard for safety rules and proper vehicle use
forces affecting vehicles in motion, use of gearbox ratios according to vehicle load and road profile, calculation of payload of vehicle or assembly, calculation of total volume, load distribution, consequences of overloading the axle, vehicle stability and centre of gravity, types of packaging and pallets
main categories of goods needing securing, clamping and securing techniques, use of securing straps, checking of securing devices, use of handling equipment, placing and removal of tarpaulins.
This general description of contents could be complemented with the results obtained on this
project, especially regarding forces affecting vehicles in motion, load distribution and vehicle
stability and centre of gravity. Furthermore, a training program on Cargo Securing for vans
would be effective.
Detailed information on the contents of cargo securing training is described in the German VDI
standard "VDI 2700, Blatt 1" or the “ ECE Guidelines for Packing of Cargo Transport Units". The
following recommendations are based on these standards and on the Eurpean Comission.
It is suggested that the personnel that should be trained is [9]:
Van drivers
personnel concerned with loading/unloading of vehicles (if not the driver)
fleet managers
personnel concerned with planning of itinerary, loading and unloading locations
At least in bigger enterprises it is recommended to have at least one person with a very high
qualification in cargo securing to support all other staff member in question of cargo securing,
or even giving internal training on cargo securing and to handle difficult problems which
cannot be solved by less trained staff members.

61
Analysis and Improvement of Security
Concerning Light Commercial Vehicles
Structure and contents of possible training for light commercial vehicles:
All training courses or lessons should be started by providing information on the basic issues of
cargo securing:
Legislation on cargo securing, responsibilities and technical rules.
National and international technical standards for cargo securing.
Physical principles, weights and forces.
Basic principles and methods of cargo securing.
Restraining material.
As one approach, the following types of cargo and other fields of knowledge may be grouped
in a useful way and distributed on different types of course elements to be combined to a
training measure fitting the customers’ needs:
Mixed cargo on pallets or similar transportation devices*
Mixes cargo directly loaded into the van (not palletised load)*
Stacked cargo
All cargo with securing problems deriving from its shape (e.g. drums, rolls, tubes, sacks, etc.)
Sheet material (steel sheets, glass, concrete) in vertical, almost vertical and horizontal position
And finally, and with special attention in this study:
Exact calculation methods for cargo securing
Load distribution plan
(*)On the following chapter, it has been studied how unsecured cargo on pallets and directly
load into the load compartment affects the vans’ dynamic behaviour.

62
Analysis and Improvement of Security
Concerning Light Commercial Vehicles
Chapter 5. Unsecured load
The study of the changes in braking deceleration and driving behaviour of heavily loaded
delivery vans [4] that was carried by EVU provides in-depth analysis of the braking capabilities
of a van. The tests were conducted in dry summer weather conditions on dry asphalt with
speeds between 70 – 90 km/h.
While conducting the third test, it was found that the load, despite being lashed, crashed
through the partition wall into the passenger compartment. Because of this, the driver was
hurt slightly by glass fragments stemming from the glass pane built into the partition wall.
Further tests with overload were abandoned and the van was cleared of load. A deeper study
has been done to examine the effects of unsecured cargo on an emergency braking situation.
Figure 83: Partition wall
Vehicles are generally regarded as rigid bodies for the simulation of traffic accident collisions
with kinetic 3D simulation programs. This simplification is reasonable for the simulation of
vehicle - vehicle collisions, vehicle - trailer collisions and vehicle collisions with rigid obstacles
such as trees or roadside barriers. However, for vehicle cargo collisions inside the vehicle, this
simplification does not allow the motion to be accurately modeled. Multibody simulations is
required.
5.1 Simulation description Simulation pretends to recreate the test done by EVU. As mention before, tests were
conducted in dry summer weather conditions on dry asphalt which can represent a coefficient
of friction µ=0.8. Therefore the maximum deceleration is 7,85 m/s2.
The hypothetic load consists of 1 tone mass which leads to a total weight of 2871 kg. The
geometry is defined by a block with 1 meter length in x,y and z direction. The moments of
inertia are calculated automatically whereas the stiffness S of the body, defined as a measure
of the resistance offered by an elastic body to deformation has been calculated by:
𝑆 =𝑃
δ
Where
- P is a steady force applied on the body
- δ is the displacement produced by the force

63
Analysis and Improvement of Security
Concerning Light Commercial Vehicles
It has been assumed a deformation of 1 cm=1/100 m. which leads to a coefficient of stiffness
of 1.000.000 N/m. Figure 84 shows the parameters in Pc-Crash.
Figure 84: Pc-Crash Multibody parameters
The coefficient of friction between the multibody load and the van has been specified
following the friction tables found on the European Commission of transport [9]. Obviously,
the higher the friction coefficient, the better friction forces contribute to the securing. The
best option to determinate the real friction between vehicle and load is to measure it. The
values used may be considered as a rule of a thumb if such measurement is not possible. These
values will also be only applicable, if the load platform is in good condition, clean and dry.
In this simulation has been compared two different vans, with the only difference that one has
secured cargo whereas the other it is only held by the friction between the load and the
platform. On one side, the first van has been configured in the same way that was done on
previous tests. This means that the load is added in the front part of the load compartment
and afterwards the new center of gravity has been calculated.
On the other hand, the unsecured situation has been modeled by adding the multibody block
inside the van. The load’s centre of gravity has been located at 0,5 m above the load platform
and 2.26 m from the front axle. By doing that it has been possible to obtain the same initial
CoG for both vehicles.
5.2 Secured:
Kerbweight Van (1871 kg.): Load (1000 kg.):
CoG to Front Axle= 1,26 m. CoG to Front Axle= 2,26 m.
hCoG = 0,42 m. hCoG = 0,5 + 0.3= 0.8 m.(*)
*The load platform is at 0.3 m. height
referred to the ground.
420 mm
1260 mm Figure 85: Secured Cargo.Load position

64
Analysis and Improvement of Security
Concerning Light Commercial Vehicles
Kerbweght + Load:
mmxCoG 16082871
2260·10001260·1871
mmhCoG 7,551
2871
800·1000419·1871
CoG to Front Axle= 1,61 m. hCoG = 0,55 m.
5.3 Unsecured cargo:
By adjusting x and z position with Pc-Crash, it has been possible to achieve the same starting
CoG for the unsecured cargo congifuration.
Figure 86 shows how the load is positioned at 2.26 m. on the longitudinal direction from the
front axle of the van (1,26 m. + 1m.) and also zmin indicates that the load is on the vans’
platform.
5.3.1 Load type. Friction coefficient.
In order to represent different situations, two different loads have been simulated. First of all,
it has been considered that the load is supported by a Euro-pallet (ISO 445-1984), which is the
most common pallet used for good transportation. It is made primarily of wood, and the
standard dimensions are 800x1200x150 mm.
The pallet constitutes a load carrier similar to a load platform without sideboards. Measures to
prevent the cargo from sliding or tipping in relation to the pallet should be taken by lashing.
The friction between the surfaces of the cargo and pallet are therefore important for
calculating the cargo securing. Once the cargo is secured in relation to the pallet, it has been
found the presumable friction coefficient between the wooden pallet and the load platform
(steel). µstatic is friction between two solid objects that are not moving relative to each other.
µdynamic occurs when two objects are moving relative to each other and rub together and it has
been considered as 0.7· µstatic.
Material combination in the contact area Friction coefficient µstatic
Wooden pallet against steel 0.4
Table 33: Pallet friction
Vans’CoG
Load
Figure 86: Unsecured Cargo. Multibody system.

65
Analysis and Improvement of Security
Concerning Light Commercial Vehicles
Afterwards, it has been considered that the load is basically painted flat metal sheets of mixed
sizes. Usually, the load platform of the van is also painted, so the friction coefficient
considered is the painted rough metal sheet against painted rough steel.
Material combination in the contact area Friction coefficient µstatic
painted rough metal sheet against painted rough steel 0.3
Table 34: Meta sheet friction
Like the tests that were run by EVU, the simulation represents a full break sequence after 2
seconds at 90 km/h. As happened on the deceleration test done on the Van vs. Car
comparative, the stop criterion is defined when the vehicle reaches a low energy value, which
usually is between 0.3 and 0.4 km/h.
5.4 Results
5.4.1 Euro-pallet
The first thing that has been possible to notice is that due to the move of the load, the total
distance required by the van with unsecured cargo increases. In this case, the difference
between each van is approximately 5 meters. Figure 88 shows how the blue van (unsecured
load) needs 95.06 meters to stop whereas the red one (secured load) needs 89.98 meters.
Figure 87 also shows how the load transfer increases the speed from 69,02 km/h to 71,92
km/h on the moment that the load impacts against the vehicles’ interior.
Figure 87: Unsecured load. Velocity diagram. Figure 88: Unsecuerd load. Final position.
Figure 88 shows that the 5 meters correspond to almost the length of the van (5,4 meters).
The pink colour of the load system indicates, as mentioned before, that there has been an
impact between the load and the van. At 0,75 seconds after pressing the breaks, this impact
has produced a peak longitudinal acceleration on the vehicle of 40,57 m/s2, from a
deceleration of -7,85 m/s2 to an opposite acceleration of 32,72 m/s2.

66
Analysis and Improvement of Security
Concerning Light Commercial Vehicles
Figure 89: Longitudinal acceleration with euro-pallet. Figure 90: Longitudinal acceleration with metal sheet.
5.4.2 Metal sheet
As happened on the load positioned above the euro pallet, while carrying metal sheets it has
also been found an increase of the total breaking distance. This distance is also approximately
5 meters but in this case a higher velocity change has been found, from 70, 84 km/h to 74,41
km/h. As figure 90 shows, due to the less friction between the cargo and the load platform, a
higher acceleration has been found on the vehicle. The longitudinal acceleration suffered on
the vehicle is 60.6 m/s2, which is 50% bigger than the previous simulation.
The change of the loads’ speed generates forces. In other words, the only situation where a
cargo does not exert any force on its environment (understood as the load compartment) is
while driving in a straight line at a constant speed. The higher deviation from this situation the
stronger are the forces that the cargo exerts upon the load compartment. In a breaking
situation like the simulation done, those forces increase the velocity and the breaking distance
of the van. In these situations friction alone is seldom sufficient to stop unsecured cargo from
sliding. It would be incorrect to assume that the weight of the load will be sufficient to keep it
in position.
5.4.3 Partition wall
During this heavy braking simulation for instance, the force exerted by the cargo towards the
front of the vehicle is very high and nearly equal the weight of the cargo [9]. So, it can be
assumed that during heavy braking, a 1 tonne load will “push” forward the partition wall with
a force of:
1000 𝑘𝑔 · 9,81𝑚
𝑠2= 9810 𝑁
Following the ISO norm ISO/DIS 27956 the partition shall at least cover the driver’s seat
including head restrain in the upper position, and be able to resist whatever cargo reaching
forwards due to the vehicle’s deceleration on at least 10m/s2.On the other hand, greater forces
may be encountered if the van is involved in an accident. Even at low speed it has been
possible to observe higher accelerations.
Friction alone cannot be relied upon to prevent unsecured cargo from sliding. When the
vehicle is moving, vertical movements caused by bumps and vibrations from the road will
reduce the restraining force due to friction. Friction can even be reduced to zero if the load
momentarily leaves the bed of the truck. Correct lashings or other restraining methods, in
addition to friction, must be installed for an adequate cargo securing.

67
Analysis and Improvement of Security
Concerning Light Commercial Vehicles
Chapter 6. Cost-Benefit Analysis
6.1 Effectiveness of the ESC. Estimation for vans. It has been proved the effectiveness of the Electronic Stability Control in different load
distributions; therefore it is important to know if the implementation of this system carries a
social benefit. This Cost-Benefit study has been based on previous studies, but for the first
time it has been done just for commercial vehicles.
The study of Effectiveness of Electronic Stability Control Systems in Great Britain that was
carried out by R.Frampton and P. Thomas [11] starts from the analysis of 890.648 cars of which
8.685 were equipped with ESC. This represents one of the largest datasets available for this
type of analysis. However, there have been no controlled studies which compare differences in
the use of ESC for vans. For this reason, and given the relative similarity found between cars
and vans in chapter 3, it has been decided to use the same model and parameters.
R.Frampton and P. Thomas Model
The case control approach also requires a set of crash types where there is an expectation that
ESC will have no effect to be used as a control group. The data provided by R.Frampton and
T.Thomas [11]includes several categories of vehicle manoeuvres where one car was essentially
stationary before the crash. These were selected to be the control group of manoeuvres. Table
35 shows also the other collision types.
Control Manoeuvre types (no ESC effect)
Other Manoeuvres (ESC effect possible)
Reversing Parked Waiting to go ahead but held up Stopping Starting Waiting to turn left Waiting to turn right
U turn Turning left Turning right Changing lane to left Changing lane to right Overtaking moving vehicle on it's offside Overtaking stationary vehicle on it's offside Overtaking on nearside Going ahead left hand bend Going ahead right hand bend Going ahead other
Using the case-control methodology the cars in the sample are distributed between the four
case-control categories as shown in Table 35.
Control Maneuvers’ types Other Maneuvers type
Case Vehicles (ESC) Nxx Nxy
Control Vehicle (no ESC) Nyx Nyy Table 35: Case-Control Maneuvers
It should be noted the case-control method does not assume that vehicles are in the same collision.

68
Analysis and Improvement of Security
Concerning Light Commercial Vehicles
Firstly, the method calculates the probability of a case car being involved in the two crash
types (Eq. 1).
𝑃𝑟𝑜𝑏𝑎𝑏𝑖𝑙𝑖𝑡𝑦𝐸𝑆𝐶 = 𝑁𝑥𝑥
𝑁𝑥𝑦
Then the Probability ratio is used to compare the two groups of cars (Eq. 2).
𝑃𝑟𝑜𝑏𝑎𝑏𝑖𝑙𝑖𝑡𝑦 𝑅𝑎𝑡𝑖𝑜 =𝑃𝑟𝑜𝑏𝑎𝑏𝑖𝑙𝑖𝑡𝑦𝐸𝑆𝐶𝑃𝑟𝑜𝑏𝑎𝑏𝑖𝑙𝑖𝑡𝑦𝑛𝑜𝐸𝑆𝐶
= 𝑁𝑋𝑋
𝑁𝑥𝑦
𝑁𝑦𝑦
𝑁𝑦𝑥
Finally effectiveness of ESC is defined in (Eq. 3)
𝐸𝑓𝑓𝑒𝑐𝑡𝑖𝑣𝑒𝑛𝑒𝑠𝑠𝐸𝑆𝐶 = 1 − 𝑃𝑟𝑜𝑏𝑎𝑏𝑖𝑙𝑖𝑡𝑦 𝑟𝑎𝑡𝑖𝑜 · 100%
The results using this model and also provided by the Real Automóvil Club de Catalunya (RACC)
are:
Cases Effectiveness
All Slight injures Severe injures Dead
All type of accidents 7% 6% 11% 25%
Road surface - Wet - Dry - Snow or ice
7% 5% 19%
7% 5% 19%
22% 3% 30%
38% 17%
Sliding Rollover
21% 33%
21% 33%
33% 59%
Gender - Men - Women
7% 5%
6% 4%
10% 15%
48% 19%
Impact - Frontal - Lateral
10% 9%
10% 7%
2% 22%
23% 27%
Table 36: ESC Effectiveness
6.2 Effectiveness of ESC on the reduction of victims for vans For the estimation of the economical impact that the installation of the ESC produces it has to
be excluded the accidents were pedestrians, bicycles, mopeds and motorbikes were
implicated. The data provided in the introduction of this project for both countries, Spain and
Denmark, only concerns to the driver and passengers of the van so it can be considered that
the requirement has been full fit.
Table 37shows the total number of injured and dead people inside vans in Spain for 2006.
Source: DGT Injured
Victim role Total Dead Total Severe Slight
Diver 4.030 153 3.877 618 3.259
Passenger 2.954 77 2.877 451 2.426
Total 2006 6.984 230 6.754 1.069 5.685
Table 37: Van victims in Spain 2006

69
Analysis and Improvement of Security
Concerning Light Commercial Vehicles
On the other hand, for Denmark it has been only possible to find the number of total severe
and slight injured persons also for year 2006.
Source: statisk banken Injured
Victim role Total Dead Total Severe Slight
Diver 21
Passenger 3
Total 2006 330 24 306 110 196
Table 38: Van victims in Denmark 2006
Assuming that the estimated effectiveness for the United Kingdom would not be different that
the one that could be found in Spain and Denmark, it has been applied the effectiveness ratios
found on the study made by R.Frampton and P.Thomas. If in 2006 all the vans (100%) in Spain
and Denmark have had ESC system the number of victims would have been reduced as
follows:
Spain
Year 2006 ESC efectiveness Reduction Victims with ESC in all the vans
Total 6.984 7% 489 6.495
Dead 230 25% 58 172
Severe injured 1.069 11% 118 951
Slight injured 5.685 6% 341 5.344
Table 39: Victim reduction Spain
Denmark
Year 2006 ESC efectiveness Reduction Victims with ESC in all the vans
Total 330 7% 23 307
Dead 24 25% 6 18
Severe injured 110 11% 12 98
Slight injured 196 6% 12 184
Table 40: Victim reduction Denmark
Taking as a reference the study done by RACC it is also important to analyse the result with
different stock penetration of the ESC. Calculations have been done again assuming 70, 50%,
25% and 10% of implementation on the vans.
Spain
Denmark
100% 75% 50% 25% 10% Total 307 313 318 324 328
Dead 18 20 21 23 23
Severe injured 98 101 104 107 109
Slight injured 184 187 190 193 195
Table 42: Implementation ESC Denmark
100% 75% 50% 25% 10% Total 6.495 6.617 6.739 6.862 6.935
Dead 172 187 201 216 224
Severe injured 951 981 1010 1040 1057
Slight injured 5.344 5429 5515 5600 5651
Table 41: Implementation ESC Spain

70
Analysis and Improvement of Security
Concerning Light Commercial Vehicles
6.3 Social benefit from the implementation of ESC for vans Accidents obviously represent a cost for society. Therefore a monetary value should be given
to them.
- Costs in Spain
The cost in Spain for accidents involving dead, slight and serious injuries is considered and
taken from Lladó and Roig in the RACC study [1].
These costs estimated for 2004 were:
2004 Dead Severe injuries Slight injures
Victims Cost (€) 565.059 118.681 32.355
Table 43: Victims social cost Spain 2004
with a percentage annual increase for each year of:
2004-2005 2005-2006
3.7% 2,9%
These costs estimated for 2006 are:
2006 Dead Severe injuries Slight injures
Victims Cost (€) 602.959 126.641 34.525
Table 44: Victims social cost Spain 2006
- Costs in Denmark
The same procedure for Denmark from the data taken from procvejdirektoratet.dk.
These costs estimated for 2001 were:
2001 Dead Severe injuries Slight injures
Victims Cost (DKK) 8.223.000 850.000 232.000
Table 45: Victims social cost Denmark 2001
with a percentage annual increase for each year of:
2001-2002 2002-2003 2003-2004 2004-2005 2005-2006
2,4% 2,1% 1,2% 1,8% 1,9%
Accident costs for year 2006:
2006 Dead Severe injuries Slight injures
Victims Cost (DKK) 8.953.308 932.925 254.633
Victims Cost (€) 1.193.744 124.390 33.951
Table 46: Victims social cost Denmark 2006
If the results obtained from the estimation of victims are multiplied by the cost of each, it is
possible to obtain the total costs in relation to the stock implementation. Therefore, the social
savings have been obtained by the difference between (1) and each stock penetration.

71
Analysis and Improvement of Security
Concerning Light Commercial Vehicles
Spain
Millions of € No ESC (1) 100% (2) 75% (3) 50% (4) 25% (5) 10% (6)
Total 470 409 424 440 455 464
Dead 139 104 113 121 130 135
Severe injuries 135 120 124 128 132 134
Slight injuries 196 185 187 190 193 195
Table 47: Costs related to % implementation Spain
Millions of € 100% (1)-(2) 75% (1)-(3) 50%(1)-(4) 25% (1)-(5) 10% (1)-(6)
Total 61 46 30 15 6
Dead 35 26 18 9 4
Severe injuries 15 11 7 3 1
Slight injuries 11 9 6 3 1
Table 48: Savings related to % implementation Spain
Denmark
Millions of € No ESC (1) 100% (2) 75% (3) 50% (4) 25% (5) 10% (6)
Total 49 40 43 44 47 48
Dead 29 21 23 25 28 28
Severe injuries 14 12 13 13 13 14
Slight injuries 7 6 6 6 7 7
Table 49: Costs related to % implementation Denmark
Millions of € 100% (1)-(2) 75% (1)-(3) 50%(1)-(4) 25% (1)-(5) 10% (1)-(6)
Total 9 6 5 2 1
Dead 8 6 4 1 1
Severe injuries 2 1 1 1 0
Slight injuries 1 1 1 0 0
Table 50: Savings related to % implementation Denmark
Once the savings for each country have been calculated it is necessary to know the costs of the
installation of the ESC. According to Bauman, Grawenhoff and Geisler [12] the cost of
equipping a car with ESC is stated with 130 €. This reflects the additional equipment costs for
ESC as an addition to an existing Antilock Braking System (ABS). This figure is not the costumer
price. The value refers to the production and installation costs since is the appropriate figure
in CBA from a society’s point of view because it reflects the resource consumption. As all the
vans are equipped also with ABS system, it has been considered that the cost of installation
would be the same that in a car.

72
Analysis and Improvement of Security
Concerning Light Commercial Vehicles
By following the formula proposed by Bauman, Grawenhoff and Geisler:
𝒈 = 𝑲𝒐 ·𝒊 · 𝟏 + 𝒊 𝒏
𝟏 + 𝒊 𝒏 − 𝟏
where:
g = annual cost K0=investment cost i=discount rate (5%) n=lifetime of a vehicle (12 years)
Considering that there are approximately 2.435.706 vans in Spain and 459.082 in Denmark
(see chapter 1) there is an investment cost K0 of 317 million€ and 60 million€ respectively. By
applying again the implantation percentage it is possible to find the benefit for each option:
Spain
Implementation Social Savings (million €) Annual Cost (million €) Benefit (million €)
10% 6 4 2
25% 15 9 6
50% 30 18 12
75% 46 27 19
100% 61 36 25 Table 51: Benefit Spain
Denmark
Implementation Social Savings (million €) Annual Cost (million €) Benefit (million €)
10% 1 0.7 0.3
25% 2 1.7 0.3
50% 5 4 1
75% 6 5 1
100% 9 7 2 Table 52: Benefit Denmark
6.4 Evaluation of the Cost-Benefit of ESC in Spain and Denmark From the analysis of the introduction of ESC for vans in Spain and Denmark and taking into
account the objectives and methodology raised to develop, it is possible to highlight a number
of data related with the potential safety and cost-benefit.
ESC safe lives. Can be considered the most important safety development since the seatbelt
[NHTSA]
- Considering 100% of implementation, approximately 58 passengers and van drivers
could have saved his live. 6 in the case of Denmark.
Even with the lowest implementation, there is a social benefit.
- 2 million € in Spain in contrast to the 0.3 million€ in Denmark. This is due basically to
the difference on inhabitants and total number of registered vans. Nevertheless, it is
considered beneficial to society in both countries.

73
Analysis and Improvement of Security
Concerning Light Commercial Vehicles
Conclusions
The result of several simulations shows that even the 2nd generation van gets the worst results
in each test, the values obtained can be compared to the ones reached by modern passenger
cars. This does not mean that light commercial have similar dynamic properties than the rest
of the vehicles, specially when it is loaded, but indeed contradicts the widespread opinion that
they are really far from a passenger car.
There is a consistent picture of the ESC with remarkable safety benefits and proof the positive
impact, especially on the low cargo configurations. On the other hand, one of the more
significant findings to emerge from this study is the slight effect on the high CoG cargo
configurations, where ESC has not been able to counteract the high rollover tendency. The
evidence from this study suggests that, regarding crash avoidance, there is a bigger influence
of a correct load distribution than the use of ESC in vans loaded with a high CoG. The ESC with
Rollover Mitigation function should be studied as a support for the van driver in rollover
critical situations.
Furthermore it’s a common misunderstanding that heavy cargo needs to be less or none
secured, due to the weight. Friction alone cannot be relied upon to prevent unsecured cargo
from sliding.On a fully breaking situation the total distance required by the van with unsecured
cargo increases considerably. Correct lashings or other restraining methods, in addition to
friction, must be installed for an adequate cargo securing.
Even with the lowest percentage of implementation of ESP, there is Social benefit for both
countries studied. This is 2 million € in Spain in contrast to the 0.3 million€ in Denmark.
Difference is basically due to the total number of registered vans. Nevertheless, it is
considered beneficial to society in both countries.

74
Analysis and Improvement of Security
Concerning Light Commercial Vehicles
Environmental impact
Nowadays, the environmental impacts of human activity is quantified mainly by emissions of
CO2 emitted, causing the greenhouse effect due to the waste generated.
In this project the waste generated is almost null and CO2 emissions are derived primarily by
the consumption of electricity. For the estimated grams of CO2 emitted into the atmosphere
per kWh has been taken into account the current Spanish energy system.
Energy Source % of the production g CO2 per kWh
Gas Natural 18,80% 365
Nuclear 22,40% -
Carbon 30,30% 950
Fuel-Oil/Gas 3,80% 802
Renewable Energy 24,70% -
From table it follows that the amount of 387 grams of CO2 are emitted into the atmosphere
per kWh produced. To simplify the calculations it has been ignored the losses from the
electricity and assume that the 100% of what is consumed comes from the plant. The start of
this project was in December 2008 and ended in April 2009 which has a total of 151 days.
According to the calendar this amount is reduced to 86 days where is considered an average of
6 hours per day:
Consumption
[kWh] Hours g CO2/h g CO2
Laptop 0,1 516 38,7 19969,2
TFT Screen 0,017 516 6,579 3394,76
75
Analysis and Improvement of Security
Concerning Light Commercial Vehicles
References 1. Ulykker ned store varebiler Rapport nr. 3. Danish Road Traffic Accident Investiagion Board.
2005.
2. Cost-Benefit of ESC in Spain. RACC. 2007.
3. New Sliding Tests and Evaluation of the ESC Simulation Model in Pc-Crash. Dr.Andreas
Moser, Dr. Hermann Steffan. s.l. : EVU, 2008.
4. Transparencias de Vehiculos. Mestres, Francisco Liesa.
5. Changes in breaking deceleration and driving behaviour of heavily loaded delivery vans.
Weber, Michael. s.l. : EVU, 2007.
6. Ingenieurbüro Nakas und Hege (IBNuH). Hege, Dipl.-Ing. Viktor Nakas Dipl.-Ing. Martin.
7. Dossier Loisir. Automobile. 2004, págs. 128-129.
8. Reportagem Superteste de travagem a 15 modelos. Autofoco. págs. 18-22.
9. Safety and Performance Enhancement:The Bosch Electronic Stability Control (ESP). E. K.
Liebemann, K. Meder, J. Schuh and G. Nenninger. 2004.
10. European Best Practice Guidelines on Cargo Securing for Road Transport. European
Comission. Directorate general for energy and transport.
11. Manual B Tranporte Prioritario. Editorial Pons. 2008, págs. 89-93.
12. The accident reduction effectiveness of ESC equipped cars in Great Britain. Thomas, Pete.
Loughborough University : s.n.
13. Cost-Benefit Analysis of the Electronic Stability Program. Prof. Dr. Herbert Baum, Dr. Sören
Grawenhoff, Dr. Torsten Geisler. University of Cologne : s.n., 2007.
Other References
Lateral Dynamics of Commercial Vehicle Combinations. Dept. of Automob. Eng, Technical
University of Brno, Brno, Czechoslovakia.
Roll-Over Prevention System for Commercial Vehicles - Additional Sensorless Function of the Electronic Brake System László Palkovics; Ákos Semsey; Eduard Gerum
Frontal Occupant Kinematics and Airbag Role, Jean-Luc Blancou
Pc-Crash Operating Manual, Version 8.1 November 2007© Dr. Steffan Datentechnik
Linz, Austria
Braking Force Transfer Capabilities of Tires on Wet Roads Dr. Andreas Topp, Norbert Kendziorra, Dr. Burkhard Wies, Dr. Holger Lange _c 2008 by EVU

76
Analysis and Improvement of Security
Concerning Light Commercial Vehicles
Design of experiments and parametric sensitivity of planar impact mechanics Raymond M. Brach,University of Notre Dame 2007 by EVU Geometrical modelling of road sections for driving dynamics simulation Miha Ambrož, Gašper Šušteršič, Simon Krašna, Ivan Prebil Möglichkeiten und Grenzen der Kollisionsanalyse Werner Gratzer, DWG Sachverständigen-Büro Gratzer Precision in estimation time of driver reaction in car accident reconstruction Tomasz Lech Staoczyk, Rafał Jurecki Kielce University of Technology 2007 EVU Road Safety in Europe Yves Page, Thierry Hermitte, Jean-Luc Blancou 2008 by EVU The Early Life Skid Resistance of Road Surfaces, Peter G. Roe PC-Crash Operating Manual, Dr.Steffan Adtentechnik, Linz, Austria November 2007. Pc-Crash Handbook, Jasper Traets.

77
Analysis and Improvement of Security
Concerning Light Commercial Vehicles
Acknowledgments
First of all, I would like to thank Thomas and Per, my supervisors from Dan-Crash for giving me
the opportunity to develop this project. This would never have been possible without you (and
without almost 200 emails sent both directions). Also, I would like to thank Tove from DTU for
giving me the chance and the motivation to do this Master Thesis. I can’t forget Adria, my
advisor at UPC, and thank him for his support.
I would like to thank my family for all their support, especially to my parents Jesús and Teresa
and my sister Marta, who encouraged me to go abroad to do my Master Thesis and were
always giving me the best of them.
Also, I would like to thank all my friends in DTU. Nikolas, Pablo, Adrián, Guillermo, Reynald,
Joan, Joao, Ramon, Dimitris, Tomas, Sara… Without them these lasts months in Denmark
would not have been the same.
I can’t forget my friend back home, Alex, Victor, Cristian, Roger, Javi, Guille and Pepe and all
the good times we shared together before coming to Denmark and the time that we will share
in the future.
And last but not least, I have to thank my girlfriend Elisabeth, for supporting me all this time,
for being patient and helping a lot despite the distance. After those months abroad, it was easy
to understand why she is the most important part of my life.

Appendices
A. Pc-Crash software description PC-Crash program has been designed to perform calculations connected with reconstruction of
road accidents. It helps to simulate motions and collisions of vehicles and biomechanical
objects. It is also a very convenient tool for time-distance analysis of an event.
It is possible to simulate any complex motion of vehicles, collisions as well as accidents
involving pedestrians, collisions of single track vehicles and motion of vehicle occupants. In
general, is it possible to simulate how the event happened.
Pc-Crash has another great advantage. The friendly work environment not only makes it easily
communicate with the program, but also helps to interpret the calculation results almost
immediately since the results are currently translated from the numerical language into
graphic form.
On the other hand, the user’s knowledge and caution are indispensable before presenting the
results. It is not possible to use Pc-Crash program without profound knowledge of its
operation, abilities and limitations and without substantial practice in using it.
It was created at the Institute of Mechanics of the Univesity of Technology of Graz, Austria.
The author of the original idea and basic physical models was Prof. Hermann Steffan, further
assisted by Dr. Andreas Moser and Wolfgang Neubauer. The program is constantly upgraded
and developed at Dr. Steffan Datentechnik Company.
1. Physical assumptions of the program A number of physical models were applied and certain assumptions and simplifications were
adopted. In Pc-Crash the vehicle is modelled as a rigid body of six degrees of freedom. The
wheels are zero-mass, suspended independently, neglecting the mechanical systems through
which the kinematics of real suspensions are carried out. A “flat model” of the vehicle will
refer to a vehicle of three degrees of freedom, in which the height of CG position has been
declared 0, while a “3D model” will refer to a vehicle of six degrees of freedom which the
height of CG position is greater than 0.
2. Co-ordinate systems Two right-handed co-ordinate systems have been introduced: a global one rigidly connected
with the environment and a local on strictly connected with the body, the origin of which is
fixed at the vehicle mass centre. The angles of rotation are measured according to the right
handed global coordinate system.
Y
Ψ > 0
X

ii
Analysis and Improvement of Security
Concerning Light Commercial Vehicles
3. Forces and moments acting on the vehicle
A vehicle is acted by the following external forces:
- Resistance of motion:
o Air
o Grade
- Forces of roadway reaction on the wheel (vertical, transverse and longitudinal)
- Forces of mass
- Forces of collision
Rolling resistance can be introduces by braking of wheels but only when the vehicle is not
powered by the engine.
a. Air resistance
The air resistance force is described by the Equation:
𝐹𝑎 =𝜌 · 𝐶𝑥 · 𝐴 · 𝑉2
2
Where:
ρ = 1,3 *Kg/m3] - air density
Cx - Drag coefficient
A - Cross-sectional area of the vehicle, in [m2]
V - air relative velocity (simply vehicle velocity), in [m2]
b. Grade resistance
A vehicle can move on a plane sloping at any angle. The grade can be established by shaping a
3D road object or calculating separate areas.
c. Roadway-wheel reactive forces
The reactive forces are determined during simulation according to the given conditions of
motion, considering the local adhesion and road slope. Most often the car is activated by
assigning acceleration forces on particular wheels, or optionally, acceleration can be
simulated by using the engine characteristics and power transmission ratios.

iii
Analysis and Improvement of Security
Concerning Light Commercial Vehicles
4. Correction of braking forces
In Figure the following notation has been used:
Xp - tangent longitudinal force on front axis wheels
Xt - tangent longitudinal force on rear axis wheels
Zp - dynamic vertical reaction on front axis wheels
Zt - dynamic vertical reaction on rear axis wheels
Dynamic vertical reactions during braking can be determined by:
𝑍𝑝 = 𝐺 𝑧
𝑙+ 1 −
𝑏
𝑙
𝑍𝑡 = 𝐺 𝑏
𝑙− 𝑧
𝑙
Where:
G = m·a - Vehicle actual weight
Z = 𝑎
𝑔 - braking intensity (relative deceleration)
b - distance of CG from front axle
h - CG height
l - axle base
If mass is distributed symmetrically in reference to the longitudinal axle (such assumption was
adopted in the program), the vertical reaction on particular wheels during straight-line motion
will be twice weaker than those corresponding axles:
B = m·a
h
b l
G
Zp Zt Xt Xp

iv
Analysis and Improvement of Security
Concerning Light Commercial Vehicles
𝑍0 = 𝑍1 =𝑍𝑝
2=
𝐺
2 𝑧
𝑙+ 1 −
𝑏
𝑙
𝑍2 = 𝑍3 =𝑍𝑡2
=𝐺
2 𝑏
𝑙− 𝑧
𝑙
The model of braking forces used in the program refers to planar simulation (h>0).
The coefficient of braking forces distribution has been defined by Equation:
𝜑 =𝑋𝑡
𝑋𝑡 + 𝑋𝑝
It gives information on the proportion of the breaking force of rear axle wheels in the total
braking force.
To design a perfect breaking system, the breaking force distribution would have to be designed
in such a way that the longitudinal force on the given axle was always, regardless of breaking
intensity, proportional to the real vertical force on this axle. An ideal distribution of the rear
brake force is described by a parabola:
𝑞𝑡 𝑖𝑑 = 𝑋𝑡 𝑖𝑑
𝐺=
𝑧 · 𝑍𝑡𝐺
= 𝑧 𝑏
𝑙− 𝑧
𝑙
𝑞𝑡 𝑖𝑑 = 𝑧 𝑏
𝑙− 𝑧
𝑙
𝑧 =𝑎
𝑔
Ideal distribution of rear brake force.
As follows from Equation the shape of the parabola depends on the CG position.
Regulations No. 13 of ECE (Economic Commission for Europe) require that in all cars admitted
in traffic in Europe, in the whole range of breaking intensity (i.e. z= 0 – 0,8) the first to slip are
the front wheels, and rear only after brake pedal is pressed harder.

v
Analysis and Improvement of Security
Concerning Light Commercial Vehicles
In Pc-Crash a linear corrector with a “knee-point” for rear wheels has been modeled because
this type of braking forces correction is used in the majority of vehicles, including almost all
Van’s produced at the present.
qt
qt id qt’’
qt’
Z1 0,8 Z0 𝑧 =𝑎
𝑔
Figure shows characteristics of rear brake force qt id corrected ideally an characteristics of real
braking force using corrector on rear wheels qt’ and qt’’.
5. Tire model Pc-Crash includes two tire models: a simple linear model and a non-linear model called “TM-
Easy”.
In the linear model the transverse component of the force Yi is linearly dependent on the
actual slip angle αi and can be expressed by Equation:
𝑌𝑖 = µ𝑖𝑍𝑖𝛼𝑖
𝛼𝑖 𝑚𝑎𝑥
Parameter αi max describes a slip angle at which the unbraked wheel reaches maximum possible
lateral force Yi max = µ Zi (where Zi is the vertical force on the wheel).
TM-Easy tire model allows to model non linear effects. Those are the tire parameters that need to be specified independently.
Fmax: The peak frictional force value. The maximum friction is this value multiplied by the
specified scene friction coefficient.
Smax: The slip value at which Fmax occurs. For lateral tire properties, the x-axis of the tire
model graph is tan (α), where α is the lateral slip angle.
Fslip: The sliding frictional force value. The maximum friction is this value multiplied by the
specified friction coefficient.
Sslip: The slip value at which F slip occurs.
Fop: The slope of the tire model curve at the origin.

vi
Analysis and Improvement of Security
Concerning Light Commercial Vehicles
In general it can be said that the lateral slip angle of the tyre causes the lateral tyre force. The
lateral tyre force increases with an increasing lateral slip angle, with a maximum depending on
the tyre-road surface friction coefficient.
When switching from the linear tire model to the TM-Easy tire model, the change in vehicle
motion will be due almost entirely to the difference between the specified Fslip value and 1.
This is because the default coefficient of friction is the sliding value when using the Linear tire
model, but is the static value when using the TM-Easy tire model and Fmax = 1.
6. Wet friction between tire and road Pc-Crash makes it possible to use models of both dry and wet friction. Maximum attainable
deceleration on a wet road is a function of velocity and is usually described by hyperbolic
function. The input values to be applied are deceleration are velocities of 20 km/h (a20) and 80
km/h (a80). On this basis the program calculates parameter n and A to determinate
deceleration as a function of velocity:
𝑛 = 2 − 𝑙𝑛
𝑎1
𝑎2
𝑙𝑛𝑣1
𝑣2
𝐴 = 𝑎1 · 𝑛
2· 𝑣1
2−𝑛
a = a v = 2·A
n· v2−n , n>2
where:
a1 = a20
a2= a80
v1 = 20 [km/h] = 5.6 [m/s]
v2 = 80 [km/h] = 22.2 [m/s]
a = vehicle deceleration
To avoid errors when calculating deceleration curves at low velocities, restriction of friction
coefficients to dry friction has to be done.
7. Moment of inertia These are the moments of inertia of the vehicle about its three main axes:
- Yaw, about the vertical axis
- Roll, about the longitudinal axis
- Pitch, about the transverse axis.

vii
Analysis and Improvement of Security
Concerning Light Commercial Vehicles
The program calculates the moment of inertia using the following formulas.
For most vehicles, the formula used is:
Iz = 0.1269·m·WB·L,
Iy = Iz,
Ix = 0.3·Iz,
-where:
Iz = Yaw moment of inertia
m = Mass
WB = Wheelbase
L = Overall length
Iy = Pitch moment of inertia
Ix = Roll moment of inertia
For a truck or a trailer ( as van is considered) the moment of inertia is calculated by the
following
formula:
Iz = m· (L2 + B2)/12,
Iy = Iz,
Ix = 2·m·B2/12,
- where:
L = Overall length
B = Overall width
8. Impact Model The impact model used in PC-Crash enables calculations of vehicles motion parameters
immediately after the collision. The model disregards the vehicles motion during the collision
and assumes that the impact time is infinitely short. The impact force is applied at a single
point. This point of impact is the one where the total crash force is assumed to be exchanged.
The elasticity of the collision is considered, based on a coefficient of restitution (k). The value
of this coefficient depends on the collision speed. The lower the velocity and deformation, the
closer this value is to 1. For example, at parking velocities, the usual value is 0,5-0,9. It can be
assumed K=0 for perfect plastic collisions and K=1 for perfect elastic collisions.

viii
Analysis and Improvement of Security
Concerning Light Commercial Vehicles
Source: PC-Crash Handbook
9. Coefficient of restitution. Impact force impulse. According to Newton’s hypothesis the impact is composed of two phases:
1- compression phase in which contact points of both colliding bodies approach each
other.
2- Restitution phase in which, due to elasticity, they rebound from each other at the
contact point.
Newton combined the two phases during collision and defined two notions: impulse of
restitution St and impulse of compression Sk. He called their ratio a coefficient of restitution k:
𝑘 =𝑆𝑟𝑆𝑘
This coefficient depends on the elasto-plastic characteristics of the colliding bodies. After
transformation of Equation above:
𝑘 = −𝐴𝑣′
𝐴𝑣= −
𝑣′1𝑛 − 𝑣′2𝑛𝑣1𝑛 − 𝑣2𝑛
Where:
V’1n, V’2n – normal component of vehicle velocity vector 1 and 2 respectively, at
impulse point immediately after impact forces stop.
V1n, V2n – normal component of vehicle velocity vector 1 and 2 respectively, at impulse
point immediately before impact.
Note: all the notations used in the formulas marked with (‘) denote the state after the
collision, those without the sign immediately before.

ix
Analysis and Improvement of Security
Concerning Light Commercial Vehicles
The total impulse is expressed by the equation:
𝑆 = 𝑆𝑘 + 𝑆𝑟 = 𝑆𝑘 1 + 𝑘
Curve of coefficient of restitution k as a function of relative closing velocity v, for collision of two automobiles. Curve
k depends on many factors such as impact direction, vehicles rigidity and individual characteristics of impact energy
absorption, so the diagram should be treated as approximate
10. Equivalent Energy Speed As a control, the Equivalent Energy Speed (EES) of the impact is indicated for each vehicle. The
distribution of the deformation energy between two vehicles in collision depends on the
vehicle masses and the deformation depths:
𝐸𝐸𝑆1
𝐸𝐸𝑆2=
𝑚2 𝑆𝐷𝑒𝑓1
𝑚1𝑆𝐷𝑒𝑓2
𝐸𝐸𝑆2 =
2𝐸𝐷
𝑚2 𝑆𝐷𝑒𝑓1
𝑆𝐷𝑒𝑓1+ 1
where:,
m1, m2 = mass of each vehicle
SDef1, SDef2 = Crush depth of each vehicle, outer surface to impact point, in line with impact
force.
ED = Energy lost by both vehicles in collision due to damage. (½m1xv12 + ½m2xv2
2 is all the
energy that is provided to the crash)
0
0,2
0,4
0,6
0,8
1
1,2
0 2 4 6 8 10
k
v [m/s]

x
Analysis and Improvement of Security
Concerning Light Commercial Vehicles
B. Osterseminar 2009 Thanks to the gently offer of Per Bo Hansen and Thomas Wind from Dan-Crash it has been
possible to assist to the spring workshop 2009 organised by Dr. Steffan Datentechnick (c) in
Linz, Austria 6-9/04/2009.
1. Crash Test Day
On the first day, there have been done ten different crashes. It was scheduled to run twelve,
but finally due to different technical reasons, two of them were not possible to perform. On
the other hand, this has been a great opportunity to learn how real tests are produced. During
the workshop two kinds of crash tests have been simulated:
-1 Door collision: collision of vehicles with open/just opening doors of the parking
vehicle.
Durign the collision between a driving vehicle and the front door of a parking vehicle different
distances (1m, 0.75m) between the vehicles as well as open and opening doors have been
simulated. Target of these tests is to show differences in the damages depending on the
certain constellation.
-2 Sled Tests: Frontal Sled Test with and without Safety Belt.
The sled tests have been performed with a reinforced car body. Two different velocities have
been used (30 km/h and 60 km/h). At each velocity two tests have been performed, with a
belted/unbelted Dummy on the driver seat. These test have showed the different loads on the
driver depending on the different velocity and on the usage of the safety belt. With each test
the airbag has been used. Furthermore, with the belted driver the pretensioner has been used
too.
Regarding the main topic of the Thesis, it has been found of a high interest the sled test at 30
km/h in both situations, belted and unbelted Dummy. As was described in point 4.4.3, on the
front load cargo configuration, it was found a pre-impact velocity of 29,54 km/h which is really
close to the test speed. The possibility of attending a live impact of these features facilitates
the understanding of the magnitude of this type of crashes, even if it is not a really high
velocity.
Sled Test Setup
In order to get a proper recording, two high speed video cameras have been used, both on the
passenger left side. On the test, the driver is a Frontal Impact Dummy (H3 50%) with 3 axial
accelerometers: head (x/y/z), chest (x/y/z) and pelvis (x/y/z). It also measures the intrusions on
the chest (x) and finally forces and moments on the upper neck, upper leg and lower leg
(x/y/z).
The reinforced car body that has been used is equipped as mentioned before, with driver
airbag and belt with pretensions. This leads to a final mass of 570 kg.
The mechanism that has been used to impulse the car body is the DSD Hyper G. The energy of
this system is generated by compressed air stored in a special high pressure cylinder. A piston

xi
Analysis and Improvement of Security
Concerning Light Commercial Vehicles
ram transmits the energy to the sled. To get a specific acceleration pulse the ram is braked
dynamically by a hydraulic brake device. PICTURES + further Data from DSD????
Car body, Compressors, piston ram
2. Workshop
On the following days of the seminar, several crash reconstructions have been done. Five cases
have been studied with different vehicles and conditions.
Case 1: Oncoming traffic truck
Driver of an Audi collided with his front side into the axle of an oncoming truck trailer. Audi
stopped crosswise on the lane. The main question was which vehicle had wrong driving line.
Data
- Vehicle 1: Audi A4 1.8t Station Wagon
- Vehicle 2: Truck Renault AE 470T with a 3 axles semitrailer.
- Road Condition: wet asphalt
- Light Conditions: darkness, rain, cloudy.
- Max. Allowed velocity: 50 km/h
Also, in each case several measurements, sketches and pictures of the location are shown.
Case 2: Cyclist
Driver of a bicycle drove into a crossing and did not see a Fiat Bravo coming from the right
side. The bicyclist collided into the left side of the car. The main target is to find the speed of
the crash and if there was any possibility to avoid the accident.
Data
- Vehicle 1: Fiat Bravo
- Vehicle 2: Mountain-bike Everest.
- Road Condition: dry asphalt
- Light Conditions: daylight, bright.
- Max. Allowed velocity: 30 km/h
- Injury: Cyclist severe

xii
Analysis and Improvement of Security
Concerning Light Commercial Vehicles
Case 3: Priority Violation
Driver of Opel Vectra wanted to turn left into a crossing and did not see a VW Multivan coming
from the left side on the priority road. The speed collision and avoidance are the objectives.
Data
- Vehicle 1: Opel Vectra 1.6
- Vehicle 2: VW t5 2.5 TDI
- Road Condition: wet asphalt
- Light Conditions: daylight, drizzle.
- Max. Allowed velocity: 70 km/h, stop-sign for vehicle 1
- Injury: fatal injures for driver 1
Case 4: Tractor
Driver of Peugeot 607 wanted to overtake a tractor, which turned left. As a result, the Peugeot
collided with the front side into the left side of the slanted tractor.
Data
- Vehicle 1: Peugeot 607 3.0
- Vehicle 2: Tactor John Deere 5500
- Road Condition: plane, asphalt dry
- Light Conditions: daylight, sunny, bright.
- Max. Allowed velocity: 100 km/h
- Injury: both parties slight
Case 5: Tractor
As a result of tire damage, a Peugeot 306 collided with the roadside barrier and was stopped at
the middle lane crosswise. Afterwards a truck collided into the left side of the Peugeot.
Data
- Vehicle 1: Peugeot 306 Break 1.6
- Vehicle 2: Truck Daimler-Chrysler 1841LS, Semi-trailer Schmitz Cargobull 3 axles
- Road Condition: Asphlat dry
- Light Conditions: darkness
- Max. Allowed velocity: 100 km/h
- Injury: both parties slight
It this last case, different load configurations for the truck were simulated. This was used on
the project but with a van instead of a truck

xiii
Analysis and Improvement of Security
Concerning Light Commercial Vehicles
List of Tables Table 1: Van victims in Spain 2006 1
Table 2: Van victims in Denmark 2006 2
Table 3: Opel Movano exterior dimensions 6
Table 4: Opel Movano interior dimensions 6
Table 5: Opel Movano Plated weight and Kerbweights 8
Table 6: Kerbweight axle distribution 8
Table 7: Opel Movano Kerweight parameters 9
Table 8: Total Load 10
Table 9: Load Distribution 11
Table 10: Load parameters 11
Table 11: MAM situation Axle reaction 12
Table 12: Kerbewwight and MAM weight distribution 13
Table 13: Top sales car in Europe 2008 14
Table 14: Citroen C1 parameters 14
Table 15: Ford Focus parameters 15
Table 16: VW passat parameters 15
Table 17: BMW X5 parameters 15
Table 18: Braking distance 17
Table 19: Maximum acceleration 18
Table 20: Maximum Speed 20
Table 21: Test vehicles speed 21
Table 22: Opel Movano – VW T5 comparative 27
Table 23: VW T5 CoG position 27
Table 24: Real crash parameters 39
Table 25: Simulation parameters 39
Table 26: Vans’ load distribution SSF 47
Table 27: Star Rating [NHTS] 47
Table 28: Vans’ load distribution SSF 57
Table 29: Center, Front and Rear Load configurations. Impact constellation 58
Table 30: Center, Front and Rear Load configurations. Accident Severity 58
Table 31: Center, Front and Rear Load configurations. Injury Potential 58
Table 32: Front and Rear configurations. Axle reactions 59
Table 33: Pallet friction 64
Table 34: Meta sheet friction 65
Table 35: Case-Control Maneuvers 67
Table 36: ESC Effectiveness 68
Table 37: Van victims in Spain 2006 68
Table 38: Van victims in Denmark 2006 69
Table 39: Victim reduction Spain 69
Table 40: Victim reduction Denmark 69
Table 41: Implementation ESC Spain 69
Table 42: Implementation ESC Denmark 69
Table 43: Victims social cost Spain 2004 70
Table 44: Victims social cost Spain 2006 70

xiv
Analysis and Improvement of Security
Concerning Light Commercial Vehicles
Table 45: Victims social cost Denmark 2001 70
Table 46: Victims social cost Denmark 2006 70
Table 47: Costs related to % implementation Spain 71
Table 48: Savings related to % implementation Spain 71
Table 49: Costs related to % implementation Denmark 71
Table 50: Savings related to % implementation Denmark 71
Table 51: Benefit Spain 72
Table 52: Benefit Denmark 72

xv
Analysis and Improvement of Security
Concerning Light Commercial Vehicles
List of figures Figure 1: Vans registered in Spain per year 1
Figure 2: Van fatalities in Spain 2
Figure 3: General fatalities in Spain 2
Figure 4: Total number of vans registered in Denmark 2
Figure 5: Van fatalities in Denmark 3
Figure 6: General fatalities in Denmark 3
Figure 7: ESC availability total of vehicles [RACC] 4
Figure 8: ESC availability big Minivan [RACC] 4
Figure 9: Vans ESC availability in Spain 4
Figure 10: Vans ESC availability in Denmark 4
Figure 11: Opel Movano Schemes in mm. [Opel/Vauxhall] 6
Figure 12: Opel Movano H Point [mm] 7
Figure 13: Opel Movano Load Volume [mm] 7
Figure 14: Opel Movano Load Compartment Dimensions [mm] 8
Figure 15: Opel Movano Kerb Weight Center of gravity [mm] 9
Figure 16: Opel Movano Load distribution 10
Figure 17: Opel Movano. Kerbweight and Load CoG [mm] 12
Figure 18: Deceleration test at 100 km/h. Distance-Velocity diagram. 17
Figure 19: Deceleration test at 130 km/h. Distance between cars at stopping positon. 18
Figure 20: Deceleration test. Longitudinal and Vertical acceleration of each vehicle. 18
Figure 21: ABS build up phase 18
Figure 22: Lane Changing Test. Steering angle. 19
Figure 23: Lane Changing test. Lateral acceleration 20
Figure 24: Over steering test 30 km/h. Yaw velocity. 22
Figure 25: Over steering test 40 km/h. Yaw velocity. 22
Figure 26: Over steering test 5 km/h. Trajectory. 22
Figure 27: Over steering test 40 km/h. Trajectory. 22
Figure 28: RACE Crash Test at 60 km/h 23
Figure 29: CoG of the different load distributions 25
Figure 30: Rear axle load configuration 26
Figure 31: VW T5 27
Figure 32: Influence of side slip angle on yaw moment for different steering angles at high tire-
road friction [Convergence Transportation Electronic Association] 28
Figure 33: Operation of the ESC 29
Figure 34: ESC control system 30
Figure 35: Road dimensions 31
Figure 36: Simulation. Start of the overtake. 31
Figure 37: Simulation. Start of evasive action of the van. 32
Figure 40: BMW acceleration test 32
Figure 41: Vehicles trajectories. Results may vary depending on the simulation 32
Figure 38: Simulation. Invasion of the opposite lane. 32
Figure 39: Bmw Velocity 32
Figure 42: Simulation Results tendency 33
Figure 43: Capture of the EES 2005 [DSD] 34

xvi
Analysis and Improvement of Security
Concerning Light Commercial Vehicles
Figure 44: Daily living accelerations 35
Figure 45: Center load configuration 36
Figure 46: Final position. Blue: 2nd Generation van. Red: 3rd Generation van. 36
Figure 47: Center load configuration. ESC interaction. 37
Figure 48: Center load. Brake Factor. 37
Figure 49: Center load. Yaw angular velocity. 37
Figure 50: Center load. 2nd (red) and 3rd Generation (blue) final position. 37
Figure 51: Center Load. 2nd generation van impact. 38
Figure 52: Center Load. Possible 2nd generation van crash consequences. 39
Figure 53: T1 acceleration suffered while sitting [DSD tests 2005] 40
Figure 54: Front load configuration. 40
Figure 55: Rear axle load configuration. 41
Figure 56: Brake force distribution. Center load. 42
Figure 57: Brake force distribution. Front load. 42
Figure 58: Yaw angular velocity. Front load (blue). Center load (red) 43
Figure 59: Pc-Crash simulation 44
Figure 60: Sled test at DSD 44
Figure 61: Front Load crash 45
Figure 62: Center Load crash 45
Figure 63: Rear axle load crash 45
Figure 64: Belted Dummy rest position after 30 km/h crash. 46
Figure 65: Typical critical lateral accelerations to commit rollover on different types of vehicles.
[NHTSA] 48
Figure 66: High center configuration. 48
Figure 67: High center configuration with ESP. Entrance speed=108 km/h. t= 2,38 sec 49
Figure 68: High center configuration.Tire normal forces. 49
Figure 69: High center configuration. Lateral acceleration 49
Figure 70: High center configuration simulation at 2.81 sec. 50
Figure 71: High center configuration. 2nd generation vs. 3rd generation 51
Figure 72:High center configuration. Yaw angular velocity 51
Figure 73:High center configuration. Lateral acceleration 51
Figure 74: High center configuration. Position. 51
Figure 75: High rear axle configuration 52
Figure 76: Maximum speed of the vans. 1-ESC 2-No ESC. 52
Figure 78: High rear axle parameters 53
Figure 80: High fron configuration 53
Figure 77: High center load parameters 53
Figure 79: High center configuration vs. High rear axle configuration 53
Figure 81: Maximum entrance speed comparing load distribution and the use of ESC 55
Figure 82: Structure of the Rollover Mitigation System 56
Figure 83: Partition wall 62
Figure 84: Pc-Crash Multibody parameters 63
Figure 85: Secured Cargo.Load position 63
Figure 86: Unsecured Cargo. Multibody system. 64

xvii
Analysis and Improvement of Security
Concerning Light Commercial Vehicles
Figure 87: Unsecured load. Velocity diagram. 65
Figure 88: Unsecuerd load. Final position. 65
Figure 89: Longitudinal acceleration with euro-pallet. 66
Figure 90: Longitudinal acceleration with metal sheet. 66

xviii
Analysis and Improvement of Security
Concerning Light Commercial Vehicles
Acronyms
ESC: Electronic Stability Control
DGT: Dirección General de Tráfico
CARE: Community Road Accident Database
Euro NCAP: European New Car Assessment Programme
SUV: Sports Utility Vehicle
ABS: Assisted Braking System
LF: Left-Front wheel
RF: Right-Front wheel
LR: Left-Rear wheel
RR: Right-Rear wheel
RACE: Real automóvil Club de España
TCS: Traction Control System
DSD: Dr.Steffan Database
EES: Equivalent Energy Speed
SSF: Static Stability Factor
RMF: Rollover Mitigation Functions
HRMC: Hybrid Rollover Mitigation Controller