PEW GLOBAL ATTITUDES PROJECT ECONOMIC CONDITIONS REPORT
57
EMBARGOED FOR RELEASE: THURSDAY JULY 12, 2012 11AM ET Pervasive Gloom About the World Economy Faith in Hard Work, Capitalism Falter But Emerging Markets Upbeat Andrew Kohut, President, Pew Research Center Pew Global Attitudes Project: Pew Research Center: Richard Wike, Associate Director Bruce Stokes, Juliana Menasce Horowitz, Director of Pew Global Economic Attitudes, Pew Research Center Senior Researcher Katie Simmons, Research Associate James Bell, Jacob Poushter, Research Analyst Director of International Survey Research, Pew Research Center Cathy Barker, Research Assistant Elizabeth Mueller Gross, Vice President, Pew Research Center For Media Inquiries Contact: Richard Wike Vidya Krishnamurthy 202.419.4372 http://pewglobal.org PEW GLOBAL ATTITUDES PROJECT ECONOMIC CONDITIONS REPORT EMBARGOED FOR RELEASE THURSDAY JULY 12, 2012 11AM ET
-
Upload
hindustan-times -
Category
Documents
-
view
214 -
download
0
description
PEW GLOBAL ATTITUDES PROJECT ECONOMIC CONDITIONS REPORT
Transcript of PEW GLOBAL ATTITUDES PROJECT ECONOMIC CONDITIONS REPORT

EMBARGOED FOR RELEASE: THURSDAY JULY 12, 2012 11AM ET Pervasive Gloom About the World Economy
Faith in Hard Work, Capitalism Falter But Emerging Markets Upbeat
Andrew Kohut,
President, Pew Research Center
Pew Global Attitudes Project: Pew Research Center:
Richard Wike, Associate Director Bruce Stokes,
Juliana Menasce Horowitz, Director of Pew Global Economic Attitudes, Pew Research Center Senior Researcher
Katie Simmons, Research Associate James Bell,
Jacob Poushter, Research Analyst Director of International Survey Research, Pew Research Center
Cathy Barker, Research Assistant Elizabeth Mueller Gross,
Vice President, Pew Research Center
For Media Inquiries Contact: Richard Wike Vidya Krishnamurthy 202.419.4372 http://pewglobal.org
PEW GLOBAL ATTITUDES PROJECT ECONOMIC CONDITIONS REPORT EMBARGOED FOR RELEASE THURSDAY JULY 12, 2012 11AM ET

July 12, 2012
TABLE OF CONTENTS
Copyright © 2012 Pew Research Center www.pewresearch.org
PAGE
Overview: Pervasive Gloom About the World Economy 1
About the Project 5
Chapter 1: The National Report Card 6
Chapter 2: The Personal Report Card 10
Chapter 3: Reality Check 13
Chapter 4: The Casualties: Faith in Hard Work and Capitalism 15
Chapter 5: The Winners and Losers 19
Survey Methods 23
Survey Topline 32
Appendix 52
PEW GLOBAL ATTITUDES PROJECT ECONOMIC CONDITIONS REPORT EMBARGOED FOR RELEASE THURSDAY JULY 12, 2012 11AM ET

1
Pervasive Gloom About the World Economy Faith in Hard Work, Capitalism Falter But Emerging Markets Upbeat The economic mood is
exceedingly glum all around
the world. A median of just
27 percent think their
national economy is doing
well, according to a survey in
21 countries by the Pew
Research Center’s Global
Attitudes Project. Only in
China (83%), Germany
(73%), Brazil (65%) and
Turkey (57%) do most people
report that current national
economic conditions are
good.
The public mood about the
economy has worsened
since 2008 in eight of 15
countries for which there is
comparable data, while it is
essentially unchanged in four
others. The Chinese are the
lone exception. They have
been positive about their economy for the past decade.
Less than a third of Americans (31%) say the U.S. economy is doing well. That figure is up 13
percentage points from 2011. (But it is down 19 points from 2007, the year before the financial
crunch began.) A median of just 16% of Europeans surveyed think their economy is
Declining National Economic Perceptions
Good personal economic
situation Good national economic
situation 2008 2012 Change 2008 2012 Change % % % % % % U.S. 71 68 -3 20 31 +11 Germany 67 74 +7 53 73 +20 Poland 63 45 -18 52 29 -23 France 68 65 -3 19 19 0 Czech Rep. -- 50 -- -- 16 -- Britain 72 64 -8 30 15 -15 Spain 68 57 -11 35 6 -29 Italy -- 41 -- -- 6 -- Greece -- 17 -- -- 2 -- Russia 46 47 +1 52 32 -20 Turkey 40 60 +20 21 57 +36 Jordan 31 33 +2 39 28 -11 Egypt 26 23 -3 44 27 -17 Tunisia -- 56 -- -- 17 -- Lebanon 31 26 -5 10 12 +2 Pakistan 70 51 -19 41 9 -32 China 66 69 +3 82 83 +1 India -- 64 -- -- 49 -- Japan 37 34 -3 13 7 -6 Brazil -- 75 -- -- 65 -- Mexico 60 52 -8 36 35 -1
PEW RESEARCH CENTER Q14 & Q18.
PEW GLOBAL ATTITUDES PROJECT ECONOMIC CONDITIONS REPORT EMBARGOED FOR RELEASE THURSDAY JULY 12, 2012 11AM ET

Pew Research Center’s Global Attitudes Project – www.pewglobal.org
2
performing up to par. That includes just 2% of the Greeks and 6% of the Spanish and Italians.
Among Europeans, only the Germans (73%) give their economy a thumbs up. And just 7% of
Japanese believe their economy is doing well.
People are, however, generally far more positive about their personal economic condition than
they are about their nation’s economic situation. A median of 52 percent in the 21 nations
surveyed feel satisfied with their own circumstances. Americans are twice as likely to say their
family finances are in good shape as they are to say that the national economic situation is
good. There are larger differences in Britain and Japan, where those who rate their personal
economic situation as good exceed the number who have positive views of the national
economy by more than four-to-one. Only the Chinese are significantly more likely to say the
national economy is doing better than their families’ finances.
And there is some optimism that things will improve in the next 12 months, especially in Brazil
(84%), China (83%) and Tunisia (75%). Nevertheless, pessimism about young peoples’ ability
to do better than their parents is rampant, particularly in Europe (a median of only 9% think it
will be easy) and Japan (10%). Again, the lone exception is China, where 57% say it will be
easy for their children to become wealthier or to get a better job.
There is a striking contrast between the economic outlook in four of the emerging markets
surveyed – Brazil, China, India and Turkey – and the European Union and the U.S. People
living in these economies are generally more likely than Americans or Europeans to say that
they are doing better than their parents. They are twice as likely as Americans and more than
three times as likely as Europeans to think economic conditions in their countries are good.
They are three times more likely than Europeans and more than twice as likely as Americans to
Emerging Economies Have More Positive Economic Outlook
Standard of living better than parents at same age
Good national
economic situation
Good personal economic situation
Better off financially
compared to five years ago
Easy for young person to get better job/become
wealthier than their parents
% % % % % Emerging economies 74 61 67 60 35 U.S. 60 31 68 27 14 EU 59 16 54 20 9 Arab countries 33 22 30 24 16
Median percentages for EU include Britain, France, Germany, Spain, Italy, Greece, Poland and the Czech Republic. Median percentages for emerging economies include Turkey, China, India and Brazil. Median percentages for Arab countries include Egypt, Tunisia, Lebanon and Jordan.
PEW RESEARCH CENTER Q4, Q14, Q18, Q20 & Q64b.
PEW GLOBAL ATTITUDES PROJECT ECONOMIC CONDITIONS REPORT EMBARGOED FOR RELEASE THURSDAY JULY 12, 2012 11AM ET

Pew Research Center’s Global Attitudes Project – www.pewglobal.org
3
say that they are financially better off compared with five years ago. And, while people in
emerging markets also worry about the economic mobility of their children, they are four times
more optimistic about the future for their kids than the Europeans and twice as optimistic as
Americans.
In contrast, economic attitudes are particularly gloomy in the four nations polled in the Arab
world. Only a third of those surveyed think they are better off than their parents at the same
age. A median of only 30% say they are doing well financially. And a median of only 16%
believe their children will have an easy time becoming economically better off than themselves.
Tough times have
undermined the work ethic
in a number of countries
among people who are
suffering economically.
Those who say their personal
finances are a mess are far
less likely than those who are
doing well to believe that
most people succeed if they
work hard.
The global economic crisis
has eroded support for
capitalism. In 11 of the 21
nations surveyed, half or
fewer now agree with the
statement that people are
better off in a free market
economy even though some
people are rich and some are
poor. And such backing is
down in 9 of 16 nations with
comparable data since 2007,
before the Great Recession
began. Such disenchantment is particularly acute in Italy (where support for a free market
economy is down 23 percentage points), Spain (20 points) and Poland (15 points).
Most People Better Off in Free Market Economy
% Completely/mostly agree
2002 2007 2009 2010 2012 07-12
Change % % % % % U.S. 72 70 76 68 67 -3
Italy 71 73 75* -- 50 -23 Spain -- 67 57 62 47 -20 Poland 44 68 65 68 53 -15 Britain 66 72 66 64 61 -11 Czech Rep. 62 59 63* -- 50 -9 France 61 56 57 67 58 +2 Germany 69 65 61 73 69 +4 Greece -- -- -- -- 44 --
Russia 45 53 51 60 47 -6
Lebanon 76 74 64 60 62 -12 Pakistan 50 60 65 57 48 -12 Turkey 60 60 60 64 55 -5 Jordan 47 47 54 48 43 -4 Egypt -- 50 60 51 50 0 Tunisia -- -- -- -- 42 --
Japan 43 49 41 43 38 -11 China 70 75 79 84 74 -1 India -- -- -- -- 61 --
Brazil -- -- -- 75 75 -- Mexico -- -- 52 44 34 --
* Data from Fall 2009 survey.
PEW RESEARCH CENTER Q26.
PEW GLOBAL ATTITUDES PROJECT ECONOMIC CONDITIONS REPORT EMBARGOED FOR RELEASE THURSDAY JULY 12, 2012 11AM ET

Pew Research Center’s Global Attitudes Project – www.pewglobal.org
4
These are among the key findings from a new survey by the Pew Research Center’s Global
Attitudes Project, conducted in 21 countries among 26,210 respondents from March 17 to April
20, 2012.
PEW GLOBAL ATTITUDES PROJECT ECONOMIC CONDITIONS REPORT EMBARGOED FOR RELEASE THURSDAY JULY 12, 2012 11AM ET

5
About the Pew Global Attitudes Project The Pew Research Center’s Global Attitudes Project conducts public opinion surveys around the world on a broad array of subjects ranging from people’s assessments of their own lives to their views about the current state of the world and important issues of the day. The project is directed by Andrew Kohut, president of the Pew Research Center, a nonpartisan “fact tank” in Washington, DC, that provides information on the issues, attitudes, and trends shaping America and the world. The Pew Global Attitudes Project is principally funded by The Pew Charitable Trusts. Since its inception in 2001, the Pew Global Attitudes Project has released numerous major reports, analyses, and other releases, on topics including attitudes toward the U.S. and American foreign policy, globalization, terrorism, and democracy. Pew Global Attitudes Project team members include Richard Wike (Associate Director), Juliana Menasce Horowitz, Katie Simmons, Jacob Poushter, and Cathy Barker. Other contributors to the project include Pew Research Center staff members James Bell (Director, International Survey Research), Bruce Stokes (Director, Pew Global Economic Attitudes), and Elizabeth Mueller Gross (Vice President), as well as Bruce Drake, Neha Sahgal, Carroll Doherty, and Michael Dimock. Additional members of the team include Mary McIntosh, president of Princeton Survey Research Associates International, and Mike Mokrzycki. The Pew Global Attitudes Project team regularly consults with survey and policy experts, regional and academic experts, journalists, and policymakers whose expertise provides tremendous guidance in shaping the surveys. The Pew Global Attitudes Project’s co-chairs are on leave through 2012. The project is co-chaired by former U.S. Secretary of State Madeleine K. Albright, currently principal, the Albright Stonebridge Group, and by former Senator John C. Danforth, currently partner, Bryan Cave LLP. All of the project’s reports and commentaries are available at www.pewglobal.org. The data are also made available on our website within two years of publication. Findings from the project are also analyzed in America Against the World: How We Are Different and Why We Are Disliked by Andrew Kohut and Bruce Stokes, published by Times Books. A paperback edition of the book was released in May 2007. For further information, please contact: Richard Wike Associate Director, Pew Global Attitudes Project 202.419.4400 / [email protected]
Pew Global Attitudes Project Public Opinion Surveys
Survey Sample Interviews
Summer 2002 44 Nations 38,263
November 2002 6 Nations 6,056
March 2003 9 Nations 5,520
May 2003 21 Publics* 15,948
Spring 2004 9 Nations 7,765
Spring 2005 17 Nations 17,766
Spring 2006 15 Nations 16,710
Spring 2007 47 Publics* 45,239
Spring 2008 24 Nations 24,717
Spring 2009 25 Publics* 26,397
Fall 2009 14 Nations 14,760
Spring 2010 22 Nations 24,790
Spring 2011 23 Publics* 29,100
Spring 2012 21 Nations 26,210
* Includes the Palestinian territories.
PEW GLOBAL ATTITUDES PROJECT ECONOMIC CONDITIONS REPORT EMBARGOED FOR RELEASE THURSDAY JULY 12, 2012 11AM ET

6
1. The National Report Card
Few Satisfied with Nation’s Direction In the wake of four years of economic turmoil around the world and political upheaval in a
number of nations, very few people are satisfied with the way things are going in their country.
In the 21 countries surveyed, only in China (82%), Germany (53%) and Egypt (53%) do more
than half of the population say they are content with their nation’s direction. And, among
Egyptians, such sentiment is actually down 12 percentage points from 2011. People are
particularly gloomy in Greece (2%), Spain (10%), Italy (11%) and Pakistan (12%). Even in the
U.S. only 29% of the public thinks things overall are going well.
Little Satisfaction With Country Direction
2002 2003 2004 2005 2006 2007 2008 2009 2010 2011 2012 % % % % % % % % % % % U.S. 41 -- 39 39 29 25 23 36 30 21 29
Britain 32 46 38 44 35 30 30 21 31 32 30 France 32 44 32 28 20 22 29 27 26 25 29 Germany 31 25 20 25 29 33 34 43 39 43 53 Spain -- 45 -- 51 50 51 50 21 22 15 10 Italy 24 29 -- -- -- 16 -- 25* -- -- 11 Greece -- -- -- -- -- -- -- -- -- -- 2 Poland 9 -- -- 13 -- 18 42 20 47 30 33 Czech Rep. 36 -- -- -- -- 23 -- 28* -- -- 14
Russia 20 27 26 23 32 36 54 27 34 32 46
Turkey 4 19 40 41 40 39 21 22 38 48 47
Egypt -- -- -- -- 55 47 40 31 28 65 53 Jordan 21 42 59 69 53 56 49 46 35 44 43 Lebanon 7 14 -- 40 -- 6 6 11 11 11 15 Tunisia -- -- -- -- -- -- -- -- -- -- 20
China 48 -- -- 72 81 83 86 87 87 85 82 India -- -- -- -- -- -- -- -- -- 51 38 Japan 12 -- -- -- 27 22 23 25 20 25 20 Pakistan 49 29 54 57 35 39 25 9 14 6 12
Brazil -- -- -- -- -- -- -- -- 50 52 43 Mexico 16 -- -- -- -- 30 30 20 19 22 34
* Data from Fall 2009 survey.
PEW RESEARCH CENTER Q2.
PEW GLOBAL ATTITUDES PROJECT ECONOMIC CONDITIONS REPORT EMBARGOED FOR RELEASE THURSDAY JULY 12, 2012 11AM ET

Pew Research Center’s Global Attitudes Project – www.pewglobal.org
7
And the public mood is quite volatile in many societies. Satisfaction with their countries’
direction is up 14 points in Russia and 10 points in Germany from last year, but down 13 points
in India and 9 points in Brazil. Looking further back, since 2007 positive views of the
country’s direction have collapsed in Spain (down 41 points) and Pakistan (down 27). But it
has improved 20 points in Germany, 15 points in Poland and 10 points in Russia. Notably,
only in China have people been relatively positive through most of the last decade.
Publics Downbeat About Economy The prolonged global
economic slump has
depressed the public mood
about the economy. In only
four of 21 countries surveyed
does a majority say their
economy is doing well. The
assessment is particularly
rosy in China (83%) and
Germany (73%), but also in
Brazil (65%) and Turkey
(57%). And it is particularly
bad in Greece (2%), Italy
(6%), Spain (6%), Japan
(7%) and Pakistan (9%).
The strongest improvement
in public sentiment about the
economy since 2011 has been
in the U. S., where approval
is up 13 points. But still less
than a third (31%) of
Americans think their
economy is doing well.
The contrast in public opinion since 2007, immediately before the economic crisis hit, is
striking, not only in its magnitude but also because it is a worldwide phenomenon. Confidence
Few See National Economic Conditions As Good
% Very/somewhat good 2002 2007 2008 2009 2010 2011 2012 % % % % % % % U.S. 46 50 20 17 24 18 31
Britain 65 69 30 11 20 15 15 France 45 30 19 14 13 17 19 Germany 27 63 53 28 44 67 73 Spain -- 65 35 13 13 10 6 Italy 36 25 -- 22* -- -- 6 Greece -- -- -- -- -- -- 2 Poland 7 36 52 29 53 26 29 Czech Rep. 40 41 -- 18* -- -- 16
Russia 13 38 52 20 33 29 32
Turkey 14 46 21 24 34 49 57
Egypt -- 53 44 27 20 34 27 Jordan 33 44 39 33 30 33 28 Lebanon 5 9 10 11 13 13 12 Tunisia -- -- -- -- -- -- 17 Pakistan 49 59 41 22 18 12 9
China 52 82 82 88 91 88 83 India -- -- -- -- -- 56 49 Japan 6 28 13 10 12 10 7
Brazil -- -- -- -- 62 54 65 Mexico 31 51 36 30 24 30 35
* Data from Fall 2009 survey.
PEW RESEARCH CENTER Q14.
PEW GLOBAL ATTITUDES PROJECT ECONOMIC CONDITIONS REPORT EMBARGOED FOR RELEASE THURSDAY JULY 12, 2012 11AM ET

Pew Research Center’s Global Attitudes Project – www.pewglobal.org
8
84
83
75
52
51
50
45
44
32
31
29
29
26
25
22
22
22
18
16
13
9
12
9
12
26
32
28
25
22
35
44
43
35
23
27
37
29
29
45
49
27
10
5
2
12
20
16
20
24
26
32
15
27
34
43
47
40
47
45
33
33
60
81
Brazil
China
Tunisia
U.S.
Mexico
Egypt
India
Turkey
Britain
Russia
Germany
Jordan
Pakistan
Spain
France
Italy
Lebanon
Poland
Japan
Czech Rep.
Greece
Improve Remain the same Worsen
in the economy is down 59 percentage points in Spain, 54 points in Britain, 50 points in
Pakistan, 26 in Egypt, 19 in the U.S. and 16 in Mexico in the last five years. Bucking this trend
is Turkey, where those regarding the economy as good is up 11 points since the year before the
crisis and Germany, up 10 points.
Looking back over the last decade, only in China among the countries consistently surveyed,
has the public been upbeat about the economy for the entire period. The economic sentiment
among Germans, Poles, Russians and Turks has been on a roller coaster ride.
Some Optimism about the Future
In only six of the 21 nations surveyed do half or
more of the population think national
economic conditions will improve over the next
12 months. This includes very optimistic
Brazilians (84%), Chinese (83%) and Tunisians
(75%) and relatively optimistic Americans
(52%), Mexicans (51%) and Egyptians (50%).
In addition, a plurality of Indians (45%) and
Turks (44%) see a better economy on the
horizon.
But in six countries majorities or pluralities
think economic conditions will worsen,
including 81% of Greeks and 60% of Czechs.
Over Next 12 Months, Economy Will…
PEW RESEARCH CENTER Q15.
PEW GLOBAL ATTITUDES PROJECT ECONOMIC CONDITIONS REPORT EMBARGOED FOR RELEASE THURSDAY JULY 12, 2012 11AM ET
Pew Research Center’s Global Attitudes Project – www.pewglobal.org
9
Blame the Government
Among those who think the economy is doing
poorly, people in 16 of 21 countries fault their
own government, some overwhelmingly so.
Particularly angry at their leadership are the
Pakistanis (95% blame the government as a
primary or secondary culprit), Indians (92%),
the Mexicans (91%), the Japanese (91%), the
Czechs (91%) and the Poles (90%).
Young people in Britain, France, Germany,
Spain, Tunisia, Mexico, Brazil and Japan tend
to blame the government. And in Britain,
France and the Czech Republic, women are
more likely than men to blame the government
for the economic crisis.
Banks and financial institutions were
frequently-- in Spain (78%), France (74%) and
Germany (74%)—seen as the culprit behind the
poor performance of national economies. And
in two instances—France and Spain—
significantly more of the public blamed the
banks than blamed the government. There is
also significant criticism directed at financial
institutions in Jordan (53%) and Egypt (40%).
A quarter or more blame the U.S. in Egypt
(32%), Pakistan (32%), Jordan (31%), Mexico
(30%), Turkey (28%) and China (25%). Meanwhile, the Czechs (39%) and the French (37%)
also criticize the European Union.
Notably, in seven countries people blame themselves second only to their governments for
their current economic troubles. The most self-critical are the Tunisians (68%), the Indians
(64%) and the Brazilians (58%).
Who’s to Blame for Current Economic Problems?
Our
gov’t
Banks, financial
institutions U.S. EU Our-
selves % % % % %
Britain 67 69 10 16 19 France 59 74 10 37 18 Germany 70 74 12 25 9 Spain 59 78 8 19 26 Italy 84 58 2 15 19 Greece 87 39 4 19 42 Poland 90 39 5 28 15 Czech Rep. 91 27 5 39 21
Russia 82 28 8 3 22
Turkey 76 25 28 15 19 Egypt 73 40 32 11 35 Jordan 72 53 31 7 21 Lebanon 81 26 24 2 35 Tunisia 78 17 7 3 68 Pakistan 95 10 32 2 33
China 56 35 25 8 13 India 92 17 6 2 64 Japan 91 30 11 5 46
Brazil 86 29 7 4 58 Mexico 91 29 30 4 27
Asked only of people who said economy was “bad” in Q14.
Total adds to more than 100% because of multiple responses.
“Who is most to blame for (survey country’s) current economic problems? Is it…” & “Who is second most to blame for (survey country’s) current economic problems?”
PEW RESEARCH CENTER Q16 & Q17.
PEW GLOBAL ATTITUDES PROJECT ECONOMIC CONDITIONS REPORT EMBARGOED FOR RELEASE THURSDAY JULY 12, 2012 11AM ET

10
2. The Personal Report Card Personal Economic Situation Better Than Country’s People feel much better about the state of their
personal economic situation than they do
about national economic conditions. In 16 of
21 countries people are significantly more
likely to say their economic condition is good
than to say their country’s economy is doing
well.
This is particularly true in Spain (51
percentage point difference), Britain (49
points) and France (46 points). Only in China
are people far more upbeat about the national
economy than they are about their own
finances.
Among those who feel the most satisfied about
their own economic well-being include the
Brazilians (75%), the Germans (74%) and the
Chinese (69%). If there was any doubt that a
college education pays off: in 15 nations,
people with a college degree were more
satisfied with their economic situation than
were those who did not have a college
education.
Nevertheless, the global economic crisis has exacted a heavy toll on some people’s perception
of their personal economic situation. In five of the 15 nations where there is comparable data,
people’s sense of their own finances has deteriorated to a significant degree since 2008,
especially in Pakistan (down 19 points), Poland (down 18 points) and Spain (down 11 points).
The greatest improvements in awareness of individual economic wellbeing since 2008 have
been in Turkey (up 20 points) and Germany (up seven points).
Personal Economic Situation Better than the Country’s
% Good
National economic situation
Personal economic situation Difference
% % Spain 6 57 +51 Britain 15 64 +49 France 19 65 +46 Pakistan 9 51 +42 Tunisia 17 56 +39 U.S. 31 68 +37 Italy 6 41 +35 Czech Rep. 16 50 +34 Japan 7 34 +27 Mexico 35 52 +17 Poland 29 45 +16 India 49 64 +15 Russia 32 47 +15 Greece 2 17 +15 Lebanon 12 26 +14 Brazil 65 75 +10 Jordan 28 33 +5 Turkey 57 60 +3 Germany 73 74 +1 Egypt 27 23 -4 China 83 69 -14
PEW RESEARCH CENTER Q14 & Q18.
PEW GLOBAL ATTITUDES PROJECT ECONOMIC CONDITIONS REPORT EMBARGOED FOR RELEASE THURSDAY JULY 12, 2012 11AM ET

Pew Research Center’s Global Attitudes Project – www.pewglobal.org
11
72
70
50
43
37
32
32
30
28
27
23
23
22
20
19
16
15
14
12
11
9
16
21
19
21
25
36
37
37
30
38
48
17
32
34
31
38
34
37
7
47
31
12
5
25
35
36
29
31
31
40
34
28
57
46
45
49
42
51
49
81
42
60
Brazil
China
India
Turkey
Tunisia
Russia
Jordan
Mexico
Poland
U.S.
Germany
Pakistan
Britain
Czech Rep.
Italy
Egypt
Lebanon
France
Greece
Japan
Spain
Better off About the same Worse off
Few Better Off Than Five Years Ago
People may think their personal situation is
better than economic conditions in their
nation, but only in Brazil (72%) and China
(70%) do large majorities think their families
are better off than they were five years ago. On
balance, Indians (50%) and Turks (43%) also
say their situations have improved.
However, majorities or pluralities in 9 nations
say their family financial situation has
deteriorated. Solid majorities hold this view in
Greece (81%), Spain (60%) and Pakistan
(57%), as do at least four-in-ten in Lebanon,
Italy, France, Britain, the Czech Republic,
Japan, Egypt and Poland.
Grim Prospects for the Kids
Faith in upward economic mobility is abysmal
all over the world. Only in China (57%) does a
majority believe that it will be easy for young
people today to become wealthier or to get a
better job than their parents. The Europeans
are the most pessimistic about their children’s
chances of climbing the economic ladder.
Eight-in-ten or more in Britain, Japan, Lebanon, Pakistan, Egypt, the U.S., Poland, Germany
and the Czech Republic say it is difficult for young people to become as economically successful
as their parents.
Such pessimism is particularly strong in Greece, where 73% say it will be very difficult for
today’s kids to advance economically, Spain (69% very difficult) and Pakistan (65% very
difficult).
Compared to Five Years Ago, Are You Financially…
PEW RESEARCH CENTER Q20.
PEW GLOBAL ATTITUDES PROJECT ECONOMIC CONDITIONS REPORT EMBARGOED FOR RELEASE THURSDAY JULY 12, 2012 11AM ET
Pew Research Center’s Global Attitudes Project – www.pewglobal.org
12
92
81
71
70
67
63
61
60
60
57
57
57
57
56
54
48
47
38
34
31
21
5
11
12
15
14
20
18
20
18
14
16
24
20
21
30
18
23
16
29
39
29
2
7
16
14
12
15
20
18
16
26
26
13
22
19
14
32
28
42
35
29
50
China
Brazil
Spain
Germany
India
Britain
Czech Rep.
U.S.
Turkey
Italy
Greece
Poland
Tunisia
Russia
Mexico
France
Japan
Pakistan
Egypt
Jordan
Lebanon
Better About the same Worse
Doing Better than the Last Generation
Despite their gloom about their current
economic situation and their pessimism about
their children’s prospects, people generally
believe that they are better off than their
parents. Majorities in 14 of the 21 countries
and pluralities in three more think they are
doing better than the previous generation.
Those most pleased with how far they have
come economically are the Chinese (92%) and
the Brazilians (81%). Even 71% of the Spanish,
whose economic mood is among the worst in
the world, whose economic confidence has
fallen more than any other country in the wake
of the global downturn and who are among the
most pessimistic about prospects for the next
generation, still recognize they have come a
long way.
But young people ages 18-to-29 in Britain,
France, Spain, Russia, Italy and Greece are
much less likely than those 50 and older to
think they have a better standard of living than
their parents. Nevertheless, in Mexico and
Tunisia, those under 30 are more likely to
think they have a better standard of living than their parents.
Standard of Living Compared to Parents at Same Age
PEW RESEARCH CENTER Q64b.
PEW GLOBAL ATTITUDES PROJECT ECONOMIC CONDITIONS REPORT EMBARGOED FOR RELEASE THURSDAY JULY 12, 2012 11AM ET

13
3. Reality Check
Perceptions vs. Experience
The public’s retrospective perception of the economy is generally in line with economic
experience. Seven-in-ten Chinese (70%) say they are better off than they were five years ago.
And China experienced the fastest growth over the last half decade (averaging 10.5% annually
from 2007 to 2011) among the 21 countries surveyed by the Pew Research Center. Similarly,
50% of Indians say they are better off and India averaged 8.1% growth over that period. More
than seven-in-ten (72%) Brazilians say economic times are better now and Brazil averaged
4.2% growth over the last five years.
Economic Perceptions Vs. the Economic Record
Better off financially than five years ago
2007-2011 average GDP
growth*
Good current national economic
conditions
2011 GDP
growth*
Economy will improve over
next 12 months
2012 GDP growth
projections* % % % % % % U.S. 27 0.6 31 1.7 52 2.1 Britain 22 0.1 15 0.7 32 0.8 France 14 0.5 19 1.7 22 0.5 Germany 23 1.1 73 3.1 29 0.6 Spain 9 0.3 6 0.7 25 -1.8 Italy 19 -0.5 6 0.4 22 -1.9 Greece 12 -2.1 2 -6.9 9 -4.7 Poland 28 4.4 29 4.4 18 2.6 Czech Rep. 20 1.7 16 1.7 13 0.1 Russia 32 2.9 32 4.3 31 4.0 Turkey 43 3.6 57 8.5 44 2.3 Egypt 16 5.2 27 1.8 50 1.5 Jordan 32 5.1 28 2.5 29 2.8 Lebanon 15 6.8 12 1.5 22 3.0 Tunisia 37 3.2 17 -0.8 75 2.2 Pakistan 23 3.7 9 2.4 26 3.4 China 70 10.5 83 9.2 83 8.2 India 50 8.1 49 7.2 45 6.9 Japan 11 -0.1 7 -0.7 16 2.0 Brazil 72 4.2 65 2.7 84 3.0 Mexico 30 1.5 35 4.0 51 3.6
* Percent change in real GDP. Data from the World Economic Outlook Database, International Monetary Fund, April 2012.
PEW RESEARCH CENTER Q14, Q15, & Q20.
PEW GLOBAL ATTITUDES PROJECT ECONOMIC CONDITIONS REPORT EMBARGOED FOR RELEASE THURSDAY JULY 12, 2012 11AM ET

Pew Research Center’s Global Attitudes Project – www.pewglobal.org
14
U.S.
Britain France
Germany
SpainItaly
Greece
Poland
Czech Rep.
Russia
Turkey
EgyptJordan
LebanonTunisia
Pakistan
China
India
Japan
Brazil
Mexico
0
10
20
30
40
50
60
70
80
90
100
-10 0 10
% G
ood
nat
ion
al e
con
omic
sit
uat
ion
2011 GDP growth*
There is a strong correlation between recent economic experience and people’s perception of
their current national economic situation. Nearly three-quarters of Germans (73%) are
satisfied with how the Germany economy is doing, reflecting an International Monetary Fund
report of 3.1% growth last year. Conversely, only 6% of the Spanish give a good grade to their
economy, which grew by only 0.7% in 2011.
There is a similar pattern with expectations about the economy over the next 12 months. More
than eight-in-ten Chinese (83%) think their economy is going to improve over the next year.
And the International Monetary Fund agrees, projecting a robust 8.2% growth.
Economic Perceptions Match Reality
* Percent change in real GDP. Data from the World Economic Outlook Database, International Monetary Fund, April 2012.
PEW RESEARCH CENTER Q14.
PEW GLOBAL ATTITUDES PROJECT ECONOMIC CONDITIONS REPORT EMBARGOED FOR RELEASE THURSDAY JULY 12, 2012 11AM ET
15
20
4143434843544651
53
152437423964
273359
3031
77
5756545148464343
35
817357535032
674540
6965
U.S.
BritainSpain
Czech Rep.Germany
PolandFrance
ItalyGreece
Russia
PakistanTunisiaJordanEgypt
TurkeyLebanon
IndiaChinaJapan
BrazilMexico
Most succeed if work hard
Hard work no guarantee
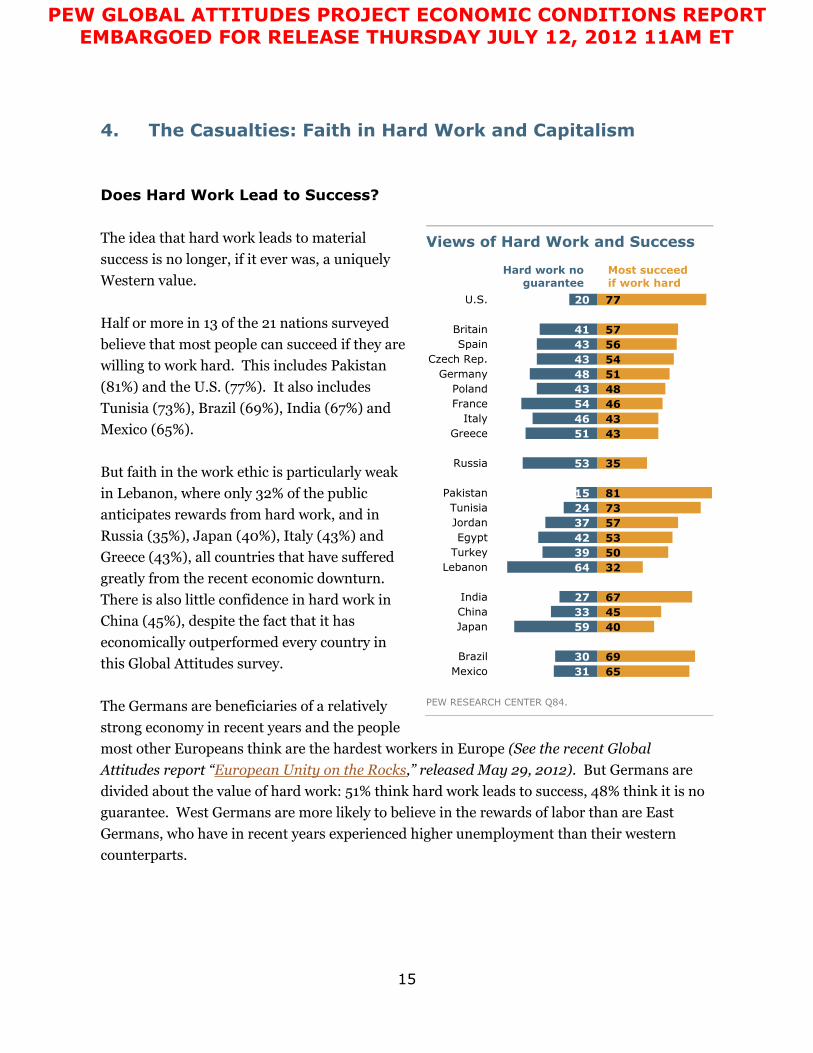
4. The Casualties: Faith in Hard Work and Capitalism Does Hard Work Lead to Success? The idea that hard work leads to material
success is no longer, if it ever was, a uniquely
Western value.
Half or more in 13 of the 21 nations surveyed
believe that most people can succeed if they are
willing to work hard. This includes Pakistan
(81%) and the U.S. (77%). It also includes
Tunisia (73%), Brazil (69%), India (67%) and
Mexico (65%).
But faith in the work ethic is particularly weak
in Lebanon, where only 32% of the public
anticipates rewards from hard work, and in
Russia (35%), Japan (40%), Italy (43%) and
Greece (43%), all countries that have suffered
greatly from the recent economic downturn.
There is also little confidence in hard work in
China (45%), despite the fact that it has
economically outperformed every country in
this Global Attitudes survey.
The Germans are beneficiaries of a relatively
strong economy in recent years and the people
most other Europeans think are the hardest workers in Europe (See the recent Global
Attitudes report “European Unity on the Rocks,” released May 29, 2012). But Germans are
divided about the value of hard work: 51% think hard work leads to success, 48% think it is no
guarantee. West Germans are more likely to believe in the rewards of labor than are East
Germans, who have in recent years experienced higher unemployment than their western
counterparts.
Views of Hard Work and Success
PEW RESEARCH CENTER Q84.
PEW GLOBAL ATTITUDES PROJECT ECONOMIC CONDITIONS REPORT EMBARGOED FOR RELEASE THURSDAY JULY 12, 2012 11AM ET

Pew Research Center’s Global Attitudes Project – www.pewglobal.org
16
75
74
69
67
62
61
61
58
55
53
50
50
50
48
47
47
44
43
42
38
34
22
19
29
24
34
25
32
43
21
37
30
45
46
36
40
52
50
54
37
60
60
Brazil
China
Germany
U.S.
Lebanon
India
Britain
France
Turkey
Poland
Italy
Egypt
Czech Rep.
Pakistan
Russia
Spain
Greece
Jordan
Tunisia
Japan
Mexico
AgreeDisagree
Those who have had personal economic
achievement in life tend to believe that hard
work leads to success. High income
individuals, especially in Britain, Russia and
Egypt, are significantly more likely than low
income earners in those countries to say most
people can get ahead if they apply themselves.
However, there is no meaningful difference in
such attitudes between the rich and the poor in
Brazil, Turkey and Tunisia, where half or more
of the population values hard work whatever
their income.
Meanwhile, people facing hard times in Europe
and Japan, but notably not elsewhere, have
lost faith in the work ethic. Half or more of
those who say their personal economic
situation is not good also think hard work is no
guarantee of success in Japan (65%), France
(63%), Germany (62%) Britain (53%), Greece
(53%), Poland (53%) and the Czech Republic
(52%). Notably, however, in most countries
outside the industrial world the work ethic has
not lost its appeal, even among those who are
suffering economically. In Egypt, Jordan,
Tunisia, India, Pakistan, Brazil and Mexico,
half or more of those who say their personal
finances are not faring well still believe that
hard work can bring economic success.
Capitalism Less Appealing
Faith in capitalism is another victim of the
Great Recession. In just 13 of the 21 nations
Higher Income More Likely to Believe Hard Work Equals Success
% Saying most can succeed if work
hard
High
income Middle income
Low income
High-low gap
% % % Britain 68 57 49 +19 Russia 45 35 26 +19 Egypt 59 60 43 +16 Germany 57 53 41 +16 U.S. 84 79 70 +14 Greece 54 45 40 +14 India 74 62 64 +10 China 53 42 44 +9
*Only countries with significant differences shown.
PEW RESEARCH CENTER Q84.
Are People Better Off in Free Market Economy?
PEW RESEARCH CENTER Q26.
PEW GLOBAL ATTITUDES PROJECT ECONOMIC CONDITIONS REPORT EMBARGOED FOR RELEASE THURSDAY JULY 12, 2012 11AM ET
Pew Research Center’s Global Attitudes Project – www.pewglobal.org
17
surveyed, half or more agree with the statement that people are better off in a free
market economy even though some people are rich and some are poor.
Support for capitalism is greatest in Brazil (75%), China (74%), Germany (69%) (although East
Germans are less supportive than West Germans) and the U.S. (67%). The biggest skeptics of
the free market can be found in Mexico (34%) and Japan (38%).
But in nine of the 16 countries for which there is trend data since 2007, before the financial
crisis began, support for capitalism is down, with the greatest declines in Italy (down 23
percentage points) and Spain (down 20 points).
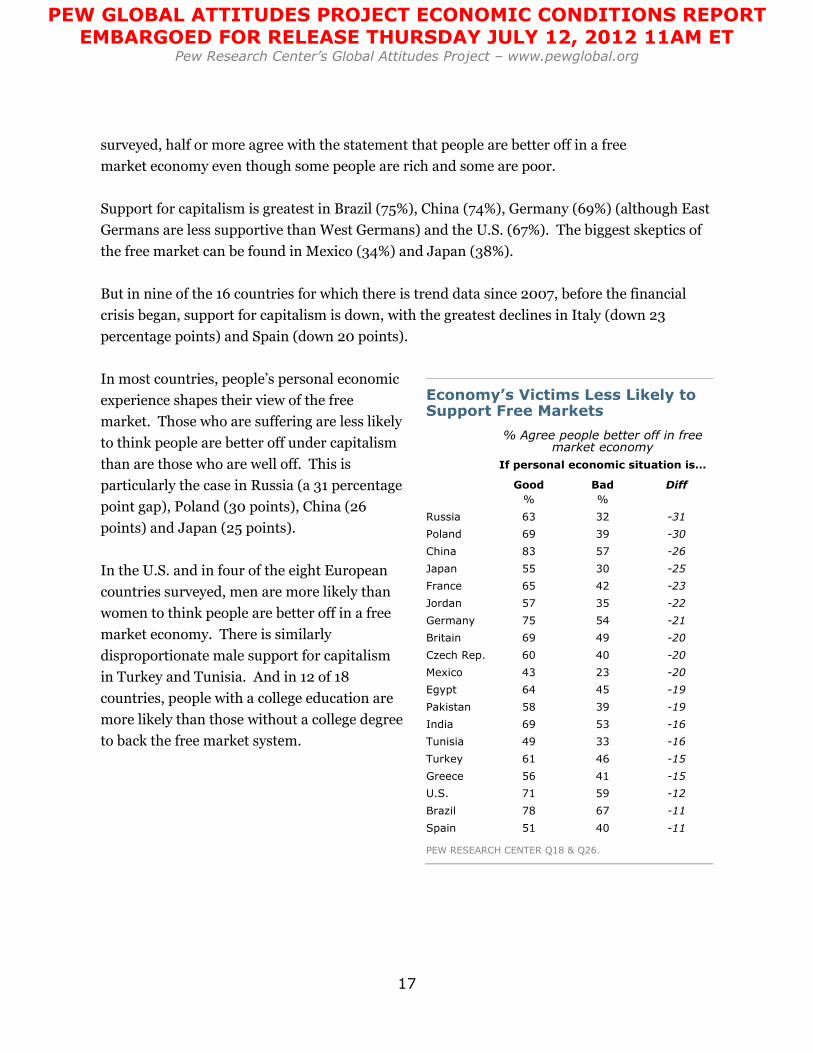
In most countries, people’s personal economic
experience shapes their view of the free
market. Those who are suffering are less likely
to think people are better off under capitalism
than are those who are well off. This is
particularly the case in Russia (a 31 percentage
point gap), Poland (30 points), China (26
points) and Japan (25 points).
In the U.S. and in four of the eight European
countries surveyed, men are more likely than
women to think people are better off in a free
market economy. There is similarly
disproportionate male support for capitalism
in Turkey and Tunisia. And in 12 of 18
countries, people with a college education are
more likely than those without a college degree
to back the free market system.
Economy’s Victims Less Likely to Support Free Markets
% Agree people better off in free
market economy
If personal economic situation is…
Good Bad Diff
% % Russia 63 32 -31 Poland 69 39 -30 China 83 57 -26 Japan 55 30 -25 France 65 42 -23 Jordan 57 35 -22 Germany 75 54 -21 Britain 69 49 -20 Czech Rep. 60 40 -20 Mexico 43 23 -20 Egypt 64 45 -19 Pakistan 58 39 -19 India 69 53 -16 Tunisia 49 33 -16 Turkey 61 46 -15 Greece 56 41 -15 U.S. 71 59 -12 Brazil 78 67 -11 Spain 51 40 -11
PEW RESEARCH CENTER Q18 & Q26.
PEW GLOBAL ATTITUDES PROJECT ECONOMIC CONDITIONS REPORT EMBARGOED FOR RELEASE THURSDAY JULY 12, 2012 11AM ET

Pew Research Center’s Global Attitudes Project – www.pewglobal.org
18
The link between the work ethic and support
for capitalism, discussed by German
sociologist Max Weber, is borne out by the
survey. In 14 of 21 countries, those who have
faith that hard work leads to economic success
are also more likely to think people are better
off in a market economy. This is particularly
the case in Britain, U.S., Russia, the Czech
Republic and China.
Those With Faith in Hard Work More Likely to Support Capitalism
% Agree people better off in free
market economy
Most succeed if work hard
Hard work no guarantee Diff
% % Britain 71 49 -22 U.S. 72 52 -20 Russia 60 40 -20 Czech Rep. 59 39 -20 China 87 69 -18 Poland 60 44 -16 Pakistan 52 36 -16 France 64 51 -13 Germany 75 64 -11 Greece 50 39 -11 Japan 44 33 -11 Mexico 38 27 -11 Egypt 54 45 -9 Spain 50 41 -9
PEW RESEARCH CENTER Q26 & Q84.
PEW GLOBAL ATTITUDES PROJECT ECONOMIC CONDITIONS REPORT EMBARGOED FOR RELEASE THURSDAY JULY 12, 2012 11AM ET
19
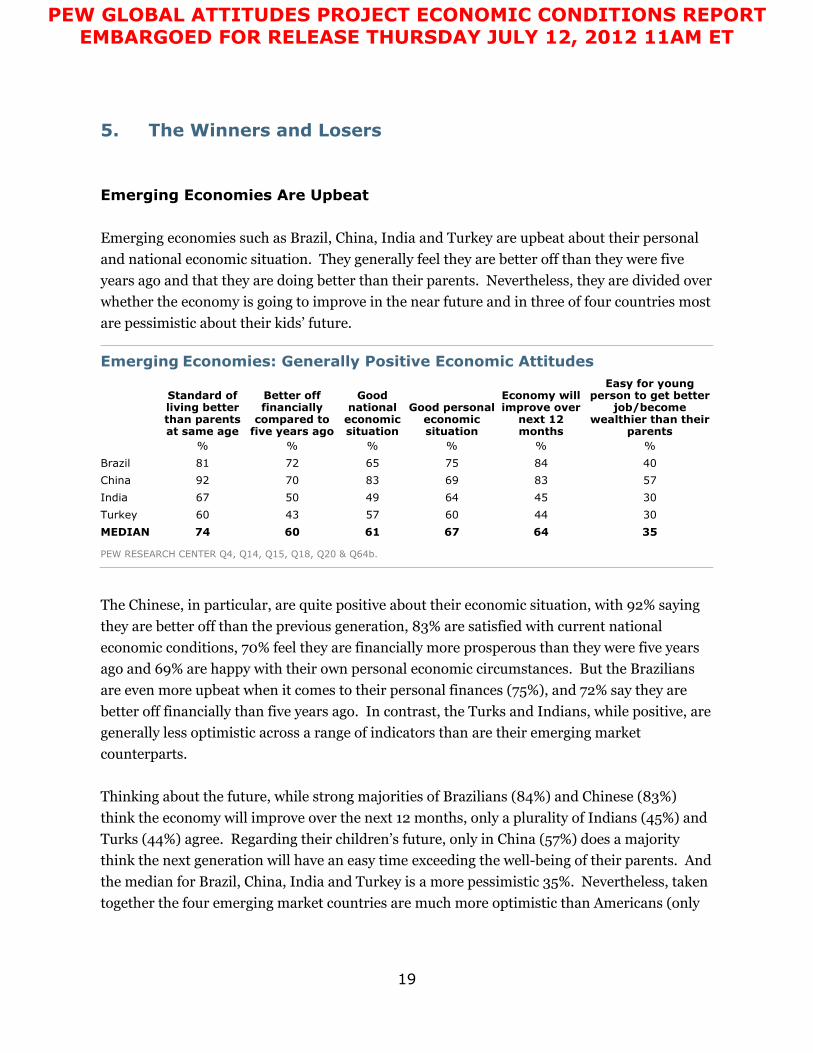
5. The Winners and Losers Emerging Economies Are Upbeat
Emerging economies such as Brazil, China, India and Turkey are upbeat about their personal
and national economic situation. They generally feel they are better off than they were five
years ago and that they are doing better than their parents. Nevertheless, they are divided over
whether the economy is going to improve in the near future and in three of four countries most
are pessimistic about their kids’ future.
The Chinese, in particular, are quite positive about their economic situation, with 92% saying
they are better off than the previous generation, 83% are satisfied with current national
economic conditions, 70% feel they are financially more prosperous than they were five years
ago and 69% are happy with their own personal economic circumstances. But the Brazilians
are even more upbeat when it comes to their personal finances (75%), and 72% say they are
better off financially than five years ago. In contrast, the Turks and Indians, while positive, are
generally less optimistic across a range of indicators than are their emerging market
counterparts.
Thinking about the future, while strong majorities of Brazilians (84%) and Chinese (83%)
think the economy will improve over the next 12 months, only a plurality of Indians (45%) and
Turks (44%) agree. Regarding their children’s future, only in China (57%) does a majority
think the next generation will have an easy time exceeding the well-being of their parents. And
the median for Brazil, China, India and Turkey is a more pessimistic 35%. Nevertheless, taken
together the four emerging market countries are much more optimistic than Americans (only
Emerging Economies: Generally Positive Economic Attitudes
Standard of living better than parents at same age
Better off financially
compared to five years ago
Good national
economic situation
Good personal economic situation
Economy will improve over
next 12 months
Easy for young person to get better
job/become wealthier than their
parents % % % % % % Brazil 81 72 65 75 84 40 China 92 70 83 69 83 57 India 67 50 49 64 45 30 Turkey 60 43 57 60 44 30 MEDIAN 74 60 61 67 64 35
PEW RESEARCH CENTER Q4, Q14, Q15, Q18, Q20 & Q64b.
PEW GLOBAL ATTITUDES PROJECT ECONOMIC CONDITIONS REPORT EMBARGOED FOR RELEASE THURSDAY JULY 12, 2012 11AM ET

Pew Research Center’s Global Attitudes Project – www.pewglobal.org
20
14% think their kids will have an easy time climbing the economic ladder) or Europeans (a
median of 9%).
Brazilians (69%) and Indians (67%) are among the strongest believers that hard work leads to
success. But the Turks (50%) and the Chinese (45%) are more skeptical.
Brazilians (75%), Chinese (74%) and Indians (61%) are among those with the greatest faith in
capitalism. Turks (55%) are slightly less committed to the free market.
As might be expected, people in emerging markets who have higher incomes are generally
more positive in their economic outlook, with some notable exceptions. Upper-income
Brazilians and Indians are much more likely to say that their economy is doing well than are
their low income compatriots. But there is no effective difference in assessment of the
economy between low-income and high-income Chinese or Turks. And, given the recent
relative success of their economies, it may not be surprising that Indians and Turks who are
well off are particularly supportive of the current free market system.
The difference in economic attitudes between people with high incomes and people with low
incomes is most notable in India, where the rich are markedly more satisfied than the poor as
measured by a range of indicators. By a margin of 25 percentage points, high-income Indians
are more satisfied than low-income Indians with their personal economic situation. The rich
in India are more likely, by 13 points, to say they are better off than they were five years ago.
By 10 points they are more likely than the less well off to subscribe to the belief that hard work
leads to success. And by nine points, they are more likely to say that their children can do even
better financially than their parents.
And the Rich Are Particularly Upbeat, Especially in India
Difference between attitudes of high income and low income people
Standard of living
better than parents at same age
Better off financially compared
to five years ago
Good national
economic situation
Good personal economic situation
Economy will
improve over next 12 months
Better off in free market
economy
Most people
can succeed if work hard
Easy for young person to get
better job/become
wealthier than their parents
% % % % % % % % Brazil +2 +6 +17 +19 +3 +10 +1 +1 China +5 +6 +1 +11 +1 +8 +9 +9 India +15 +13 +14 +25 +13 +21 +10 +9 Turkey -8 0 -2 +8 +7 +20 -4 +12
PEW RESEARCH CENTER Q4, Q14, Q15, Q18, Q20, Q26, Q64b & Q84.
PEW GLOBAL ATTITUDES PROJECT ECONOMIC CONDITIONS REPORT EMBARGOED FOR RELEASE THURSDAY JULY 12, 2012 11AM ET

Pew Research Center’s Global Attitudes Project – www.pewglobal.org
21
Among the 21 countries surveyed, Mexico and Russia are also often considered emerging
economies by financial analysts. But, in terms of the economic attitudes of their populations,
Mexico and Russia have little in common with Brazil, China, India and Turkey. Just over half
of Mexicans and Russians think they are better off than their parents, compared with a median
of nearly three-in-four Brazilians, Chinese, Indians and Turks. Similarly, about half of the
Mexicans and Russians say their personal economic situation is good, compared with a median
of two-in-three Brazilians, Chinese, Indians and Turks. And only about a third of Mexicans
and Russians believe their country’s economy is doing well and that they are better off
financially compared with five years ago. A median of about three-fifths in Brazil, China, India
and Turkey think they are doing better and say their nation’s economy is doing well.
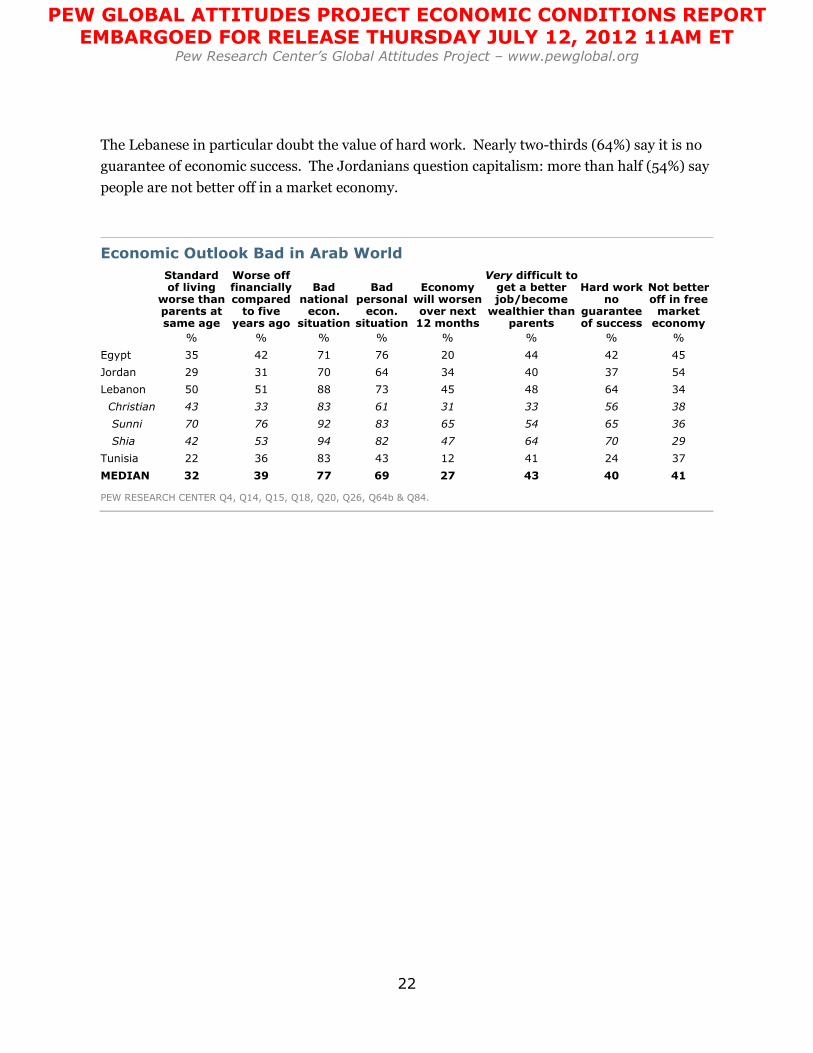
The Arab World is Downbeat
The general economic mood is particularly grim in the Arab nations surveyed, except in
Tunisia.
Strong majorities in Lebanon, Jordan and Egypt say their standard of living has either not
improved or gotten worse over the last generation. In contrast, 57% of all Tunisians think their
lives are better than that of their parents.
Majorities in Egypt (76%), Lebanon (73%) and Jordan (64%) also think their personal
economic situation is bad. But only 43% of Tunisians agree.
Differences in economic attitudes in Lebanon between religious groups are particularly
notable. Sunni and Shia Muslims are more likely than Christians to say that their personal
economic conditions are bad. Sunni are much more likely than Shia or Christians to claim that
they are worse off than their parents.
In all four Arab countries surveyed people without a college education are far more likely than
those with a college education to say that their own financial circumstances are bad. Notably,
only in Tunisia is there a generation gap with regard to personal financial circumstances.
Younger Tunisians and Lebanese, those 18-t0-29 years of age, are significantly more upbeat
about their own economic situation than are people 50 years of age and older. And people in
all the Arab countries surveyed overwhelmingly believe that it will be difficult for their children
to get a better job or to become wealthier than their parents.
PEW GLOBAL ATTITUDES PROJECT ECONOMIC CONDITIONS REPORT EMBARGOED FOR RELEASE THURSDAY JULY 12, 2012 11AM ET
Pew Research Center’s Global Attitudes Project – www.pewglobal.org
22
The Lebanese in particular doubt the value of hard work. Nearly two-thirds (64%) say it is no
guarantee of economic success. The Jordanians question capitalism: more than half (54%) say
people are not better off in a market economy.
Economic Outlook Bad in Arab World
Standard of living
worse than parents at same age
Worse off financially compared
to five years ago
Bad national
econ. situation
Bad personal
econ. situation
Economy will worsen over next 12 months
Very difficult to get a better job/become
wealthier than parents
Hard work no
guarantee of success
Not better off in free
market economy
% % % % % % % % Egypt 35 42 71 76 20 44 42 45 Jordan 29 31 70 64 34 40 37 54 Lebanon 50 51 88 73 45 48 64 34 Christian 43 33 83 61 31 33 56 38 Sunni 70 76 92 83 65 54 65 36 Shia 42 53 94 82 47 64 70 29 Tunisia 22 36 83 43 12 41 24 37 MEDIAN 32 39 77 69 27 43 40 41
PEW RESEARCH CENTER Q4, Q14, Q15, Q18, Q20, Q26, Q64b & Q84.
PEW GLOBAL ATTITUDES PROJECT ECONOMIC CONDITIONS REPORT EMBARGOED FOR RELEASE THURSDAY JULY 12, 2012 11AM ET

23
Survey Methods
About the 2012 Pew Global Attitudes Survey
Results for the survey are based on telephone and face-to-face interviews conducted under the
direction of Princeton Survey Research Associates International. Survey results are based on
national samples except in China. For further details on sample designs, see below.
The descriptions below show the margin of sampling error based on all interviews conducted
in that country. For results based on the full sample in a given country, one can say with 95%
confidence that the error attributable to sampling and other random effects is plus or minus
the margin of error. In addition to sampling error, one should bear in mind that question
wording and practical difficulties in conducting surveys can introduce error or bias into the
findings of opinion polls.
Country: Brazil
Sample design: Multi-stage cluster sample stratified by Brazil’s five regions and
proportional to population size and urban/rural population
Mode: Face-to-face adults 18 plus
Languages: Portuguese
Fieldwork dates: March 20 – April 19, 2012
Sample size: 800
Margin of Error: ±5.1 percentage points
Representative: Adult population
Country: Britain
Sample design: Random Digit Dial (RDD) probability sample representative of all
telephone households (roughly 98% of all British households)
Mode: Telephone adults 18 plus
Languages: English
Fieldwork dates: March 19 – April 15, 2012
Sample size: 1,018
Margin of Error: ±3.3 percentage points
Representative: Telephone households (including cell phone-only households)
(roughly 98% of all British households)
PEW GLOBAL ATTITUDES PROJECT ECONOMIC CONDITIONS REPORT EMBARGOED FOR RELEASE THURSDAY JULY 12, 2012 11AM ET

Pew Research Center’s Global Attitudes Project – www.pewglobal.org
24
Country: China
Sample design: Multi-stage cluster sample stratified by China’s three regional-economic
zones (which include all provinces except Tibet, Xinjiang, Hong Kong
and Macao) with disproportional sampling of the urban population.
Twelve cities, 12 towns and 12 villages were sampled covering central,
east, and west China. The cities sampled were Beijing, Shanghai,
Qingdao, Nanjing, Haikou, Qinhuangdao, Wuhan, Shangqui, Xiangtan,
Neijiang, Guilin, Chongqing. The towns covered were Zhangjiagang,
Suzhou, Jiangsu; Dashiqiao, Yingkou, Liaoning; Jimo, Qingdao,
Shandong; Gaoan Yichun, Jiangxi; Dali, DaliState, Yunnan; Shaowu,
Nanping, Fujian; Xintai, Taian, Shandong; Gaobeidian, Baoding, Hebei;
Ji’an, Tonghua, Jilin; Zaoyang, Xiangyang, Hubei; Guiping, Guigang,
Guangxi; Yicheng, Xiangyang, Hubei. Two or three villages near each of
these towns were sampled. Mode: Face-to-face adults 18 plus
Languages: Chinese (Mandarin, Hubei, Shandong, Chongqing, Hebei, Liaoning,
Guangxi, Shanghai, Jilin, Jiangxi, Sichuan, Henan, Yunnan, Jiangsu,
Hunan, and Hainan dialects)
Fieldwork dates: March 18 – April 15, 2012
Sample size: 3,177
Margin of Error: ±4.3 percentage points
Representative: Disproportionately urban (the sample is 55% urban, China’s population
is 50% urban). The sample represents roughly 64% of the adult
population.
Note: Data were purchased from Horizon Research Consultancy Group based
on their self-sponsored survey “Chinese People View the World.”
Country: Czech Republic
Sample design: Random Digit Dial (RDD) sample representative of all adults who
own a cell phone (roughly 91% of adults age 18 and older)
Mode: Telephone adults 18 plus
Languages: Czech
Fieldwork dates: March 17 – April 2, 2012
Sample size: 1,000
Margin of Error: ±3.4 percentage points
Representative: Adults who own a cell phone (roughly 91% of adults age 18 and
older)
PEW GLOBAL ATTITUDES PROJECT ECONOMIC CONDITIONS REPORT EMBARGOED FOR RELEASE THURSDAY JULY 12, 2012 11AM ET
Pew Research Center’s Global Attitudes Project – www.pewglobal.org
25
Country: Egypt
Sample design: Multi-stage cluster sample stratified by governorates (excluding
Frontier governorates for security reasons – about 2% of the
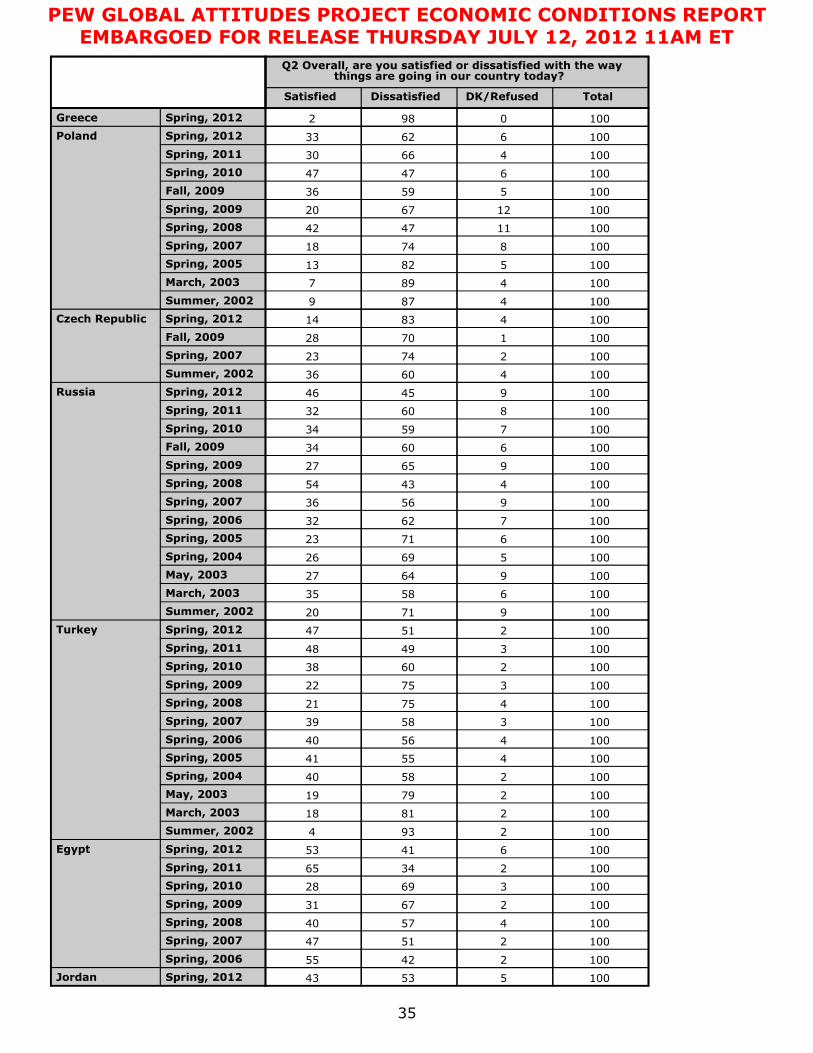
population) proportional to population size and urban/rural
population
Mode: Face-to-face adults 18 plus
Languages: Arabic
Fieldwork dates: March 19 – April 10, 2012
Sample size: 1,000
Margin of Error: ±4.2 percentage points
Representative: Adult population (excluding Frontier governorates or about 2% of
the population)
Country: France
Sample design: Random Digit Dial (RDD) sample representative of all telephone
households (roughly 99% of all French households) with quotas
for gender, age and occupation and proportional to region size and
urban/rural population
Mode: Telephone adults 18 plus
Languages: French
Fieldwork dates: March 20 – March 31, 2012
Sample size: 1,004
Margin of Error: ±3.5 percentage points
Representative: Telephone households (including cell phone-only households)
(roughly 99% of all French households)
PEW GLOBAL ATTITUDES PROJECT ECONOMIC CONDITIONS REPORT EMBARGOED FOR RELEASE THURSDAY JULY 12, 2012 11AM ET

Pew Research Center’s Global Attitudes Project – www.pewglobal.org
26
Country: Germany
Sample design: Random Last Two Digit Dial (RL(2)D) probability sample
representative all landline telephone households (roughly 91% of
all German households) stratified by administrative districts
proportional to population size and community size
Mode: Telephone adults 18 plus
Languages: German
Fieldwork dates: March 19 – April 2, 2012
Sample size: 1,000
Margin of Error: ±4.0 percentage points
Representative: Telephone households (excluding cell phone-only households [8%]
and households without telephones [1%])
Country: Greece
Sample design: Multi-stage cluster sample stratified by region and proportional
to population size and urban/rural population excluding the
islands in the Aegean and Ionian Seas (roughly 6% of the
population)
Mode: Face-to-face adults 18 plus
Languages: Greek
Fieldwork dates: March 20 – April 9, 2012
Sample size: 1,000
Margin of Error: ±3.7 percentage points
Representative: Adult population (excluding the islands in the Aegean and Ionian
Seas – roughly 6% of the population)
PEW GLOBAL ATTITUDES PROJECT ECONOMIC CONDITIONS REPORT EMBARGOED FOR RELEASE THURSDAY JULY 12, 2012 11AM ET

Pew Research Center’s Global Attitudes Project – www.pewglobal.org
27
Country: India
Sample design: Multi-stage cluster sample in the 14 most populous states (excluding
Kerala and Assam) and the Union Territory of Delhi (86% of the adult
population); disproportional sampling of the urban population (sample
50% urban/population 28% urban)
Mode: Face-to-face adults 18 plus
Languages: Hindi, Bengali, Tamil, Kannad, Telugu, Gujarati, Marathi, Oriya
Fieldwork dates: March 19 – April 19, 2012
Sample size: 4,018
Margin of Error: ±3.9 percentage points
Representative: Disproportionately urban. The data was weighted to reflect the actual
urban/rural distribution in India. Sample covers roughly 86% of the
Indian population.
Country: Italy
Sample design: Multi-stage cluster sample stratified by four regions and
proportional to population size and urban/rural population
Mode: Face-to-face adults 18 plus
Languages: Italian
Fieldwork dates: March 19 – April 10, 2012
Sample size: 1,074
Margin of Error: ±4.4 percentage points
Representative: Adult population
Country: Japan
Sample design: Random Digit Dial (RDD) probability sample representative of all
landline telephone households stratified by region and population
size
Mode: Telephone adults 18 plus
Languages: Japanese
Fieldwork dates: March 20 – April 12, 2012
Sample size: 700
Margin of Error: ±4.1 percentage points
Representative: Telephone households (excluding cell phone-only households
[roughly 9%] and households with no telephones [roughly 5%])
PEW GLOBAL ATTITUDES PROJECT ECONOMIC CONDITIONS REPORT EMBARGOED FOR RELEASE THURSDAY JULY 12, 2012 11AM ET

Pew Research Center’s Global Attitudes Project – www.pewglobal.org
28
Country: Jordan
Sample design: Multi-stage cluster sample stratified by region and Jordan’s 12
governorates and proportional to population size and urban/rural
population
Mode: Face-to-face adults 18 plus
Languages: Arabic
Fieldwork dates: March 19 – April 10, 2012
Sample size: 1,000
Margin of Error: ±4.8 percentage points
Representative: Adult population
Country: Lebanon
Sample design: Multi-stage cluster sample stratified by Lebanon’s seven major
regions (excluding a small area in Beirut controlled by a militia
group and a few villages in the south Lebanon, which border Israel
and are inaccessible to outsiders) and proportional to population
size and urban/rural population
Mode: Face-to-face adults 18 plus
Languages: Arabic
Fieldwork dates: March 19 – April 10, 2012
Sample size: 1,000
Margin of Error: ±4.2 percentage points
Representative: Adult population
Country: Mexico
Sample design: Multi-stage cluster sample stratified by region and proportional to
population size and urban/rural population
Mode: Face-to-face adults 18 plus
Languages: Spanish
Fieldwork dates: March 20 – April 2, 2012
Sample size: 1,200
Margin of Error: ±3.8 percentage points
Representative: Adult population
PEW GLOBAL ATTITUDES PROJECT ECONOMIC CONDITIONS REPORT EMBARGOED FOR RELEASE THURSDAY JULY 12, 2012 11AM ET
Pew Research Center’s Global Attitudes Project – www.pewglobal.org
29
Country: Pakistan
Sample design: Multi-stage cluster sample of all four provinces stratified by
province and the urban/rural population. (The Federally
Administered Tribal Areas, Gilgit-Baltistan, Azad Jammu and
Kashmir were excluded for security reasons, as were areas of
instability in Baluchistan and Khyber Pakhtunkhwa [formerly the
North-West Frontier Province] – roughly 18% of the population.)
Mode: Face-to-face adults 18 plus
Languages: Urdu, Pashto, Punjabi, Sindhi, Hindko, Saraiki, Brahvi, Balochi
Fieldwork dates: March 28 – April 13, 2012
Sample size: 1,206
Margin of Error: ±4.2 percentage points
Representative: Sample is disproportionately urban, but data are weighted to
reflect the actual urban/rural distribution in Pakistan. Sample
covers roughly 82% of the adult population.
Country: Poland
Sample design: Multi-stage cluster sample stratified by Poland’s 16 provinces and
proportional to population size and urban/rural population
Mode: Face-to-face adults 18 plus
Languages: Polish
Fieldwork dates: March 24 – April 16, 2012
Sample size: 1,001
Margin of Error: ±3.7 percentage points
Representative: Adult population
Country: Russia
Sample design Multi-stage cluster sample stratified by Russia’s eight regions
(excluding a few remote areas in the northern and eastern parts of
the country and Chechnya) and proportional to population size
and urban/rural population
Mode: Face-to-face adults 18 plus
Languages: Russian
Fieldwork dates: March 19 – April 4, 2012
Sample size: 1,000
Margin of Error: ±3.6 percentage points
Representative: Adult population
PEW GLOBAL ATTITUDES PROJECT ECONOMIC CONDITIONS REPORT EMBARGOED FOR RELEASE THURSDAY JULY 12, 2012 11AM ET

Pew Research Center’s Global Attitudes Project – www.pewglobal.org
30
Country: Spain
Sample design: Random Digit Dial (RDD) probability sample representative of
telephone households (about 97% of Spanish households)
stratified by region and proportional to population size
Mode: Telephone adults 18 plus
Languages: Spanish/Castilian
Fieldwork dates: March 20 – April 2, 2012
Sample size: 1,000
Margin of Error: ±3.2 percentage points
Representative: Telephone households (including cell phone-only households)
(about 97% of Spanish households)
Country: Tunisia
Sample design: Multi-stage cluster sample stratified by governorate and proportional to
population size and urban/rural population
Mode: Face-to-face adults 18 plus
Languages: Tunisian Arabic
Fieldwork dates: March 22 – April 20, 2012
Sample size: 1,000
Margin of Error: ±3.9 percentage points
Representative: Adult population
Country: Turkey
Sample design: Multi-stage cluster sample in all 26 regions (based on geographical
location and level of development [NUTS 2]) and proportional to
population size and urban/rural population
Mode: Face-to-face adults 18 plus
Languages: Turkish
Fieldwork dates: March 20 – April 11, 2012
Sample size: 1,001
Margin of Error: ±5.2 percentage points
Representative: Adult population
PEW GLOBAL ATTITUDES PROJECT ECONOMIC CONDITIONS REPORT EMBARGOED FOR RELEASE THURSDAY JULY 12, 2012 11AM ET

Pew Research Center’s Global Attitudes Project – www.pewglobal.org
31
Country: United States
Sample design: Random Digit Dial (RDD) probability sample representative of all
telephone households stratified by county
Mode: Telephone adults 18 plus
Languages: English, Spanish
Fieldwork dates: March 20 – April 4, 2012
Sample size: 1,011
Margin of Error: ±3.5 percentage points
Representative: Telephone households (including cell phone-only households)
PEW GLOBAL ATTITUDES PROJECT ECONOMIC CONDITIONS REPORT EMBARGOED FOR RELEASE THURSDAY JULY 12, 2012 11AM ET

32
Pew Global Attitudes Project 2012 Spring Survey Topline Results
July 12, 2012 Release
Methodological notes:
Survey results are based on national samples except in China. For further details on
sample designs, see Survey Methods section.
Due to rounding, percentages may not total 100%. The topline “total” columns show
100%, because they are based on unrounded numbers. When multiple responses are
allowed, totals may add to more than 100%.
Since 2007, the Global Attitudes Project has used an automated process to generate
toplines. As a result, numbers may differ slightly from those published prior to 2007.
Spring, 2011 survey in Pakistan was fielded before the death of Osama bin Laden (April
10 – April 26), while the Late Spring, 2011 survey was conducted afterwards (May 8 –
May 15).
Trends from India prior to 2011 are not shown because those results were based on
less-representative samples of the population. Since 2011, the samples have been more
representative of the Indian population.
Trends from Brazil prior to 2010 are not shown because those results were based on a
less-representative sample of the population. Since 2010, the samples have been more
representative of the Brazilian population.
Trends from Egypt in 2002 are not shown because those results were based on a less-
representative sample of the population. Since 2006, the samples have been more
representative of the Egyptian population.
Not all questions included in the Spring 2012 survey are presented in this topline.
Omitted questions have either been previously released or will be released in future
reports.
PEW GLOBAL ATTITUDES PROJECT ECONOMIC CONDITIONS REPORT EMBARGOED FOR RELEASE THURSDAY JULY 12, 2012 11AM ET

TotalDK/RefusedDissatisfiedSatisfied
Q2 Overall, are you satisfied or dissatisfied with the way things are going in our country today?
Spring, 2012
Spring, 2011
Spring, 2010
Fall, 2009
Spring, 2009
Spring, 2008
Spring, 2007
Spring, 2006
Spring, 2005
Spring, 2004
Summer, 2002
Spring, 2012
Spring, 2011
Spring, 2010
Fall, 2009
Spring, 2009
Spring, 2008
Spring, 2007
Spring, 2006
Spring, 2005
Spring, 2004
May, 2003
March, 2003
Summer, 2002
Spring, 2012
Spring, 2011
Spring, 2010
Fall, 2009
Spring, 2009
Spring, 2008
Spring, 2007
Spring, 2006
Spring, 2005
Spring, 2004
May, 2003
March, 2003
Summer, 2002
United States
Britain
France
10016732
10026731
10005644
10006832
10007128
10008020
10007822
10007129
10007327
10006732
10007426
10007525
10007129
10046432
10066330
10054946
10045838
10055144
10065835
10046630
10056530
10047621
10076429
10076331
10076132
10056530
10045541
10065539
10055739
10066529
10047125
10067023
10036136
10076430
10086230
10067321
10076429
PEW GLOBAL ATTITUDES PROJECT ECONOMIC CONDITIONS REPORT EMBARGOED FOR RELEASE THURSDAY JULY 12, 2012 11AM ET
33

TotalDK/RefusedDissatisfiedSatisfied
Q2 Overall, are you satisfied or dissatisfied with the way things are going in our country today?
Spring, 2012
Spring, 2011
Spring, 2010
Fall, 2009
Spring, 2009
Spring, 2008
Spring, 2007
Spring, 2006
Spring, 2005
Spring, 2004
May, 2003
March, 2003
Summer, 2002
Spring, 2012
Spring, 2011
Spring, 2010
Fall, 2009
Spring, 2009
Spring, 2008
Spring, 2007
Spring, 2006
Spring, 2005
May, 2003
March, 2003
Spring, 2012
Fall, 2009
Spring, 2007
May, 2003
March, 2003
Summer, 2002
Germany
Spain
Italy
10067024
10077420
10036729
10047916
10047225
10028711
100124741
10035245
10054451
10044650
10044551
10074350
10027721
10037521
10027622
10028315
10028810
10036631
10037918
10027325
10027820
10027325
10056729
10026633
10036334
10035443
10025048
10025939
10035443
10024553
PEW GLOBAL ATTITUDES PROJECT ECONOMIC CONDITIONS REPORT EMBARGOED FOR RELEASE THURSDAY JULY 12, 2012 11AM ET
34
TotalDK/RefusedDissatisfiedSatisfied
Q2 Overall, are you satisfied or dissatisfied with the way things are going in our country today?
Spring, 2012
Spring, 2012
Spring, 2011
Spring, 2010
Fall, 2009
Spring, 2009
Spring, 2008
Spring, 2007
Spring, 2005
March, 2003
Summer, 2002
Spring, 2012
Fall, 2009
Spring, 2007
Summer, 2002
Spring, 2012
Spring, 2011
Spring, 2010
Fall, 2009
Spring, 2009
Spring, 2008
Spring, 2007
Spring, 2006
Spring, 2005
Spring, 2004
May, 2003
March, 2003
Summer, 2002
Spring, 2012
Spring, 2011
Spring, 2010
Spring, 2009
Spring, 2008
Spring, 2007
Spring, 2006
Spring, 2005
Spring, 2004
May, 2003
March, 2003
Summer, 2002
Spring, 2012
Spring, 2011
Spring, 2010
Spring, 2009
Spring, 2008
Spring, 2007
Spring, 2006
Spring, 2012
Greece
Poland
Czech Republic
Russia
Turkey
Egypt
Jordan 10055343
10024255
10025147
10045740
10026731
10036928
10023465
10064153
1002934
10028118
10027919
10025840
10045541
10045640
10035839
10047521
10037522
10026038
10034948
10025147
10097120
10065835
10096427
10056926
10067123
10076232
10095636
10044354
10096527
10066034
10075934
10086032
10094546
10046036
10027423
10017028
10048314
1004879
1004897
10058213
10087418
100114742
100126720
10055936
10064747
10046630
10066233
1000982
PEW GLOBAL ATTITUDES PROJECT ECONOMIC CONDITIONS REPORT EMBARGOED FOR RELEASE THURSDAY JULY 12, 2012 11AM ET
35

TotalDK/RefusedDissatisfiedSatisfied
Q2 Overall, are you satisfied or dissatisfied with the way things are going in our country today?
Spring, 2011
Spring, 2010
Spring, 2009
Spring, 2008
Spring, 2007
Spring, 2006
Spring, 2005
Spring, 2004
May, 2003
Summer, 2002
Spring, 2012
Spring, 2011
Spring, 2010
Spring, 2009
Spring, 2008
Spring, 2007
Spring, 2005
May, 2003
Summer, 2002
Spring, 2012
Spring, 2012
Spring, 2011
Spring, 2010
Spring, 2009
Spring, 2008
Spring, 2007
Spring, 2006
Spring, 2005
Summer, 2002
Spring, 2012
Spring, 2011
Spring, 2012
Spring, 2011
Spring, 2010
Spring, 2009
Spring, 2008
Spring, 2007
Spring, 2006
Summer, 2002
Spring, 2012
Late Spring, 2011
Spring, 2011
Spring, 2010
Spring, 2009
Spring, 2008
Spring, 2007
Spring, 2006
Spring, 2005
Jordan
Lebanon
Tunisia
China
India
Japan
Pakistan
10043957
10075835
10045739
10027325
1002899
10028414
1001899
1002926
10018712
10028612
10017227
10077122
10037423
10027325
10047620
10037225
10027820
10024751
10035938
100193348
100101972
10061381
10051283
10031186
1004987
1004987
10051085
10071182
10027820
1001927
10018414
10025940
1002926
1002926
10028711
10028611
10018711
10018415
10017821
10025642
100113059
10013069
10034453
10024256
10044749
10025246
10016435
10035444
PEW GLOBAL ATTITUDES PROJECT ECONOMIC CONDITIONS REPORT EMBARGOED FOR RELEASE THURSDAY JULY 12, 2012 11AM ET
36

TotalDK/RefusedDissatisfiedSatisfied
Q2 Overall, are you satisfied or dissatisfied with the way things are going in our country today?
Spring, 2004
May, 2003
Summer, 2002
Spring, 2012
Spring, 2011
Spring, 2010
Spring, 2012
Spring, 2011
Spring, 2010
Spring, 2009
Spring, 2008
Spring, 2007
Summer, 2002
Pakistan
Brazil
Mexico
10067916
10036630
10026830
10037820
10027919
10027622
10036334
10024950
10034652
10015643
100123949
10046729
10054154
TotalDK/RefusedVery difficultSomewhat difficult
Somewhat easyVery easy
Q4 How easy or difficult is it in our country for a young person to get a better job and to become wealthier than his or her parents were – very easy, somewhat easy, somewhat
difficult or very difficult?
Spring, 2012
Spring, 2012
Spring, 2012
Spring, 2012
Spring, 2012
Spring, 2012
Spring, 2012
Spring, 2012
Spring, 2012
Spring, 2012
Spring, 2012
Spring, 2012
Spring, 2012
Spring, 2012
Spring, 2012
Spring, 2012
Spring, 2012
Spring, 2012
Spring, 2012
Spring, 2012
Spring, 2012
United States
Britain
France
Germany
Spain
Italy
Greece
Poland
Czech Republic
Russia
Turkey
Egypt
Jordan
Lebanon
Tunisia
China
India
Japan
Pakistan
Brazil
Mexico 10034235146
100032272416
10016520103
1002375191
100344221911
10068294413
10014134214
10024839111
10034038163
10024441112
100432342010
10033837156
10043842161
10024437143
1000732321
1001623152
1001692432
10022357171
1000375671
1003503881
10053943122
PEW GLOBAL ATTITUDES PROJECT ECONOMIC CONDITIONS REPORT EMBARGOED FOR RELEASE THURSDAY JULY 12, 2012 11AM ET
37

TotalDK/RefusedVery badSomewhat
badSomewhat
goodVery good
Q14 Now thinking about our economic situation, how would you describe the current economic situation in (survey country) – is it very good, somewhat good, somewhat bad or
very bad?
Spring, 2012
Spring, 2011
Spring, 2010
Fall, 2009
Spring, 2009
Spring, 2008
Spring, 2007
Summer, 2002
Spring, 2012
Spring, 2011
Spring, 2010
Fall, 2009
Spring, 2009
Spring, 2008
Spring, 2007
Summer, 2002
Spring, 2012
Spring, 2011
Spring, 2010
Fall, 2009
Spring, 2009
Spring, 2008
Spring, 2007
Summer, 2002
Spring, 2012
Spring, 2011
Spring, 2010
Fall, 2009
Spring, 2009
Spring, 2008
Spring, 2007
Summer, 2002
Spring, 2012
Spring, 2011
Spring, 2010
Fall, 2009
Spring, 2009
Spring, 2008
Spring, 2007
Spring, 2012
Fall, 2009
Spring, 2007
Summer, 2002
United States
Britain
France
Germany
Spain
Italy
10021151360
10051456241
10022848193
1001563751
1001529569
10031943341
10024738121
10014543111
10004840121
1000622791
1000722251
10011655261
10011125558
1001739494
10021654271
10011258271
1001847422
1001527589
10005226112
1002647441
10001753291
10002061190
10002758140
10002460151
10003156121
10003152170
10002952181
1004824578
10038205613
10022047282
10024938101
10023845142
10013940182
10014045141
10013747141
10021339424
10031632419
10033641182
10014142152
10023444191
10013441231
10014238171
10023038283
PEW GLOBAL ATTITUDES PROJECT ECONOMIC CONDITIONS REPORT EMBARGOED FOR RELEASE THURSDAY JULY 12, 2012 11AM ET
38

TotalDK/RefusedVery badSomewhat
badSomewhat
goodVery good
Q14 Now thinking about our economic situation, how would you describe the current economic situation in (survey country) – is it very good, somewhat good, somewhat bad or
very bad?
Spring, 2012
Spring, 2012
Spring, 2011
Spring, 2010
Fall, 2009
Spring, 2009
Spring, 2008
Spring, 2007
Summer, 2002
Spring, 2012
Fall, 2009
Spring, 2007
Summer, 2002
Spring, 2012
Spring, 2011
Spring, 2010
Fall, 2009
Spring, 2009
Spring, 2008
Spring, 2007
Summer, 2002
Spring, 2012
Spring, 2011
Spring, 2010
Spring, 2009
Spring, 2008
Spring, 2007
Summer, 2002
Spring, 2012
Spring, 2011
Spring, 2010
Spring, 2009
Spring, 2008
Spring, 2007
Spring, 2012
Spring, 2011
Spring, 2010
Spring, 2009
Spring, 2008
Spring, 2007
Summer, 2002
Spring, 2012
Spring, 2011
Spring, 2010
Spring, 2009
Spring, 2008
Spring, 2007
Summer, 2002
Spring, 2012
Spring, 2012
Spring, 2011
Spring, 2010
Spring, 2009
Spring, 2008
Greece
Poland
Czech Republic
Russia
Turkey
Egypt
Jordan
Lebanon
Tunisia
China
1004113775
1002196919
1002077219
1003086919
1007196617
10014043161
1000702550
1004543272
1001523891
10005436101
10005234121
10025035112
10005335111
10011849276
100213413212
10011644318
10002344303
10012643255
10002741249
10033040244
100223234013
100225293410
10004429243
10003347182
10022836286
10023140234
10027015122
10032229379
10044727174
10033537222
10013629313
100325233712
100514244512
10042657130
10061145353
1004637475
10052155182
10041850253
10041649303
10061946245
10051549284
10011148391
10011543374
10003249171
10004539151
1002514070
10031348360
1006636493
10061550272
10031247362
1003836485
10032249251
10032346263
1000782020
PEW GLOBAL ATTITUDES PROJECT ECONOMIC CONDITIONS REPORT EMBARGOED FOR RELEASE THURSDAY JULY 12, 2012 11AM ET
39

TotalDK/RefusedVery badSomewhat
badSomewhat
goodVery good
Q14 Now thinking about our economic situation, how would you describe the current economic situation in (survey country) – is it very good, somewhat good, somewhat bad or
very bad?
Spring, 2007
Summer, 2002
Spring, 2012
Spring, 2011
Spring, 2012
Spring, 2011
Spring, 2010
Spring, 2009
Spring, 2008
Spring, 2007
Summer, 2002
Spring, 2012
Late Spring, 2011
Spring, 2011
Spring, 2010
Spring, 2009
Spring, 2008
Spring, 2007
Summer, 2002
Spring, 2012
Spring, 2011
Spring, 2010
Spring, 2012
Spring, 2011
Spring, 2010
Spring, 2009
Spring, 2008
Spring, 2007
Summer, 2002
China
India
Japan
Pakistan
Brazil
Mexico
10033036283
10011829447
10022735306
10013336255
10013837222
10022840264
10022537332
1002729584
10011332513
1001827578
100142016418
100912203920
10043521338
10045024202
10045820153
10036023104
1003652084
1003642581
1000514260
10021754271
10012857121
1001434791
10003949111
1001424691
1000494470
100221223422
100524213514
10011037493
10041136616
PEW GLOBAL ATTITUDES PROJECT ECONOMIC CONDITIONS REPORT EMBARGOED FOR RELEASE THURSDAY JULY 12, 2012 11AM ET
40

TotalDK/RefusedWorsen a lotWorsen a
littleRemain the
sameImprove a
littleImprove a
lot
Q15 And over the next 12 months do you expect the economic situation in our country to improve a lot, improve a little, remain the same, worsen a little or worsen a lot?
Spring, 2012
Spring, 2011
Spring, 2010
Spring, 2009
Spring, 2008
Summer, 2002
Spring, 2012
Spring, 2011
Spring, 2010
Spring, 2009
Spring, 2008
Summer, 2002
Spring, 2012
Spring, 2011
Spring, 2010
Spring, 2009
Spring, 2008
Summer, 2002
Spring, 2012
Spring, 2011
Spring, 2010
Spring, 2009
Spring, 2008
Summer, 2002
Spring, 2012
Spring, 2011
Spring, 2010
Spring, 2009
Spring, 2008
Spring, 2012
Summer, 2002
United States
Britain
France
Germany
Spain
Italy
100342043291
1002232429211
100573633171
100392128362
100171930403
1001142134273
1001192827232
100141739373
100162339293
100181925423
100051531453
100031742353
100142343272
100262336293
1000133334181
1000152829252
1000162734211
1000223032161
1000142637202
100372439225
1002183728122
100381530386
100571327416
1001182526283
1001112135293
100251728399
1004132624277
10021013164811
1002912204313
1001131825357
1002713264111
PEW GLOBAL ATTITUDES PROJECT ECONOMIC CONDITIONS REPORT EMBARGOED FOR RELEASE THURSDAY JULY 12, 2012 11AM ET
41
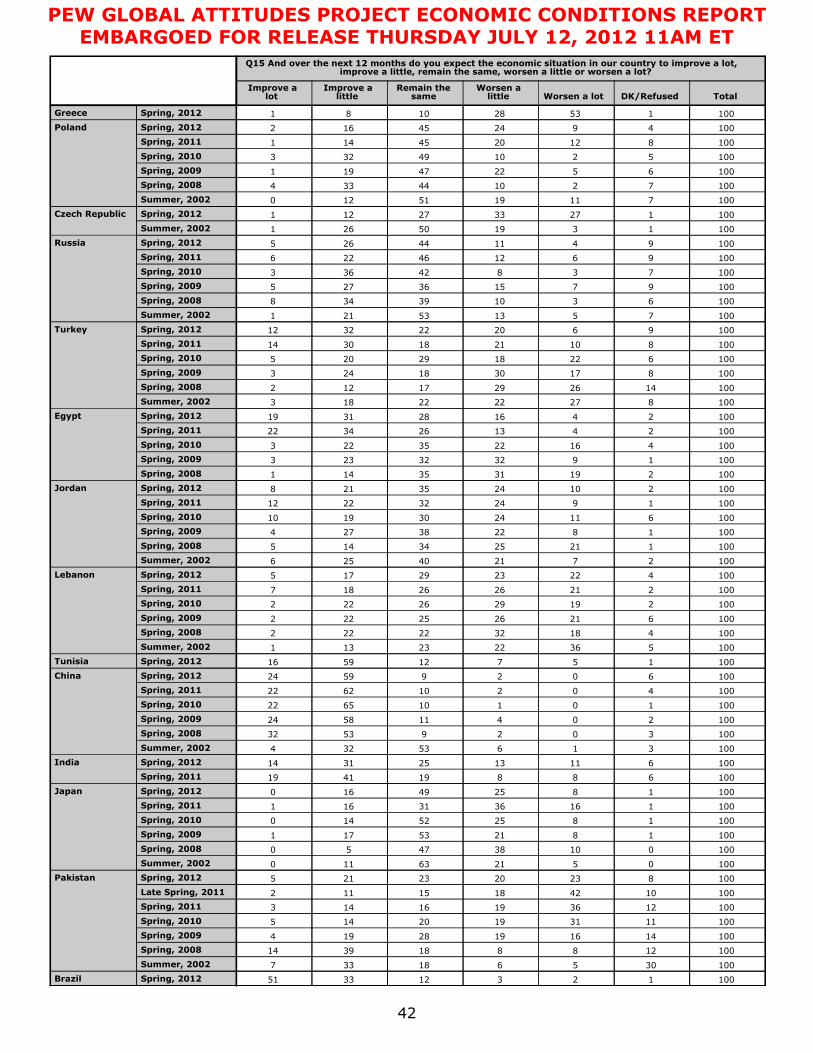
TotalDK/RefusedWorsen a lotWorsen a
littleRemain the
sameImprove a
littleImprove a
lot
Q15 And over the next 12 months do you expect the economic situation in our country to improve a lot, improve a little, remain the same, worsen a little or worsen a lot?
Spring, 2012
Spring, 2012
Spring, 2011
Spring, 2010
Spring, 2009
Spring, 2008
Summer, 2002
Spring, 2012
Summer, 2002
Spring, 2012
Spring, 2011
Spring, 2010
Spring, 2009
Spring, 2008
Summer, 2002
Spring, 2012
Spring, 2011
Spring, 2010
Spring, 2009
Spring, 2008
Summer, 2002
Spring, 2012
Spring, 2011
Spring, 2010
Spring, 2009
Spring, 2008
Spring, 2012
Spring, 2011
Spring, 2010
Spring, 2009
Spring, 2008
Summer, 2002
Spring, 2012
Spring, 2011
Spring, 2010
Spring, 2009
Spring, 2008
Summer, 2002
Spring, 2012
Spring, 2012
Spring, 2011
Spring, 2010
Spring, 2009
Spring, 2008
Summer, 2002
Spring, 2012
Spring, 2011
Spring, 2012
Spring, 2011
Spring, 2010
Spring, 2009
Spring, 2008
Summer, 2002
Spring, 2012
Late Spring, 2011
Spring, 2011
Spring, 2010
Spring, 2009
Spring, 2008
Summer, 2002
Spring, 2012
Greece
Poland
Czech Republic
Russia
Turkey
Egypt
Jordan
Lebanon
Tunisia
China
India
Japan
Pakistan
Brazil 100123123351
100305618337
1001288183914
10014161928194
10011311920145
10012361916143
10010421815112
1008232023215
100052163110
100010384750
100182153171
100182552140
1001163631161
100182549160
100688194119
10061113253114
10031653324
10030295332
100204115824
100101106522
100402106222
10060295924
100157125916
1005362223131
1004183222222
1006212625222
1002192926222
1002212626187
1004222329175
100272140256
1001212534145
100182238274
10061124301910
1001924322212
1002102435218
1002193135141
100193232233
1004162235223
1002413263422
1002416283119
1008272222183
10014262917122
1008173018243
1006221829205
10081021183014
1009620223212
100751353211
100631039348
100971536275
10073842363
100961246226
100941144265
100131950261
1001273327121
1007111951120
100721044334
100652247191
100521049323
1008122045141
100492445162
100153281081
PEW GLOBAL ATTITUDES PROJECT ECONOMIC CONDITIONS REPORT EMBARGOED FOR RELEASE THURSDAY JULY 12, 2012 11AM ET
42

TotalDK/RefusedWorsen a lotWorsen a
littleRemain the
sameImprove a
littleImprove a
lot
Q15 And over the next 12 months do you expect the economic situation in our country to improve a lot, improve a little, remain the same, worsen a little or worsen a lot?
Spring, 2011
Spring, 2010
Spring, 2012
Spring, 2011
Spring, 2010
Spring, 2009
Spring, 2008
Summer, 2002
Brazil
Mexico
1006812293311
1002516353012
100259244219
10031016253512
1001913293513
1001412323219
100313173936
100025142950
Total N=DK/Refused
None of the above
(Volunteered)
The (survey country) public
The European Union
The United States
Banks and other major financial
institutions
Our government [In China: Chinese
government]
Q16 ASK IF THE ECONOMIC SITUATION IS ‘SOMEWHAT BAD’ OR ‘VERY BAD’ IN Q14: Who is most to blame for (survey country’s) current economic problems? Is it…
Spring, 2012
Spring, 2011
Spring, 2010
Spring, 2012
Spring, 2011
Spring, 2010
Spring, 2012
Spring, 2011
Spring, 2010
Spring, 2012
Spring, 2011
Spring, 2010
Spring, 2012
Spring, 2012
Spring, 2012
Spring, 2011
Spring, 2010
Spring, 2012
Spring, 2012
Spring, 2011
Spring, 2010
Spring, 2012
Spring, 2011
Spring, 2010
Spring, 2012
Spring, 2010
Spring, 2012
Spring, 2011
Spring, 2010
Spring, 2012
Spring, 2011
Spring, 2010
Spring, 2012
Spring, 2012
Spring, 2011
Spring, 2010
Spring, 2012
Spring, 2011
Spring, 2012
Spring, 2011
Spring, 2010
Spring, 2012
Late Spring, 2011
Spring, 2011
Spring, 2010
Spring, 2012
Spring, 2011
Spring, 2010
Spring, 2012
Spring, 2011
Spring, 2010
Britain
France
Germany
Spain
Italy
Greece
Poland
Czech Republic
Russia
Turkey
Egypt
Jordan
Lebanon
Tunisia
China
India
Japan
Pakistan
Brazil
Mexico
973100511107473
55010031905478
75710031816476
358100832312757
342100402601565
291100212022864
161610061607278
160510041608279
104910051606379
103510030507183
619100611515468
634100621901666
652100311521672
149510020912580
1865100301611377
2591001033626745
30010017222111352
30010025231141243
828100443103553
853100321203971
8571003110061268
8791002571111065
6891001022172255
6751000032172652
6951002133122158
7931000011212552
7041001132162256
662100101836368
49410050839371
379100101548567
6411001124291558
648100142424668
631100112313675
83210021781676
33310061542873
53310061342875
67210041241780
9791000211511269
1001100327512259
659100428343147
892100119334141
9401002112525127
378100515774728
273100326723149
217100313944337
6441000081283736
8321000091123839
8231000181344629
601100316244143
860100345334637
850100257534435
PEW GLOBAL ATTITUDES PROJECT ECONOMIC CONDITIONS REPORT EMBARGOED FOR RELEASE THURSDAY JULY 12, 2012 11AM ET
43
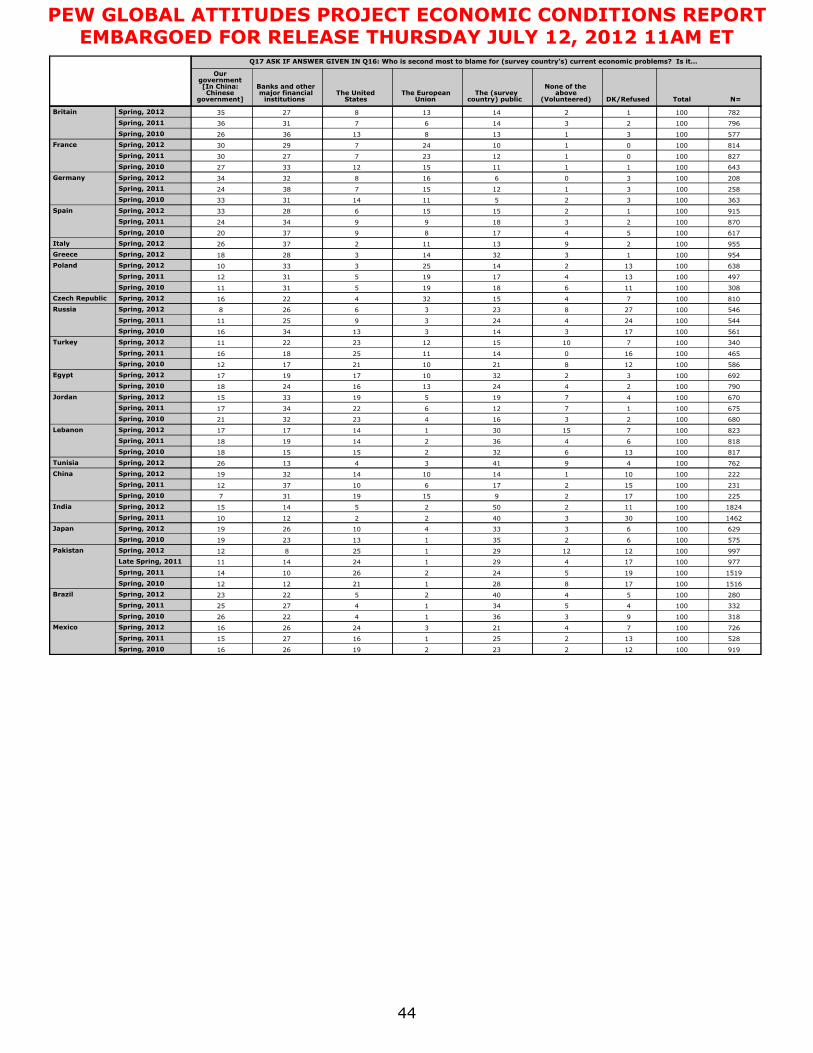
Total N=DK/Refused
None of the above
(Volunteered)The (survey
country) publicThe European
UnionThe United
States
Banks and other major financial institutions
Our government [In China: Chinese
government]
Q17 ASK IF ANSWER GIVEN IN Q16: Who is second most to blame for (survey country’s) current economic problems? Is it…
Spring, 2012
Spring, 2011
Spring, 2010
Spring, 2012
Spring, 2011
Spring, 2010
Spring, 2012
Spring, 2011
Spring, 2010
Spring, 2012
Spring, 2011
Spring, 2010
Spring, 2012
Spring, 2012
Spring, 2012
Spring, 2011
Spring, 2010
Spring, 2012
Spring, 2012
Spring, 2011
Spring, 2010
Spring, 2012
Spring, 2011
Spring, 2010
Spring, 2012
Spring, 2010
Spring, 2012
Spring, 2011
Spring, 2010
Spring, 2012
Spring, 2011
Spring, 2010
Spring, 2012
Spring, 2012
Spring, 2011
Spring, 2010
Spring, 2012
Spring, 2011
Spring, 2012
Spring, 2010
Spring, 2012
Late Spring, 2011
Spring, 2011
Spring, 2010
Spring, 2012
Spring, 2011
Spring, 2010
Spring, 2012
Spring, 2011
Spring, 2010
Britain
France
Germany
Spain
Italy
Greece
Poland
Czech Republic
Russia
Turkey
Egypt
Jordan
Lebanon
Tunisia
China
India
Japan
Pakistan
Brazil
Mexico
919100122232192616
528100132251162715
72610074213242616
3181009336142226
3321004534142725
2801005440252223
1516100178281211212
1519100195242261014
977100174291241411
997100121229125812
57510062351132319
62910063334102619
146210030340221210
182410011250251415
22510017291519317
231100152176103712
2221001011410143219
7621004941341326
817100136322151518
81810064362141918
823100715301141717
68010023164233221
67510017126223417
67010047195193315
790100242413162418
692100323210171917
5861001282110211712
4651001601411251816
3401007101512232211
561100173143133416
54410024424392511
5461002782336268
81010074153242216
308100116181953111
497100134171953112
638100132142533310
95410013321432818
95510029131123726
6171005417893720
8701002318993424
91510012151562833
36310032511143133
25810031121573824
2081003061683234
643100111115123327
82710001122372730
81410001102472930
57710031138133626
7961002314673136
78210012141382735
PEW GLOBAL ATTITUDES PROJECT ECONOMIC CONDITIONS REPORT EMBARGOED FOR RELEASE THURSDAY JULY 12, 2012 11AM ET
44

DK/Refused
None of the above
(Volunteered)The (survey
country) publicThe European
UnionThe United
States
Banks and other major financial institutions
Our government [In China: Chinese
government]
Q16/Q17 COMBINED
Spring, 2012
Spring, 2011
Spring, 2010
Spring, 2012
Spring, 2011
Spring, 2010
Spring, 2012
Spring, 2011
Spring, 2010
Spring, 2012
Spring, 2011
Spring, 2010
Spring, 2012
Spring, 2012
Spring, 2012
Spring, 2011
Spring, 2010
Spring, 2012
Spring, 2012
Spring, 2011
Spring, 2010
Spring, 2012
Spring, 2011
Spring, 2010
Spring, 2012
Spring, 2010
Spring, 2012
Spring, 2011
Spring, 2010
Spring, 2012
Spring, 2011
Spring, 2010
Spring, 2012
Spring, 2012
Spring, 2011
Spring, 2010
Spring, 2012
Spring, 2011
Spring, 2012
Spring, 2010
Spring, 2012
Late Spring, 2011
Spring, 2011
Spring, 2010
Spring, 2012
Spring, 2011
Spring, 2010
Spring, 2012
Spring, 2011
Spring, 2010
Britain
France
Germany
Spain
Italy
Greece
Poland
Czech Republic
Russia
Turkey
Egypt
Jordan
Lebanon
Tunisia
China
India
Japan
Pakistan
Brazil
Mexico
163322252988
153341203093
105274302991
16555252680
8558153189
7558472986
229321261389
225292331193
214331291690
1412332321095
123472172686
84465113091
31348441791
14264261792
2551119423551
294167204362
323138253556
81268371778
157432182388
85453193185
819352242681
33185395377
17158395970
68217315372
242513374970
433511324073
2192612241879
2002114322187
16101915282576
264174204572
355244122777
34922382882
85213952791
166222263784
184192273786
163152853990
16421943987
610191525884
962411136666
342612127565
33261987859
721017207760
63182196871
62925127470
111827207063
11213486568
011837107459
621810177668
5718997570
371916106967
Total column not shown. Total adds to more than 100% because of multiple responses
PEW GLOBAL ATTITUDES PROJECT ECONOMIC CONDITIONS REPORT EMBARGOED FOR RELEASE THURSDAY JULY 12, 2012 11AM ET
45

TotalDK/RefusedVery badSomewhat
badSomewhat
goodVery good
Q18 Now thinking about your personal economic situation, how would you describe it – is it very good, somewhat good, somewhat bad or very bad?
Spring, 2012
Spring, 2009
Spring, 2008
Spring, 2012
Spring, 2009
Spring, 2008
Spring, 2012
Spring, 2009
Spring, 2008
Spring, 2012
Spring, 2009
Spring, 2008
Spring, 2012
Spring, 2009
Spring, 2008
Spring, 2012
Spring, 2012
Spring, 2012
Spring, 2009
Spring, 2008
Spring, 2012
Spring, 2012
Spring, 2009
Spring, 2008
Spring, 2012
Spring, 2009
Spring, 2008
Spring, 2012
Spring, 2009
Spring, 2008
Spring, 2012
Spring, 2009
Spring, 2008
Spring, 2012
Spring, 2009
Spring, 2008
Spring, 2012
Spring, 2012
Spring, 2009
Spring, 2008
Spring, 2007
Spring, 2012
Spring, 2012
Spring, 2009
Spring, 2008
Spring, 2012
Spring, 2009
Spring, 2008
Spring, 2012
Spring, 2012
Spring, 2009
Spring, 2008
United States
Britain
France
Germany
Spain
Italy
Greece
Poland
Czech Republic
Russia
Turkey
Egypt
Jordan
Lebanon
Tunisia
China
India
Japan
Pakistan
Brazil
Mexico
1002930546
10011133477
10021135475
1000420705
100210185614
100219274111
10022126438
10031348361
10021338443
10011846331
100410214816
1002636533
1002428633
10013196017
1007420636
10011627542
10022542274
10002245284
10002944233
10012444283
10012736316
10032638276
10013339206
10023435237
10023640185
10052529373
10032133395
10011129519
1005940433
10061041384
1007739434
10011237464
1004528612
1007731523
1003943441
10003350161
10041342401
1003623653
1001723627
10011726507
1001823607
10024206311
1001422659
1000626653
1000423685
1000926623
1002521639
10016186212
1001728568
10037185813
10017165818
10028225513
PEW GLOBAL ATTITUDES PROJECT ECONOMIC CONDITIONS REPORT EMBARGOED FOR RELEASE THURSDAY JULY 12, 2012 11AM ET
46
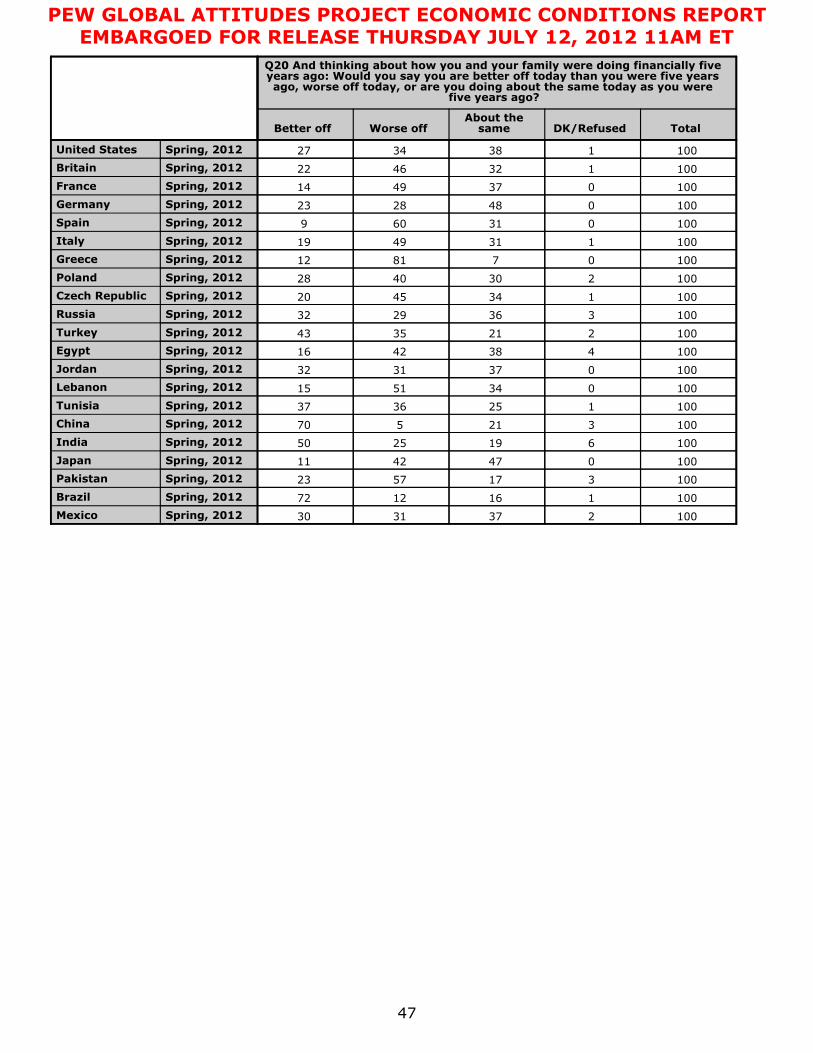
TotalDK/RefusedAbout the
sameWorse offBetter off
Q20 And thinking about how you and your family were doing financially five years ago: Would you say you are better off today than you were five years ago, worse off today, or are you doing about the same today as you were
five years ago?
Spring, 2012
Spring, 2012
Spring, 2012
Spring, 2012
Spring, 2012
Spring, 2012
Spring, 2012
Spring, 2012
Spring, 2012
Spring, 2012
Spring, 2012
Spring, 2012
Spring, 2012
Spring, 2012
Spring, 2012
Spring, 2012
Spring, 2012
Spring, 2012
Spring, 2012
Spring, 2012
Spring, 2012
United States
Britain
France
Germany
Spain
Italy
Greece
Poland
Czech Republic
Russia
Turkey
Egypt
Jordan
Lebanon
Tunisia
China
India
Japan
Pakistan
Brazil
Mexico 1002373130
1001161272
1003175723
1000474211
1006192550
100321570
1001253637
1000345115
1000373132
1004384216
1002213543
1003362932
1001344520
1002304028
100078112
1001314919
100031609
1000482823
1000374914
1001324622
1001383427
PEW GLOBAL ATTITUDES PROJECT ECONOMIC CONDITIONS REPORT EMBARGOED FOR RELEASE THURSDAY JULY 12, 2012 11AM ET
47

TotalDK/RefusedCompletely disagree
Mostly disagreeMostly agree
Completely agree
Q26 Please tell me whether you completely agree, mostly agree, mostly disagree or completely disagree with the following statement - most people are better off in a free
market economy, even though some people are rich and some are poor
Spring, 2012
Spring, 2010
Spring, 2009
Spring, 2007
Summer, 2002
Spring, 2012
Spring, 2010
Fall, 2009
Spring, 2009
Spring, 2007
Summer, 2002
Spring, 2012
Spring, 2010
Fall, 2009
Spring, 2009
Spring, 2007
Summer, 2002
Spring, 2012
Spring, 2010
Fall, 2009
Spring, 2009
Spring, 2007
Summer, 2002
Spring, 2012
Spring, 2010
Fall, 2009
Spring, 2009
Spring, 2007
Spring, 2012
Fall, 2009
Spring, 2007
Summer, 2002
United States
Britain
France
Germany
Spain
Italy
100114145120
100114125221
10073155421
100199214010
10076205314
10049314710
10078254910
10047274913
100215373611
10029204722
100211225114
10029274912
10026264916
10018186013
10029205514
100511234021
100021233818
100017264116
100018224021
100015175116
100019244513
10076204620
10048165517
10079194917
10076205215
10087214915
100710224912
10077144428
10065194525
10055144630
10096185018
10086184522
PEW GLOBAL ATTITUDES PROJECT ECONOMIC CONDITIONS REPORT EMBARGOED FOR RELEASE THURSDAY JULY 12, 2012 11AM ET
48

TotalDK/RefusedCompletely disagree
Mostly disagreeMostly agree
Completely agree
Q26 Please tell me whether you completely agree, mostly agree, mostly disagree or completely disagree with the following statement - most people are better off in a free
market economy, even though some people are rich and some are poor
Spring, 2012
Spring, 2012
Spring, 2010
Fall, 2009
Spring, 2009
Spring, 2007
Summer, 2002
Spring, 2012
Fall, 2009
Spring, 2007
Summer, 2002
Spring, 2012
Spring, 2010
Fall, 2009
Spring, 2009
Spring, 2007
Summer, 2002
Spring, 2012
Spring, 2010
Spring, 2009
Spring, 2007
Summer, 2002
Spring, 2012
Spring, 2010
Spring, 2009
Spring, 2007
Spring, 2012
Spring, 2010
Spring, 2009
Spring, 2007
Summer, 2002
Spring, 2012
Spring, 2010
Spring, 2009
Spring, 2007
Summer, 2002
Spring, 2012
Spring, 2012
Spring, 2010
Spring, 2009
Spring, 2008
Spring, 2007
Summer, 2002
Spring, 2012
Spring, 2012
Spring, 2010
Spring, 2009
Spring, 2007
Summer, 2002
Spring, 2012
Spring, 2010
Spring, 2009
Greece
Poland
Czech Republic
Russia
Turkey
Egypt
Jordan
Lebanon
Tunisia
China
India
Japan
Pakistan
100148123035
100227142829
1001615213216
100110452914
1002743427
100211453110
10021342376
10011347335
100138173526
10019205119
10014206015
10024245416
10013175920
10012146222
10063165321
1002218192418
10094113244
10016204034
100115204420
100218214020
100414203725
100013401928
100513353215
100216272826
100319302919
100420343013
100519273218
100115243426
100323232922
100619262525
1001015152436
100196154218
100207134119
100155163727
100256154213
100418333213
100712283617
100712293615
100417264012
100511234020
1001312283611
100211254319
10028304217
100511225112
100514323812
100619322915
10066205315
10066234916
10095164723
10084205414
10011730458
100719313311
PEW GLOBAL ATTITUDES PROJECT ECONOMIC CONDITIONS REPORT EMBARGOED FOR RELEASE THURSDAY JULY 12, 2012 11AM ET
49

TotalDK/RefusedCompletely disagree
Mostly disagreeMostly agree
Completely agree
Q26 Please tell me whether you completely agree, mostly agree, mostly disagree or completely disagree with the following statement - most people are better off in a free
market economy, even though some people are rich and some are poor
Spring, 2007
Summer, 2002
Spring, 2012
Spring, 2010
Spring, 2012
Spring, 2010
Spring, 2009
Pakistan
Brazil
Mexico
100713283814
1001117273113
100720402410
10048134530
10038145124
100281482624
1001811123129
TotalDK/Refused
Parents did not live to the
age of respondent
(Volunteered)Much worseSomewhat
worseAbout the
sameSomewhat
betterMuch better
Q64b Compared to your parents when they were the same age as you are now, do you think your own standard of living now is much better, somewhat better, about the same, somewhat worse, or much worse than theirs was?
Spring, 2012
Spring, 2012
Spring, 2012
Spring, 2012
Spring, 2012
Spring, 2012
Spring, 2012
Spring, 2012
Spring, 2012
Spring, 2012
Spring, 2012
Spring, 2012
Spring, 2012
Spring, 2012
Spring, 2012
Spring, 2012
Spring, 2012
Spring, 2012
Spring, 2012
Spring, 2012
Spring, 2012
United States
Britain
France
Germany
Spain
Italy
Greece
Poland
Czech Republic
Russia
Turkey
Egypt
Jordan
Lebanon
Tunisia
China
India
Japan
Pakistan
Brazil
Mexico 10021311304212
1000025113546
100211923162216
10002820233215
1006057143730
100101155339
10010814202730
10000173329147
1001162339283
10012431292311
10050412183624
10031712213719
10011614183724
10051310243720
10001818163918
10021818143423
10010511123239
1001159153040
100011319183216
10011411202934
10021612202931
PEW GLOBAL ATTITUDES PROJECT ECONOMIC CONDITIONS REPORT EMBARGOED FOR RELEASE THURSDAY JULY 12, 2012 11AM ET
50
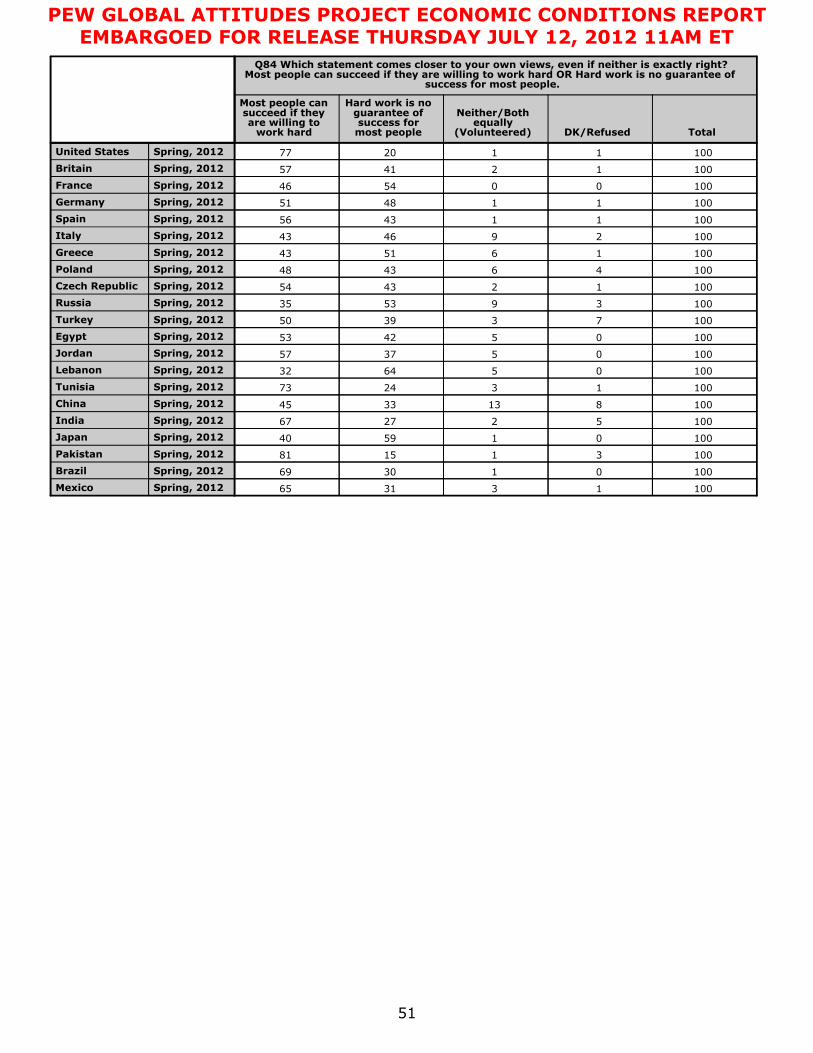
TotalDK/Refused
Neither/Both equally
(Volunteered)
Hard work is no guarantee of success for most people
Most people can succeed if they are willing to work hard
Q84 Which statement comes closer to your own views, even if neither is exactly right? Most people can succeed if they are willing to work hard OR Hard work is no guarantee of
success for most people.
Spring, 2012
Spring, 2012
Spring, 2012
Spring, 2012
Spring, 2012
Spring, 2012
Spring, 2012
Spring, 2012
Spring, 2012
Spring, 2012
Spring, 2012
Spring, 2012
Spring, 2012
Spring, 2012
Spring, 2012
Spring, 2012
Spring, 2012
Spring, 2012
Spring, 2012
Spring, 2012
Spring, 2012
United States
Britain
France
Germany
Spain
Italy
Greece
Poland
Czech Republic
Russia
Turkey
Egypt
Jordan
Lebanon
Tunisia
China
India
Japan
Pakistan
Brazil
Mexico 100133165
100013069
100311581
100015940
100522767
1008133345
100132473
100056432
100053757
100054253
100733950
100395335
100124354
100464348
100165143
100294643
100114356
100114851
100005446
100124157
100112077
PEW GLOBAL ATTITUDES PROJECT ECONOMIC CONDITIONS REPORT EMBARGOED FOR RELEASE THURSDAY JULY 12, 2012 11AM ET
51

52
Appendix
For income, respondents are grouped into three categories of low, middle and high. The exact
breaks by country are outlined below.
Brazil
Low-income respondents are those with a reported monthly household income of 1,244 reais
or less, middle-income respondents fall between the range of 1,245 to 2,488 reais per month,
and those in the high-income category earn 2,489 reais or more per month.
Britain
Low-income respondents are those with a reported yearly household income of 19,999 pounds
or less, middle-income respondents fall between the range of 20,000 to 39,999 pounds per
year, and those in the high-income category earn 40,000 pounds or more per year.
China
Low-income respondents are those with a reported yearly household income of 25,000 yuan or
less, middle-income respondents fall between the range of 25,001 and 50,000 yuan per year,
and those in the high-income category earn 50,001 yuan or more per year.
Czech Republic
Low-income respondents are those with a reported monthly household income of 17,000
koruna or less, middle-income respondents fall between the range of 17,001 to 35,000 koruna
per month, and those in the high-income category earn 35,001 koruna or more per month.
Egypt
Low-income respondents are those with a reported monthly household income of 1,000
Egyptian pounds or less, middle-income respondents fall between the range of 1,001 to 2,500
Egyptian pounds per month, and those in the high-income category earn 2,501 Egyptian
pounds or more per month.
PEW GLOBAL ATTITUDES PROJECT ECONOMIC CONDITIONS REPORT EMBARGOED FOR RELEASE THURSDAY JULY 12, 2012 11AM ET

Pew Research Center’s Global Attitudes Project – www.pewglobal.org
53
France
Low-income respondents are those with a reported monthly household income of 1,450 euros
or less, middle-income respondents fall between the range of 1,451 to 2,450 euros per month,
and those in the high-income category earn 2,451 euros or more per month.
Germany
Low-income respondents are those with a reported monthly household income of 1,500 euros
or less, middle-income respondents fall between the range of 1,501 to 3,000 euros per month,
and those in the high-income category earn 3,001 euros or more per month.
Greece
Low-income respondents are those with a reported monthly household income of 750 euros or
less, middle-income respondents fall between the range of 751 to 1,500 euros per month, and
those in the high-income category earn 1,501 euros or more per month.
India
Low-income respondents are those with a reported monthly household income of 4,000
rupees or less, middle-income respondents fall between the range of 4,001 to 6,000 rupees per
month, and those in the high-income category earn 6,001 rupees or more per month.
Italy
Low-income respondents are those with a reported monthly household income of 1,000 euros
or less, middle-income respondents fall between the range of 1,001 to 2,000 euros per month,
and those in the high-income category earn 2,001 euros or more per month.
Japan
Low-income respondents are those with a reported yearly household income of 3 million yen
or less, middle-income respondents fall between the range of 3 million to 7 million yen per
year, and those in the high-income category earn 7 million yen or more per year.
PEW GLOBAL ATTITUDES PROJECT ECONOMIC CONDITIONS REPORT EMBARGOED FOR RELEASE THURSDAY JULY 12, 2012 11AM ET

Pew Research Center’s Global Attitudes Project – www.pewglobal.org
54
Jordan
Low-income respondents are those with a reported monthly household income of 250
Jordanian dinars or less, middle-income respondents fall between the range of 251 to 400
Jordanian dinars per month, and those in the high-income category earn 401 Jordanian dinars
or more per month.
Lebanon
Low-income respondents are those with a reported monthly household income of 1,000
Lebanese pounds or less, middle-income respondents fall between the range of 1,001 to 2,000
Lebanese pounds per month, and those in the high-income category earn 2,001 Lebanese
pounds or more per month.
Mexico
Low-income respondents are those with a reported monthly household income of 3,630 pesos
or less, middle-income respondents fall between the range of 3,631 to 7,260 pesos per month,
and those in the high-income category earn 7,261 pesos or more per month.
Pakistan
Low-income respondents are those with a reported monthly household income of 7,000 rupees
or less, middle-income respondents fall between the range of 7,001 to 15,000 rupees per
month, and those in the high-income category earn 15,001 rupees or more per month.
Poland
Low-income respondents are those with a reported monthly household income of 1,999 zloty
or less, middle-income respondents fall between the range of 2,000 to 2,999 zloty per month,
and those in the high-income category earn 3,000 zloty or more per month.
Russia
Low-income respondents are those with a reported monthly household income of 10,000
rubles or less, middle-income respondents fall between the range of 10,001 to 25,000 rubles
per month, and those in the high-income category earn 25,001 rubles or more per month.
PEW GLOBAL ATTITUDES PROJECT ECONOMIC CONDITIONS REPORT EMBARGOED FOR RELEASE THURSDAY JULY 12, 2012 11AM ET

Pew Research Center’s Global Attitudes Project – www.pewglobal.org
55
Spain
Low-income respondents are those with a reported monthly household income of 999 euros or
less, middle-income respondents fall between the range of 1,000 to 1,999 euros per month,
and those in the high-income category earn 2,000 euros or more per month.
Tunisia
Low-income respondents are those with a reported monthly household income of 400
Tunisian dinars or less, middle-income respondents fall between the range of 401 to 800
Tunisian dinars per month, and those in the high-income category earn 801 Tunisian dinars or
more per month.
Turkey
Low-income respondents are those with a reported monthly household income of 750 Turkish
liras or less, middle-income respondents fall between the range of 751 to 1,500 Turkish liras
per month, and those in the high-income category earn 1,501 Turkish liras or more per month.
United States
Low-income respondents are those with a reported yearly household income of $30,000 or
less, middle-income respondents fall between the range of $30,001 to $75,000 per year, and
those in the high-income category earn $75,001 or more per year.
PEW GLOBAL ATTITUDES PROJECT ECONOMIC CONDITIONS REPORT EMBARGOED FOR RELEASE THURSDAY JULY 12, 2012 11AM ET