PETRONAS Group · 2018-11-27 · Capital Investments and Group Costs 67% 33% Malaysia International...
18
PETRONAS Group Financial Results Announcement Q3 FY2018 © 2018 PETROLIAM NASIONAL BERHAD (PETRONAS) All rights reserved. No part of this document may be reproduced, stored in a retrieval system or transmitted in any form or by any means (electronic, mechanical, photocopying, recording or otherwise) without the permission of the copyright owner.
Transcript of PETRONAS Group · 2018-11-27 · Capital Investments and Group Costs 67% 33% Malaysia International...
PETRONAS Group Financial Results AnnouncementQ3 FY2018
© 2018 PETROLIAM NASIONAL BERHAD (PETRONAS)
All rights reserved. No part of this document may be reproduced, stored in a retrieval system or transmitted in any form or by any means (electronic, mechanical, photocopying, recording or otherwise) without the permission of the copyright owner.
Cautionary StatementForward-looking statements in this Financial Results Announcement presentation or in subsequent discussions withregards to this presentation involve inherent risks and uncertainties. Should one or more of these or otheruncertainties or risks materialise, actual results may vary materially from those estimated, anticipated orprojected. Specifically, but without limitation, capital costs could increase, projects could be delayed, andanticipated improvements in capacity, performance or profit levels might not be fully realised. Although PETRONASbelieves that the expectations of its management as reflected by such forward-looking statements are reasonablebased on information currently available to it, no assurances can be given that such expectations will prove tohave been correct. Accordingly, you are cautioned not to place undue reliance on the forward-looking statements,which speak only as of the date they are made. PETRONAS undertakes no obligation to update or revise any ofthem, whether as a result of new information, future developments or otherwise.
All rights reserved. No part of this document may be reproduced, stored in a retrieval system or transmitted in anyform or by any means (electronic, mechanical, photocopying, recording or otherwise) without the permission ofthe copyright owner. PETRONAS makes no representation or warranty, whether express or implied, as to theaccuracy or completeness of the facts presented. PETRONAS disclaims responsibility from any liability arising outof reliance on the contents of this publication.
Financial Results Announcement 30 September 2018, Financial Highlights | Page 1
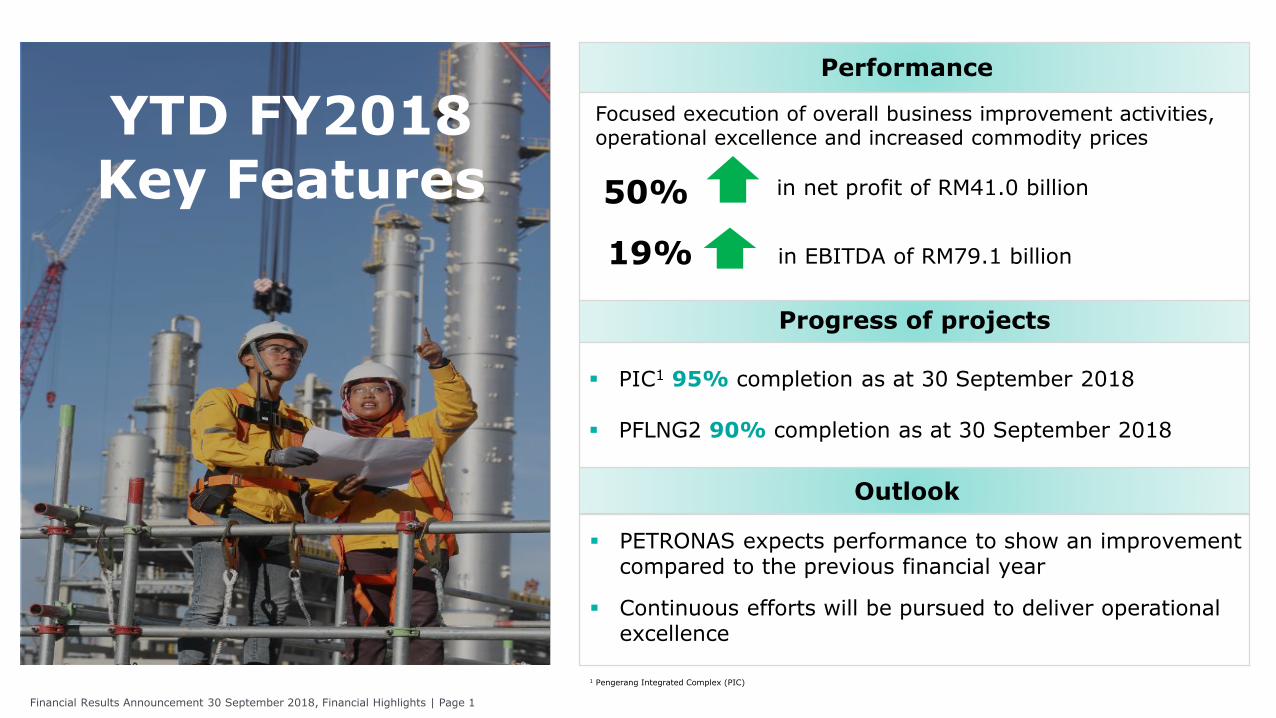
Performance
50% in net profit of RM41.0 billion
19% in EBITDA of RM79.1 billion
Progress of projects
Focused execution of overall business improvement activities, operational excellence and increased commodity prices
PIC1 95% completion as at 30 September 2018
PFLNG2 90% completion as at 30 September 2018
Outlook
PETRONAS expects performance to show an improvement compared to the previous financial year
Continuous efforts will be pursued to deliver operational excellence
YTD FY2018Key Features
1 Pengerang Integrated Complex (PIC)

YTD FY2018 Financial Highlights
Key Financial Indicators (RM bil)
YTD ‘17 YTD ‘18
Revenue 161.8 181.1
Profit After Tax (PAT) 27.3 41.0
PAT excluding net impairment/(write-back) on assets
28.8 39.9
EBITDA 66.7 79.1
EBITDA Margin 41% 44%
CFFO 57.7 56.2
Capital investments 33.8 26.5
Financial Results Announcement 30 September 2018, Financial Highlights | Page 2
1 Average exchange rate2 Represents Malaysia’s production (PETRONAS Group and other Operators) and PETRONAS Group’s international equity production volume 3 Represents PETRONAS Group’s sales entitlement to Malaysia’s production and PETRONAS Group’s international sales entitlement volume
Production2 Entitlement3
1,624
20171,742
$65.35
2017$51.98
JCC single-month
(USD/bbl)
MYR/USD1
RM3.99
2017RM4.35
Dated Brent (USD/bbl)
$72.13
2017$51.90
Production2
2,313
20172,296
(kboe/d) (kboe/d)
CAPEX spending is anticipated to increase in Q4 driven by requirements for PIC, LNG Canada as well as increased drilling activities both domestic and abroad
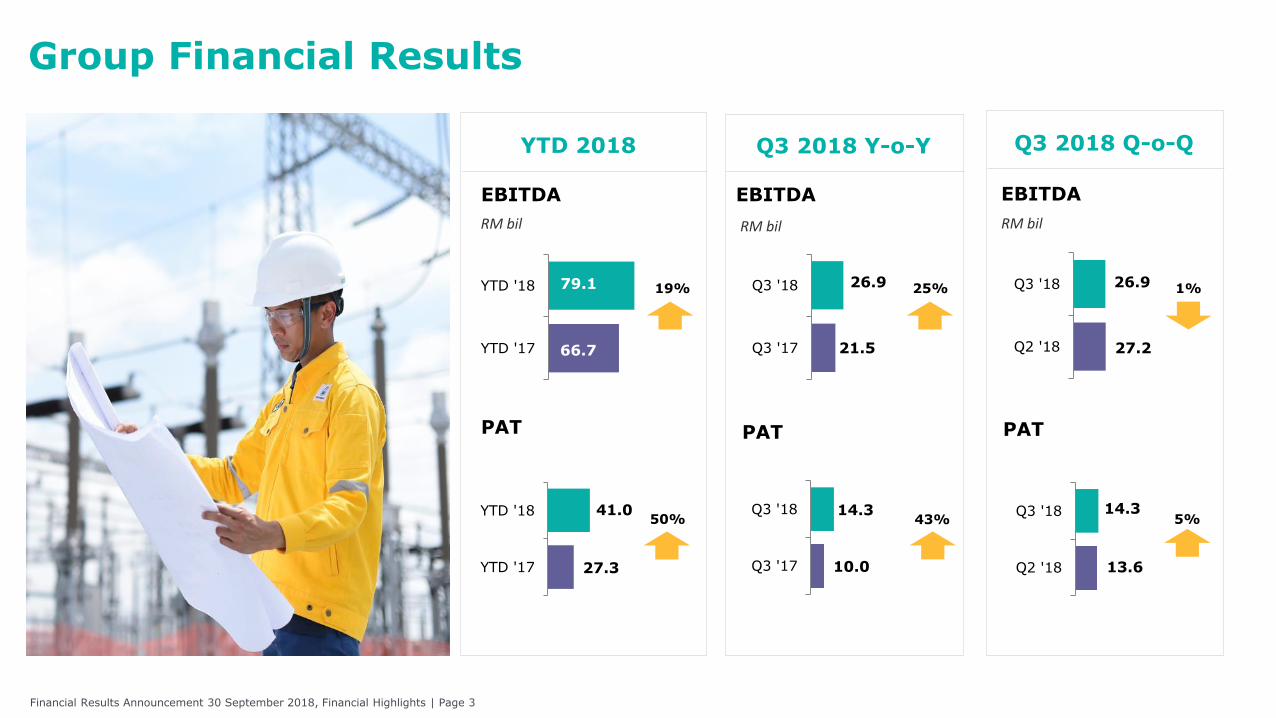
Group Financial Results
EBITDA
19%
RM bil
50%
PAT
YTD 2018
Financial Results Announcement 30 September 2018, Financial Highlights | Page 3
10.0
14.3
Q3 '17
Q3 '18
EBITDA
25%
RM bil
43%
PAT
Q3 2018 Y-o-Y
27.2
26.9
Q2 '18
Q3 '18
EBITDA
1%
RM bil
5%
PAT
Q3 2018 Q-o-Q
66.7
79.1
YTD '17
YTD '18
27.3
41.0
YTD '17
YTD '18
13.6
14.3
Q2 '18
Q3 '18
21.5
26.9
Q3 '17
Q3 '18
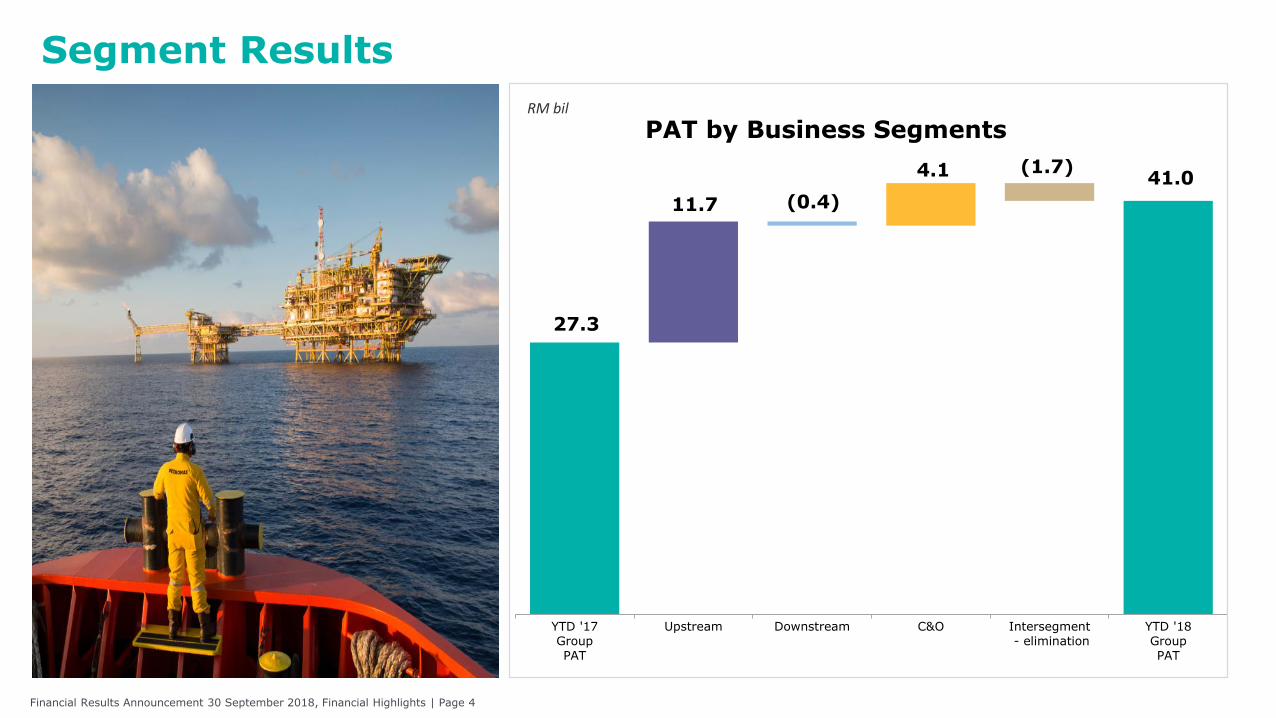
YTD '17
Group
PAT
Upstream Downstream C&O Intersegment
- elimination
YTD '18
Group
PAT
PAT by Business Segments
27.3
11.7
41.0
(0.4)
(1.7)4.1
RM bil
Segment Results
Financial Results Announcement 30 September 2018, Financial Highlights | Page 4
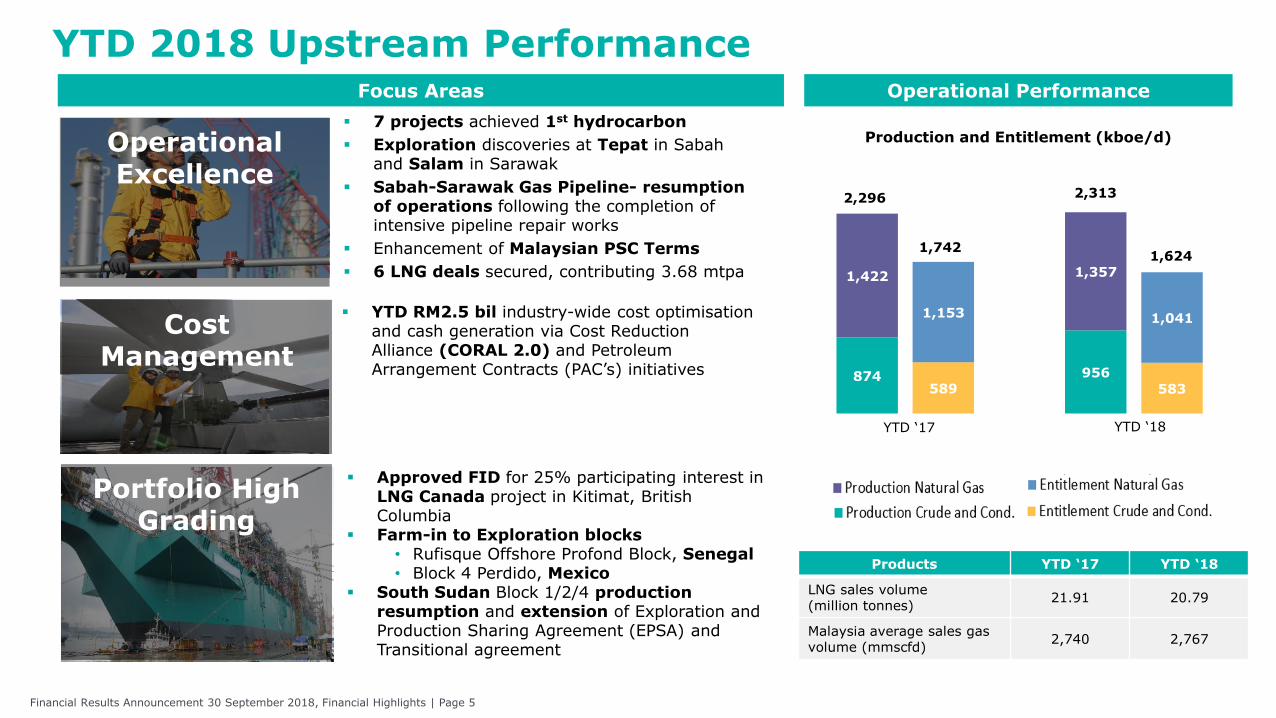
YTD 2018 Upstream PerformanceFocus Areas
Products YTD ‘17 YTD ‘18
LNG sales volume (million tonnes)
21.91 20.79
Malaysia average sales gas volume (mmscfd)
2,740 2,767
Operational Performance
874 956
1,422 1,357
589 583
1,153 1,041
Production and Entitlement (kboe/d)
2,313
1,624
2,296
1,742
YTD ‘18YTD ‘17
Operational Excellence
Cost Management
Portfolio High Grading
YTD RM2.5 bil industry-wide cost optimisationand cash generation via Cost Reduction Alliance (CORAL 2.0) and Petroleum Arrangement Contracts (PAC’s) initiatives
Approved FID for 25% participating interest in LNG Canada project in Kitimat, British Columbia
Farm-in to Exploration blocks• Rufisque Offshore Profond Block, Senegal• Block 4 Perdido, Mexico
South Sudan Block 1/2/4 productionresumption and extension of Exploration and Production Sharing Agreement (EPSA) and Transitional agreement
Financial Results Announcement 30 September 2018, Financial Highlights | Page 5
7 projects achieved 1st hydrocarbon
Exploration discoveries at Tepat in Sabah and Salam in Sarawak
Sabah-Sarawak Gas Pipeline- resumption of operations following the completion of intensive pipeline repair works
Enhancement of Malaysian PSC Terms
6 LNG deals secured, contributing 3.68 mtpa

186.9
104.1
187.6
102.3
Petroleum products
(Million Barrels)
Crude oil
(Million Barrels)
6.0 6.3
Petrochemicals products
(Million Metric Tonnes)
YTD 2018 Downstream PerformanceSales VolumeFocus Areas
PETRONAS’ retail business recorded the highest unit
margin in 5 years
Operational & Commercial Excellence
Downstream OEE at 93.6%
Plant Utilisation for petrochemicals plants at 91.2%
Domestic and International retail recorded 3% volume
improvement between Quarter 3 and Quarter 2
Financial Results Announcement 30 September 2018, Financial Highlights | Page 6
YTD ‘17 YTD ‘18

Capital Investments and Group Costs
67%
33%
Malaysia International
RM26.5bil
YTD Capital investmentsRM Bil
33.8
26.5
YTD '17 YTD '18
22%
• Higher total costs mainly due to higher product costs in tandem with higher prices
• Continuous Groupwide cost management efforts are in place
Capital Investments
Group Costs1
137.2145.2
YTD '17 YTD '18
6%RM Bil
1 Relate to costs charged to Income Statement only
Financial Results Announcement 30 September 2018, Financial Highlights | Page 7

Other Financial Highlights
Notes:1 ROACE is calculated as trailing 12 months profit before interest expense after tax divided by average total equity and long term debt during the period2 Others consist of Upstream (50%), Downstream (11%) and Corporate & Others (39%)
Improved balance sheet position contributed by profit generated during the period on the back of ongoing operational improvements and better commodity prices
ROACE1 at 12.6% up from9.8% as at 31 December 2017
33%26%
41%
RM26.5bil
Financial Results Announcement 30 September 2018, Financial Highlights | Page 8
Cash & fund investments RM46.3 bil
RM Bil
Dividends to Non-Controlling Interest
Capital Investments
Cash from financing
Other net cash outflows
Cash from operations
56.2
37.0
4.0
26.5
4.4
17.0
3.0
Dividends to Government
Proceeds from disposal of inv. in subsi
YTD ‘18 Net Inflows
YTD ’18 Net Outflows
2

Upstream Business

Operational Highlights
projects achieved
1st Hydrocarbon(6 Brownfield, 1 Greenfield)7
Exploration discoveries at Tepat in Sabah and Salam in Sarawak
Approved FID for LNG Canada project in Kitimat, British Columbia
Enhancement of Malaysian PSC Terms Deepwater Fiscal Terms Non Fiscal Terms
Sabah-Sarawak Gas Pipeline resumption ensuing the completion of intensive pipeline repair works
LNG deals secured,
contributing 3.68 mtpa6Farm-in to Exploration blocks Rufisque Offshore Profond Block in
Senegal Block 4 Perdido in Mexico
South Sudan Block 1/2/4 Production resumption Extension of Exploration and
Production Sharing Agreement and Transitional Agreement
Financial Results Announcement 30 September 2018, Upstream | Page 1
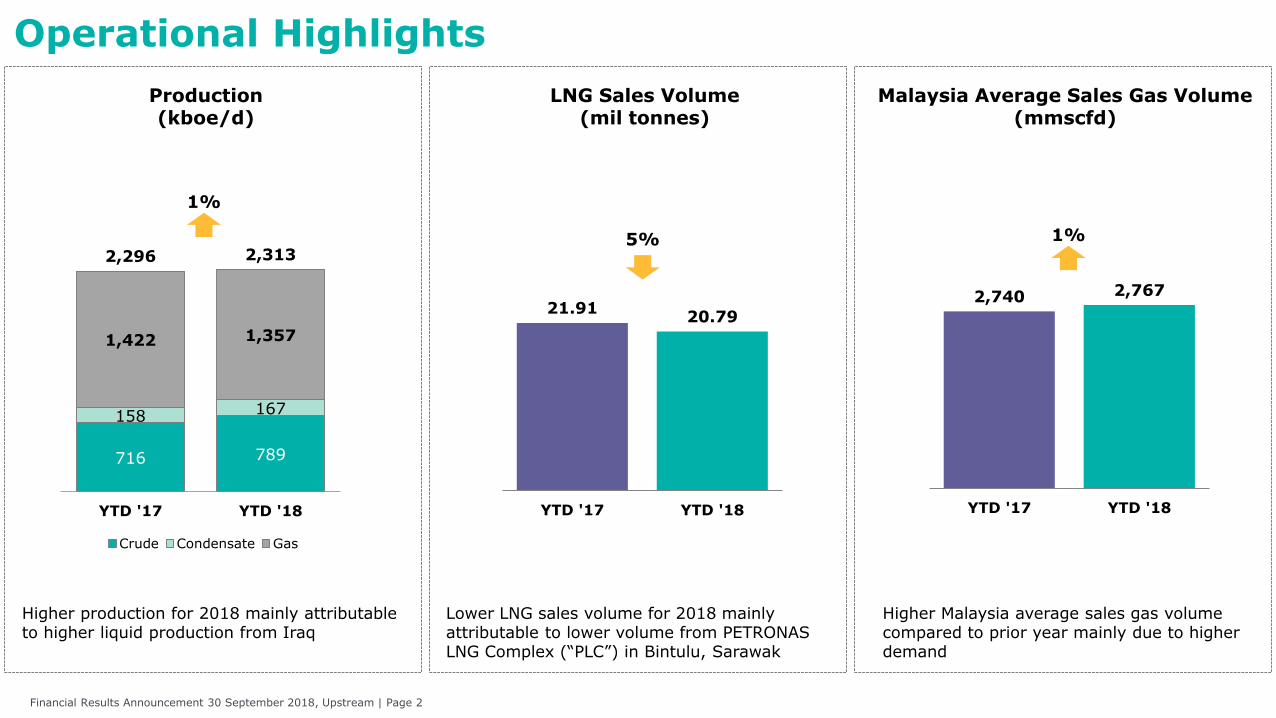
Operational Highlights
Higher Malaysia average sales gas volume compared to prior year mainly due to higher demand
Lower LNG sales volume for 2018 mainly attributable to lower volume from PETRONAS LNG Complex (“PLC”) in Bintulu, Sarawak
Higher production for 2018 mainly attributable to higher liquid production from Iraq
LNG Sales Volume (mil tonnes)
Malaysia Average Sales Gas Volume (mmscfd)
Production (kboe/d)
21.91 20.79
YTD '17 YTD '18
2,740 2,767
YTD '17 YTD '18
5% 1%
716 789
158 167
1,422 1,357
2,296 2,313
YTD '17 YTD '18
Crude Condensate Gas
1%
Financial Results Announcement 30 September 2018, Upstream | Page 2

Downstream Business
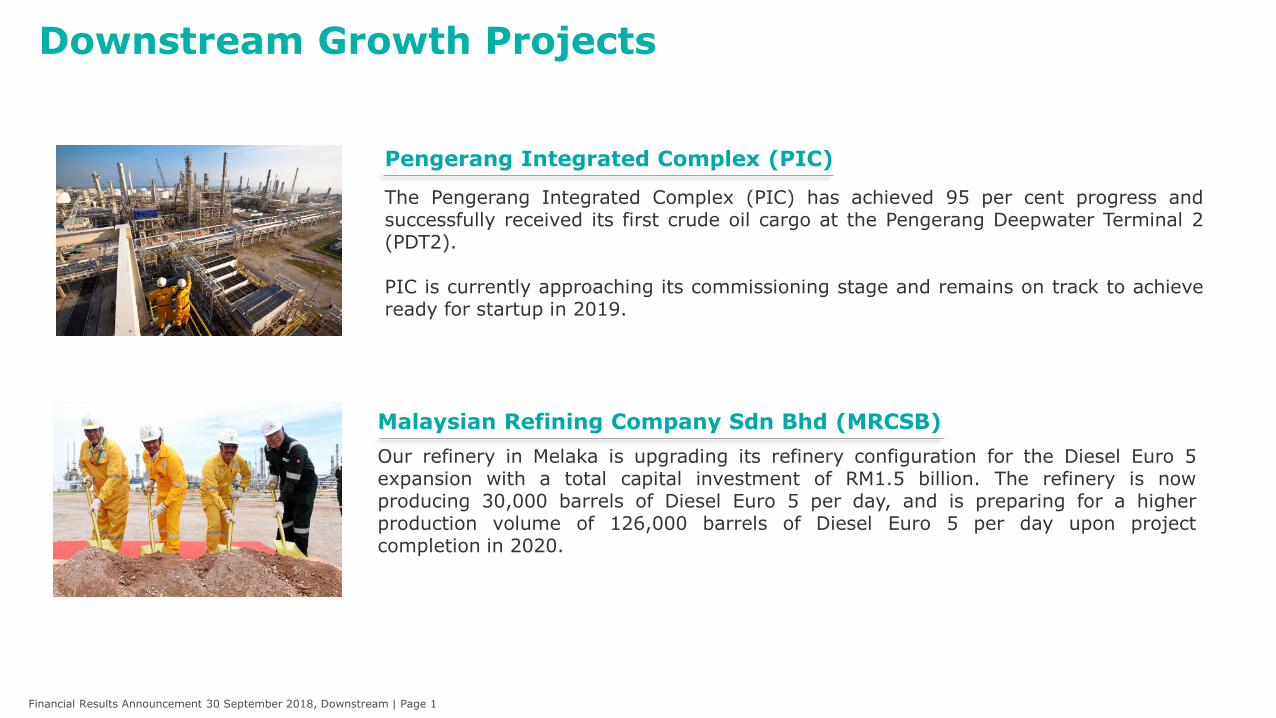
Downstream Growth Projects
Our refinery in Melaka is upgrading its refinery configuration for the Diesel Euro 5expansion with a total capital investment of RM1.5 billion. The refinery is nowproducing 30,000 barrels of Diesel Euro 5 per day, and is preparing for a higherproduction volume of 126,000 barrels of Diesel Euro 5 per day upon projectcompletion in 2020.
The Pengerang Integrated Complex (PIC) has achieved 95 per cent progress andsuccessfully received its first crude oil cargo at the Pengerang Deepwater Terminal 2(PDT2).
PIC is currently approaching its commissioning stage and remains on track to achieveready for startup in 2019.
Pengerang Integrated Complex (PIC)
Malaysian Refining Company Sdn Bhd (MRCSB)
Financial Results Announcement 30 September 2018, Downstream | Page 1

186.9 187.6
Downstream Sales VolumeHigher petrochemical sales boosted by higher production
Petrochemical ProductsMil Metric Tonnes
5%
Crude OilMil barrels
Petroleum ProductsMil barrels
104.1 102.3
0.4%2%
6.0 6.3
Financial Results Announcement 30 September 2018, Downstream | Page 2
YTD ‘17 YTD ‘18
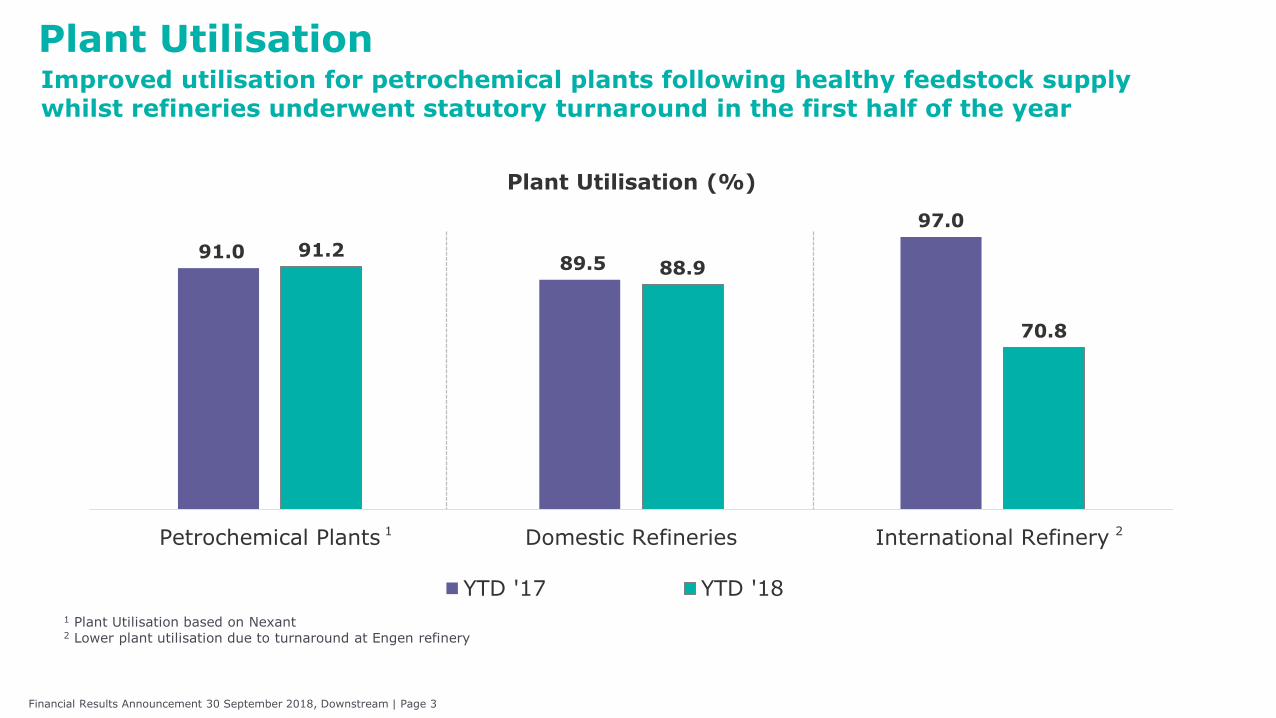
Plant Utilisation
91.0 89.5
97.0
91.288.9
70.8
Petrochemical Plants Domestic Refineries International Refinery
YTD '17 YTD '18
Improved utilisation for petrochemical plants following healthy feedstock supply whilst refineries underwent statutory turnaround in the first half of the year
Plant Utilisation (%)
1
Financial Results Announcement 30 September 2018, Downstream | Page 3
1 Plant Utilisation based on Nexant2 Lower plant utilisation due to turnaround at Engen refinery
2