Petrology, geochemistry and magnetic properties of Sadara sill: Evidence of rift related magmatism...
15
Petrology, geochemistry and magnetic properties of Sadara sill: Evidence of rift related magmatism from Kutch basin, northwest India Arijit Ray a, * , S.K. Patil b , D.K. Paul a , S.K. Biswas c , Brindaban Das a , N.C. Pant d a Department of Geology, Presidency College, College Street, Kolkata 700073, India b Magnetic Observatory, IIG, Alibag 402201, Raigad, Maharashtra, India c Department of Earth Science, IIT, Bombay, Powai, Mumbai, Maharashtra, India d Geological Survey of India, Faridabad, India Received 21 July 2004; received in revised form 29 August 2005; accepted 9 September 2005 Abstract Mafic volcanic rocks of the Mesozoic Kutch basin represent the earliest phase of Deccan volcanic activity. An olivine-clinopyroxene- plagioclase-phyric undersaturated basalt occurs as a sill near Sadara in the Pachham upland, Northern Kutch. The Sadara sill is deformed and emplaced along faults. The sill is alkaline in character and is transitional between basalt and basanite. Compared to primitive mantle, the Sadara sill is enriched in Sr, Ba, Pb and LREE but depleted in Nb, Cr, Y, Cs and Lu. Fractional crystallization of olivine and clinopyroxene from an alkaline mafic melt generated by low degree partial melting of mantle peridotite can explain the observed chemical variation in the sill. IRM and L-F test experiments and mineral analyses show titano-magnetite as the major remanence carrying magnetic mineral. AF and thermal demagnetizations of the Sadara sill yielded a mean ChRM direction as DZ315.68, IZK43.08 (a 95 Z9.78; kZ25.38) and the corresponding VGP at 258S; 114.68E (dp/dmZ6.588/11.68). The Sadara sill pole is significantly different from those of the Deccan (65 Ma) and the Rajmahal Traps (118 Ma) but is close to the Cretaceous poles of 85–91 Ma rock units from southern India. This suggests a pre-Deccan age for the sill. q 2005 Elsevier Ltd. All rights reserved. Keywords: Deccan volcanism; Kutch (India); Geochemistry; Petrogenesis; Palaeomagnetism 1. Introduction Deccan Trap is one of the well-studied Large Igneous Provinces. It is generally agreed that the bulk of the Deccan Volcanic rocks erupted around 65G1 Ma (Vandamme et al., 1991; Pande et al., 1988; Pande, 2002) and that the earliest Deccan volcanism occurred in the northwestern part of the Province (Mahoney, 1988; Basu et al., 1993; Courtillot et al., 2000). The role of the Reunion Plume (Duncan and Richards, 1991) in the generation of Deccan magma has been accepted by most of the Deccan researchers. The east–west trending Kutch Rift Basin is located in the western margin of India. The rift extends from the western continental shelf to the Radhanpur-Barmer arch (Fig. 1). Middle Jurassic to early Cretaceous rift-fill sediments are covered by the Deccan trap in the south and west. Magmatic rocks of the Kutch Rift Basin have so far been identified as tholeiites and alkali basalts (De, 1964; Krishnamurthy et al., 1999). Some of these alkali basalts and one tholeiite sample have been dated by Pande et al. (1988). The 64 to 67 Ma age of alkali basalts and tholeiites of Kutch compares well with the age of Deccan eruption. Mantle xenolith bearing alkali basalts are fairly common in the central part (Karmalkar et al., 2000; Karmalkar and Sarma, 2003; Krishnamurthy et al., 1989) while tholeiites have been reported from the southern part (Biswas, 1993). Magmatic rocks from the northern part are relatively less studied. Magmatic rocks occurring to the north of the Kutch Rift Basin are petrologically different from Deccan tholeiite and alkali basalt. Their mode of emplacement in most cases are fault controlled. Sadara sill, intruding the Goradongar Formation, is a 7 km long body which was emplaced along faults (Fig. 2). This sill has also been affected by folding. The sill is made up of phenocryst charged melanocratic basaltic rocks, geochemically different from Deccan tholeiite. The present paper attempts to characterize the Sadara sill from petrological, geochemical and paleomag- netic points of view and explores its temporal relation with the main Deccan eruption. Journal of Asian Earth Sciences 27 (2006) 907–921 www.elsevier.com/locate/jaes 1367-9120/$ - see front matter q 2005 Elsevier Ltd. All rights reserved. doi:10.1016/j.jseaes.2005.09.006 * Corresponding author. E-mail address: [email protected] (A. Ray).
-
Upload
arijit-ray -
Category
Documents
-
view
213 -
download
1
Transcript of Petrology, geochemistry and magnetic properties of Sadara sill: Evidence of rift related magmatism...

Petrology, geochemistry and magnetic properties of Sadara sill:
Evidence of rift related magmatism from Kutch basin, northwest India
Arijit Ray a,*, S.K. Patil b, D.K. Paul a, S.K. Biswas c, Brindaban Das a, N.C. Pant d
a Department of Geology, Presidency College, College Street, Kolkata 700073, Indiab Magnetic Observatory, IIG, Alibag 402201, Raigad, Maharashtra, India
c Department of Earth Science, IIT, Bombay, Powai, Mumbai, Maharashtra, Indiad Geological Survey of India, Faridabad, India
Received 21 July 2004; received in revised form 29 August 2005; accepted 9 September 2005
Abstract
Mafic volcanic rocks of the Mesozoic Kutch basin represent the earliest phase of Deccan volcanic activity. An olivine-clinopyroxene-
plagioclase-phyric undersaturated basalt occurs as a sill near Sadara in the Pachham upland, Northern Kutch. The Sadara sill is deformed and
emplaced along faults. The sill is alkaline in character and is transitional between basalt and basanite. Compared to primitive mantle, the Sadara
sill is enriched in Sr, Ba, Pb and LREE but depleted in Nb, Cr, Y, Cs and Lu. Fractional crystallization of olivine and clinopyroxene from an
alkaline mafic melt generated by low degree partial melting of mantle peridotite can explain the observed chemical variation in the sill.
IRM and L-F test experiments and mineral analyses show titano-magnetite as the major remanence carrying magnetic mineral. AF and thermal
demagnetizations of the Sadara sill yielded a mean ChRM direction as DZ315.68, IZK43.08 (a95Z9.78; kZ25.38) and the corresponding VGP
at 258S; 114.68E (dp/dmZ6.588/11.68). The Sadara sill pole is significantly different from those of the Deccan (65 Ma) and the Rajmahal Traps
(118 Ma) but is close to the Cretaceous poles of 85–91 Ma rock units from southern India. This suggests a pre-Deccan age for the sill.
q 2005 Elsevier Ltd. All rights reserved.
Keywords: Deccan volcanism; Kutch (India); Geochemistry; Petrogenesis; Palaeomagnetism
1. Introduction
Deccan Trap is one of the well-studied Large Igneous
Provinces. It is generally agreed that the bulk of the Deccan
Volcanic rocks erupted around 65G1 Ma (Vandamme et al.,
1991; Pande et al., 1988; Pande, 2002) and that the earliest
Deccan volcanism occurred in the northwestern part of the
Province (Mahoney, 1988; Basu et al., 1993; Courtillot et al.,
2000). The role of the Reunion Plume (Duncan and Richards,
1991) in the generation of Deccan magma has been accepted by
most of the Deccan researchers.
The east–west trending Kutch Rift Basin is located in the
western margin of India. The rift extends from the western
continental shelf to the Radhanpur-Barmer arch (Fig. 1).Middle
Jurassic to early Cretaceous rift-fill sediments are covered by the
Deccan trap in the south and west. Magmatic rocks of the Kutch
Rift Basin have so far been identified as tholeiites and alkali
1367-9120/$ - see front matter q 2005 Elsevier Ltd. All rights reserved.
doi:10.1016/j.jseaes.2005.09.006
* Corresponding author.
E-mail address: [email protected] (A. Ray).
basalts (De, 1964; Krishnamurthy et al., 1999). Some of these
alkali basalts and one tholeiite sample have been dated by Pande
et al. (1988). The 64 to 67 Ma age of alkali basalts and tholeiites
ofKutch compareswell with the age ofDeccan eruption.Mantle
xenolith bearing alkali basalts are fairly common in the central
part (Karmalkar et al., 2000; Karmalkar and Sarma, 2003;
Krishnamurthy et al., 1989) while tholeiites have been reported
from the southern part (Biswas, 1993).Magmatic rocks from the
northern part are relatively less studied. Magmatic rocks
occurring to the north of the Kutch Rift Basin are petrologically
different from Deccan tholeiite and alkali basalt. Their mode of
emplacement in most cases are fault controlled. Sadara sill,
intruding the Goradongar Formation, is a 7 km long body which
was emplaced along faults (Fig. 2). This sill has also been
affected by folding. The sill is made up of phenocryst charged
melanocratic basaltic rocks, geochemically different from
Deccan tholeiite. The present paper attempts to characterize
the Sadara sill from petrological, geochemical and paleomag-
netic points of view and explores its temporal relation with the
main Deccan eruption.
Journal of Asian Earth Sciences 27 (2006) 907–921
www.elsevier.com/locate/jaes
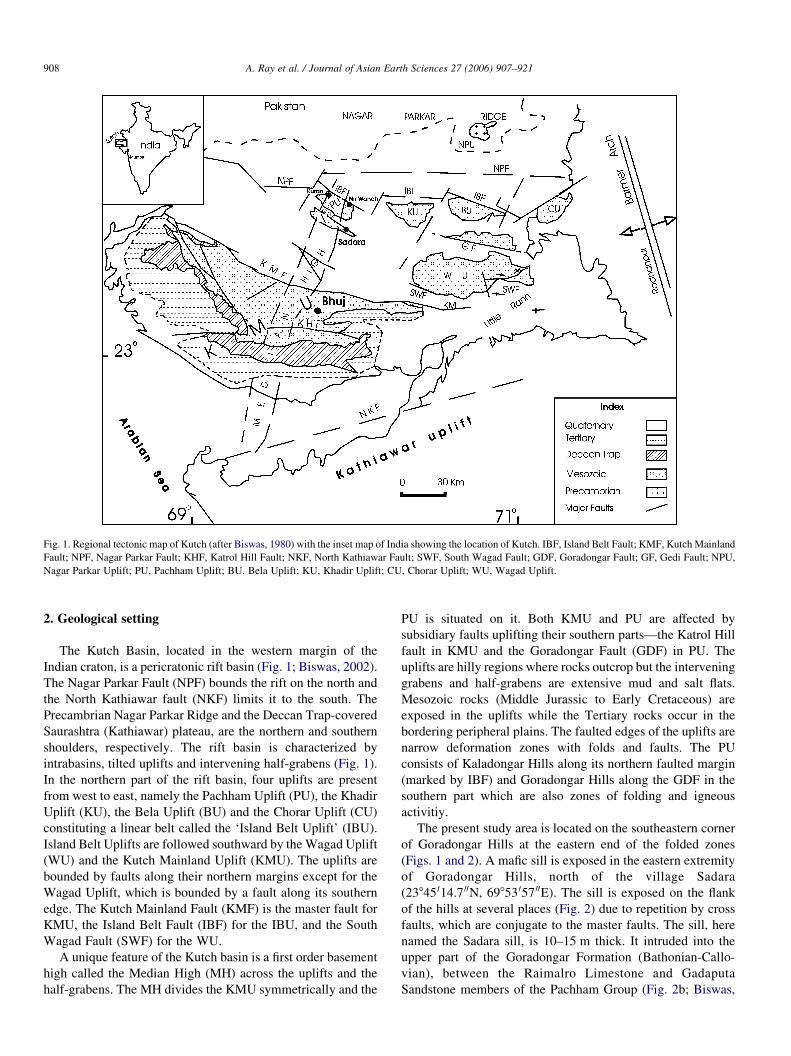
Fig. 1. Regional tectonic map of Kutch (after Biswas, 1980) with the inset map of India showing the location of Kutch. IBF, Island Belt Fault; KMF, Kutch Mainland
Fault; NPF, Nagar Parkar Fault; KHF, Katrol Hill Fault; NKF, North Kathiawar Fault; SWF, South Wagad Fault; GDF, Goradongar Fault; GF, Gedi Fault; NPU,
Nagar Parkar Uplift; PU, Pachham Uplift; BU, Bela Uplift; KU, Khadir Uplift; CU, Chorar Uplift; WU, Wagad Uplift.
A. Ray et al. / Journal of Asian Earth Sciences 27 (2006) 907–921908
2. Geological setting
The Kutch Basin, located in the western margin of the
Indian craton, is a pericratonic rift basin (Fig. 1; Biswas, 2002).
The Nagar Parkar Fault (NPF) bounds the rift on the north and
the North Kathiawar fault (NKF) limits it to the south. The
Precambrian Nagar Parkar Ridge and the Deccan Trap-covered
Saurashtra (Kathiawar) plateau, are the northern and southern
shoulders, respectively. The rift basin is characterized by
intrabasins, tilted uplifts and intervening half-grabens (Fig. 1).
In the northern part of the rift basin, four uplifts are present
from west to east, namely the Pachham Uplift (PU), the Khadir
Uplift (KU), the Bela Uplift (BU) and the Chorar Uplift (CU)
constituting a linear belt called the ‘Island Belt Uplift’ (IBU).
Island Belt Uplifts are followed southward by theWagad Uplift
(WU) and the Kutch Mainland Uplift (KMU). The uplifts are
bounded by faults along their northern margins except for the
Wagad Uplift, which is bounded by a fault along its southern
edge. The Kutch Mainland Fault (KMF) is the master fault for
KMU, the Island Belt Fault (IBF) for the IBU, and the South
Wagad Fault (SWF) for the WU.
A unique feature of the Kutch basin is a first order basement
high called the Median High (MH) across the uplifts and the
half-grabens. The MH divides the KMU symmetrically and the
PU is situated on it. Both KMU and PU are affected by
subsidiary faults uplifting their southern parts—the Katrol Hill
fault in KMU and the Goradongar Fault (GDF) in PU. The
uplifts are hilly regions where rocks outcrop but the intervening
grabens and half-grabens are extensive mud and salt flats.
Mesozoic rocks (Middle Jurassic to Early Cretaceous) are
exposed in the uplifts while the Tertiary rocks occur in the
bordering peripheral plains. The faulted edges of the uplifts are
narrow deformation zones with folds and faults. The PU
consists of Kaladongar Hills along its northern faulted margin
(marked by IBF) and Goradongar Hills along the GDF in the
southern part which are also zones of folding and igneous
activitiy.
The present study area is located on the southeastern corner
of Goradongar Hills at the eastern end of the folded zones
(Figs. 1 and 2). A mafic sill is exposed in the eastern extremity
of Goradongar Hills, north of the village Sadara
(23845 014.7 00N, 69853 057 00E). The sill is exposed on the flank
of the hills at several places (Fig. 2) due to repetition by cross
faults, which are conjugate to the master faults. The sill, here
named the Sadara sill, is 10–15 m thick. It intruded into the
upper part of the Goradongar Formation (Bathonian-Callo-
vian), between the Raimalro Limestone and Gadaputa
Sandstone members of the Pachham Group (Fig. 2b; Biswas,
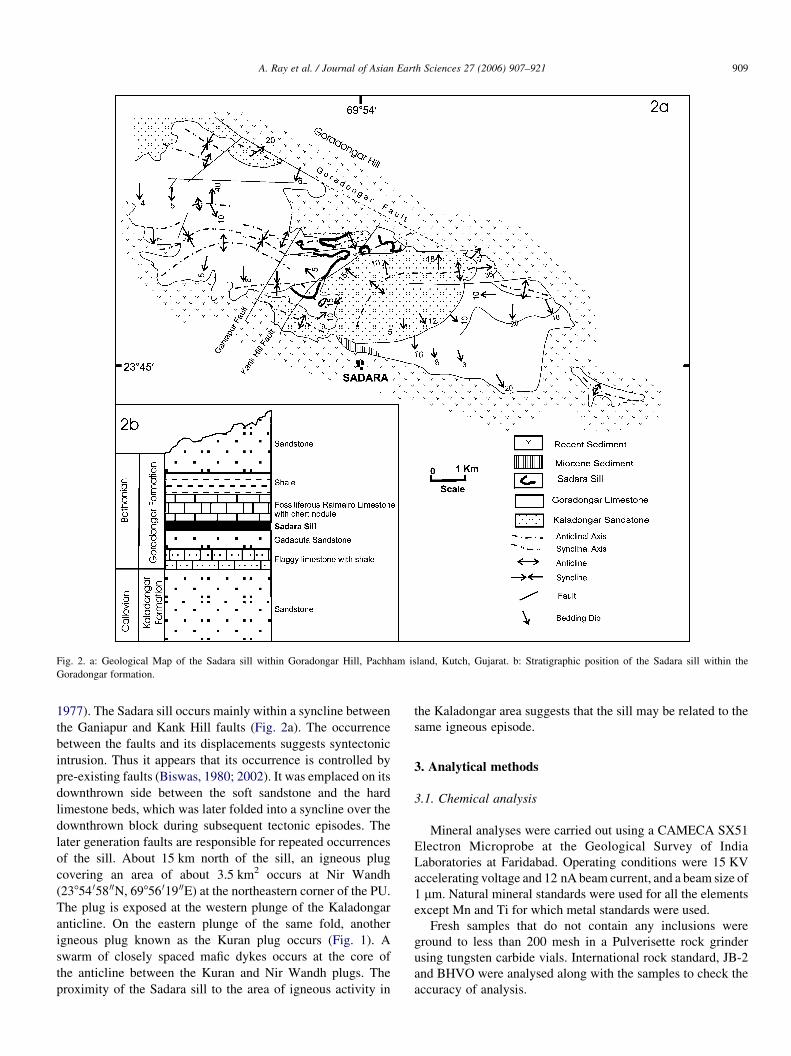
Fig. 2. a: Geological Map of the Sadara sill within Goradongar Hill, Pachham island, Kutch, Gujarat. b: Stratigraphic position of the Sadara sill within the
Goradongar formation.
A. Ray et al. / Journal of Asian Earth Sciences 27 (2006) 907–921 909
1977). The Sadara sill occurs mainly within a syncline between
the Ganiapur and Kank Hill faults (Fig. 2a). The occurrence
between the faults and its displacements suggests syntectonic
intrusion. Thus it appears that its occurrence is controlled by
pre-existing faults (Biswas, 1980; 2002). It was emplaced on its
downthrown side between the soft sandstone and the hard
limestone beds, which was later folded into a syncline over the
downthrown block during subsequent tectonic episodes. The
later generation faults are responsible for repeated occurrences
of the sill. About 15 km north of the sill, an igneous plug
covering an area of about 3.5 km2 occurs at Nir Wandh
(23854 058 00N, 69856 019 00E) at the northeastern corner of the PU.
The plug is exposed at the western plunge of the Kaladongar
anticline. On the eastern plunge of the same fold, another
igneous plug known as the Kuran plug occurs (Fig. 1). A
swarm of closely spaced mafic dykes occurs at the core of
the anticline between the Kuran and Nir Wandh plugs. The
proximity of the Sadara sill to the area of igneous activity in
the Kaladongar area suggests that the sill may be related to the
same igneous episode.
3. Analytical methods
3.1. Chemical analysis
Mineral analyses were carried out using a CAMECA SX51
Electron Microprobe at the Geological Survey of India
Laboratories at Faridabad. Operating conditions were 15 KV
accelerating voltage and 12 nA beam current, and a beam size of
1 mm. Natural mineral standards were used for all the elements
except Mn and Ti for which metal standards were used.
Fresh samples that do not contain any inclusions were
ground to less than 200 mesh in a Pulverisette rock grinder
using tungsten carbide vials. International rock standard, JB-2
and BHVO were analysed along with the samples to check the
accuracy of analysis.
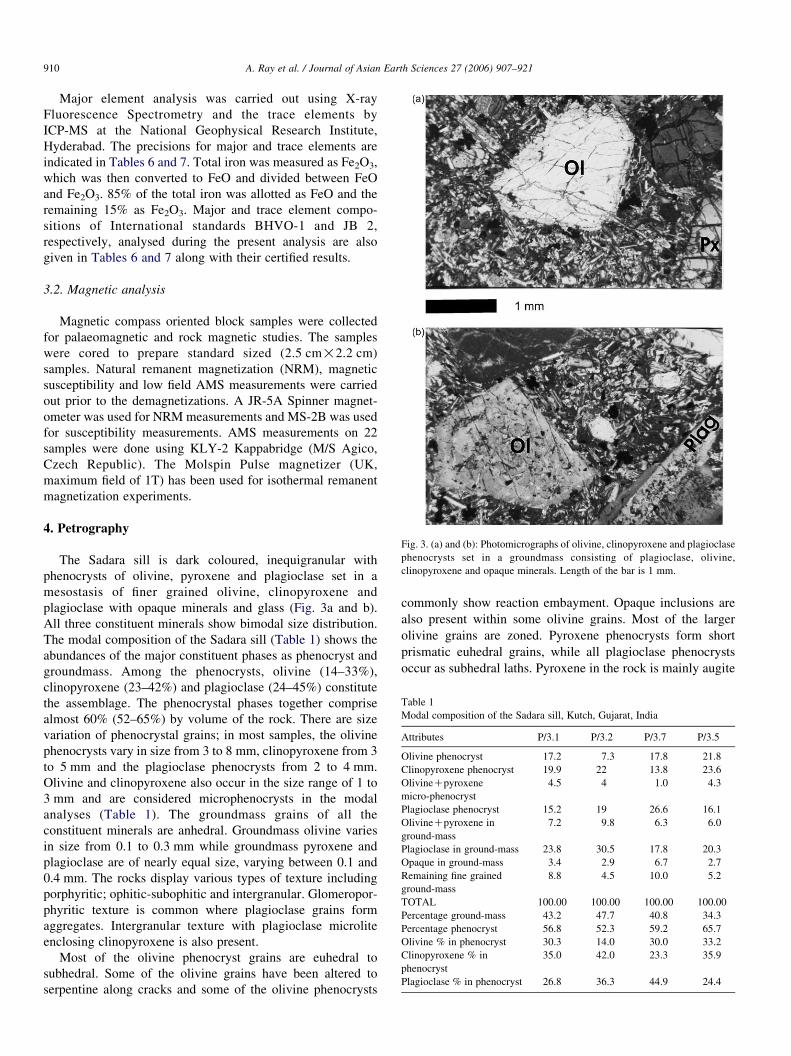
Table 1
Modal composition of the Sadara sill, Kutch, Gujarat, India
Attributes P/3.1 P/3.2 P/3.7 P/3.5
Olivine phenocryst 17.2 7.3 17.8 21.8
Clinopyroxene phenocryst 19.9 22 13.8 23.6
OlivineCpyroxene
micro-phenocryst
4.5 4 1.0 4.3
Plagioclase phenocryst 15.2 19 26.6 16.1
OlivineCpyroxene in
ground-mass
7.2 9.8 6.3 6.0
Plagioclase in ground-mass 23.8 30.5 17.8 20.3
Opaque in ground-mass 3.4 2.9 6.7 2.7
Remaining fine grained
ground-mass
8.8 4.5 10.0 5.2
TOTAL 100.00 100.00 100.00 100.00
Percentage ground-mass 43.2 47.7 40.8 34.3
Percentage phenocryst 56.8 52.3 59.2 65.7
Olivine % in phenocryst 30.3 14.0 30.0 33.2
Clinopyroxene % in
phenocryst
35.0 42.0 23.3 35.9
Plagioclase % in phenocryst 26.8 36.3 44.9 24.4
Fig. 3. (a) and (b): Photomicrographs of olivine, clinopyroxene and plagioclase
phenocrysts set in a groundmass consisting of plagioclase, olivine,
clinopyroxene and opaque minerals. Length of the bar is 1 mm.
A. Ray et al. / Journal of Asian Earth Sciences 27 (2006) 907–921910
Major element analysis was carried out using X-ray
Fluorescence Spectrometry and the trace elements by
ICP-MS at the National Geophysical Research Institute,
Hyderabad. The precisions for major and trace elements are
indicated in Tables 6 and 7. Total iron was measured as Fe2O3,
which was then converted to FeO and divided between FeO
and Fe2O3. 85% of the total iron was allotted as FeO and the
remaining 15% as Fe2O3. Major and trace element compo-
sitions of International standards BHVO-1 and JB 2,
respectively, analysed during the present analysis are also
given in Tables 6 and 7 along with their certified results.
3.2. Magnetic analysis
Magnetic compass oriented block samples were collected
for palaeomagnetic and rock magnetic studies. The samples
were cored to prepare standard sized (2.5 cm!2.2 cm)
samples. Natural remanent magnetization (NRM), magnetic
susceptibility and low field AMS measurements were carried
out prior to the demagnetizations. A JR-5A Spinner magnet-
ometer was used for NRM measurements and MS-2B was used
for susceptibility measurements. AMS measurements on 22
samples were done using KLY-2 Kappabridge (M/S Agico,
Czech Republic). The Molspin Pulse magnetizer (UK,
maximum field of 1T) has been used for isothermal remanent
magnetization experiments.
4. Petrography
The Sadara sill is dark coloured, inequigranular with
phenocrysts of olivine, pyroxene and plagioclase set in a
mesostasis of finer grained olivine, clinopyroxene and
plagioclase with opaque minerals and glass (Fig. 3a and b).
All three constituent minerals show bimodal size distribution.
The modal composition of the Sadara sill (Table 1) shows the
abundances of the major constituent phases as phenocryst and
groundmass. Among the phenocrysts, olivine (14–33%),
clinopyroxene (23–42%) and plagioclase (24–45%) constitute
the assemblage. The phenocrystal phases together comprise
almost 60% (52–65%) by volume of the rock. There are size
variation of phenocrystal grains; in most samples, the olivine
phenocrysts vary in size from 3 to 8 mm, clinopyroxene from 3
to 5 mm and the plagioclase phenocrysts from 2 to 4 mm.
Olivine and clinopyroxene also occur in the size range of 1 to
3 mm and are considered microphenocrysts in the modal
analyses (Table 1). The groundmass grains of all the
constituent minerals are anhedral. Groundmass olivine varies
in size from 0.1 to 0.3 mm while groundmass pyroxene and
plagioclase are of nearly equal size, varying between 0.1 and
0.4 mm. The rocks display various types of texture including
porphyritic; ophitic-subophitic and intergranular. Glomeropor-
phyritic texture is common where plagioclase grains form
aggregates. Intergranular texture with plagioclase microlite
enclosing clinopyroxene is also present.
Most of the olivine phenocryst grains are euhedral to
subhedral. Some of the olivine grains have been altered to
serpentine along cracks and some of the olivine phenocrysts
commonly show reaction embayment. Opaque inclusions are
also present within some olivine grains. Most of the larger
olivine grains are zoned. Pyroxene phenocrysts form short
prismatic euhedral grains, while all plagioclase phenocrysts
occur as subhedral laths. Pyroxene in the rock is mainly augite

Table 2
Chemical composition of Olivine from the Sadara sill, Kutch, Gujarat, India
Oxide Core Rim Core Core Core Core Gm Core Rim Core Core Rim Core Gm* Gm
SiO2 40.51 35.14 40.19 37.84 38.64 39.97 36.25 40.32 35.56 40.32 39.29 36.26 37.39 37.22 38.71
Al2O3 0.08 0.10 0.06 0.07 0.02 0.09 0.01 0.02 0.02 0.07 0.00 0.06 0.05 0.07 0.08
TiO2 0.00 0.02 0.00 0.00 0.02 0.04 0.00 0.00 0.07 0.00 0.00 0.05 0.00 0.02 0.06
FeO 10.91 33.88 12.36 18.92 20.19 10.33 28.97 14.45 37.55 13.15 15.11 30.97 27.64 28.63 23.89
MgO 48.41 28.35 47.9 40.91 39.28 47.49 31.9 44.25 25.74 44.53 43.05 30.53 33.68 31.93 36.15
MnO 0.17 0.58 0.19 0.28 0.45 0.00 0.58 0.22 0.84 0.20 0.27 0.62 0.37 0.44 0.42
CaO 0.30 0.56 0.25 0.39 0.27 0.25 0.43 0.20 0.48 0.24 0.33 0.52 0.37 0.43 0.40
Cr2O3 0.16 0.10 0.01 0.08 0.00 0.05 0.03 0.00 0.00 0.08 0.00 0.01 0.03 0.07 0.00
NiO 0.00 0.00 0.00 0.08 0.10 0.35 0.24 0.30 0.14 0.31 0.28 0.06 0.18 0.09 0.12
Na2O 0.00 0.05 0.06 0.01 0.01 0.01 0.03 0.00 0.05 0.02 0.01 0.00 0.00 0.04 0.00
K2O 0.00 0.00 0.01 0.00 0.00 0.02 0.00 0.03 0.03 0.00 0.01 0.00 0.00 0.00 0.00
Total 100.54 98.78 101.03 98.58 98.98 98.6 98.44 99.79 100.48 98.92 98.35 99.08 99.71 98.94 99.83
Cation on the basis 4 (O)
Si 0.995 0.988 0.988 0.987 1.007 0.998 0.996 1.012 0.999 1.015 1.006 0.999 1.014 1.012 1.016
Al 0.002 0.003 0.002 0.002 0.000 0.003 0.000 0.000 0.001 0.002 0.000 0.002 0.002 0.002 0.003
Ti 0.000 0.000 0.000 0.000 0.000 0.000 0.000 0.000 0.002 0.000 0.000 0.001 0.001 0.00 0.001
FeI2 0.224 0.797 0.254 0.413 0.440 0.216 0.666 0.303 0.882 0.277 0.324 0.713 0.702 0.651 0.524
Mg 1.772 1.189 1.755 1.590 1.525 1.767 1.307 1.656 1.078 1.671 1.643 1.253 1.234 1.294 1.414
Mn 0.004 0.014 0.004 0.006 0.010 0.000 0.010 0.005 0.020 0.004 0.006 0.015 0.014 0.010 0.009
Ca 0.008 0.017 0.007 0.011 0.007 0.010 0.010 0.005 0.014 0.006 0.009 0.015 0.015 0.013 0.011
Cr 0.000 0.000 0.000 0.002 0.000 0.000 0.000 0.000 0.000 0.002 0.000 0.000 0.000 0.002 0.000
Ni 0.000 0.000 0.000 0.002 0.002 0.010 0.010 0.006 0.003 0.006 0.006 0.001 0.001 0.002 0.003
Total 3.005 3.008 3.010 3.013 2.991 3.004 2.999 2.987 2.999 2.983 2.994 2.999 2.983 2.986 2.981
Fa 11.160 39.510 12.570 20.430 22.190 10.840 33.310 15.41 44.23 14.13 16.33 35.73 35.70 33.08 26.770
Fo 88.240 58.590 86.880 78.170 76.560 88.500 64.750 83.32 53.32 84.99 82.46 62.01 62.71 65.12 71.600
Table 3
Chemical composition of Plagioclase Feldspar from the Sadara sill, Kutch,
Gujarat, India
Oxide Core Core Rim Core Groun-
dmass
SiO2 47.53 46.54 54.88 49.05 52.6 51.52 51.4
TiO2 0 0.04 0.1 0.11 0.19 0.11 0.05
Al2O3 32.39 32.6 27.34 30.5 29.44 30.1 29.95
A. Ray et al. / Journal of Asian Earth Sciences 27 (2006) 907–921 911
(titanaugite) and salite as evidenced by their pleochroic
character (feebly pleochroic from light yellow to green) and
z^c values around 35–408. Pyroxene and plagioclase pheno-
cryst grains are distinctly zoned. Reaction structures and
zoning are common in the pyroxenes. Pyroxene phenocrysts
are frequently twinned. The symmetric extinction angle of
plagioclase varies between 30 and 408 indicating labradorite to
bytownite compositions.
Cr2O3 0 0 0 0.12 0.01 0 0.04
FeO 0.58 0.33 0.34 0.44 0.71 0.63 0.73
NiO 0.09 0 0.02 0 0 0.01 0.05
MnO 0 0.09 0 0.06 0.02 0 0
MgO 0.07 0.04 0 0 0.05 0.03 0.06
CaO 16.41 16.69 9.88 0.1 12.06 13.64 12.99
BaO 0 0.03 0.09 15.06 0.01 0 0.07
Na2O 2.21 1.92 4.33 2.68 3.8 3.6 3.9
K2O 0.1 0.09 1.85 0.16 0.15 0.14 0.12
Total 99.38 98.37 98.83 98.28 99.04 99.78 99.36
Cation on the basis 8 (O)
Si 2.200 2.176 2.514 2.285 2.402 2.349 2.355
Ti 0.000 0.002 0.004 0.004 0.007 0.004 0.002
Al 1.770 1.797 1.476 1.675 1.584 1.618 1.617
Fe3 0.020 0.013 0.013 0.017 0.027 0.024 0.028
Fe2 0.000 0.000 0.000 0.000 0.000 0.000 0.000
Mn 0.000 0.000 0.000 0.000 0.000 0.000 0.000
Mg 0.010 0.003 0.000 0.007 0.004 0.002 0.004
Ba 0.000 0.001 0.002 0.000 0.000 0.000 0.001
Ca 0.813 0.836 0.485 0.752 0.590 0.660 0.638
Na 0.198 0.174 0.384 0.242 0.336 0.318 0.346
K 0.006 0.006 0.108 0.009 0.009 0.008 0.007
Cations 5.017 5.008 4.986 4.991 4.959 4.983 4.998
Or 0.006 0.006 0.111 0.009 0.010 0.008 0.007
Ab 0.195 0.171 0.393 0.241 0.359 0.323 0.349
An 0.799 0.823 0.496 0.750 0.631 0.669 0.644
4.1. Mineral chemistry
Thecompositionsof cores and rimsofphenocrysts, groundmass
grains and the opaque mineral are given in Tables 2–5.
(a) Olivine: It is themost dominant phenocryst. The core and rim
compositions of olivine phenocryst and groundmass grains
are given in Table 2. The forsterite content of the core varies
between76and88molepercentwhile the rim is iron rich.The
forsterite content in the rims is around 65 mole percent. The
forsterite content in the groundmass olivine (Fo55–65) is also
similar to that found in the rims of the phenocrysts.
(b) Plagioclase: The compositions of the cores and rims of
plagioclase phenocrysts and the composition of groundmass
plagioclase are given inTable 3. The core of the plagioclase is
usually Ca rich (An80–82) compared to the rim (usually An50–
70). Groundmass plagioclase grains have a rather uniform
composition of An63–67.(c) Clinopyroxene: Clinopyroxene is less abundant than olivine
in the phenocryst assemblage, but pyroxene ismore abundant
as a groundmass constituent. The composition of the

Table 4
Chemical composition of Pyroxene from the Sadara sill, Kutch, Gujarat, India
Oxide Core Rim Core Rim Core Rim Core Rim Gm Gm
SiO2 48.31 48.34 48.31 46.83 47.66 47.18 48.9 47.04 47.02 45.71
TiO2 1.43 1.98 0.9 2.19 1.5 3.05 1.57 2.99 2.63 3.22
Al2O3 5.44 3.5 5.94 5.41 7.36 5.38 5.75 6.05 6.14 6.76
Cr2O3 0.35 0.02 0.43 0.09 0.39 0 0.53 0.05 0.08 0.06
FeO 5.77 8.59 5.23 7.47 6.04 8.98 5.93 8.24 8.05 8.78
NiO 0 0 0 0 0 0 0 0 0.03 0.19
MnO 0.05 0.16 0.15 0.13 0.17 0.12 0.06 0.17 0 0.22
MgO 14.69 12.82 14.77 13.33 13.35 11.18 13.81 11.73 12.22 11.42
CaO 22.17 22.16 22.01 22.06 21.87 22.2 23.51 22.15 22.72 22.4
BaO 0 0.02 0.06 0.1 0 0 0 0 0.04 0
Na2O 0.32 0.54 0.34 0.44 0.6 0.59 0.4 0.58 0.49 0.42
K2O 0 0.01 0.01 0.02 0.01 0.04 0.03 0.01 0.02 0.03
Total 98.53 98.14 98.15 98.07 98.95 98.72 100.49 99.01 99.44 99.21
Cation on the basis 6 (O)
Si 1.802 1.880 1.804 1.773 1.774 1.796 1.797 1.778 1.765 1.730
Al iv 0.198 0.157 0.196 0.227 0.226 0.204 0.203 0.222 0.235 0.270
Al vi 0.041 0.000 0.066 0.014 0.097 0.037 0.045 0.047 0.036 0.031
Ti 0.040 0.057 0.025 0.062 0.042 0.087 0.043 0.085 0.074 0.092
Fe3 0.088 0.088 0.091 0.118 0.077 0.038 0.088 0.047 0.085 0.087
Cr 0.010 0.001 0.013 0.003 0.011 0.000 0.015 0.001 0.002 0.002
Mg 0.817 0.727 0.822 0.752 0.740 0.634 0.756 0.661 0.684 0.644
Ni 0.000 0.000 0.000 0.000 0.000 0.000 0.002 0.000 0.000 0.000
Fe2 0.092 0.180 0.072 0.118 0.111 0.248 0.094 0.214 0.167 0.191
Mn 0.002 0.005 0.005 0.004 0.005 0.004 0.002 0.005 0.000 0.007
Ca 0.886 0.903 0.881 0.895 0.872 0.906 0.925 0.897 0.914 0.908
Na 0.023 0.040 0.025 0.032 0.043 0.044 0.029 0.042 0.036 0.031
K 0.000 0.000 0.000 0.001 0.001 0.002 0.002 0.001 0.001 0.002
Cations 3.999 4.038 4.000 3.999 3.999 4.000 4.001 4.000 3.999 3.999
Wo 47.053 47.576 47.213 47.531 48.444 49.617 49.651 49.313 49.405 49.617
En 43.388 38.303 44.051 39.936 41.111 34.721 40.580 36.339 36.973 35.191
Fs 9.559 14.120 8.735 12.533 10.444 15.663 9.769 14.349 13.622 15.191
A. Ray et al. / Journal of Asian Earth Sciences 27 (2006) 907–921912
pyroxene phenocrysts varies between Wo50.65En35.47Fs13.88and Wo52.12En42.57Fs5.31 (Table 4). The core is slightly Mg
rich (En43) compared to the rim (En35). Groundmass
pyroxenes are relatively iron rich (around Fs10).
(d) Opaque minerals: The composition of the opaque minerals,
mostly Fe–Ti oxide (titano-magnetite) is given in Table 5.
These occur as anhedral grains in the groundmass.
5. Geochemistry
Major and trace element compositions of seven Sadara whole
rock samples along with CIPW norms are shown in Tables 6
and 7. All seven samples are similar in terms of their major
element composition, but in terms of trace element compositions
define two distinct groups. The Sadara sill is silica under-saturated
(around 45% silica) basaltic rock with moderately high MgO.
MgO contents range between 9.2 and 10.7 wt% with mg number
varying between 64 and 68. The CaO and FeO contents of the
rocks are higher compared to continental flood basalt (Wilson,
1989) and TiO2 is around 2%. All the samples have Na2O/K2O
ratios around 3. Normative values indicate presence of nepheline,
forsteritic olivine and wollastonitic and enstatitic pyroxene along
with 40% plagioclase (Ab and An in nearly equal proportions).
On the basis of total alkali vs. silica (Fig. 4 after Le Bas, 2000) the
Sadara sill is classified as ‘transitional basalt’ transcending the
boundary between basalt and basanite-tephrite.
The LOI data of the Sadara samples vary from 1.0 to 1.3%.
Petrographic evidence of alteration is not conspicuous, although a
possibility exists that the abundances of Sr, Ba and Rb may vary
due to alteration. In view of the evidence cited above, we tend to
interpret that the concentration of the elements in the Sadara
samples have not significantly changed. The inter-element
relationship of some trace elemental abundances and ratios are
plotted in Fig. 5. Two samples (nos. P/3.1 and P/ 3.7) are different
from the others in having lower Ba/Zr values of 2.18 and 2.24
compared to Ba/Zr values of 4.09 to 4.65 in the other samples.
These also have lower Ba/Nb ratios and Sr content. This reflects a
lower Ba and Sr content in these two samples compared to the rest
(Table 7). Among the trace elements, Rb/Nb, Ba/Zr and LREE
tend to increase with contamination by or addition of LILE-rich,
Nb-deficient continental crust, but Sr decreases in the liquid with
fractional crystallization (Chatterjee and Bhattacharji, 2001). In
the mg no vs. Zr diagram (Fig. 5a), all seven samples show
continuous variation with a very gentle negative slope indicating a
slow rate of increase of Zr during progressive differentiation. In a
plot of Ba/Zr against Sr (Fig. 5b), a positive correlation (rZ0.94)
is seen suggesting a role for fractional crystallization. In the
SREE vs. Sr plot (Fig. 5c), a positive correlation is clear,
indicating the plagioclase fractionation. The Ba/Nb vs. Sr plot
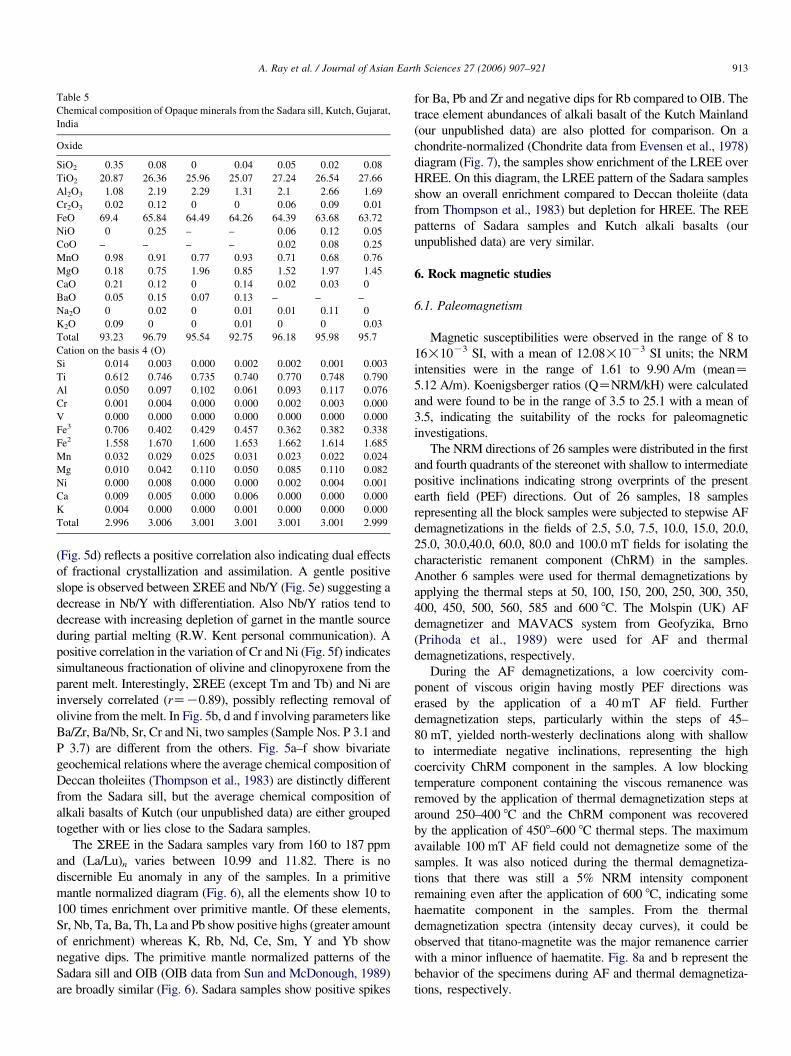
Table 5
Chemical composition of Opaque minerals from the Sadara sill, Kutch, Gujarat,
India
Oxide
SiO2 0.35 0.08 0 0.04 0.05 0.02 0.08
TiO2 20.87 26.36 25.96 25.07 27.24 26.54 27.66
Al2O3 1.08 2.19 2.29 1.31 2.1 2.66 1.69
Cr2O3 0.02 0.12 0 0 0.06 0.09 0.01
FeO 69.4 65.84 64.49 64.26 64.39 63.68 63.72
NiO 0 0.25 – – 0.06 0.12 0.05
CoO – – – – 0.02 0.08 0.25
MnO 0.98 0.91 0.77 0.93 0.71 0.68 0.76
MgO 0.18 0.75 1.96 0.85 1.52 1.97 1.45
CaO 0.21 0.12 0 0.14 0.02 0.03 0
BaO 0.05 0.15 0.07 0.13 – – –
Na2O 0 0.02 0 0.01 0.01 0.11 0
K2O 0.09 0 0 0.01 0 0 0.03
Total 93.23 96.79 95.54 92.75 96.18 95.98 95.7
Cation on the basis 4 (O)
Si 0.014 0.003 0.000 0.002 0.002 0.001 0.003
Ti 0.612 0.746 0.735 0.740 0.770 0.748 0.790
Al 0.050 0.097 0.102 0.061 0.093 0.117 0.076
Cr 0.001 0.004 0.000 0.000 0.002 0.003 0.000
V 0.000 0.000 0.000 0.000 0.000 0.000 0.000
Fe3 0.706 0.402 0.429 0.457 0.362 0.382 0.338
Fe2 1.558 1.670 1.600 1.653 1.662 1.614 1.685
Mn 0.032 0.029 0.025 0.031 0.023 0.022 0.024
Mg 0.010 0.042 0.110 0.050 0.085 0.110 0.082
Ni 0.000 0.008 0.000 0.000 0.002 0.004 0.001
Ca 0.009 0.005 0.000 0.006 0.000 0.000 0.000
K 0.004 0.000 0.000 0.001 0.000 0.000 0.000
Total 2.996 3.006 3.001 3.001 3.001 3.001 2.999
A. Ray et al. / Journal of Asian Earth Sciences 27 (2006) 907–921 913
(Fig. 5d) reflects a positive correlation also indicating dual effects
of fractional crystallization and assimilation. A gentle positive
slope is observed between SREE and Nb/Y (Fig. 5e) suggesting a
decrease in Nb/Y with differentiation. Also Nb/Y ratios tend to
decrease with increasing depletion of garnet in the mantle source
during partial melting (R.W. Kent personal communication). A
positive correlation in the variation of Cr and Ni (Fig. 5f) indicates
simultaneous fractionation of olivine and clinopyroxene from the
parent melt. Interestingly, SREE (except Tm and Tb) and Ni are
inversely correlated (rZK0.89), possibly reflecting removal of
olivine from the melt. In Fig. 5b, d and f involving parameters like
Ba/Zr, Ba/Nb, Sr, Cr and Ni, two samples (Sample Nos. P 3.1 and
P 3.7) are different from the others. Fig. 5a–f show bivariate
geochemical relations where the average chemical composition of
Deccan tholeiites (Thompson et al., 1983) are distinctly different
from the Sadara sill, but the average chemical composition of
alkali basalts of Kutch (our unpublished data) are either grouped
together with or lies close to the Sadara samples.
The SREE in the Sadara samples vary from 160 to 187 ppm
and (La/Lu)n varies between 10.99 and 11.82. There is no
discernible Eu anomaly in any of the samples. In a primitive
mantle normalized diagram (Fig. 6), all the elements show 10 to
100 times enrichment over primitive mantle. Of these elements,
Sr, Nb, Ta, Ba, Th, La and Pb show positive highs (greater amount
of enrichment) whereas K, Rb, Nd, Ce, Sm, Y and Yb show
negative dips. The primitive mantle normalized patterns of the
Sadara sill and OIB (OIB data from Sun and McDonough, 1989)
are broadly similar (Fig. 6). Sadara samples show positive spikes
for Ba, Pb and Zr and negative dips for Rb compared to OIB. The
trace element abundances of alkali basalt of the Kutch Mainland
(our unpublished data) are also plotted for comparison. On a
chondrite-normalized (Chondrite data from Evensen et al., 1978)
diagram (Fig. 7), the samples show enrichment of the LREE over
HREE. On this diagram, the LREE pattern of the Sadara samples
show an overall enrichment compared to Deccan tholeiite (data
from Thompson et al., 1983) but depletion for HREE. The REE
patterns of Sadara samples and Kutch alkali basalts (our
unpublished data) are very similar.
6. Rock magnetic studies
6.1. Paleomagnetism
Magnetic susceptibilities were observed in the range of 8 to
16!10K3 SI, with a mean of 12.08!10K3 SI units; the NRM
intensities were in the range of 1.61 to 9.90 A/m (meanZ5.12 A/m). Koenigsberger ratios (QZNRM/kH) were calculated
and were found to be in the range of 3.5 to 25.1 with a mean of
3.5, indicating the suitability of the rocks for paleomagnetic
investigations.
The NRM directions of 26 samples were distributed in the first
and fourth quadrants of the stereonet with shallow to intermediate
positive inclinations indicating strong overprints of the present
earth field (PEF) directions. Out of 26 samples, 18 samples
representing all the block samples were subjected to stepwise AF
demagnetizations in the fields of 2.5, 5.0, 7.5, 10.0, 15.0, 20.0,
25.0, 30.0,40.0, 60.0, 80.0 and 100.0 mT fields for isolating the
characteristic remanent component (ChRM) in the samples.
Another 6 samples were used for thermal demagnetizations by
applying the thermal steps at 50, 100, 150, 200, 250, 300, 350,
400, 450, 500, 560, 585 and 600 8C. The Molspin (UK) AF
demagnetizer and MAVACS system from Geofyzika, Brno
(Prihoda et al., 1989) were used for AF and thermal
demagnetizations, respectively.
During the AF demagnetizations, a low coercivity com-
ponent of viscous origin having mostly PEF directions was
erased by the application of a 40 mT AF field. Further
demagnetization steps, particularly within the steps of 45–
80 mT, yielded north-westerly declinations along with shallow
to intermediate negative inclinations, representing the high
coercivity ChRM component in the samples. A low blocking
temperature component containing the viscous remanence was
removed by the application of thermal demagnetization steps at
around 250–400 8C and the ChRM component was recovered
by the application of 4508–600 8C thermal steps. The maximum
available 100 mT AF field could not demagnetize some of the
samples. It was also noticed during the thermal demagnetiza-
tions that there was still a 5% NRM intensity component
remaining even after the application of 600 8C, indicating some
haematite component in the samples. From the thermal
demagnetization spectra (intensity decay curves), it could be
observed that titano-magnetite was the major remanence carrier
with a minor influence of haematite. Fig. 8a and b represent the
behavior of the specimens during AF and thermal demagnetiza-
tions, respectively.

Table 6
Major element composition and CIPW norms of the Sadara sill, Kutch, Gujarat, India
Oxides/
Sample No.
P/3.1 P/3.2 P/3.3 P/3.4 P/3.5 P/3.6 P/3.7 Standard
(BHVOK
1) Litera-
ture value
Observed
Value
(NGRI)
Precision %
SiO2 45.29 45.52 45.94 45.41 46.76 46.35 46.75 49.94 49.89 0.93
TiO2 1.87 1.88 1.87 2.01 1.85 2.03 1.8 2.71 2.67 1.86
Al2O3 13.04 12.64 13.14 13.14 12.94 13.61 12.41 13.80 13.71 0.57
Fe2O3 1.80 1.77 1.74 1.82 1.71 1.75 1.75 12.23 12.19 0.03
FeO 9.20 9.03 8.88 9.31 8.75 8.95 8.94 – – –
MnO 0.16 0.17 0.17 0.17 0.16 0.17 0.16 0.16 0.11 0.32
MgO 9.23 10.72 9.87 10.11 9.67 9.01 9.66 7.23 7.12 2.37
CaO 11.57 12.15 11.91 11.93 12.04 11.76 11.13 11.41 11.33 1.67
Na2O 2.74 2.99 3.05 3.1 2.98 3.13 2.54 2.26 2.21 0.59
K2O 0.99 0.96 0.99 0.97 1.03 1.11 0.94 0.52 0.11 2.36
P2O5 0.52 0.51 0.58 0.52 0.57 0.62 0.53 0.27 0.21 2.78
LOI 1.00 1.19 1.23 1.30 1.12 1.20 1.17 – – –
Total 97.41 99.53 99.37 99.79 99.56 99.69 97.78 100 99.55
mg no. 64 68 67 66 66.5 64.4 66
Na2OCK2O
3.73 3.95 4.04 4.07 4.01 4.24 3.48
CIPW norms of Sadara sill, Kutch
Normative
mineral
P/ 3.1 P/ 3.2 P/ 3.3 P/ 3.4 P/ 3.5 P/ 3.6 P/ 3.7
Q (S) 0 0 0 0 0 0 0
Or (KAS6) 6.01 5.72 5.91 5.76 6.13 6.6 5.7
Ab (NAS6) 21.23 16.47 19.23 17.27 20.84 20.69 21.99
An (CAS2) 20.86 18.33 19.38 19.13 18.97 19.88 20.14
Lc(KAS4) 0 0 0 0 0 0 0
Ne(NAS2) 1.38 4.86 3.67 4.91 2.43 3.2 0
Di wo(CS) 14.59 16.43 15.37 15.56 15.76 14.66 13.89
Di en(MS) 12.57 14.16 13.25 13.42 13.59 12.64 11.97
Ol fo(M2S) 7.78 8.97 8.15 8.38 7.51 7 3.79
mt(FF) 0.54 0.56 0.56 0.56 0.53 0.56 0.54
he(F) 11.97 11.49 11.33 11.84 11.14 11.37 11.61
il(FT) 0 0 0 0 0 0 0
ap(CP) 1.17 1.12 1.28 1.14 1.25 1.36 1.19
Total 98.08 98.11 98.12 97.98 98.14 97.96 98.16
A. Ray et al. / Journal of Asian Earth Sciences 27 (2006) 907–921914
Principal component analysis (PCA) was applied to obtain the
ChRM component from the AF and thermal demagnetization data
sets. Fisher (1953) statistics was applied to find the mean ChRM
direction which was noticed as DZ315.68, IZK438 (a95Z9.78;
kZ25.38). The pole position corresponding to the mean ChRM
was calculated as 26.78N; 298.68E (dp/dmZ6.768/11.58) and the
palaeo-latitude at 20.98S. The NRM and ChRM directions of the
studied samples are shown in Fig. 9.
6.2. Rock magnetism
The Molspin Pulse magnetizer, having a maximum field of
1 T, was used for the acquisition of the isothermal remanence.
The samples were magnetized by increasing fields in the steps
from 50 to 1000 mT, and the intensity of isothermal remanent
magnetization was measured after each step using the Molspin
Spinner magnetometer. Reverse fields were also applied on the
fields to reduce the magnetization to zero and for further
saturation in the opposite direction. Fig. 10 shows the response
of IRM experiments on the samples of this study. The IRM
saturations at the fields of 200 mT indicate that titano-
magnetite was the major remanence carrying magnetic mineral
in the samples, as noted from thermal demagnetization
intensity decay curves. The coercivity of remanence was
noticed around 20–30 mT, indicating the magnetic mineral
grain size as SD to PSD type (Cisowski, 1981).
For the Lowrie-Fuller (1971) test experiments (Fig. 11), the
representative samples were AF demagnetized with increasing
fields reaching 100 mT and the remnant intensities were
measured after each step, as was in the routine AF
demagnetizations. Then they were saturated by applying the
1 T field. Following the saturation, once again they were
subjected to AF demagnetizations similar to those in the NRM
demagnetizations. The relative intensity decay pattern between
NRM and SIRM demagnetization curves indicates the grain
size of the magnetic mineral in the samples. From Fig. 11 it
can seen that the NRM decay pattern is harder than those of the
SIRM decay pattern, indicating the dominance of SD type
magnetic minerals in the samples.
Lowrie-Fuller test and IRM data suggest that the major
remanence carrying magnetic mineral was SD to PSD type titano-
magnetite in the samples. These results are supported by electron
probe analyses of the opaque phases as discussed in an earlier
section.
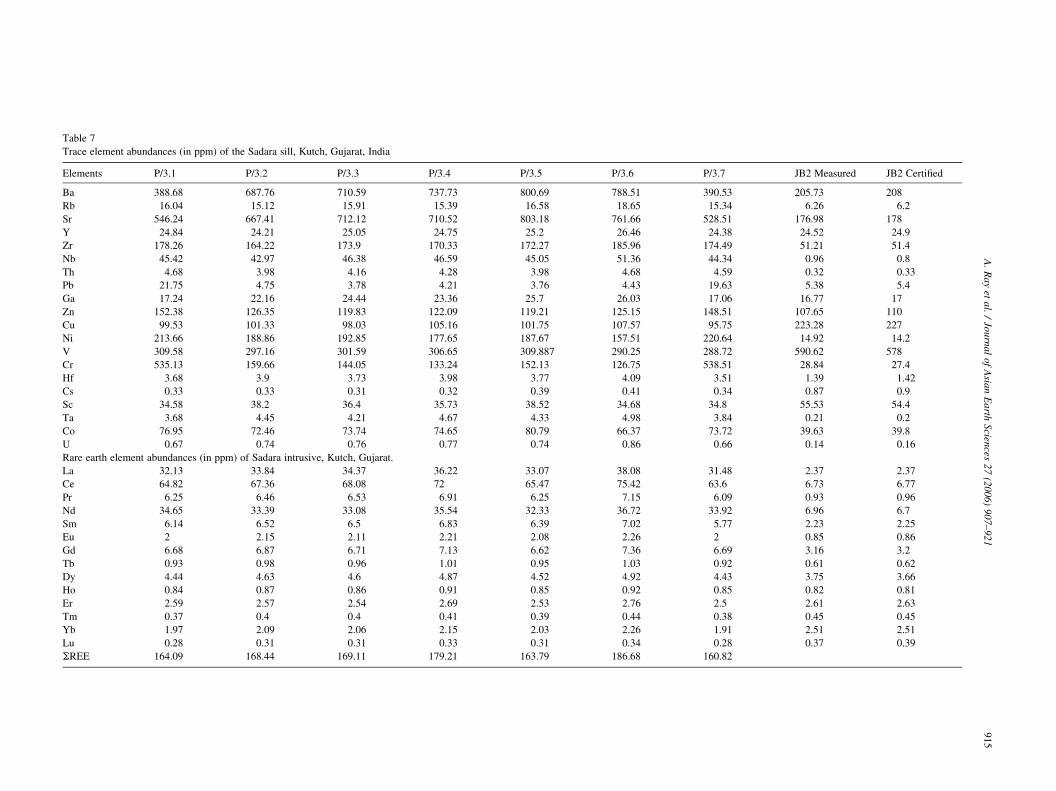
Table 7
Trace element abundances (in ppm) of the Sadara sill, Kutch, Gujarat, India
Elements P/3.1 P/3.2 P/3.3 P/3.4 P/3.5 P/3.6 P/3.7 JB2 Measured JB2 Certified
Ba 388.68 687.76 710.59 737.73 800.69 788.51 390.53 205.73 208
Rb 16.04 15.12 15.91 15.39 16.58 18.65 15.34 6.26 6.2
Sr 546.24 667.41 712.12 710.52 803.18 761.66 528.51 176.98 178
Y 24.84 24.21 25.05 24.75 25.2 26.46 24.38 24.52 24.9
Zr 178.26 164.22 173.9 170.33 172.27 185.96 174.49 51.21 51.4
Nb 45.42 42.97 46.38 46.59 45.05 51.36 44.34 0.96 0.8
Th 4.68 3.98 4.16 4.28 3.98 4.68 4.59 0.32 0.33
Pb 21.75 4.75 3.78 4.21 3.76 4.43 19.63 5.38 5.4
Ga 17.24 22.16 24.44 23.36 25.7 26.03 17.06 16.77 17
Zn 152.38 126.35 119.83 122.09 119.21 125.15 148.51 107.65 110
Cu 99.53 101.33 98.03 105.16 101.75 107.57 95.75 223.28 227
Ni 213.66 188.86 192.85 177.65 187.67 157.51 220.64 14.92 14.2
V 309.58 297.16 301.59 306.65 309.887 290.25 288.72 590.62 578
Cr 535.13 159.66 144.05 133.24 152.13 126.75 538.51 28.84 27.4
Hf 3.68 3.9 3.73 3.98 3.77 4.09 3.51 1.39 1.42
Cs 0.33 0.33 0.31 0.32 0.39 0.41 0.34 0.87 0.9
Sc 34.58 38.2 36.4 35.73 38.52 34.68 34.8 55.53 54.4
Ta 3.68 4.45 4.21 4.67 4.33 4.98 3.84 0.21 0.2
Co 76.95 72.46 73.74 74.65 80.79 66.37 73.72 39.63 39.8
U 0.67 0.74 0.76 0.77 0.74 0.86 0.66 0.14 0.16
Rare earth element abundances (in ppm) of Sadara intrusive, Kutch, Gujarat.
La 32.13 33.84 34.37 36.22 33.07 38.08 31.48 2.37 2.37
Ce 64.82 67.36 68.08 72 65.47 75.42 63.6 6.73 6.77
Pr 6.25 6.46 6.53 6.91 6.25 7.15 6.09 0.93 0.96
Nd 34.65 33.39 33.08 35.54 32.33 36.72 33.92 6.96 6.7
Sm 6.14 6.52 6.5 6.83 6.39 7.02 5.77 2.23 2.25
Eu 2 2.15 2.11 2.21 2.08 2.26 2 0.85 0.86
Gd 6.68 6.87 6.71 7.13 6.62 7.36 6.69 3.16 3.2
Tb 0.93 0.98 0.96 1.01 0.95 1.03 0.92 0.61 0.62
Dy 4.44 4.63 4.6 4.87 4.52 4.92 4.43 3.75 3.66
Ho 0.84 0.87 0.86 0.91 0.85 0.92 0.85 0.82 0.81
Er 2.59 2.57 2.54 2.69 2.53 2.76 2.5 2.61 2.63
Tm 0.37 0.4 0.4 0.41 0.39 0.44 0.38 0.45 0.45
Yb 1.97 2.09 2.06 2.15 2.03 2.26 1.91 2.51 2.51
Lu 0.28 0.31 0.31 0.33 0.31 0.34 0.28 0.37 0.39
SREE 164.09 168.44 169.11 179.21 163.79 186.68 160.82
A.Rayet
al./JournalofAsia
nEarth
Scien
ces27(2006)907–921
915
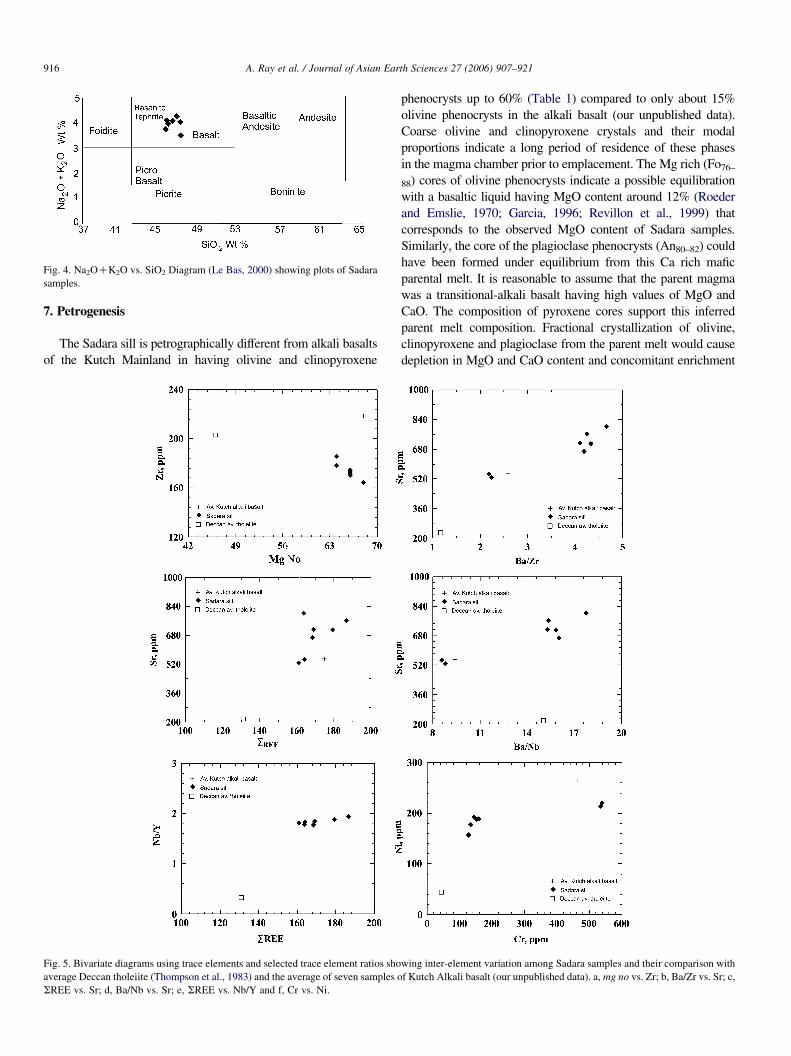
Fig. 4. Na2OCK2O vs. SiO2 Diagram (Le Bas, 2000) showing plots of Sadara
samples.
A. Ray et al. / Journal of Asian Earth Sciences 27 (2006) 907–921916
7. Petrogenesis
The Sadara sill is petrographically different from alkali basalts
of the Kutch Mainland in having olivine and clinopyroxene
Fig. 5. Bivariate diagrams using trace elements and selected trace element ratios sho
average Deccan tholeiite (Thompson et al., 1983) and the average of seven samples o
SREE vs. Sr; d, Ba/Nb vs. Sr; e, SREE vs. Nb/Y and f, Cr vs. Ni.
phenocrysts up to 60% (Table 1) compared to only about 15%
olivine phenocrysts in the alkali basalt (our unpublished data).
Coarse olivine and clinopyroxene crystals and their modal
proportions indicate a long period of residence of these phases
in the magma chamber prior to emplacement. The Mg rich (Fo76–
88) cores of olivine phenocrysts indicate a possible equilibration
with a basaltic liquid having MgO content around 12% (Roeder
and Emslie, 1970; Garcia, 1996; Revillon et al., 1999) that
corresponds to the observed MgO content of Sadara samples.
Similarly, the core of the plagioclase phenocrysts (An80–82) could
have been formed under equilibrium from this Ca rich mafic
parental melt. It is reasonable to assume that the parent magma
was a transitional-alkali basalt having high values of MgO and
CaO. The composition of pyroxene cores support this inferred
parent melt composition. Fractional crystallization of olivine,
clinopyroxene and plagioclase from the parent melt would cause
depletion in MgO and CaO content and concomitant enrichment
wing inter-element variation among Sadara samples and their comparison with
f Kutch Alkali basalt (our unpublished data). a, mg no vs. Zr; b, Ba/Zr vs. Sr; c,
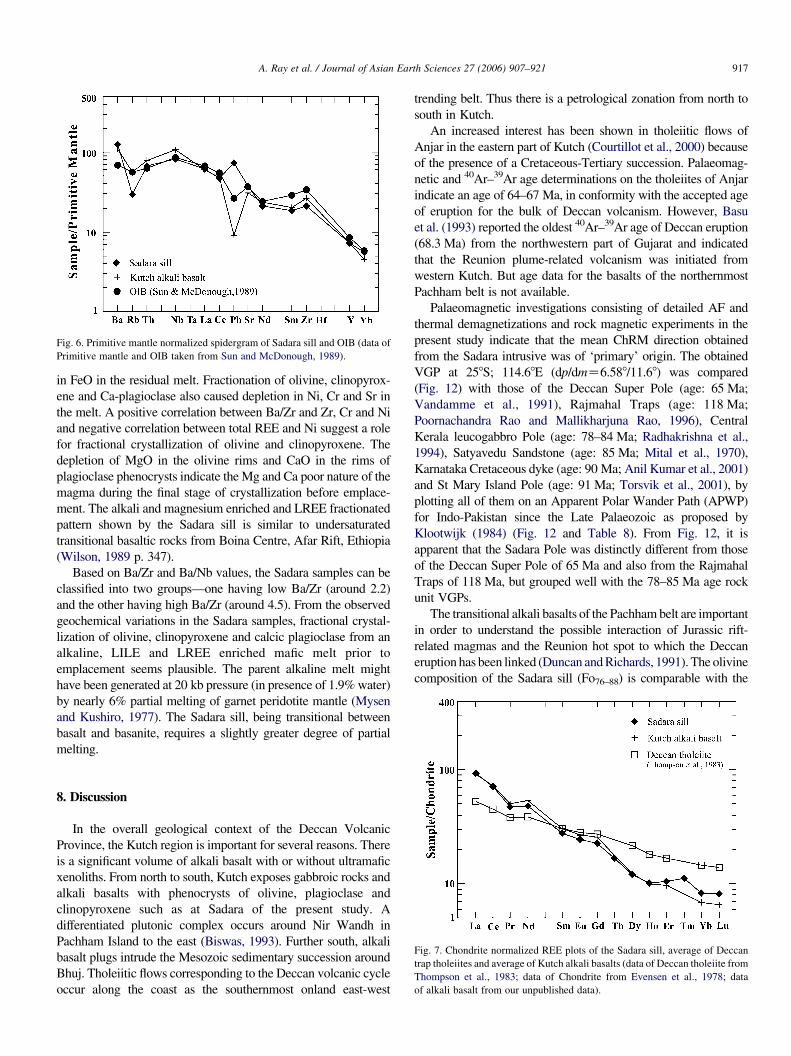
Fig. 6. Primitive mantle normalized spidergram of Sadara sill and OIB (data of
Primitive mantle and OIB taken from Sun and McDonough, 1989).
A. Ray et al. / Journal of Asian Earth Sciences 27 (2006) 907–921 917
in FeO in the residual melt. Fractionation of olivine, clinopyrox-
ene and Ca-plagioclase also caused depletion in Ni, Cr and Sr in
the melt. A positive correlation between Ba/Zr and Zr, Cr and Ni
and negative correlation between total REE and Ni suggest a role
for fractional crystallization of olivine and clinopyroxene. The
depletion of MgO in the olivine rims and CaO in the rims of
plagioclase phenocrysts indicate theMg and Ca poor nature of the
magma during the final stage of crystallization before emplace-
ment. The alkali and magnesium enriched and LREE fractionated
pattern shown by the Sadara sill is similar to undersaturated
transitional basaltic rocks from Boina Centre, Afar Rift, Ethiopia
(Wilson, 1989 p. 347).
Based on Ba/Zr and Ba/Nb values, the Sadara samples can be
classified into two groups—one having low Ba/Zr (around 2.2)
and the other having high Ba/Zr (around 4.5). From the observed
geochemical variations in the Sadara samples, fractional crystal-
lization of olivine, clinopyroxene and calcic plagioclase from an
alkaline, LILE and LREE enriched mafic melt prior to
emplacement seems plausible. The parent alkaline melt might
have been generated at 20 kb pressure (in presence of 1.9%water)
by nearly 6% partial melting of garnet peridotite mantle (Mysen
and Kushiro, 1977). The Sadara sill, being transitional between
basalt and basanite, requires a slightly greater degree of partial
melting.
Fig. 7. Chondrite normalized REE plots of the Sadara sill, average of Deccan
trap tholeiites and average of Kutch alkali basalts (data of Deccan tholeiite from
Thompson et al., 1983; data of Chondrite from Evensen et al., 1978; data
of alkali basalt from our unpublished data).
8. Discussion
In the overall geological context of the Deccan Volcanic
Province, the Kutch region is important for several reasons. There
is a significant volume of alkali basalt with or without ultramafic
xenoliths. From north to south, Kutch exposes gabbroic rocks and
alkali basalts with phenocrysts of olivine, plagioclase and
clinopyroxene such as at Sadara of the present study. A
differentiated plutonic complex occurs around Nir Wandh in
Pachham Island to the east (Biswas, 1993). Further south, alkali
basalt plugs intrude the Mesozoic sedimentary succession around
Bhuj. Tholeiitic flows corresponding to the Deccan volcanic cycle
occur along the coast as the southernmost onland east-west
trending belt. Thus there is a petrological zonation from north to
south in Kutch.
An increased interest has been shown in tholeiitic flows of
Anjar in the eastern part of Kutch (Courtillot et al., 2000) because
of the presence of a Cretaceous-Tertiary succession. Palaeomag-
netic and 40Ar–39Ar age determinations on the tholeiites of Anjar
indicate an age of 64–67 Ma, in conformity with the accepted age
of eruption for the bulk of Deccan volcanism. However, Basu
et al. (1993) reported the oldest 40Ar–39Ar age of Deccan eruption
(68.3 Ma) from the northwestern part of Gujarat and indicated
that the Reunion plume-related volcanism was initiated from
western Kutch. But age data for the basalts of the northernmost
Pachham belt is not available.
Palaeomagnetic investigations consisting of detailed AF and
thermal demagnetizations and rock magnetic experiments in the
present study indicate that the mean ChRM direction obtained
from the Sadara intrusive was of ‘primary’ origin. The obtained
VGP at 258S; 114.68E (dp/dmZ6.588/11.68) was compared
(Fig. 12) with those of the Deccan Super Pole (age: 65 Ma;
Vandamme et al., 1991), Rajmahal Traps (age: 118 Ma;
Poornachandra Rao and Mallikharjuna Rao, 1996), Central
Kerala leucogabbro Pole (age: 78–84 Ma; Radhakrishna et al.,
1994), Satyavedu Sandstone (age: 85 Ma; Mital et al., 1970),
Karnataka Cretaceous dyke (age: 90 Ma; Anil Kumar et al., 2001)
and St Mary Island Pole (age: 91 Ma; Torsvik et al., 2001), by
plotting all of them on an Apparent Polar Wander Path (APWP)
for Indo-Pakistan since the Late Palaeozoic as proposed by
Klootwijk (1984) (Fig. 12 and Table 8). From Fig. 12, it is
apparent that the Sadara Pole was distinctly different from those
of the Deccan Super Pole of 65 Ma and also from the Rajmahal
Traps of 118 Ma, but grouped well with the 78–85 Ma age rock
unit VGPs.
The transitional alkali basalts of the Pachhambelt are important
in order to understand the possible interaction of Jurassic rift-
related magmas and the Reunion hot spot to which the Deccan
eruption has been linked (Duncan andRichards, 1991). The olivine
composition of the Sadara sill (Fo76–88) is comparable with the
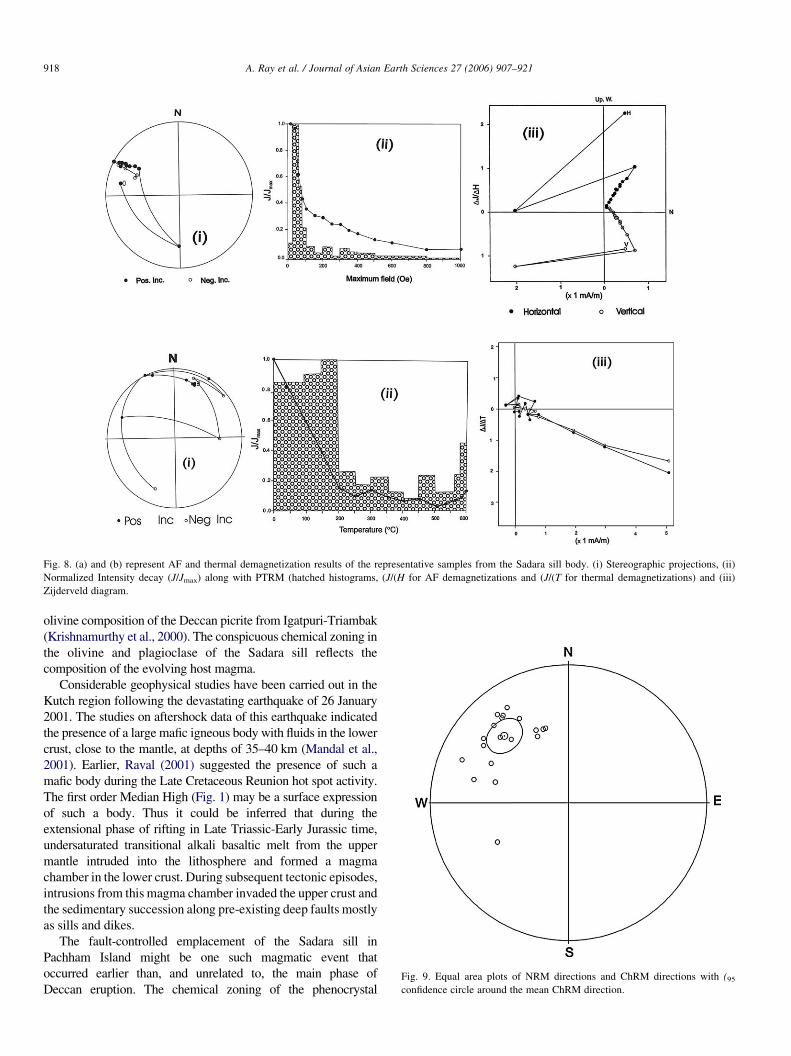
Fig. 8. (a) and (b) represent AF and thermal demagnetization results of the representative samples from the Sadara sill body. (i) Stereographic projections, (ii)
Normalized Intensity decay (J/Jmax) along with PTRM (hatched histograms, (J/(H for AF demagnetizations and (J/(T for thermal demagnetizations) and (iii)
Zijderveld diagram.
Fig. 9. Equal area plots of NRM directions and ChRM directions with (95confidence circle around the mean ChRM direction.
A. Ray et al. / Journal of Asian Earth Sciences 27 (2006) 907–921918
olivine composition of the Deccan picrite from Igatpuri-Triambak
(Krishnamurthy et al., 2000). The conspicuous chemical zoning in
the olivine and plagioclase of the Sadara sill reflects the
composition of the evolving host magma.
Considerable geophysical studies have been carried out in the
Kutch region following the devastating earthquake of 26 January
2001. The studies on aftershock data of this earthquake indicated
the presence of a large mafic igneous body with fluids in the lower
crust, close to the mantle, at depths of 35–40 km (Mandal et al.,
2001). Earlier, Raval (2001) suggested the presence of such a
mafic body during the Late Cretaceous Reunion hot spot activity.
The first order Median High (Fig. 1) may be a surface expression
of such a body. Thus it could be inferred that during the
extensional phase of rifting in Late Triassic-Early Jurassic time,
undersaturated transitional alkali basaltic melt from the upper
mantle intruded into the lithosphere and formed a magma
chamber in the lower crust. During subsequent tectonic episodes,
intrusions from this magma chamber invaded the upper crust and
the sedimentary succession along pre-existing deep faults mostly
as sills and dikes.
The fault-controlled emplacement of the Sadara sill in
Pachham Island might be one such magmatic event that
occurred earlier than, and unrelated to, the main phase of
Deccan eruption. The chemical zoning of the phenocrystal
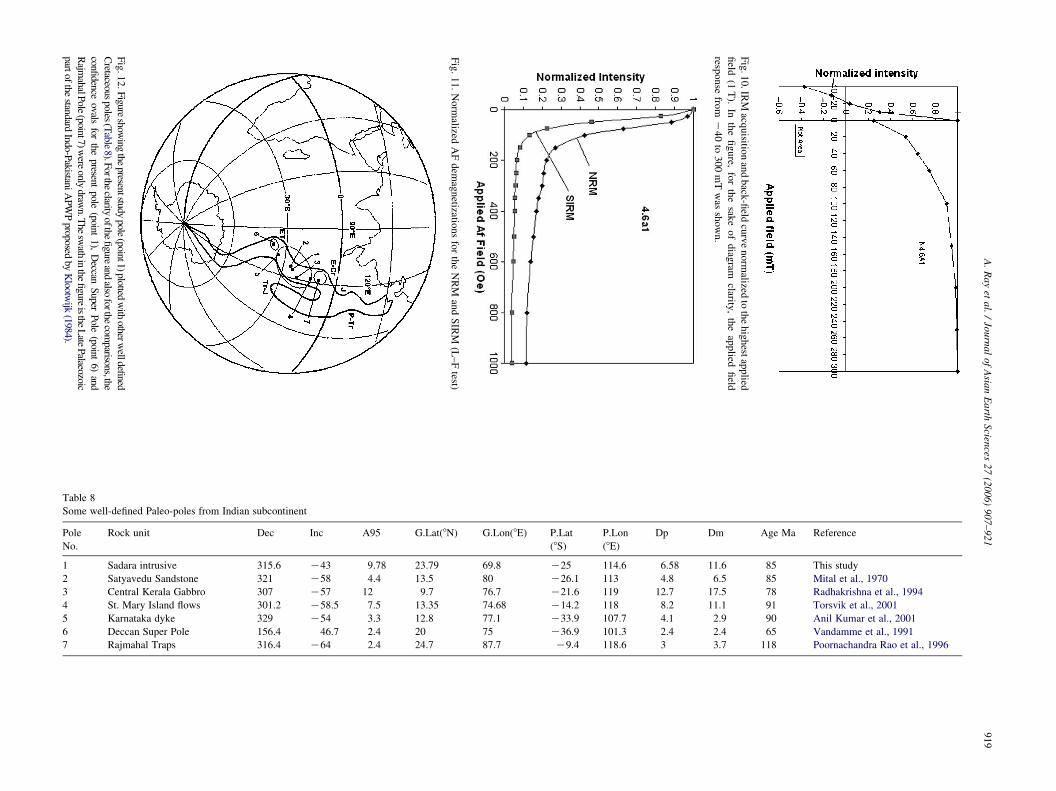
Fig.10.IR
Macq
uisitio
nandback
-field
curvenorm
alizedtothehighest
applied
field
(1T).
Inthefigure,
forthesak
eofdiag
ramclarity
,theapplied
field
response
from
K40to
300mTwas
shown.
Fig.12.Figure
showing
thepresentstudy
pole(point1)
plottedwith
otherwelldefi
ned
Cretaceous
poles(Table
8).Forthe
clarityofthe
figure
andalso
forthe
comparisons,the
confidence
ovalsfor
thepresent
pole(point
1),Deccan
Super
Pole
(point6)
and
Rajm
ahalPole
(point7)were
onlydraw
n.The
swath
inthe
figure
isthe
Late
Palaeozoic
partofthe
standardIndo-P
akistaniAPWPproposed
byKlootw
ijk(1984).
Fig.11.Norm
alizedAFdem
agnetizatio
nsfortheNRM
andSIRM
(L–Ftest)
Table 8
Some well-defined Paleo-poles from Indian subcontinent
Pole
No.
Rock unit Dec Inc A95 G.Lat(8N) G.Lon(8E) P.Lat
(8S)
P.Lon
(8E)
Dp Dm Age Ma Reference
1 Sadara intrusive 315.6 K43 9.78 23.79 69.8 K25 114.6 6.58 11.6 85 This study
2 Satyavedu Sandstone 321 K58 4.4 13.5 80 K26.1 113 4.8 6.5 85 Mital et al., 1970
3 Central Kerala Gabbro 307 K57 12 9.7 76.7 K21.6 119 12.7 17.5 78 Radhakrishna et al., 1994
4 St. Mary Island flows 301.2 K58.5 7.5 13.35 74.68 K14.2 118 8.2 11.1 91 Torsvik et al., 2001
5 Karnataka dyke 329 K54 3.3 12.8 77.1 K33.9 107.7 4.1 2.9 90 Anil Kumar et al., 2001
6 Deccan Super Pole 156.4 46.7 2.4 20 75 K36.9 101.3 2.4 2.4 65 Vandamme et al., 1991
7 Rajmahal Traps 316.4 K64 2.4 24.7 87.7 K9.4 118.6 3 3.7 118 Poornachandra Rao et al., 1996
A.Rayet
al./JournalofAsia
nEarth
Scien
ces27(2006)907–921
919

A. Ray et al. / Journal of Asian Earth Sciences 27 (2006) 907–921920
phases and similarity in composition of phenocryst rims and
groundmass grains, along with the systematic increase in trace
element ratios like Rb/Nb and Ba/Zr, lead to the conclusion
that the original primitive character of the Sadara sill was
modified by progressive fractional crystallization of early-
formed olivine, clinopyroxene and plagioclase. The primitive
character of the sill is reflected by its Mg-rich composition
(Fo88) of olivine cores (Roeder and Emslie, 1970; Garcia,
1996).
9. Conclusions
Our present study of the sill occurring around Sadara in
Pachham Island indicates the occurrence of olivine-pyroxene-
plagioclase-phyric transitional alkali basalt that was emplaced
along a fault in the Kutch Rift Basin. Compared to primitive
mantle, the Sadara samples are enriched in Sr, Ba, Pb and LREE
but depleted in Nb, Cr, Y, Cs and Lu. Geochemically Sadara
samples are different from average Deccan tholeiites (Thompson
et al., 1983). The average alkali basalt of the Kutch mainland falls
on the trend defined by the Sadara samples in some geochemical
variation diagrams (Fig. 5b–d, f), although trace elements such as
Ni, Zr and Nb are higher in the former. The chemical composition
of the magmatic rocks was modified by fractional crystallization.
Palaeomagnetic data indicate an age of around 85 Ma for the sill.
It appears that the sill represents a rift related magmatic event that
occurred earlier than the Deccan eruption.
Acknowledgements
The authors thank P.K. Govil and V. Balaram of NGRI for
analytical assistance, Department of Science and Technology,
Government of India for financial support and H.N. Bhattachar-
yya for facilities at the Department of Geology, Presidency
College, Kolkata. Comments and suggestions by journal
reviewers P.R. Hooper and R.W. Kent and editorial suggestions
by Kevin Burke improved the presentation considerably.
References
Anil Kumar, Pande, K., Venkatesan, T.R., Bhaskar Rao, Y.J., 2001. The Karnataka
Late Cretaceous dykes as products of the Marion hot spot at the Madagascar-
India breakup event: evidence from 40Ar–39Ar geochronology and geochem-
istry. Geophysical Research Letter 28 (14), 2715–2718.
Basu, A.K., Renne, P.R., Dasgupta, D.K., Teichmann, F., Poreda, R.J., 1993. Early
and late alkali igneous pulses and a high-3 He plume origin of the Deccan
Basalt. Science 261, 902–905.
Biswas, S.K., 1977. Mesozoic Rock-stratigraphy of Kutch, Gujarat. Geological
Mining and Metallurgical Society of India 49 (3 & 4), 1–52.
Biswas, S.K., 1980. Structure of Kutch–Kathiawar region, Western India.
Proceedings of the Third Indian Geological Congress Pune, pp. 255–272.
Biswas, S.K., 1993. Geology of Kutch. Dehradun, KDM Institute of Petroleum
Exploration (ONGC).
Biswas, S.K., 2002. Structure and Tectonics of the Kutch Basin, with Special
Reference to Earthquakes, Eighth. IGC Foundation Lecture, Indian Geological
Congress, Roorkee.
Chatterjee, N., Bhattacharji, S., 2001. Origin of felsic and basaltic dykes and flows
in the Rajula–Palitana–Sihor area of the Deccan Traps, India: a geochemical
and geochronological study. International Geological Review 43, 1094–1116.
Cisowski, S., 1981. Interacting vs. non-interacting single domain behavior in
natural and synthetic samples. Physics of Earth Planet Interior 26, 56–62.
Courtillot, V., Gallet, Y., Rocchia, R., Feraud, G., Robin, E., Hofmann, C.,
Bhandari, N., Ghevaria, Z.G., 2000. Cosmic markers, 40Ar–39Ar dating and
paleomagnetism of the K-T section in Anjar area of the Deccan Large igneous
Province. Earth and Planetary Science Letter 182, 137–156.
De, A., 1964. Iron–titanium oxides and silicate minerals of the alkali olivine
basalts, tholeiites and acidic rocks of the Deccan Trap series and their
significance. Internatinal Geological Congress Report, 22nd session, pt III, pp.
126–138.
Duncan, R.A., Richards, M.A., 1991. Hotspots, mantle plumes, flood basalt and
true polar wonder. Review Geophysics 29, 31–50.
Evensen, N.M., Hamilton, P.J., O’Nions, R.K., 1978. Rare earth abundances in
chondritic meteorites. Geochimica Cosmochimica Acta 42, 1199–1212.
Fisher, R.A., 1953. Dispersion on a sphere. Proceedings of the Royal Society of
London 217, 295–305.
Garcia, M.O., 1996. Petrography and olivine and glass chemistry of lavas from
Hawaii scientific Drilling Project. Journal of Geophysical Research 101,
11701–11713.
Karmalkar, N.R., Sarma, P.K., 2003. Characterization and origin of silicic and
alkali rich glasses in the upper mantle derived spinel peridotite xenoliths from
alkali basalts, Deccan traps, Kutch, northwest India. Current Science 85 (3),
386–392.
Karmalkar, N.R., Griffin, W.L., O’Reilly, S.Y., 2000. Ultramafic xenoliths from
Kutch northwest India: plume related mantle source? International Geological
Review 42, 416–444.
Klootwijk, C.T., 1984. A review of Indian Phanerozoic palaeomagnetism:
implications for the India Asia collision. Tectonophysics 105, 331–353.
Krishnamurthy, P., Pande, K., Gopalan, K., Macdougall, J.D., 1989. Upper mantle
xenoliths in alkali basalts related to Deccan Trap Volcanism. Geological
Society of India Special Publication 10, 53–68.
Krishnamurthy, P., Pande, K., Gopalan, K., Macdougall, J.D., 1999. Mineralogical
and chemical studies on alkaline basaltic rocks of Kutch, Gujarat, India.
Memoir Geological Society of India 43, 757–783.
Krishnamurthy, P., Gopalan, K., Macdougall, J.D., 2000. Olivine composition
in picrite basalt and the Deccan Volcanic Cycle. Journal of Petrology 41,
1057–1069.
Le Bas, M.J., 2000. IUGS reclassification of the high Mg and picritic volcanic
rocks. Journal of Petrology 41 (10), 1467–1470.
Lowrie, W., Fuller, M., 1971. On the alternating field demagnetization
characteristics of multi-domain thermoremanent magnetization in magnetite.
Journal of Geophysical Research 76, 6339–6349.
Mahoney, J.J., 1988. Deccan traps. In: Macdougall, J.D. (Ed.), Continental Flood
Basalts. Kluwer, Dordrecht.
Mandal, P., Rastogi, B.K., Satyanaraya, H.V.S., Kousalya, M., Vijayraghavan, R.,
Satyamurty, C., Raju, I.P., Sarma, A.N.S., Kumar, N., 2001. Characterization
of the fault system for Bhuj earthquake of Mw 7.7. Tectonophysics 378,
105–121.
Mital, G.S., Verma, R.K., Pullaiah, G., 1970. Palaeomagnetic study of Satyavedu
Sandstones of Cretaceous age from Andhra Pradesh. Pure and Applied
Geophysics 81, 177–191.
Mysen, B.O., Kushiro, I., 1977. Compositional variation of coexisting phases with
degree of melting of peridotite in the upper mantle. American Mineralogist 62,
843–856.
Pande, K., 2002. Age and duration of Deccan Traps, India: a review of radiometric
and paleomagnetic constraint. Proceedings of the Indian Academy of Science.
(Earth and Planetary Science) 111 (2), 115–123.
Pande, K., Venkatesan, T.R., Gopalan, K., Krishnamurthy, P., Macdougall, J.D.,
1988. 40Ar–39Ar Ages of alkali basalts fromKutch, Deccan Volcanic Province,
India. Geological Society of India Memoir 10, 145–150.
Poornachandra Rao, G.V.S., Mallikharjuna Rao, J., 1996. Palaeomagnetism of
Rajmahal Traps of India: a magnetic reversal in the Cretaceous normal
superchron Rajmahal Traps of India. Journal of Geomagnetism and
Geoelectricity 48 (7), 993–1000.
Prihoda, K., Krs, M., Pesina, B., Blaha, J., 1989. MAVACS—a new system
creating a non magnetic environment for palaeomagnetic studies. Cuadernos
Geology Iberica 12, 223–250.

A. Ray et al. / Journal of Asian Earth Sciences 27 (2006) 907–921 921
Radhakrishna, T., Dallmeyer, R.D., Mathew, J., 1994. Palaeomagnetism and
Ar/Ar vs Ar/Ar isotope correlation ages of dyke swarms in Central Kerala,
India: tectonic implications. Earth and Planetary Science Letter 121,
227–244.
Raval, U., 2001. Earthquakes over Kutch: a region of ‘trident’ space-time
geodynamics. Current Science 81 (7), 809–815.
Revillon, S., Arndt, N.T., Hallot, E., Kerr, A.C., Tarney, J., 1999. Petrogenesis of
picrites from the Caribbean Plateau and the North AtlanticMagmatic Province.
Lithos 49, 1–21.
Roeder, P.L., Emslie, R.F., 1970. Olivine-liquid equilibrium. Contribution to
Mineralogy and Petrology 29, 275–289.
Sun, S.S., McDonough, W.F., 1989. Chemical and isotope systematics of oceanic
basalt: implication for mantle composition and processes. In: Saunders, A.D.,
Norry, M.J. (Eds.), Magmatism in the Ocean Basins Geological Society of
London, Special Publication 42. Blackwell, Oxford, pp. 313–345.
Thompson, R.N., Morrison, M.A., Dickin, A.P., Hendry, G.L., 1983. Continental
flood basalt..arachnids rule OK? In: Hawkesworth, C.J., Norry, M.J. (Eds.),
Continental Basalt and Mantle Xenoliths. Shiva, Nantwich, pp. 158–185.
Torsvik,T.H.,Tucker,R.D.,Ashwal,L.D.,Carter,L.M., Jamtveit,B.,Vidyadharan,
K.T., Venaktaramana, P., 2001. Late Cretaceous India–Madagascar fit and
timing of break-up related magmatism. Terra Nova 12 (5), 220–225.
Vandamme, D., Courtillot, V., Besse, J., Montigny, R., 1991. Palaeomagnetism
and age determinations of the Deccan Traps (India): results of a Nagpur–
Bombay traverse and review of earlier work. Review Geophysics 29, 159–190.
Wilson, M., 1989. Igneous Petrogenesis: A Global Tectonic Approach. Unwin
Hyman, London.