PETROLIA NOCO AS Annual report 2017 · Petrolia NOCO AS is a private limited company incorporated...
25
PETROLIA NOCO AS Annual report 2017
Transcript of PETROLIA NOCO AS Annual report 2017 · Petrolia NOCO AS is a private limited company incorporated...

PETROLIA NOCO AS
Annual report 2017

DIRECTORS' REPORT 2017
PETROLIA NOCO AS
Nature of Business and Business Locations
Petrolia NOCO AS was incorporated on 3rd June 2011.
Petrolia NOCO AS is registered in Bergen and operates out of Bergen and Oslo.
The Ministry of Petroleum and Energy approved Petrolia NOCO AS as a NCS licensee on the 7th of
February 2012 and in November 2016 the company was prequalified as an operator on the Norwegian
Continental Shelf (NCS).
Petrolia NOCO AS is an Exploration and Production company with the Norwegian Continental Shelf
(NCS) as its focus.
Financial Result
Petrolia NOCO AS recorded a net loss in 2017 of NOK 13 469 403 compared to a net loss of NOK
14 839 767 in 2016. The net loss was transferred to retained earnings.
The total equity was NOK 41 641 230 as at 31.12.2017.
Financial Risk
The main financial risk factors for Petrolia NOCO AS are related to fluctuations in oil prices,
exchange rates and interest levels and the need of capital funding.
Going concern
Pursuant to the Norwegian Accounting Act section 3-3a, the Board confirms that the requirements of
the going concern assumption are met and that the annual accounts have been prepared on that basis.
The financial position and the liquidity of the company are considered to be satisfactory in relation to
planned activity level.
Organisation
Petrolia NOCO AS had 17 full time employees and 2 part time employees as at 31.12.2017. 48% of
the company's employees are women. The company pays equal salaries and gives equal
compensation for women and men in positions at the same level. The company's board of directors
consists of 3 men. Petrolia NOCO AS emphasises equality between the genders and the equal
treatment of all employees. Sick leave in 2017 was 4.3% of total work hours and includes one long-
term sick leaves. There were no injuries or accidents in 2017.
Health, Safety & Environment
Activities related to exploration, development and production of oil and gas may cause emissions to
the sea and air. The operations were in accordance with all regulatory requirements in 2017.


Petrolia NOCO AS
INCOME STATEMENT
(Amounts in NOK) Note 2017 2016
Operating income 2,282,895 1,615,901
Exploration expenses 4 -18,926,830 -7,579,847
Payroll and related cost 5 -24,490,687 -23,130,564
Depreciation and amortisation 10 -387,778 -538,536
Other operating expenses 6 -10,765,667 -10,266,854
Operating profit (loss) -52,288,067 -39,899,901
Finance income 7 148,365 743,156
Finance costs 7 -1,949,635 -7,275,925
Net financial items -1,801,270 -6,532,769
Profit (loss) before income tax -54,089,336 -46,432,669
Calculated refund tax value of exploration costs 38,247,588 28,702,157
Change deferred tax 2,372,345 2,890,745
Net Income tax credit 8 40,619,933 31,592,902
Profit (loss) for the year -13,469,403 -14,839,767
STATEMENT OF COMPREHENSIVE INCOME
(Amounts in NOK) Note 2017 2016
Profit (loss) for the year -13,469,403 -14,839,767
Other comprehensive income, net of tax: - -
Total other comprehensive income, net of tax - -
Total comprehensive income for the year -13,469,403 -14,839,767
Earnings per share 14
Basic, profit for the year attributable to
ordinary equity holders of the parent -17.51 -27.19
Diluted, profit for the year attributable to
ordinary equity holders of the parent -17.51 -27.19


Petrolia NOCO AS
STATEMENT OF CHANGES IN EQUITY
Share Uncovered Total
(Amounts in NOK) capital loss equity
Equity at 1st of January 2016 36,136,800 - -16,186,447 19,950,353
Profit (loss) for the year -14,839,767 -14,839,767
Other comprehensive income for the year - -
Total comprehensive income for the year -14,839,767 -14,839,767
Shares issued in 2016 50,000,048 - 50,000,048
Equity at 31st of December 2016 86,136,848 - -31,026,214 55,110,634
Equity at 1st of January 2017 86,136,848 - -31,026,214 55,110,634
Profit (loss) for the year -13,469,403 -13,469,403
Other comprehensive income for the year - -
Total comprehensive income for the year -13,469,403 -13,469,403
Shares issued in 2017 - - -
Equity at 31st of December 2017 86,136,848 - -44,495,617 41,641,231
Premium
paid-in
capital

Petrolia NOCO AS
CASH FLOW STATEMENT
(Amounts in NOK) Note 2017 2016
Cash flow from operating activities
Profit (loss) before income tax -54,089,336 -46,432,669
Adjustments:
Tax refunded 8 28,102,002 101,022,951
Depreciation and amortisation 10 387,778 538,536
Changes in trade creditors -2,306,603 3,010,297
Changes in other accruals 584,758 241,343
Net cash flow from operating activities -27,321,401 58,380,458
Cash flow from investing activities
Investment in exploration and evaluation assets 0
Purchase of property, plant and equipment 10 -112,506 -211,193
Purchase of intangible asset (software) 10 0 0
Proceeds from sale of property, plant and equipment 10 0
Net cash flow from investing activities -112,506 -211,193
Cash flow from financing activities
Funds drawn non-current borrowings 0 0
Repayments of current borrowings -6,500,000 0
Transaction costs and interest on borrowings paid 0 0
Net proceeds/payments from borrowings, related party 17 327,569 -116,501,056
Proceeds from share issues 0 50,000,048
Net cash flow from financing activities -6,172,432 -66,501,008
Net change in cash and cash equivalents -33,606,339 -8,331,743
Cash and cash equivalents at 1st January 36,083,697 44,415,439
Cash and cash equivalents at 31st of December 2,477,358 36,083,697

Note 1. General information The Financial statements of Petrolia NOCO AS for 2017 were approved by the board of directors and CEO on 12 June 2018. Petrolia NOCO AS is a private limited company incorporated and domiciled in Norway, with its main office in Bergen. The company was incorporated 3 June 2011. The company’s only business segment is exploration for oil and gas on the Norwegian continental shelf.
Note 2. Summary of significant accounting policies The principal accounting policies applied in the preparation of these financial statements are set out below. These policies have been consistently applied to all the periods presented, unless otherwise stated. Basis for preparation The financial statements have been prepared in accordance with International Financial Reporting Standards (IFRS) as adopted by the European Union (EU) and in accordance with the additional requirements following the Norwegian Accounting Act. The financial statements have been prepared on a historical cost basis and on a going concern assumption. Foreign currency Functional currency and presentation currency The company’s functional and presentation currency is Norwegian kroner (NOK). Transactions in foreign currency
Foreign currency transactions are translated into NOK using the exchange rates at the transaction date. Monetary balances in foreign currencies are translated into NOK at the exchange rates on the date of the balance sheet. Foreign exchange gains and losses resulting from the settlement of such transactions and from the translation of monetary assets and liabilities denominated in foreign currencies are recognised in the income statement. Property, plant and equipment Property, plant and equipment are stated at historical cost less accumulated depreciation and any impairment charges. Depreciations are calculated on a straight line basis over the assets expected useful life and adjusted for any impairment charges. Expected useful lives of long-lived assets are reviewed annually and where they differ from previous estimates, depreciation periods are changed accordingly. Property, plant and equipment are reviewed for potential impairment whenever events or changes in circumstances indicate that the carrying amount of an asset exceeds its recoverable amount. Intangible assets Exploration costs for oil and gas properties The Company uses the successful efforts method to account for exploration costs. All exploration costs, with the exception of acquisition costs of licenses and drilling costs of exploration wells, are expensed as incurred. Costs related to drilling of exploration wells are temporarily capitalised pending the evaluation of the potential existence of oil and gas reserves. If reserves are not found, or if

discoveries are assessed not to be commercially recoverable, the drilling costs of exploration wells are expensed. Costs of acquiring licenses are capitalised as intangible assets. Drilling cost for exploration wells are temporarily capitalised pending the evaluation of potential discoveries of oil and gas reserves. If no reserves are discovered, or if recovery of the reserves is not considered technically or commercially viable, expenses relating to the drilling of exploration wells are charged to income statement. Such costs can remain capitalised for more than one year. The main criteria are that there must be definite plans for future drilling in the licence or that a development decision is expected in the near future. Leases (as lessee) Financial leases Leases where the company assumes most of the risk and rewards of ownership, is classified as financial leases. The company does not have any such leases. Operating leases Leases in which most of the risks and rewards of ownership are retained by the lessor are classified as operating leases. Payments made under operating leases are charged to the income statement on a straight-line basis over the period of the lease. Receivables Receivables are initially recognised at fair value plus any transaction costs. The receivables are subsequently carried at amortised cost using the effective interest method. Cash and cash equivalents Cash and the equivalents include cash on hand, deposits with banks and other short-term highly liquid investments with original maturities of three months or less. Taxes Income taxes for the period comprise tax payable, refundable tax from refund tax value of exploration expenses and changes in deferred tax. Tax is recognised in the income statement, except to the extent that it relates to items recognised in other comprehensive income or directly in equity. In this case the tax is also recognised in other comprehensive income or directly in equity. Deferred tax assets and liabilities are calculated on the basis of existing temporary differences between the carrying amounts of assets and liabilities in the financial statement and their tax bases, together with tax losses carried forward at the balance sheet date. Deferred tax assets and liabilities are calculated based on the tax rates and tax legislation that are expected to exist when the assets are realised or the liabilities are settled, based on the tax rates and tax legislation that have been enacted or substantially enacted on the balance sheet date. Deferred tax assets are recognised only to the extent that it is probable that future taxable profits will be available against which the assets can be utilised. The carrying amount of deferred tax assets is reviewed at each balance sheet date and reduced to the extent that is no longer probable that the deferred tax asset can be utilised. Deferred tax assets and liabilities are not discounted. Deferred tax assets and liabilities are offset when there is a legally enforceable right to offset current tax assets against current tax liabilities and when the deferred taxes assets and liabilities relate to income taxes levied by the same taxation authority on the same taxable entity. Trade creditors Trade creditors are recognised initially at fair value and subsequently measured at amortised cost using the effective interest method.

Contingent liabilities Contingent liabilities are not recognised in the financial statements. Significant contingent liabilities are disclosed, with the exception of contingent liabilities where the probability of the liability occurring is remote. Segment reporting The company’s only business segment is exploration for oil and gas on the Norwegian continental shelf. Based on this no segment note is presented and this is in accordance with management’s reporting. Cost of equity transactions Transaction costs directly linked to an equity transaction are recognised directly in equity, net after deducting tax. Revenue recognition Revenues from sales of services are recorded when the service has been performed.
Earnings per share The calculation of basic earnings per share is based on the profit attributable to the owners of ordinary shares of the company using the weighted average number of ordinary shares outstanding during the year after deduction of the average number of treasury shares held over the period. The calculation of diluted earnings per share is consistent with the calculation of the basic earnings per share, but gives at the same time effect to all dilutive potential ordinary shares that were outstanding during the period, by adjusting the profit/loss and the weighted average number of shares outstanding for the effects of all dilutive potential shares, i.e.: • The profit/loss for the period is adjusted for changes in profit/loss that would result from the conversion of the dilutive potential ordinary shares. • The weighted average number of ordinary shares is increased by the weighted average number of additional ordinary shares that would have been outstanding assuming the conversion of all dilutive potential ordinary shares. Cash flow statement The cash flow statement is prepared by using the indirect method. Events after the balance sheet date The financial statements are adjusted to reflect events after the balance sheet date that provide evidence of conditions that existed at the balance sheet date (adjusting events). The financial statements are not adjusted to reflect events after the balance sheet date that are indicative of conditions that arose after the balance sheet date (non-adjusting events). Non-adjusting events are disclosed if significant.
IFRS and IFRIC issued but not adopted by the Company
A number of new standards and amendments to standards and interpretations are effective for annual periods beginning after January 1, 2017, and have not been applied in preparing these consolidated financial statements. The most significant standards are set out below. IFRS 9 Financial instruments: IFRS 9 addresses the classification, measurement and derecognition of financial assets and financial liabilities, introduces new rules for hedge accounting and a new impairment model for financial assets.

Effective date is 1 January 2018. IFRS 9 did not have any significant effect on the financial statements as of January 1, 2018. IFRS 15 Revenue from contracts with customers: The IASB has issued a new standard for the recognition of revenue. This will replace IAS 18 which covers contracts for goods and services and IAS 11 which covers construction contracts. The new standard is based on the principle that revenue is recognised when control of a good or service transfers to a customer. The standard permits either a full retrospective or a modified retrospective approach for the adoption. Effective date is 1 January 2018. IFRS 15 did not have any significant effect on the financial statements upon adoption on January 1, 2018. IFRS 16 Leases: IFRS 16 was issued in January 2016. It will result in almost all leases being recognised on the balance sheet, as the distinction between operating and finance leases is removed. Under the new standard, an asset (the right to use the leased item) and a financial liability to pay rentals are recognised. The only exceptions are short-term and low-value leases. The accounting for lessors will not significantly change. Effective date is 1 January 2019. At this stage, the Group does not intend to adopt the standard before its effective date, and is assessing the impact of IFRS 16.
Note 3. Financial risk management Financial risks Exploration for oil and gas involves a high degree of risk, and the company is subject to the general risk factors pertaining to this business, such as (i) volatility of oil and gas prices, (ii) uncertainty pertaining to estimated oil and gas reserves, (iii) operational risk related to oil and gas exploration and (iv) volatility in exchange rates. Furthermore, only few prospects that are explored are ultimately developed into production. Furthermore, the company is exposed to certain types of financial risks. Management involves receivables, loans, accounts payable and drawing rights to financial institutions. The business activities of the company involve exposure to credit risk, interest rate risk, liquidity risk and currency risk. Critical accounting estimates and judgements The preparation of the financial statements in accordance with IFRS requires management to make judgements, use estimates and assumptions that affect the reported amounts of assets and liabilities, income and expenses. The estimates and associated assumptions are based on historical experience and various other factors that are considered to be reasonable under the circumstances. The estimates and underlying assumptions are reviewed on an ongoing basis. Estimates and assumptions which represent a considerable risk for material changes in carrying amounts of assets and liabilities during the next fiscal year, are presented below.
Tax receivable from refund tax value exploration expenses:
The Norwegian taxation authorities may have a different understanding than the Company regarding the definition of exploration expenses according to the Norwegian Petroleum Tax Act. See note 8.

Critical judgements in applying the company’s accounting policies Management has made judgements also in the process of applying the company's accounting policies. Such judgements with the most significant effect on the amounts recognised in the financial statements are presented in the following:
Accounting policy for exploration expenses:
The Company uses the successful efforts method to account for exploration costs. All exploration costs, with the exception of acquisition costs of licenses and drilling costs of exploration wells, are expensed as incurred.
Petrolia NOCO AS
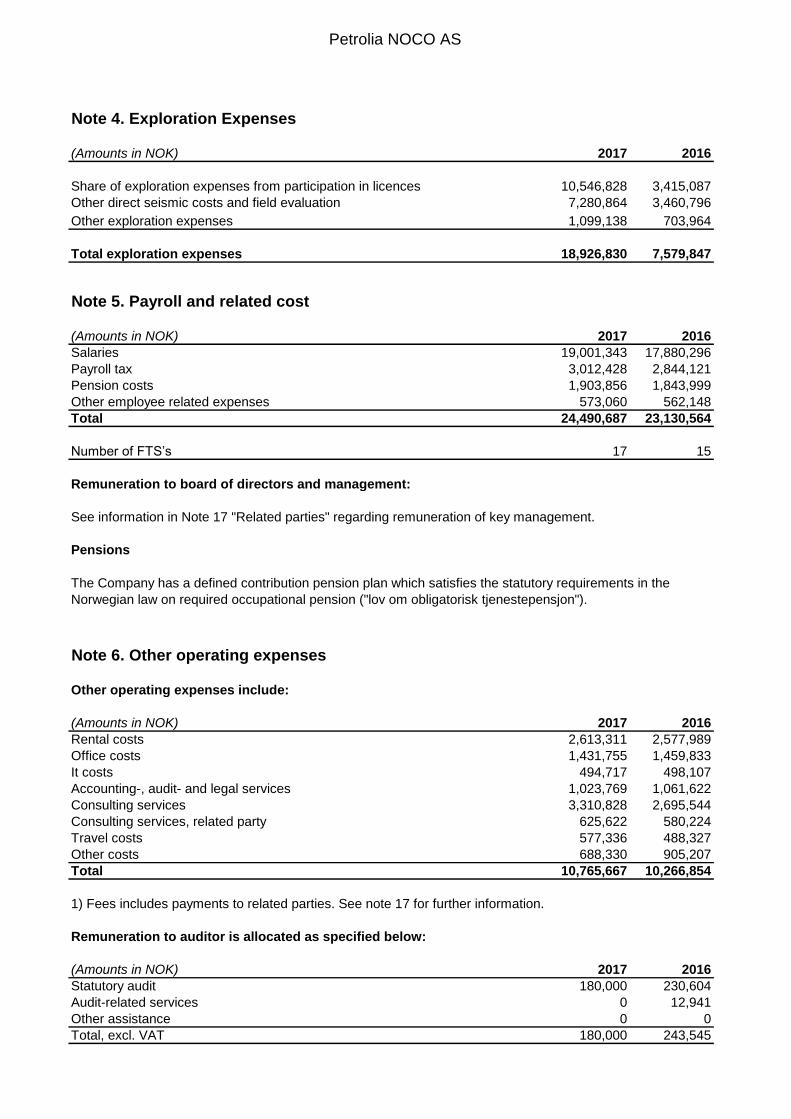
Note 4. Exploration Expenses
(Amounts in NOK) 2017 2016
Share of exploration expenses from participation in licences 10,546,828 3,415,087
Other direct seismic costs and field evaluation 7,280,864 3,460,796
Other exploration expenses 1,099,138 703,964
Total exploration expenses 18,926,830 7,579,847
Note 5. Payroll and related cost
(Amounts in NOK) 2017 2016
Salaries 19,001,343 17,880,296
Payroll tax 3,012,428 2,844,121
Pension costs 1,903,856 1,843,999
Other employee related expenses 573,060 562,148
Total 24,490,687 23,130,564
Number of FTS’s 17 15
Remuneration to board of directors and management:
Pensions
Note 6. Other operating expenses
Other operating expenses include:
(Amounts in NOK) 2017 2016
Rental costs 2,613,311 2,577,989
Office costs 1,431,755 1,459,833
It costs 494,717 498,107
Accounting-, audit- and legal services 1,023,769 1,061,622
Consulting services 3,310,828 2,695,544
Consulting services, related party 625,622 580,224
Travel costs 577,336 488,327
Other costs 688,330 905,207
Total 10,765,667 10,266,854
1) Fees includes payments to related parties. See note 17 for further information.
(Amounts in NOK) 2017 2016
Statutory audit 180,000 230,604
Audit-related services 0 12,941
Other assistance 0 0
Total, excl. VAT 180,000 243,545
See information in Note 17 "Related parties" regarding remuneration of key management.
The Company has a defined contribution pension plan which satisfies the statutory requirements in the
Norwegian law on required occupational pension ("lov om obligatorisk tjenestepensjon").
Remuneration to auditor is allocated as specified below:

Petrolia NOCO AS
Note 7. Finance income and costs
Finance income:
(Amounts in NOK) 2017 2016
Interest income 148,365 743,156
Total finance income 148,365 743,156
Finance costs:
(Amounts in NOK) 2017 2016
Interest expense, related party 1,888,167 7,191,641
Net foreign exchange effects 3,633 36,011
Other finance costs 57,835 48,272
Total finance costs 1,949,635 7,275,925
Note 8. Tax
Specification of income tax:
(Amounts in NOK) 2017 2016
Tax value of eligible exploration costs 38,997,277 28,851,691
Changes in deferred tax 2,372,345 2,890,745
Adjustment for tax earlier years -749,689 -149,534
Total income tax credit 40,619,933 31,592,902
Tax refund on the Norwegian Continental Shelf
Specification of tax effects on temporary differences, tax losses carried forward and deferred tax:
(Amounts in NOK) 2017 2016
Property, plant and equipment 1,551,485 1,728,839
Capitalised exploration and license costs 0 0
Pensions 0 0
Non-current borrowings 0 0
Tax loss onshore, 23% / 24% 1,494,827 1,515,724
Tax loss offshore, 23% / 24% 17,130,047 16,544,145
Tax loss offshore, 55% / 54% 8,427,351 6,463,554
Deferred tax liability (-) / tax asset (+) 28,603,710 26,252,262
Not capitalised deferred tax asset (valuation allowance) -1,494,827 -1,515,724
Deferred tax liability (-) / tax asset (+) in balance 27,108,883 24,736,538
Companies operating on the Norwegian Continental Shelf (NCS) was in 2017 subject to a 54% special oil
taxation in addition to the ordinary 24% corporate tax. Companies that are not in a taxable position can claim
a 78% refund on exploration costs on the NCS. This refund is normally payable in November the following
year.
This tax refund totals NOK 38 997 thousand for 2017 (2016: NOK 28 852 thousand). Tax loss carried forward
(offshore) may be utilized against a possible future taxable income (offshore).
Alternatively, the tax value of loss carry forwards connected to operations on the NCS will be received in the
event of a possible termination of the business. Deferred tax effect has been capitalised to the extent future
realisation is deemed probable.
Effective from 1 January 2018, the special tax rate changed from 54% to 55%, while the corporate tax rate
changed from 24% to 23%. The total tax rate is unchanged (78%).
Deferred tax assets at 31.12.17 are calculated using the tax rates effective from 1 January 2018.

Petrolia NOCO AS
Reconciliation of effective tax rate:
(Amounts in NOK) 2017 2016
Profit (loss) before tax -54,089,336 -46,432,669
Expected income tax 78% 42,189,682 36,217,482
Adjusted for tax effects (24% - 78%) of the following items:
Permanent differences -116,830 -117,502
Taxable income onshore, 24% -994,517 -3,881,325
Adjustments previous years 158,548 161,861
Change in tax rate -656,553 -632,799
Tax loss onshore, not recognized 39,601 -154,814
Total income tax credit 40,619,933 31,592,902
Note 9. Exploration and evaluation assets
(Amounts in TNOK) 2017 2016
Cost:
At 1 January - -
Additions - -
Disposals - -
Cost at 31 December - -
Amortisation and impairment losses
At 1 January - -
Amortisation this year - -
Impairment this year - -
Disposals - -
Accumulated amortisation and impairment at 31 December - -
Carrying amount at 31 December - -
License portfolio 31 December 2017 Share
PL 882 30.0 %
PL 887 20.0 %
In addition, the Company has the following licenses, effective from 2 March 2018
PL 933 40.0 %
PL 936 30.0 %
PL 937 30.0 %
PL 948 30.0 %
Deferred tax is calculated based on tax rates applicable on the balance sheet date. Ordinary income tax is
23% from 2018 (reduced from 24% in 2017), to which is added a special tax for oil and gas companies at the
rate of 55% from 2018 (increased from 54% in 2017), giving a total tax rate of 78%.
Companies operating on the Norwegian Continental Shelf under the offshore tax regime can claim the tax
value of any unused tax losses or other tax credits related to its offshore activities to be paid in cash (including
interest) from the tax authorities when operations cease. Deferred tax assets that are based on offshore tax
losses carried forward are therefore normally recognised in full.

Petrolia NOCO AS
Note 10. Property, plant and equipment
(Amounts in NOK)
Furniture, fixtures
and office machines
Total
2017
Cost:
At 1 January 2017 9,194,946 9,194,946
Additions 112,506 112,506
Disposals 0 0
Cost at 31 December 2017 9,307,452 9,307,452
Depreciation, amortisation and impairment:
At 1 January 2017 8,658,282 8,658,282
Depreciation this year 387,778 387,778
Impairment this year 0 0
Disposals 0 0
Accumulated depreciation, amortisation and impairment at 31 December
2017 9,046,060 9,046,060
Carrying amount at 31 December 2017 261,393 261,393
2016
Cost:
At 1 January 2016 8,983,752 8,983,752
Additions 211,193 211,193
Disposals 0 0
Cost at 31 December 2016 9,194,946 9,194,946
Depreciation, amortisation and impairment:
At 1 January 2016 8,119,746 8,119,746
Depreciation this year 538,536 538,536
Impairment this year 0 0
Disposals 0 0
Accumulated depreciation, amortisation and impairment at 31 December
2016 8,658,282 8,658,282
Carrying amount at 31 December 2016 536,664 536,664
Economic life 3-5 years
Depreciation method linear

Petrolia NOCO AS
Note 11. Prepayments and other receivables
Prepayments and other receivables include:
(Amounts in NOK) 2017 2016
Prepaid expenses 518,287 914,170
VAT receivables 236,380 509,689
Working capital and overcall, joint venture 1,952,857 496,980
Other short term receivables 853,138 853,138
Total 3,560,662 2,773,977
Note 12. Cash and cash equivalents
(Amounts in NOK) 2017 2016
Bank deposits 2,477,357 36,083,697
Total cash and cash equivalents 2,477,357 36,083,697
Of this:
Restricted cash for withheld taxes from employees salaries 1,007,783 962,389
Note 13. Share capital and shareholder information
Movements in share capital
(Amounts in NOK)
Issued at 1 January 2016 322,650 36,136,800
Capital increase in 2016 446,429 50,000,048
End balance at 31 December 2016 769,079 86,136,848
Capital increase in 2017 - -
End balance at 31 December 2017 769,079 86,136,848
Shareholders as of 31 December 2017 Shares Ownership
Petrolia Drilling II AS 222,765 29%
Independent Oil & Resources Plc 188,000 24%
Petrolia SE 161,000 21%
Tot Drilling Ltd 157,808 21%
Larsen Oil & Gas AS 31,760 4%
Other 7,746 1%
Total number of shares 769,079 100%
Number of
shares
Share
capital
The share capital is denominated in NOK, and the nominal value per share as of 31 December 2017 was
NOK 112. All issued shares are of equal rights. No potential shares, such as share options, were issued as
of 31 December 2017.

Note 14. Earnings per share
Amounts in NOK 2017 2016
Profit attributable to ordinary equity holders -13,469,403 -14,839,767
Profit attributable to ordinary equity holders for basic earnings -13,469,403 -14,839,767
Interest on convertible preference shares - -
Profit attributable to ordinary equity holders adjustedfor the effect of dilution -13,469,403 -14,839,767
Number of shares: 2017 2016
Weighted average number of ordinary shares for basic EPS 769,079 545,865
Effects of dilution from:
Share options - -
Convertible preference shares - -
Weighted average number of ordinary shares adjusted for the effect of dilution 769,079 545,865
Note 15. Financial instruments
Financial instruments by category
(Amounts in NOK)
At 31 December 2017
Financial assets
Loans and
receivables
Total
carrying
amount
Other financial assets, deposits 0 0
Receivables, related parties 624,069 624,069
Other receivables 1)
41,803,272 41,803,272
Cash and cash equivalents 2,477,357 2,477,357
Total 44,904,698 44,904,698
Financial liabilities
Amortized
cost
Total
carrying
amount
Borrowings 23,500,000 23,500,000
Trade creditors 1,802,101 1,802,101
Other current liabilities 1)
3,335,025 3,335,025
Total 28,637,126 28,637,126
As Petrolia NOCO AS does not have any share options or convertible preference shares as of 31 December
2017, there are no differences between basic and diluted EPS.
1) Public duties payable and accruals are not included.
1) Prepayments and VAT receivables are not included.
Petrolia NOCO AS
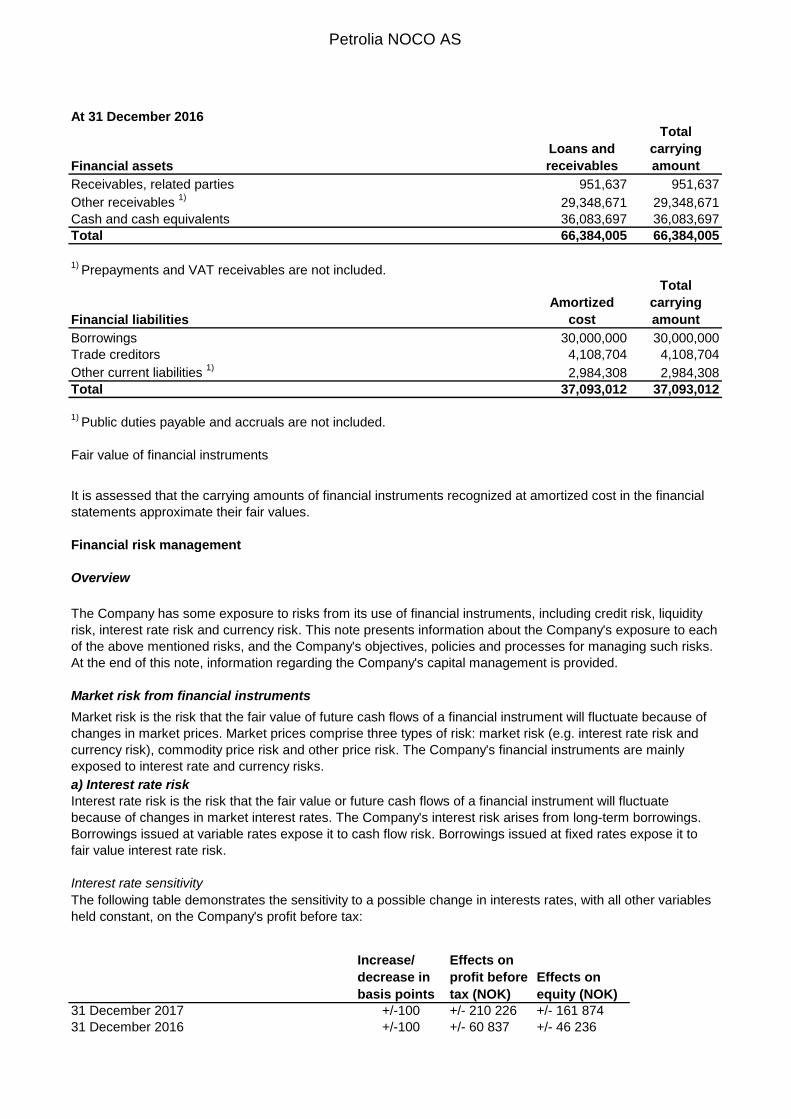
At 31 December 2016
Financial assets
Loans and
receivables
Total
carrying
amount
Receivables, related parties 951,637 951,637
Other receivables 1)
29,348,671 29,348,671
Cash and cash equivalents 36,083,697 36,083,697
Total 66,384,005 66,384,005
1) Prepayments and VAT receivables are not included.
Financial liabilities
Amortized
cost
Total
carrying
amount
Borrowings 30,000,000 30,000,000
Trade creditors 4,108,704 4,108,704
Other current liabilities 1)
2,984,308 2,984,308
Total 37,093,012 37,093,012
Fair value of financial instruments
Financial risk management
Interest rate sensitivity
Increase/
decrease in
basis points
Effects on
profit before
tax (NOK)
Effects on
equity (NOK)
31 December 2017 +/-100 +/- 210 226 +/- 161 874
31 December 2016 +/-100 +/- 60 837 +/- 46 236
1) Public duties payable and accruals are not included.
The following table demonstrates the sensitivity to a possible change in interests rates, with all other variables
held constant, on the Company's profit before tax:
Market risk is the risk that the fair value of future cash flows of a financial instrument will fluctuate because of
changes in market prices. Market prices comprise three types of risk: market risk (e.g. interest rate risk and
currency risk), commodity price risk and other price risk. The Company's financial instruments are mainly
exposed to interest rate and currency risks.
It is assessed that the carrying amounts of financial instruments recognized at amortized cost in the financial
statements approximate their fair values.
The Company has some exposure to risks from its use of financial instruments, including credit risk, liquidity
risk, interest rate risk and currency risk. This note presents information about the Company's exposure to each
of the above mentioned risks, and the Company's objectives, policies and processes for managing such risks.
At the end of this note, information regarding the Company's capital management is provided.
Market risk from financial instruments
a) Interest rate risk
Interest rate risk is the risk that the fair value or future cash flows of a financial instrument will fluctuate
because of changes in market interest rates. The Company's interest risk arises from long-term borrowings.
Borrowings issued at variable rates expose it to cash flow risk. Borrowings issued at fixed rates expose it to
fair value interest rate risk.
Overview

Petrolia NOCO AS
Per 31 December 2017
Less than 3 to 12 1 to 5
(Amounts in NOK) 3 months months years Total
Borrowings, long term - - 23,500,000 23,500,000
Trade creditors and other short term liabilities 2,718,810 2,418,316 - 5,137,126
Total liabilities 2,718,810 2,418,316 23,500,000 28,637,126
Per 31 December 2016
Less than 3 to 12 1 to 5
(Amounts in NOK) 3 months months years Total
Borrowings, long term - - 30,000,000 30,000,000
Trade creditors and other short term liabilities 4,829,086 2,263,925 - 7,093,012
Total liabilities 4,829,086 2,263,925 30,000,000.0 37,093,012
Capital management
Liquidity risk is the risk of being unable to pay financial liabilities as they fall due. The Company’s approach to
managing liquidity risk is to ensure that it will always have sufficient liquidity to meet its financial liabilities as
they fall due, under normal as well as extraordinary circumstances, without incurring unacceptable losses or
risking damage to the Company's reputation. Prudent liquidity risk management implies maintaining sufficient
cash and the availability of appropriate funding.
The following table details the contractual maturities for the Company's financial liabilities. The tables includes
amounts for both principal and interest payments. The contractual amounts were estimated based on closing
exchange rate at balance sheet date.
A key objective in relation to capital management is to ensure that the Company maintains a sufficient capital
structure in order to support its business development and to maintain a strong credit rating. The Company
evaluates its capital structure in light of current and projected cash flows, potential new business opportunities
and the Company's financial commitments. In order to maintain or adjust the capital structure, the Company
may issue new shares or obtain new loans.
Foreign currency risk
b) Foreign currency risk
Foreign currency risk is the risk that the fair value or future cash flows of a financial instrument will fluctuate
because of changes in foreign exchange rates. The Company is primarily exposed to foreign exchange risk
arising from various currency exposures with respect to the USD, EUR and GBP in relation to its debt
obligations as well as from certain commercial transactions.
Credit risk
Liquidity risk
The carrying amounts of financial assets represents the Company's maximum credit exposure. The
counterparty to the cash and cash equivalents and other financial assets are large banks with solid credit
ratings. The Company monitors the credit ratings of its main counterparties on a regular basis.

Petrolia NOCO AS
Note 16. Other current liabilities
(Amounts in NOK) 2017 2016
Public duties payable 1,795,085 1,640,141
Salary and vacation payable 2,399,470 1,984,159
Working capital and undercall, joint venture 935,555 1,000,149
Other accruals for incurred costs 956,200 90,418
Total 6,086,310 4,714,867
Note 17. Related party disclosure
(Amounts in NOK)
a) Purchases from and sales to related parties
Purchase of services, interest on
loan and sales to related parties Description of services 2017 2016
Petrolia NUF 625,622 580,224
Kver AS 1,096,756 1,412,617
Petrolia Drilling II AS 1,888,167 1,185,000
Petrolia SE - 6,006,641
Independent Oil Tools AS 2,277,075 992,683
Larsen Oil & Gas AS 5,820 16,733
Petrolia NUF - 45,854
b) Balances with related parties (trade payables/loan)
Related party Description 2017 2016
Petrolia Drilling II AS 23,500,000 30,000,000
c) Balances with related parties (receivables)
Related party 2017 2016
Independent Oil Tools AS, 624,069 951,637
d) Compensation to key management
NOK thousands
Position
Salary/
Board fee Pension Total 2016
Salary/
Board fee Pension Total 2017
Vidar Bergo Larsen, CEO 2,214,318 157,320 2,371,638 2,073,665 162,252 2,235,917
Robert John Arnott, Chairman (1)
- - - - - -
Tove Kate Larsen, Chairman (1)
- - - - - -
Sjur Storaas, Board member 50,000 - 50,000 100,000 - 100,000
Brede Bjøvad Larsen, Board member - - - - - -
Loans and guarantees related to key management
As at 31 December 2017 there is no agreement of bonus or any other future compensation to the key
management.
The Company has as at 31 December 2017 not issued any loans or guarantees in favour of any employees,
members of the Board or the shareholder.
2016 2017
(1) Tove Kate Larsen was the Chairman of the Board up to 1 February 2018, and was then followed by Robert
John Arnott as the new Chairman.
Sale of consulting services
Interest bearing loan
Receivable, consulting services
Consulting services, purchase
Rent, purchase
Interest on loan
Interest on loan
Sale of consulting services
Sale of consulting services

Petrolia NOCO AS
Note 18. Operating leases
The company has no finance leases.
The lease costs consist of ordinary lease payments and include:
(Amounts in NOK) 2017 2016
Lease office premises, parking and apartment 2,523,576 2,485,861
Lease machinery and office furniture 89,735 92,128
Total lease costs 2,613,311 2,577,989
(Amounts in NOK) 2017 2016
Within 1 year 1,930,396 3,341,953
1 to 5 years 5,701,038 6,219,048
After 5 years 271,543 1,342,121
Total 7,902,976 10,903,122
Note 19. Contingent liabilities
Note 20. Shares in licenses and obligations
Note 21. Events after the balance sheet date
Note 22. IFRS Transition
The transition from NGAAP to IFRS did not result in any transition differences.
The financial statements for fiscal year 2017 are the first annual accounts prepared by Petrolia NOCO AS
in accordance with IFRS. The financial statements for 2016 were prepared in accordance with Norwegian
generally accepted accounting policies (NGAAP).
The company`s obligations for 2018 related to the license portfolio as at year end are estimated to a total of
NOK 47 million. This forecast is based on the approved license budgets.
The company has not been involved in any legal or financial disputes in 2017 where adversely outcome is
considered more likely than remote.
16 January 2018, the Company was awarded four new licences in the 2017 Awards in Predefined Areas
(APA) in Norway:40 per cent of license 933 (as an operator), 30 per cent of license 936, 30 per cent of
license 937, and 30 per cent of license 948.
The company has entered into operating leases for office premises, parking, and apartment and IT
equipment/software.
The future minimum rents related to non-cancellable leases and subleases fall due as follows: