Petroleum source rock potential of the Upper Ordovician ...
87
DEPARTMENT OF THE INTERIOR U.S. GEOLOGICAL SURVEY Petroleum source rock potential of the Upper Ordovician black shale sequence, northern Appalachian basin by Laure G. Wallace and John B. Roen 1 Open-File Report 89-48.8 This report is preliminary and has not been reviewed for conformity with U.S. Geological Survey editorial standards and stratigraphic nomenclature. 1 Reston, Virginia 1989
Transcript of Petroleum source rock potential of the Upper Ordovician ...

DEPARTMENT OF THE INTERIOR
U.S. GEOLOGICAL SURVEY
Petroleum source rock potential of the Upper Ordovician black shale sequence, northern Appalachian basin
by Laure G. Wallace and John B. Roen1
Open-File Report 89-48.8
This report is preliminary and has not been reviewed for conformity with U.S. Geological Survey editorial standards and stratigraphic nomenclature.
1Reston, Virginia
1989

TABLE OF CONTENTS
Page
ABSTRACT .............................................................8
INTRODUCTION .........................................................9
ACKNOWIEDGEMENTS......................................................9
METHODS OF STUDY......................................................9
STRUCTURAL SETTING...................................................12
STRATIGRAPHY.........................................................15
SOURCE ROCK GEOCHEMISTRY.............................................21
THERMAL MATURATION................................................21
GENETIC POTENTIAL.................................................36
QUANTITATIVE RESOURCE EVALUATION.....................................41
SUMMARY.....................................'.........................43
nETERATURE CITED.....................................................45
APPENDICES...........................................................48

FIGURESFigure 1. Generalized outcrop of Middle and Upper Ordovician dark-
gray to black shale in the Appalachian basin
Figure 2. location of wells used in the construction of stratigraphic cross sections, isopach map, structure map, and drilling depth map for this study. Number shown for wells in each state refers to well identification list by state in Appendix 1.
Figure 3. location of cross sections showing stratigraphic framework of the Utica sequence.
Figure 4. Regional correlation chart by Patchen and others (1983) showing Upper Ordovician shale units including the Utica sequence of this paper in the northern and central part of the Appalachian basin. The asterisks denote the approximate portion of the black shales of the Utica sequence as used in this paper.
Figure 5. Structure contour map drawn on the base of the UpperOrdovician Utica sequence. Elevation is in feet, datum is mean sea level. Contours are in feet, contour interval 2,000 feet.
Figure 6. Generalized map showing drilling depth to base of the Upper Ordovician Utica sequence. Contour interval is 2,000 feet.
Figure 7. Isopach map of the Upper Ordovician Utica sequence. Contour interval is 100 feet.
Figure 8. Diagramatic section from Wyandot County in north western Ohio to Page and Rockingham Counties in western central Virginia illustrating the cyclic facies in the Appalachian basin.
Figure 9. Map showing location of samples collected for geochemicalanalysis in New York. Map location designations are listed by state in the sample locality register in Appendix 2.
Figure 10. Map showing location of samples collected for geochemical analysis in Ohio. Map location designations are listed by state in the sample locality register in App)endix 2.
Figure 11. Map showing location of samples collected for geochemical analysis in Pennsylvania. Map location designations are listed by state in the sample locality register in Appendix 2.
Figure 12. Map showing location of samples collected for geochemical analysis in West Virginia. Map location designations are listed by state locality register in Appendix

Figure 13. Schematic pyrogram showing evolution of organic compounds from rock samples during heating. Modified after Peters (1986) .
Figure 14. Isopleth map of the hydrogen index (mg HC/g organic C) on the basal part of the Upper Ordovician Utica sequence. Contour interval is 50 mg HC/g organic C.
Figure 15. Isopleth of the ratio S^Sj on the basal part of the Upper Ordovician Utica sequence.
Figure 16. Isopleth map of Tmax (°C) on the basal part of the UpperOrdovician Utica sequence. Oil window indicated by stippled pattern.
Figure 17. Isopleth map of the production index (PI) measured on the basal part of the Upper Ordovician Utica sequence. Oil window indicated by stipled pattern. Erroneously low values in southcentral Pennsylvania are a result of equipment limitations in measuring Sp when only small amounts of kerogen are available.
Figure 18. Conodont color alteration index (CAI) iscgrads forOrdovician rocks. Modified from Harris and others, 1978; and.Orndorf and others, 1987. Oil window indicated by stippled pattern.
Figure 19. Chart showing the comparison of maturation indices, organic maturation stages, and types of petroleum generation.
Figure 20. Isopleth map of the total organic carbon (TOC) in weight percent for the basal part of the Upper Ordovician Utica sequence. Contour line dashed where approximate.
Figure 21. Hydrocarbons generated, expelled, dispersed, and reservoired (McDowell, 1975).

TABLES
Table 1. - Geochemical parameters describing type of hydrocarbon generated. (Peters, 1986)
Table 2. - Geochemical parameters describing level of thermal maturation. (Peters, 1986)
Table 3. - Analysis of the total organic carbon of 175 samples by state.
Table 4. - Geochemical parameters describing source rock generative potential. (Peters, 1986)
Table 5. - Genetic potential as a function of S1 and Sj. (Tissot and Welte, 1978)

APPENDICES
Appendix 1. -Wells used in the construction of cross sections, isopach, drilling depth and structure maps of the Ordovician shale rich in organic matter.
Appendix 2. -Sample localities in New York, Ohio, Pennsylvania, and West Virginia.
Appendix 3. -Analyses of Ordovician shales rich in organic matter.

ELATES
Plate 1. - Section A-A 1
Plate 2. - Section B-B'
Plate 3. - Section C-C'
Plate 4. - Section D-D 1
Plate 5. - Section E-E'
Plate 6. - Section F-F 1
Plate 7. - Section G-G'

ABSTRACT
In the Appalachian basin, the widespread black shales of Mississippian through Devonian age and of Late Ordovician age are sufficiently rich in organic matter to be hydrocarbon source rocks. The younger Devonian and Mississippian sequence is less deeply buried and better exposed within the basin than the Upper Ordovician sequence. As a result, the Upper Ordovician shales have not been evaluated as extensively for their hydrocarbon potential. An appraisal of the Upper Ordovician black shale sequence has been made for the northern part of the basin west of the Allegheny front in New York, Pennsylvania, Ohio, and West Virginia. The region contains a relatively continuous sequence of dark-gray to grayish-black shale of Late Ordovician age. Within the Upper Ordovician black shales, a sequence was delineated based on its physical properties that were indicative of a potential source rock. This unit, informally defined here as the Utica sequence comprises all or part of the Utica Shale and its correlatives, the Antes Shale, the lower part of the Reedsville Shale, the lower part of the Martinsburg Shale, the Point Pleasant Formation, and the basal part of the undivided Cincinnatian Series.
The thickness of the Utica .sequence ranges from less than 200 feet in western Ohio to more than 600 feet along the Allegheny front in southwestern Pennsylvania. Structure contours indicate that the base of the Utica sequence is about 2,000 feet below sea level in central Ohio and plunges eastward to about 12,000 feet below sea level in central and northeastern Pennsylvania.
Geochemical analyses of 175 samples from the Utica sequence from 104 localities in New York, Ohio, Pennsylvania, and West Virginia.indicate that the sequence has an average total organic carbon content of 1.34 weight percent. Conodont alteration indices and the production index for these rocks indicate the maturation, with respect to hydrocarbon generation, ranges from diagenetic in the shallow western part of the basin to catagenetic in the deep eastern part of the basin. This data is supported by the temperatures of maximum pyrolytic hydrocarbon generation. The 400 to 600 ft. sequence of shale in eastern New York and central and eastern Pennsylvania is in the middle to upper catagenetic stage and is now in the gas window, but probably also produced oil; the 200 to 300 ft. sequence of shale in the western part of New York, Pennsylvania, and West Virginia and the eastern part of Ohio is in the lower catagenetic stage and is now in the oil window.
The genetic potential of the shales in New York, Pennsylvania, and West Virginia where they are deepest, indicates that the potential for further generation of oil from these shales is poor and the potential for further gas generation is fair. However, in Ohio, the potential for further generation oil in the shale is fair to good.

PETROLEUM SOURCE ROCK POTENTIAL OF THE UPPER ORDOVIdAN BIACK SHALE SEQUENCE, NORTHERN APPAIACHIAN BASIN
BY
Laure G. Wallace and John B. Roen
INTRODUCTION
Middle and Upper Ordovician dark-gray to black shales crop out in an east-trending belt across the northern part of New York and in a northeast- southwest trending fold and thrust belt from eastern New York to Alabama, (fig. 1). Elsewhere in the Appalachian basin the dark-gray to black shales of Middle and Late Ordovician age are in the subsurface of Ohio, New York, Pennsylvania, West Virginia, western Virginia and in the subsurface of the overthrust belts in eastern Tennessee and southern Virginia.
Relative to the younger Devonian-Mississippian black shale sequence, which is shallower and somewhat better exposed within the basin, the more deeply buried and more thermally mature Upper and Middle Ordovician shales have not been extensively evaluated for their hydrocarbon potential. The purpose of this report is to determine the distribution, organic richness and hydrocarbon potential of the Upper Ordovician dark-gray to black shales in the northern part of the Appalachian basin. The investigation included establishing a stratigraphic framework of the Upper Ordovician sequence and geochemical analyses of surface and subsurface shale. samples from the sequence to evaluate the hydrocarbon potential. The study area included, part of the states of Ohio, New York, Pennsylvania, and West Virginia.
ACKNOWLEDGEMENTSSupport for this study was provided by the Morgantown Energy Technology
Center of the U.S. Department of Energy under Interagency Agreement #DE A121 83 MC 20422.
We greatly appreciate the geochemical analyses performed by George Claypool of the U.S. Geological Survey. His expert assistance as well as that of Jerry Clayton, also of the U.S. Geological Survey, have been invaluable in the preparation of this paper.
We acknowledge the assistance of Lawrence V. Rickard and Henry Bailey of the New York Geological Survey, John Harper of the Pennsylvania Topographic and Geological Survey, Lawrence H. Wickstrom and Carry Yates of the Ohio Geological Survey, and Douglas G. Patchen and Katherine Lee Avary of the West Virginia Geological Survey.
METHOD OF STUDY
Stratigraphic cross sections, isopach maps, a structure contour map, and a drilling depth map were prepared from lithologic logs supplied by state geological surveys and the Geological Sample Log Company of Pittsburgh, Pa. A total of 147 lithologic logs were used for control points in this study (fig. 2 and appendix 1).
Shale color is an important factor in the study because, as a rule, the

Figure 1. Generalized outcrop of Middle and Upper Ordovician dark- gray to black shale in the Appalachian basin
10

KY
0 50 100 MilesL
\SOUTHERN LIMIT OF/
^ 1 NXSTUDY AREA
TN
NC

Figure 2. Location of wells used in the construction of stratigraphic cross sections, isopach map, structure map, and drilling depth map for this study. Number shown for wells in each state refers to well identification list by state in Appendix 1.
11

t 34
15'
2648 t
t 19
t 27
t 16
t 1
14
.33
Yo
"5A
'42V
21
30,0
'6
1
.53
.9
Vo°,
2
-23
,3
6
"
t59
OH
'6
2
23
13
64.
47 41
16
22
11,
» .1
325 9
31
wv
. 14
\
13
v. V
19
,36
0
50
100
150
\______i_
_____i_
_____;
SC
AL
E
IN
MIL
£S

darker the shale, the greater the total organic carbon (TOC) values. By using the color chart of Goddard and others (1948), we defined the shale to be studied in this report by the following colors: black (Nl), grayish- black (N2), dark-gray (N3), medium-dark-gray (N4), brownish-black (5YR2/1), dusky-brown (SYR 2/2), greenish-black (5GY2/1), and olive-black (5Y2/1).
Seven stratigraphic cross sections (pis. 1-7 and fig. 3) were constructed to show the stratigraphic position and distribution of the Utica sequence across the basin. The Upper Ordovician black shale and related rock sequence was subdivided into three units based on lithology and shale color as defined above. The lithologic units are listed below in ascending order:
1. Limestones and shale units which contain less than of 85%medium-dark-gray to black shale. This unit is in part the Trenton Group or Limestone.
2. Shale units which contain 85% or more medium-dark-gray to black shale. This is the Utica sequence of our paper.
3. Siltstone, sandstone, and shale which contain less than of 85% medium-dark-gray to black shale.
We have informally applied the name Utica sequence to the rock that consists of 85% or more medium-dark-gray to black shale. Although not formally recognized throughout the basin, the name Utica is informally accepted, in part, in all of the states in the study area. Datum for the stratigraphic cross sections is the uppermost limestone of the Ordovician Trenton Group. Locally, such as in eastern New York and elsewhere in West Virginia, the Trenton Limestone grades vertically and laterally with the dark shale sequence and extends 150 feet higher in the section, (fig. 4). In these areas the datum was shifted to where the medium-dark-gray to black shale makes up less than 85% of the interclated sequence (pi. 3 nos. 3, 4, 7, and 35).
175 shale samples from 124 localities (appendix 2) throughout the entire study area were analyzed using a standard pyrolysis method (Rock-Eval). Each sample was also analized for TOC. Samples collected from Ohio and West Virginia were from the subsurface. Samples collected from New York and Pennsylvania were from the surface and subsurface.
STRUCTURAL SETTING
The Appalachian region is divided into four broad regions approximately parallel to the NE - SW axis of the basin. They are the Blue Ridge, Peidmont, Valley and Ridge and Appalachian Plateaus provinces.
The Blue Ridge and Piedmont provinces are composed primarily of metamorphic and igneous rocks. The Valley and Ridge and Appalachian Plateaus provinces are composed almost entirely of Paleozoic sediments.
The Appalachian basin lies in the latter of these two provinces. In the eastern part of the basin, the Valley and Ridge is extensively folded and faulted with crystalline rocks of the Blue Ridge thrust over Paleozoic rocks. The western part of the basin, the Appalachian Plateaus, is an asymetrical foreland fold province dipping gently southward from New York and southeastward from Ohio. It is characterized by low amplitude folding and few faults. '
The basin is approximately 1,000 mi. long and ranges from 75 to 350 mi.
12

Figure 3. Location of cross sections showing stratigraphic framework of the Utica sequence.
13

en O> r- m
m en
rO
01 O
Oo
Lcn O

Figure 4. Regional correlation chart by Patchen and others (1983) showing Upper Ordovician shale units including the Utica sequence of this paper in the northern and central part of the Appalachian basin. The asterisks denote the approximate portion of the black shales of the Utica sequence as used in this paper.
14

NO
RTH
EAST
V
ALL
EY
BA
SIN
-CE
NT
ER
W
V A
ND
R
IDG
E
WV
OR
TH-C
ENTR
AL
OH
EA
ST-C
EN
TR
AL
O
il N
OK
TII-
EAST
OH
SO
UTH
-CEN
TRA
L PA
Cincinnatian
Rlc
hm
ondla
n
May
svil
lian
Eden
lan
Sher
man
lan
Kir
kfi
eld
lan
Rock
landia
n
Jun
lata
Fm
.
Hart
lnsb
urg
Fm
.
* *
* *
* >v
>v A
* A
Tre
nto
n
Ls
.
Junla
ta
Fm.
Osw
ego
Ss
.
Reed
svll
le
Fro*
*
f
^~
~~
^^*
ft
A
^^-"
A
A
Tre
nto
n
Cp
.
Und
l f
f ere
nt
latu
d
shale
s an
d
lim
est
ones
Tre
nto
n
Ls
.
Und
l f f
cre
iu l
/iLt-
il
shale
s un
d Jl
mcs
lon
off
4 *
*
¥ V
V ¥
Tre
nto
n
Ls
.
Qui'p
noio
n
Sh .
Un
dlf
fere
ntl
ate
d
shale
s an
d
lim
est
on
es
Tre
nto
n
Ls
.
.luii
l n
t ii
Fm
Bn
1 d
*z^~
r
KaB
lo
f\v7
~^-
/
Reed
svll
le
Ante
s Sh
*C
o b
ur
ii Fm
.
Sal
ona
Fm.
Nea
lmont
1art
Insh
utj
Fm
.
v v
v v
v
Cham
ber
s-
burg
Fm
.
NO
RTH
EAST
ERN
A
ND
N
OR
THW
ESTE
RN
PA
N
OR
TH-C
ENTR
AL
PA
EAST
ERN
PA
WES
TER
N
AND
WES
T-C
ENTR
AL
NY
EA
ST-C
EN
TR
AL
NY
EAST
ERN
N
Y
Reedsv
llle
Sh
»
Coburn
Fm
. lu
iir*
Sh
.S
nlo
na
Fm.
Osw
ego
Fro.
(B
ald
Eag
le
Reedsv
llle
Fm
.
Neo
lroo
nt
Fro.
Hart
lnsb
urg
Fr
o.
*****-ft*
*
; ft
Tre
nto
n
Cp
.
Que
ens
Ion
Fm.
Lorr
ain
e
Cp
. , 1-.
' U
tlca
Fm.
;< ;,
ft
Tre
nto
n
Cp.
~x
Que
ens
ion
Fin.
V
.
Lorr
ain
e
Cp.
* *
l U
tlca
Fm
. *
* *
Tre
nto
n
Cp.
'rank f
or t^
r -
^-^-^
Fra.
jS
chen
ecte
d:
[Utl
ca
Fm. ^~
y F
m.
'j
"f^
.'
4 ^? S
nake
-^ M
UTT
FaT
ren
ton
Cp
.
Rlc
hmon
dlan
May
svil
lian
Sher
man
lan
Kir
kfl
eld
lan
Ro
ckla
nd
l an
inclnnat
u
* D
enot
e*
appro
xim
ate
posi
tion
of
the
Utl
ca
sequ
ence
N
o ih
lcknena
Impli
ed.
Unit
p
red
om
inate
ly bla
ck
shale
>*
Cra
datl
onal
conta
ct
C
onfo
rmab
le
co
nta
ct
""
Co
nfo
rmab
le
conta
ct.
, n%
p uncert
ain
^
On
con
forn
il ly
Un
co-n
forr
oll
y,
lim
e tr
ansgre
sslv
e
(Pst
ch
en
an
d o
thers
, 1
98
3)

in width. The volume of Paleozoic rocks present today is approximately 510,000 to 525,000 cubic miles (Colton, 1961; de Witt, personal comm., 1988).
The structure map drawn on the base of the organic-rich Utica sequence (fig. 5) shows a dip in the basin from 2,000 ft. below sea level in central Ohio to 12,000 ft below sea level in central and northeastern Pennsylvania.
The structure contour map on the base of the Upper Ordovician dark- gray to black shale sequence was combined with generalized surface elevation (Diment and Urban, 1981) to produce a drilling depth map to the base of the shale.
The drilling depth to reach the base of the Utica sequence ranges from 2,000 ft. in western Ohio and northern New York to more than 14,000 ft. in central Pennsylvania and northeastern West Virginia (fig. 6).
STRATIGRAPHY
In the northern part of the central Appalachian basin, the extensive Upper Ordovician black marine shale, rich in organic matter is designated here as the Utica sequence. This sequence in various parts of the basin consists of the Upper Ordovician Utica Shale (Emmons, 1842; Kay, 1937), the Antes Shale (Kay, 1944a, 1944b) the lower part of the Reedsville Shale (Ulrich, 1911; Kay 1944a, 1944b), the lower part of the Martinsburg Shale (Keith, 1894), the Point Pleasant Formation (Newberry, 1873: Weiss and Norman, 1960), and the basal part of the undivided Cincinnatian Series (Meek and Worthen, 1865). Because of interfingering with older rock sequences, the sequence may locally include some black shale from older stratigraphic units. The blanket-like Utica sequence is about one foot thick in western Ohio and thickens eastward to more than 700 .feet in parts of Pennsylvania and adjacent West Virginia (fig. 7). The black marine shales of the Utica lie stratigraphically above the northern and central part of the extensive Middle Ordovician carbonate sequence from Tennessee to New York. The Trenton Limestone or Trenton Group is the most commonly identified carbonate unit beneath the Utica sequence in this part of the basin, (fig 4).
Correlation of stratigraphic units within the Utica sequence, presently accepted by state geological surveys for specific areas in the states of the central Appalachians, is from the American Association of Petroleum Geologists' GOSUNA. - Northern Applachian Region Chart (Patchen and others, 1983). The chart emphasizes the age relationship between the various stratigraphic units of the organic-rich Utica sequence and contiguous strata (fig. 4).
The Ordovician Utica Shale as described by G.M. Kay (1937), for exposures at Utica, Oneida Co., New York is dark-gray to black shale rich in organic matter which has been correlated westward across the Appalachian basin to western Ohio and southward to central West Virginia.
In New York, the Utica Shale overlies limestones of the Trenton Group and underlies the Lorraine Shale (pi. 7; pi. 1). From a black, slightly silty shale about 200 ft thick in the western part of the state, the Utica Shale thickens eastward with an increasing amount of clastic materials to grade laterally into the silty gray shales of the Snake Hill Formation (Ulrich, 1911: Kay, 1937) in the Hudson River Valley of eastern New York. Although most of the Upper Ordovician black shale lies in the Utica Shale
15

Figure 5. Structure contour map drawn on the base of the UpperOrdovician Utica sequence. Elevation is in feet, datum is mean sea level. Contours are in feet, contour interval 2,000 feet.
16

\
a

Figure 6. Generalized map showing drilling depth to base of the Upper Ordovician Utica sequence. Contour interval is 2,000 feet.
17

r O
o >J- m
z
2r~ m
O o
L 01 O
/7 a.

Figure 7. Isopach map of the Upper Ordovician Utica sequence. Contour interval is 100 feet.
18

7
rO
o> r- m
2
^| m
O O
o

above limestones of the Trenton Group or its equivalents, in parts of south- central New York, it locally intertongues with limestones in the upper part of the Trenton Group (Vanuxem, 1838) (pi. 3).
In Pennsylvania, the Utica Shale is formally recognized in the subsurface of the northeastern and north-central part of the state. The Utica Shale becomes more calcareous toward central Pennsylvania, where it grades into the calcareous black shale of the Antes Shale or into the limestone and intercalated black shales of the Coburn and Salona Formations (Kay, 1944b; Field, 1919) and may rest upon the Nealmont Limestone in the lower part of the Trenton Group (Weed, 1982). West of the Allegheny front in western and southwestern Pennsylvania, the Utica Shale or its equivalents are overlain by the lighter gray shales of the Reedsville Shale (pi. 1).
Eastward across the Valley and Ridge Province of Pennsylvania, the Antes Shale and Reedsville Shale grade into the siltier shales of the Martinsburg Formation. There, the Antes is locally recognized as the basal unit of the Martinsburg.
The West Virginia Geological Survey does not feel that there is adequate subsurface control in West Virginia to permit subdivision of the Martinsburg Formation or the equivalent Reedsville Shale. However, the name Utica Shale is informally recognized as the basal part of the Reedsville Shale in the western part of the .state and the basal part of the Martinsburg -in the eastern part of the state. It overlies limestones of the Trenton Group.
The Utica Shale is a recognized unit by the Ohio Geological Survey in the northwestern and northeastern parts of Ohio. Throughout the rest of Ohio, the Utica is incorporated in the basal part of the undifferentiated Cincinnatian Series (pi. 1). The black shale facies of the Utica sequence grades southwestward and feathers out in the lighter gray shales of the lower part of the undifferentiated Cincinnatian Series of south-central Ohio (pi. 3). In much of Ohio the Utica Shale and its equivalents overlie the Trenton Limestone or its local equivalent, the Point Pleasant Formation. The Point Pleasant Formation grades from limestone in the basal part to dark shale rich in organic matter in the upper part. Consequently, rocks in the upper part of the Point Pleasant Formation have been included in our assessment of Ordovician shales rich in organic matter. Rocks of the Point Pleasant Formation in Ohio were originally referred to as the Cynthiana Member of the Lexington Limestone of Kentucky (Campbell, 1898). However, Wickstrom and others (in press) recommend abandoning the name Cynthiana Member in Ohio. We have not subdivided the Point Pleasant on the cross sections; it is included locally as part of the Utica sequence of this report or Cincinnatian undivided.
In summary, the northern part of the Appalachian basin's extensive Upper Ordovician Utica sequence is composed of the Utica Shale and correlatives units, the Antes Shale, the basal Reedsville Shale, the lower part of the Martinsburg Formation, the Point Pleasant Formation and the basal part of the undifferentiated Cincinnatian Series. In the study area, this sequence of black shale lies stratigraphically above a Middle Ordovician carbonate unit identified as the Trenton Limestone and correlative units. The stratigraphic position of the Ordovician black shale sequence relative to the enclosing rocks is shown in a generalized section that illustrates the cyclic nature of the basin fill (Fig. 8).
19

Figure 8. Diagramatic section from Wyandot County in north western Ohio to Page and JtocfcLngham Counties in western central Virginia illustrating the cyclic facies in the Appalachian basin.
20

WY
AN
DO
T C
O.
OH
PA
GE
& R
OC
KIN
GH
AM
CO
. V
A
PE
NN
SY
LVA
NIA
N -
PE
RM
IAN
CLA
ST
ICS
DE
VO
NIA
N -
MIS
SIS
SIP
PI
CLA
ST
ICS
DE
VO
NIA
N B
LAC
K S
HA
LES
_________________
__
:: S
ILU
RIA
N -
DE
VO
NIA
N C
AR
BO
NA
TE
S^
^K
&rim
Z
OR
DO
VIC
IAN
' - S
ILU
RIA
N C
LAS
TIC
S
BBfc
siffl
Bisa
*!^^
O
RP
QV
ICIA
N B
LAC
K S
HA
LES
B
CA
RB
ON
AT
ES
GD
C
LAS
TIC
S
BLA
CK
SH
ALE
S
CA
MB
RIA
N -
OR
DO
VIC
IAN
CA
RB
ON
AT
ES
CA
MB
RIA
N C
LAS
TIC
S

SOURCE ROCK GEXXHEMISTKY
In order to assess the petroleum potential of the Ordovician Utica sequence, we needed to evaluate the petroleum-generative potential and the thermal maturity of the Upper Ordovician dark-gray to black shale sequence.
Samples were collected from 104 subsurface and surface localities throughout the study area (appendix 2). The samples collected for source rock geochemistry are distributed as follows: 40 samples in New"York (Fig. 9), 37 samples in Ohio (Fig. 10), 19 samples in Pennsylvania (Fig. 11) and 8 samples in West Virginia (Fig. 12). The smaller number of samples collected in Pennsylvania and West Virginia indicate the sparsity of drilling to the appropriate depth in these areas. Where possible samples were collected from the basal and upper part of the Utica sequence.
Rock-Eval analysis was completed on all of the samples and resulted in a regional analysis of the thermal maturation and the genetic potential of the Ordovician Utica sequence. Figure 13 illustrates the pyrolytic evolution resulting from the Rock-Eval analysis. S1 is the mg of existing hydrocarbons (HC) present per gm of rock sample, Sj is the mg of HC generated by kerogen pyrolgsis per gm of rock sample, and Sj is the oxygen- containing compounds (C 0^) generated by the Rock-Eval kerogen pyrolysis. T max is the temperature (°C) of maximum HC generation. These parameters were then used to qualify the source rock potential of .the Utica sequence, and to quantitatively appraise its generative capacity. The analytical Rock-Eval data and the evaluating indices are listed in appendix 3.
THERMAL MATURATION
Four* parameters derived from the Rock-EvaJ. analysis can give a general indication of whether a source rock is matured to the point of being hydrocarbon productive.
The first of these parameters is the hydrogen index (HI). The HI is the quantity of pyrolyzable organic compounds or hydrocarbons as expressed by the formula HI = (Sj/TOC) x 100, where Sj is the hydrocarbon released in mg/gm of rock during pyrolysis and TOC is the weight percent of total organic carbon content of the rock.
The second parameter is expressed as the ratio Sj/Sj where Sj represents in mg/g of rock the C Og released by pyrolysis.
It should be noted that the Sj value can be appreciably modified by the introduction of oxygen from a source other than organic matter. One of the main sources for additional oxygen is chemical weathering.
Peters (1986) indicates that the HI and the ratio Sj/Sj are parameters that can give a general indication of whether a source rock has generated oil, oil and gas, or gas. The parameters of Peters (1986) are presented in table 1 of this report.
Using these guidelines, Sj/Sj ratio and the HI isopleths indicate that the Utica sequence in western and central Ohio shows a tendency toward generating oils whereas in the eastern, more deeply buried section of the basin in Pennsylvania, northern West Virginia, and New York the tendency is toward generating gas (fig. 14 and 15).
The third parameter used as a general indicator of thermal maturity in this study was Tmax, the temperature of maximum hydrocarbon release, or the
21

Figure 9. Map showing location of samples collected for geochemicalanalysis in New York. Map location designations are listed by state in the sanple locality register in Appendix 2.
22

/-/ r
o £c cp_o ~ t
o
IZI*!
S
00
z H: «-j zHj
zKiOJ
z*iON
\
ZH{
>
ZH{Cn
</7
zHi
ON
to
Z
3to
toON
to
Z fo
Z-

Figure 10. Map showing location of samples collected for geochemical analysis in Ohio. Map location designations are listed by state in the sample locality register in Appendix 2.
23

015
010
025
032
024O
ilii
027
01
03
017
OH
08
037
036
030
021
023
033.04
n-
019 \
\ 09
9
f
014
02
6 029
016
012
07 02 8.
06
i
013 .
031
05 018
<s
034
^
r1
035
. t
' >
020
/^/j
<

Figure 11. Map showing location of samples collected for geochemical analysis in Pennsylvania. Map location designations are listed by state in the sample locality register in Appendix 2.
24

r
X
CO1-1&4
«s1 &4
XX
0«
O\
\OPL,
P^
Oi t
<D 3
^ O
\
C-- "^~v
X
d.

Figure 12. Map showing location of samples collected for geochemical analysis in West Virginia. Map location designations are listed by state in the sample locality register in Appendix 2.
25

/
/
f I
K<
''
I ' CA
fl
AM
%
\.
^
\

Figure 13. Schematic pyrogram showing evolution of organic conpounds from rock samples during heating. Modified after Peters (1986).
26

£CO
OT
O)
£
oven t etnp
max
temp in °C over time >

Table 1. Geochemical Parameters Describing Type of Hydrocarbon Generated (Peters, 1986)
5(mgHC/g C)*
Gas 0-150 0-3 -
Gas and Oil 150-300 3-5
Oil 300+ 5+
*Assumes a level of thermal maturation equivalent to 1^ = 0.6%
27

Figure 14. Isopleth map of the hydrogen index (mg HC/g organic C) on the basal part of the Upper Ordovician Utica sequence. Contour interval is 50 mg HC/g organic C.
28

EX
PLA
NA
TIO
N
OH
P
ron
e
Gas
Pro
ne
so
Isople
th
of
Hyd
rog
en
Ind
ex
50
1
00
1
50
__
_i
__
__
.|_
jS
cale
in
M
iles

Figure 15. Isopleth map of the ratio B2/B^ on the basal part of the Upper Ordovician Utica sequence.
29

EX
PLA
NA
TIO
N
Oil
Pro
ne
Gas
Pro
ne
Isople
th
of
S2
/S3
ra
tio
50 1°°
1^°
Sca
le
in M
iles
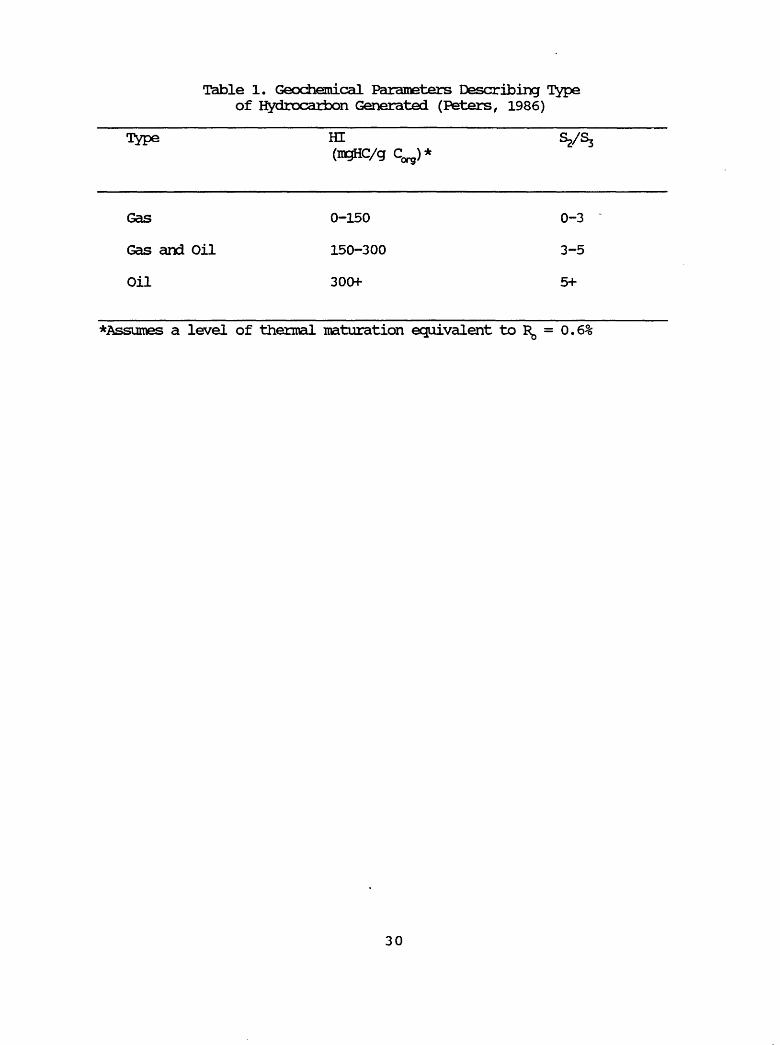
Table 1. Geochemical Parameters Describing Type of Hydrocarbon Generated (Peters, 1986)
Type HI S2/B3(mgHC/g C)*
Gas 0-150 0-3
Gas and Oil 150-300 3-5
Oil 300+ 5+
*Assumes a level of thermal maturation equivalent to RD = 0.6%
30

temperature at 82 (fig. 16 and table 2).There are many problems associated with the use of Tmax for definitive
determinations of maturation level. One limiting factor is that Tmax values are unreliable where Sj values are less than 0.2 mg HC/g of rock (Peters, 1986). In addition, as suggested in table 2, the type of organic matter also affects the Tmax value. In general, the value of Tmax for gas-prone organic matter is relatively less than the Tmax for oil-prone organic matter (Tissot and Welte, 1978).
An isopleth map of the Tmax, where Sj (greater than 0.2 mg HC/g of rock) suggests reliable Tmax values, indicates a basic trend toward more mature rocks in the eastern part of the basin. It suggests however, that an oil window (defined by temperatures from approximately 440°C to 470°C) extends farther east into northwest Pennsylvania and western New York than either the HI or Sj/Sj ratio isopleth maps suggest.
The transformation ratio or production index (PI), the fourth parameter, is the ratio of the amount of petroleum already generated by the kerogen to the total amount of petroleum which the kerogen is capable of generating. The PI or transformation ratio as defined by PI = S^ (S1 + S?), measures the extent to which the genetic potential has been realized (Tissot and Welte, 1978) (appendix 3).
Table 2 reproduced from Peters (1986) indicates a PI of 0.1, in general, represents the transition from immature to mature with respect to oil generation. The isopleth map of the production index (fig. 17) based on samples from the basal part of the Utica sequence supports the increasing level of thermal maturation of Ordovician rocks from west to east across the Appalachian basin. These data also agree with published PI trends in Ohio (Cole and others, 1987).
In southcentral Pennsylvania, PI values sfcow a marked decrease. Rather than indicating a thermally less mature area, these values define a region which is thermally too mature for hydrocarbon production. Equipment limitations in determining 82 values when only small amounts of kerogen are available has the effect of lowering the PI and falsely indicating a less mature area.
In addition to parameters defined by Rock-Eval analysis, conodont color alteration indices (CAI) can be used as a general indicator of thermal maturity.
Harris and others (1978), and Omdorff and others (1987) have shown that conodont color can be a valuable tool for deterrrdning maturation because color alteration in conodonts is a result of the depth and duration of burial and the geothermal gradient. Figure 18, showing the conodont color index CAI values across the study area, correlates well with the maturation trend shown by the PI distribution map (Fig. 17).
CAI values from Harris and others (1978) range from 1.5 in central Ohio and westernmost New York, to 4 or 5 in eastern West Virginia, central Pennsylvania and eastern New York (fig. 18). Harris and others (1978) plotted known production of oil and gas against the CAI for Ordovician rocks in the Appalachian basin. They showed that Ordovician oil fields are located in areas having CAI values less than 2, whereas Ordovician gas fields are located in areas having CAI values above 2. CAI values between 4 and 4.5 mark the upper limit for thermally generated dry gas (Harris and others, 1978).
31

Figure 16. Isopleth map of Tmax (°C) on the basal part of the UpperOrdovician Utica sequence. Oil window indicated by stippled pattern.
32

>
EX
PL
AN
AT
ION
OH
W
indow
Isople
th
of
Tm
ax
on
the
Basa
l U
tlca
Sequence
05
0
I100
i15
0 iS
ca
le
\r\
Mile
s

Table 2. Geochemical Parameters Describing Level of Thermal Maturation (Peters, 1986)
Maturation PI Tmax
Top oil window -0.1 -435-445* (birthline)
Bottom oil -0.4 -470 window (deadline)
*Many maturation parameters (particularly Tmax) depend on the type of organic matter.
33

Figure 16. Isopleth map of Tmax (°C) on the basal part of the UpperOrdovician Utica sequence. Oil window indicated by stippled pattern.
34

-IV ?>

Figure 18. Conodont color alteration index (CAI) isograds forOrdovician rocks. Modified from Harris and others, 1978; and Orndorf and others, 1987. Oil window indicated by stippled pattern.
35

r-0
L0 m

West of the Allegheny front, the maturation level ranges from the diagenetic stage to the catagenetic stage (fig. 19). The thickest part of the Utica sequence located in eastern New York and central Pennsylvania, is in the middle to upper catagenetic stage of maturation as defined by CAI values between 3 and 5. Ihis sequence, according to CAI values, is now within the gas window. The thinner part of the Utica sequence located in the western part of New York, Pennsylvania, and West Virginia and the eastern part of Ohio is in the lower catagenetic stage of maturation and is within the oil window.
There is an obvious discrepancy in the interpretation of the eastward boundary of the oil window among the four parameters, HI, S^Sj Tmax, and PI. Those analytical factors that affect these results and show a difference, or an overlap of divergent data, are beyond the scope of this paper. There is, however, agreement among geochemists that these parameters generated from pyrolitic data should be used as a generalized predictive model.
GENETIC POTENTIAL
Once the levels of maturation for the Utica sequence were established, the next step was to assess the present potential for production of hydrocarbons. Two parameters were used to assess the genetic potential, TOG and (S1 + 83).
The 175 samples collected from the Utica sequence were evaluated for their TOG content (appendix 3). Table 3 summarizes the total organic carbon content values of the 175 samples by state.
Peters (1986) has defined source rock quality in terms of TOG (table 4). Ronov (1958), Tissot and Welte, (1978), and Peters (1986) agree that one percent organic carbon is sufficient to define a shale source rock.
An isopleth map of the TOG values of the shale in the basal part of the Utica sequence is shown in figure 20. The TOG isopleth map shows an increase in TOG on the basal Utica sequence from central Ohio eastward to central Pennsylvania and an increase from northern New York southward to Pennsylvania.
The average TOC value for the entire Utica sequence is 1.34 percent. Based on this average value, Peters (1986) would consider the Utica sequence to have good source rock potential (table 4). Because the high density of low TOC values in Ohio and New York relative to Pennsylvania and West Virginia, the average TOC value may be skewed and not totally representative. The average for the sequence is probably greater than 1.34 percent.
Decreasing values of TOC in the easternmost part of the basin do not represent a lessening of the organic content of the shales, but reflect residual TOC in overly mature parts of the Utica sequence.
TOC values determined from well cuttings can be appreciably decreased if the sample is diluted by rock fragments with a low organic carbon content. When analyzing powdered samples it is not always possible to detect the presence of other rock types. The weathered condition of surface samples can also produce lower 'TOC values.
S1 and 82 values according to Peters' (1986) and Tissot and Welte (1978),
36

Figure 19. Chart showing the comparison of maturation indices, organic maturation stages, and types of petroleum generation.
37

IWURATION INDICES
COAL RANK
PEAT
N
T
RI%
B
U M
N 0 U S
fcfG H
^ 0
M V
C
B
A]J 1_
LOW VOL.
1H R A C
E
CD ^e*"~
t_>
SD
55
60708n
90
R.%
.2
.3
,4
.5,6,7,8.9i.n
1.5
2.0
3.0
CAI
1
1.5
2
3
4
o
TF
150
250 275
100
TAI
/
\ /
/
\ /
\ /
I
\
\
/
\
I
/
\
5
/ \
/
ORGAN MATURA STAGE
^
S
S
1 £
1CriONs
DIAGENESIS
GOGO LU'!'
GOLU GO LU
LU
S
PETROLEUfl GENERATED
TYPE I & II
BIOGENIC GAS
EARLY DRY GAS
WET GAS
OIL
CONDENSATE/ WET GAS
DRY GAS
TYPE III
DRY GAS'
WITH SUBORDINATE AW(TS
OF OIL
ou
Table 3. Total Organic Carbon in weight percent of 175 sanples from the Utica sequence.
NEW YORK
Subsurface well databasal Uticaupper Uticatotal Utica
Surface dataUtica
Combined surface andsubsurface data,
Utica
OHIOSubsurface well data
basal Utica upper Utica total Utica
PENNSYLVANIASubsurface well data
basal Utica upper Utica total Utica
Surface samplesUtica
Combined surface andsubsurface data,
Utica
WEST VIRGINIASubsurface well data
basal Utica upper Utica total Utica
27 samples 19 samples 46 samples
13 samples
59 samples
36 samples5 samples
41 samples
14 samples 17 samples 31 samples
7 samples
38 samples
8 samples6 samples
14 samples
average TOC average TOC average TOC
- 1.18%- 0.77%- 1.01%
average TOC - 1.37
average TOC - 1.09%
average TOC - 1.49% average TOC - 1.22% average TOC - 1.46%
average TOC - 2.17% average TOC - 1.38% average TOC - 1.74%
average TOC - 1.45%
average TOC - 1.68%
average TOC - 1.52% average TOC - 0.81% average TOC - 1.22%
38

Figure 20. Isopleth map of the total organic carbon (TOC) in weight percent for the basal part of the Upper Ordovician Utica sequence. Contour line dashed where approximate.
39

J
0)o
m
z
mCO
r O
CJl O
ho o
Loi O
S3

Table 4. Geochemical Parameters Describing Source Rock Generative Potential. Modified from Peters (1986).
Quality
PoorFairGoodVery good
TOC(wt.%)
<0.50.5-11-22+
S^Sj*
0-0.50.5-11-22+
0-2.5- 2.5-5
5-1010+
*S1 = 1 mg HC/g rock; 82 = 1115 HC/g rock
40

can also be used to evaluate the genetic potential of the rock (see tables 4 and 5 of this report). As previously mentioned, the genetic potential is the amount of petroleum which the kerogen in a given sample is capable of generating. In other words, the genetic potential refers to the potential of the given sample to produce hydrocarbons under conditions of burial heating over geologic time. The values listed in appendix 3 as compared to the criteria of Peters for S1 and Sj in table 4 and compared to the criteria of Tissot and Welte for (S-j+sy in table 5 indicate a poor genetic potential for future oil production and some potential for gas production in New York, Pennsylvania and West Virginia. About one half of the samples from Ohio, however, show fair to good potential as a moderate source rock. These data, in conjunction with the TOG data indicate that the Utica sequence is presently depleted in hydrogen at the New York, Pennsylvania, and West Virginia localities. About one half of the samples from Ohio shows hydrogen depletion. Hydrogen depletion may be caused by high levels of thermal maturation or by oxidation of the samples.
For thermally postmature samples, poor genetic potential does not preclude the possibility that the unit has produced oil in the past and that this oil could have migrated to cooler reservoirs and could have been preserved. Poor genetic potential only indicates that the unit no longer has significant potential for the generation of hydrocarbons.
QUANTITATIVE RESOURCE EVALUATION
To determine the possible quantity of hydrocarbons that the Utica sequence might have generated, the following volumetric formula was used:
QP = V x D x TOG x C x %Rwhere Op is the possible quantity of hydrocarbons trapped in unspecified reservoirs, V is the volume of rock, D is the rock density, TOG is the organic richness, C is the hydrocarbon conversion ratio, and %R is the percent of those hydrocarbons reservoired.
The volume of rock from which hydrocarbons could have been generated is defined by the thickness and areal extent of the Utica sequence within the limits of CAI 1.5 and 4. These CAI values correspond to the middle of the catagenic stage and the beginning of the metagenic stage respectively (fig. 19) and correspond to areas of oil and gas production from Ordovician reservoirs.
We chose CAI values as our maturation indicies even though we realized the limitations of this method for CAI values of less than 1.5. A CAI value of 1.5 lies well within the oil generation window, but CAI values below 1.5 can not be measured. Although a certain quantity of potentially oil productive shale has been eliminated from this evaluation by using CAI values as our maturation indicies, we feel that this quantity is relatively small. A large portion of the shale to the west of the CAI 1.5 isopleth had a PI of less than 0.1 and is therefore just marginally mature.
The volume of rock in the Utica sequence between the CAI of 1.5 and 4 was calculated in cubic meters and converted to metric tons assuming an average shale density of 2.65 x 10³ kg/m3 . Next, the weight of organic matter in the Utica sequence was computed by multiplying the weight of the rock in metric tons (4.5879 x 10¹³MT), by the average weight percent organic carbon in the rock sequence, 1.34%.
41

Table 5. Genetic Potential as a Function of S1 and Sj (Tissot and Welte, 1978)
S1 + Sj = Genetic Potential
<2 kg/Mr* - no oil source rock, potential for gas 2-6 kg/Mr - moderate source rock
6 kg/Mr - good source rock
* 1 kg/Ml = 1 mg/g
42

daypool and others (1978), in evaluating of the hydrocarbon potential of the black shales of the Fhosphoria Formation in the western U.S. determined that 20% was an optimistic value for the percentage of organic carbon that was converted to hydrocarbons. For Type I kercgen like the Green River Shales with high HC/TOC, the conversion values reach about 15%, and 10% is a typical value for Type II and III kerogens (Jerry Clayton, USGS, personal comm., 1988). Since we have no data for Ordovician shale samples in the Appalachian basin, we chose to use a minimal value of 10%. The calculated volume of hydrocarbons generated from the Utica sequence was then adjusted to find a potentially trapped amount in unspecified reservoirs.
McDowell (1975), suggested that 10% of the total hydrocarbons generated in a basin may be recoverable but that 3% is a more probable value. McDowell shows that 0 to 50% of the total oil generated (Q), may be expelled from the source rock (a) (fig. 21). Of the total amount of oil expelled from the source rock, 50% may be trapped in reservoirs (Q^) . Therefore, 25% or less of the total oil generated (Q) may be reservoired. The remaining amount of oil has either been dispersed or lost.
For this study we conservatively estimated the amount of oil trapped in reservoirs to be only 3% of the total amount of hydrocarbons generated from the Utica sequence. We do not geologically define any specific reservoirs as to size, location, and physical characteristics. Therefore, we do not suggest that any quantity of the proposed hydrocarbon generated and reservoired is known to be in place and recoverable.
If we use a TOC content of 1.34%, which is our computed average, a hydrocarbon conversion factor (C) of 10% which is one half of Claypool and others (1978) average for the Riosphoria black shale, and a percent reservoired (%R) amount of 3% as suggested by McDowell (1975), the Upper Ordovician dark-gray to black shale may have generated and reservoired 13.26 billion barrels of oil or its equivalent in gas.
SUMMARY
In summary, the Ordovician black shale in the northern part of the Appalachian basin covers a wide area in New York, Pennsylvania, West Virginia, and Ohio. It is 200 ft. thick in Ohio where it is 2,000 ft. below sea level and plunges to 12,000 feet below sea level in Pennsylvania where it reaches a thickness of 600 ft. The shales have undergone a considerable range in maturation from the diagenetic state in the west to the catagenetic stage in the east. Rock-Eval and TOC results indicate a sequence which could have generated considerable hydrocarbons in the past but presently show only a slight generative potential for gas in the deep eastern part of the basin and only moderate potential for oil in the shallow western part of the basin.
Assuming that these rocks produced hydrocarbons which have migrated, and using a TOC content average of 1.34%, a hydrocarbon conversion ratio (C) of 10%, and a percent reservoired (%R) of 3%, the Upper Ordovician sequence could have generated and reservoired 13.26 billion barrels of oil or equivalent.
43

Figure 21. Hydrocarbons generated, expelled, dispersed, and reservoired (McDowell, 1975).
44

QRes
ervo
ired
QE =
0 to
50%+ of Q
QL
- 0
to 10
% of QE
QR »
0 to 50%
of QE
QR
« 0
to 25
%+ of Q
Qlos
QDis
pers
ed
^Exp
elle
d
Sou
rce
Roc
k Q
=to
tal
oil
g
ener
ated
Literature Cited
Campbell, M. R., 1898, Richmond [Quadrangle] Kentucky, folio 46 ofGeologic atlas of the United States: U.S. Geological Survey.
Claypool, G. E., love, A. H., Maughan, E. K., 1978, Organic geochemistry,incipient metamorphism and oil generation in black shale members ofPhosphoria Formation, western interior United States: AmericanAssociation of Petroleum Geologists, v. 62, no. 1, p. 98-120.
Cole, G. A., Drozd, R. J., Sedivy, R. A., and Halpern, H. I., 1987,Organic geochemistry and oil-source correlations, Paleozoic of Ohio:American Association of Petroleum Geologists, v. 71, no. 7, p. 788-809.
Colton, G. W., 1961, Geologic summary of the Appalachian basin, withreference to subsurface disposal of radioactive waste solutions:U.S. Geological Survey Report TEI-791.
Diment, W. H., and Urban, T. C., 1981, Average Elevation Map of theConterminous United States (Gilluly averaging method): U.S.Geological Survey Geophysical Investigations Map GP933.
Emmons, Ebenezor, 1842, Geology of New York, part 2, Survey of the secondgeological district: New York, W. & A., White and J. Visscher.
Fettke, C. R., 1961, Well-sample descriptions in northwestern andadjacent states: Pennsylvania Topographic and Geologic SurveyMineral Resource Report M 40, 691 p., 4 pis.
Field, R. M., 1919, The Middle Ordovician of central and south centralPennysylvania: American Journal of Science, 4th series, v. 48, no.288, p. 403.-428.
Goddard, E. N., and others, 1948, Rock Color Chart: National ResearchCouncil, Washington, D.C., 6 p. (Republished by the GeologicalSociety of America, 1951).
Harris, A. G., Harris, L. D., and Epstien J. B. and others, 1978, Oil andgas data from Paleozoic rocks in the Appalachian basin, Maps forassessing hydrocarbon potential and thermal maturity (Conodont coloralteration isograds and overburden isopachs): U.S. Geological SurveyMiscellaneous Investigation Series, Map I-917-E.
Kay, G. M., 1937, Stratigraphy of the Trenton Group: Geological Societyof America Bulletin, v. 48, no. 2, p. 233-302.
Kay, G. M., 1944a, Middle Ordovician of central Pennsylvania: Journal ofGeology, v. 52, no. 1, p. 1-23.
Kay, G. M., 1944b, Middle Ordovican of central Pennsylvania: Journal ofGeology, v. 52, no. 2., p. 97-116.
Keith, Arthur, 1894, Harpers Ferry [Quadrangle], Virginia, Maryland, WestVirginia, folio 10 of Geologic atlas of the United States: U.S.Geological Survey.
Meek F. B., and Wbrthen, A. H., 1865, Descriptions of new species ofCrinoidea, &c, from the Paleozoic rocks of Illinois and someadjoining states: Academy of Natural Sciences of Philadelphia,Proceedings, p. 155.
McDowell, A. N., 1975, What are the problems in estimating the oil
45

potential of a basin?: Oil and Gas Journal, June 9, 1975, p. 85-90.
Newberry, J. S., 1873, Ohio Geological Survey Report, v. 1, part 1Geology, p. 89, 119-121.
Orndorf, R. J., Harris, A. G., Schultz, A. P., 1987, Re-evaluation ofConodont Alteration Index - Eastern Tennessee: U.S. GeologicalSurvey Bulletin, in press.
Patchen, D. G., Avary, K. L., and Erwin, R. B., 1983, Correlation ofStratigraphic Units in North America - Northern Appalachian RegionCorrelation Chart: American Association of Petroleum Geologists.
Peters, K. E., 1986, Guidelines for Evaluating Petroleum Source RockUsing Programmed I^rolysis: American Association of PetroleumGeologists Bulletin, v. 70, no. 3, p. 318-329.
Ronov, A. B., 1958, Organic Carbon in Sedimentary Rocks, (in relation tothe presence of petroleum): Geochemistry, no. 5, p. 497-509.
Tissot, B. P., and Welte, D. H., 1978, Petroleum Formation andOccurrence: New York, Springer-Verlag 538 p.
Ulrich, E. O., 1911, Revision of the Paleozoic systems: GeologicalSociety of America Bulletin, v. 22, p. 281-680.
Vanuxem, Lardner, 1838, Second annual report of the geological survey ofthe third district of the state of New York: New York GeologicalSurvey Annual Report 2, p. 257, 276, 283.
Weed, E. G. A., 1982, Nealmont Limestone extending from southwesternVirginia into southwestern New York in the middle part of theAppalachians, in Sohl, N. F., and Wric£it, W. B., U.S. GeologicalSurvey Bulletin 1529-H.
Weiss, M. P., and Norman, C. E., 1960, The American Upper Ordovicianstandard, II., Development of stratigraphic classification ofOrdovician rocks: Ohio Geological Survey Information Circular, no.26, 14 p. .
Wickstrom, Lawrence H., Gray, John D., and Stieglitz, Ronald D., inpress, Geology of the Trenton Limestone in Northwestern Ohio; OhioGeological Survey.
46

APPENDIX 1
Wells used in the construction of cross sections, isopach, drilling depth and structure maps of the Ordovician shale rich in organic matter. Wells marked with an * were used in the study but do not appear on the well location map because of scale limitations.
47

APPENDIX 1
NEW YORK
1. #1 Sommers & Tuttle 9. Appalachian Basin Oil & Gas Sheridan Twp., Cnautauqua Co. 7800' N 42°30'; 3300' W 79°15' Geolog P-1428
2. WPL #1 Lackawanna Plant 10. Bethlehem Steel Corp. Hamburg Twp, Erie Co. N 42°48'01"; W 78050'40" Geolog P-1802
3. R. W. Brundage 11. DuchschererAlabama Twp., Genesee Co. 27,725' S 43°10'; 17,000' W 78°15' Geolog P-1677
4. #1 Bowermn 12. Duchscherer & Strudwick Farmington Twp., Ontario Co. 22,750' S 43°05'; 540' W 77°20' Geolog P-1372
5. #1 E. K. Munroe 13. Qonriincjham Natural Gas Co. Camillus Twp., Onondaga Co. 23,500' S 43°05'; 14,400' W 76°15' Geolog P-2057
6. #1 J. Danisevich 14. New York State Natural Gas Bookf ield Twp., Madison Co., Sangerfied "H"13,500' S 42°50'; 7,950' W 75°22'30" Geolog P-682
7. #1 Robert Olin 15. New York State Natural Gas Woodhull Twp., Steuben Co. 7,400' S 42505'; 3,800' W 77°25' Geolog P-22
8. #1 L. & N. Richards 16. Fenix & Scisson Triangle Twp., Broome Co. 3,600' S 42620'; 8,430' W 75°55' Geolog P-1784
#1 F. FinchGulf Oil Corp.Sydney Twp., Delaware Co.5,850' S 42°20'; 18,750' W 75°10'Geolog P-1418
#1 BranaganNew York State Natural Gas Lebanon Twp., Madison Co. 10,400' S 42°50'; 18,000' W 75°35' Geolog P-281
#1 Edson House Humble Oil & Refining Hastings Twp., Oswego Co. 4,400' N 43620'; 5,300' W 76°05' Geolog P-486
#1 C. HazenWeaver Exploration Co.Hamlin Twp., Monroe Co.1,350' S 43°20'; 13,150' W 77°55'Geolog P-661
#1 Kellogg '. Humble Oil & Refining Williamstown Twp., Oswego Co. 9,750' N 43°25'; 11,250' W 75°50' Geolog P-485
A. McClurg #N-952New York State Natural GasYork Twp., Livingston Co.14,475' S 42°52'30"; 5,450'W 77°55'Geolog P-914
#1 F. KellyHimble Oil & RefiningBarre Twp., Orleans Co.6,350' S 43°12'30";2,100' W 78°15'Geolog P-942
#1 Wyman Hammerstone Farmington Twp. 4,050' S 43°00'; Geolog P-1348
Ontario Co. 7,850' W 77°15'
48

17. #1 R. Wblfe 25. HammerstoneSomerset Twp., Niagara Co. 29,500' S 43°25'; 3,450' W 78°30' Geolog P-1349
18. #1 H. V. Olson 26. Duchscherer Lyons Twp., Wayne Co. 20,050' S 43°10'; 5,500' W 77°00' Geolog P-1493
19. #1 L. Burkard N-946New York State Natural Gas & Acme 27. Maryland Twp., Otsego Co. 19,150' S 42°35'; 13,450' W 74°50' Geolog P-1581
20. #1 E. S. Hall 28. DuchschererOswego Twp., Oswego Co. 17,150' S 42°25'; 5,000' W 76°35' Geolog P-1636
21. #1 Werner 29. New York State Natural Gas Orangeville Twp., Wyoming Co. 875' S 42°45'; 8,400' W 78°10' Geolog P-1700
22. #1 G. C. Frarikish 30. M. C. Hoover Gorham Twp., Ontario Co. 7,550' S 42°50; 9,750' W 77°10' Geolog P-1828
23. #2 G. M. Cook 31. Parsons Brothers Hiime Twp., Allegany Co. 17,000' S 42°30'; 2,050' W 78°10' Geolog P-240
24. #1 Harrington 32. PennzoilEllery Twp., Chautauqua Co. 23,900' S 42°15'; 1,300' W 79°20' Geolog P-601
#1710 EllisIroquois GasPerrysburg Twp., Cattaraugus Co.16,150' S 42°30'; 10,975' W 79°00'Geolog P-689
#1 Arthur E. Johnson N-956New York State Natural GasCaledonia Twp., Livingston Co.Caledonia "B"9,475'S 42°57'30";2,425'W 77°52'30"Geolog P-874
#1 A. Kennedy E. Blair & O. D. Weaver Sparta Twp., Livingston Co. 4,500' S 42°40'; 3,000' W 77°45' Geolog P-875
#1 L. TylerE. F. Blair & O. D. WeaverByron Twp., Genesee Co.15,000' S 43°05'; 20,550' W 78°00'Geolog P-896
#1 Celia WasielewskiHurribleIra Twp., Cayuga Co.29,400' S 43°20'; 19,700' W 76°25'Geolog P-936
#1 C. E. LeslieGulf Oil Corp.Franklin Twp., Delaware Co.9,900' S 42S25'; 12,200' W 75°00'Geolog P-1377
#1 CampbellGulf Oil Corp.Hamden Twp., Delaware Co.24,700' S 42°15«; 1,450' W 74°55'Geolog P-1391
#1 K. & O. Clou^i Delta Drilling Co. Freetown Twp., Cortland Co. 23,500' S 42°35'; 250' W 76°00' Geolog P-1406
49

33. K. & R. KLotzbach . IXichschererAlabama Twp. , Genesee Co. 500 f S 43°02 I 30"; 4,050'W 78°22'30" Geolog P-1678
34. #1 A. VictorSchoellkopf & Victor Hamburg Twp., Erie Co. 10,000' S 42°45'; 7,600 W 78°55' Geolog P-1712
35. KesselringNew York State Natural Gas Van Etten Twp., Chemung Co. 2.22 mi N 42S10'; 1.89 mi W 76°30' Fettke, 1961
36. LanzillotaGulf Oil & Refining Roxbury Twp., Delaware Go. 24,600' S 42°20'; 15,200' W 74°35' Geolog P-1485
37. #2 SchafferUnited Production Fayette IVp., Seneca Oo. .14,750' S 42°55»; 6,750' W 76°50« Geolog P-511
38. #1 Veith... New York State Natural Gas
Gainesville Twp., Vtyoming Co. 17,600' S 42°40'; 21,800' W 78°00' Geolog P-274
39. |1 HeaphyHumble Oil & Refining Palermo Twp., Oswego Co. 5,300' N 43°20»; 3,800' E 76°20' Geolog P-484

PENNSYLVANIA
8.
Pa. Dept. Forest & Waters Blk. 2 #1 New York State Nat. Gas-Kewanee Oil Lake Erie, Erie Co. 10,900' N 42°15'; 4,700' E 79°55' Geolog P-39
#2 Hairanermill PlantHainraermill Paper Co.City of Erie, Erie Co.8,700' S 42°10'; 12,900' W 80°00'Geolog P-849
#1 ShawBiery & JohnsonLimestone Twp., Warren Co.0.91 mi S 41S40'; 1.85 mi W 79°20'Geolog P-3
9.
#1 FeeMinard Run Oil Co.Bradford Twp., McKean Co.12,650' S 41°55'; 8,600' W 78°35«Geolog P-957
Emma McKhightMelben Oil Co.Pymatuning Twp., Mercer Co..92 mi S 41°20'; 2.01 mi E 80°30'Wagner, 1958
C-l Pa. Dept. Forest & Waters Texaco Inc.Blooming Grove Twp., Pike Co. 15,150' S 41°27'; 4,400' W 75°07'30" Geolog P-2356
#1 SolomonG. L. Cabot Inc.Buffalo Twp., Union Co.7,700' E 77°00'; 6,500' S 41°55'Geolog P-12
#1 J. KardoshBenedum Trees & Ark.-La. Gas Summerhill Twp., Crawford Co. 12,525' S 41°25»; 15,500' W 80°15» Geolog P-67
10,
11,
12,
13.
14.
15.
16.
Pa. Dept. Forest & Waters Blk 1 #1New York State Nat. Gaslake Erie, Erie Co.5,300' N 42°00'; 7,150' W 80°25'Geolog P-73
#1 BorstR. McConnellConneaut Twp., Erie Co.1.89 mi N 41°50»; 2.77 mi W 80°25»Geolog P-112
#1 LongMobil Oil Co.Marion Twp., Centre Co.2,150' S 41°00'; 4,700' W 77°35»Geolog P-695
#1 W. MortonD. C. GarrettBloomfield Twp., Crawford Co.29,200' S 41°55'; 15,600' W 79°50'Geolog P-737
1 Shade Mnt.Shell et. al.Fayette Twp., Juniata Co.23,000' S 40°45»; 8,500' W 77°15'Geolog P-751
J. MarzkaD. C. GarrettRockdale Twp., Crawford Co.3,200' S 41°50»; 5,100' W 79°55»Geolog P-752
1 Mike MillerJames Drilling Co.Indian Springs Twp., Crawford Co.22,800' S 41°50'; 17,400' W 80°20»Geolog P-795
#1 T. Miller Shellsburg Kerr-MoGee, et. al. Napier Twp., Bedford Co. 22,400' S 40°10'; 9,300' W 78°35» Geolog P-998

17. #2 Benebaugh 25. #1 Leonard SvetzTrans American Amoco & FNGBeaver Twp., Crawford Co. Middle Creek Twp., Somerset Co,3,500' S 41°50'; 14,000' W 80°25' 8,100' S 40°00'; 150' W 79°20'Geolog P-1077 Geolog P-3203
18. #1 Tyler Ventura OilBeaver Twp., Crawford Co. 22,000' S 41°50'; 3,800' W 80°25' Geolog P-1094
19. #1 Goodwill-CurleyV. R. Stephens, et. al. Summit Twp., Erie Co. 13,400' S 42°05'; 6,600' W 80°00' Geolog P-1207
20. #1 Buchowski Sun Oil Co.Cussewago Twp., Crawford Co. 3,600' S 41°50'; 6,200' W 80°10' Geolog P-1292
21. #1 Pa. Tract 129Consolidated Gas N-972 Stewardson Twp., Potter Co. 3,900' S 41°30'; 6,550' W 77°45' Geolog P-1396
22. 2 Amerite Eldon FunkFannette Twp., Franklin Co. 23,600' S 40°15'; 2,900' W 77°40' Geolog P-1583
23. #1 Nellie C. Martin Peoples Natural Gas Wayne Twp., Armstrong Co. 11,500' S 40°55'; 3,700' W 79°20' Geolog P-1981
24. Jay Qiilds #1 Ohio Oil Co.Springfield Twp., Erie Co. 2.23 mi S 42°00'; .95 mi W 80°30' Fettke, 1961

WEST VIRGINIA
#1 Graver Arrington 9.United Fuel GasClendenia Dist., Mason Co.2.50 mi S 38°45'; 4.12 mi W 82°05'Geolog P-14
Ray Sponaugle 10. United Fuel Gas Well #800T Circleville Dist. Pendleton Co. 2.43 mi S 38°35'; 0.69 mi W 79°30' Geolog P-110
#1 U.S. Forest Service 11. Tidwater and S. Perm Tr. 357 Huntersville Dist., Pocohantas Co. 5,050' S 38°10'; 3,300' W 80°00' Geolog P-560
J. W. .Heinzman 12.United Fuel #4053Curtis Dist., Roane Co.3.42 mi S 38°50'; 0.34 mi W 81°30'Geolog P-571
#1 Duckworth ' '. . 13. Shell Oil Co.Springfield Dist., Hampshire Co. 2,100' S 39°30'; 17,500' W 78°35'
. Geolog P-621 ... __... ....... ... , .........
#1 R. R. FinchEhillipsWinfleld Dist., Marion Co.4.76 mi S 39°30'; 0.64 mi W 80°00'Geolog P-625
#1 S. Minesinger (42172)Humble OilClay Dist., Hancock Co.2.98 mi S 40°35»; 2.86 mi W 80°30'Geolog P-1392
#10707A (HNG)Ehillips PetroleumWalker Dist., Wood Co.25,400' S 39°20'; 6,800' W 81°15'Geolog P-1419
14.
#3 Greenland Lodge 10768Shell Oil Co.Union Dist., Grant Co.7,300' S 39°10'; 9,800' W 79°10'Geolog P-1770
E. Kingery Unit #1CyclopsUnion Dist., Cabell Co.4.19 mi S 38°35'; 0.72 mi W 82°15'Geolog P-2220
#1 John BurleyOccidentalLiberty Dist., Marshall Co.25,600' S 39°50'; 8,450' W 80°30'Geolog P-1960
HNG Co. |9634Power Oil Co.Walker Dist., Wood Co.5.40 mi S 39°20'; 1.14 mi W 81°15'Price and others, 1959
9674TColumbia GasHarvey Dist., Mingo Co..78 mi S 37°55' Geolog P-2888
.21 m W 82°10'
20659 S. D. ToddColumbia GasMaiden Dist., Kanawha Co.2.47 mi S 38°20'; 2.01 mi W 81°20'Geolog P-4611

APPENDIX 2
Sample localities in New York, Ohio, Pennsylvania, and West Virginia

Sample No.
NY1
Sample Location
APPENDIX 2
NEW YORK
Sample No.
NY9
NY10
#1 Sommers & Tuttle Appalachian Basin Oil & Gas Sheridan Twp. , Qiautauqua Co. 7,800' N 42S30'; 3,300' N 79°15'
#1 HarringtonPennzoilEllery Twp. , Oiautauqua Co.23,900' S 42°15'; 1,300' W 79°20'
Fee #2J. F. Weinheimer Inc. Tonowanda Twp. , Erie Co. 1,600' N 43°00'; 2,350' E 78°50'
#1 R. WblfeHammerstoneSomerset Twp. , Niagara Co.29,500' S 43°25'; 3,450' W 78°30'
#1 F. KellyHumble Oil & RefiningBarre Twp. , Orleans Co.6,350' S 43°12'30!l ; 2,100' W 78°15'
#1 L. TylerE. F. Blair & O. D. Weaver .Byron Twp. , Genesee Co.15,000' S 43°05'; 20,550' W 78°00'
#1 VeithNew York State Natural Gas Gainesville Twp. , Wyoming Co. 17,600' S 42°40'; 21,800' W 78°00'
#2 G. M. CookParsons BrothersHume Twp., Allegany Co.17,000' S 42°30 ! ; 2,050' W 78°10'
#1 C. HazenWeaver Exploration Co.Hamlin Twp. , Monroe Co.1,350' S 43°20'; 13,150' W 77°55'
#1 A. Kennedy E. Blair & O. D. Weaver Sparta Twp. , Livingston Co. 4,500' S 42°40 ! ; 3,000' W 77°45'
Sample location
NYU #1 Robert OlinNew York State Natural Gas Woodhull Twp., Steuberi Co. 7,400' S 42*05'; 3,800' W 77°25'
NY12 #1 H. V. Olson Duchscherer Lyons Twp., Wayne Co. 20,050' S 43°10'; 5,500' W 77°00'
NY13 #1 BowennanDuchscherer & Strudwick Farmington Twp. , Ontario Co. 22,750' S 43°05'; 540' W 77°20'
NY14 KesselringNew York State Natural Gas Van Etten 2.22 mi
ten Twp., Qieraung Co.i N 42S10'; 1.89 mi W 76°30'
NY15 #2 SchafferUnited Production Fayette Twp., Seneca Co. 14,750' S 42°55'; 6,750' W 76°50'
NY16 Shepard, John. .N.Y.S. Natural Gas_ , .
Danby Twp., Tompkins Co. 1,750' S 42°22'30"; 1,700' W 76°30'
NY17 C. C. Labdell #1Bradley Prod. Corp. Columbus Twp., Chenango Co. 9,700' N 42540'; 3,150' W 75°20'
NY18 |1 Celia Wasielewski HumbleIra Twp., Cayuga Co. 29,400' S 43620'; 19,700' W 76°25'
NY19 #1 KelloggHumble Oil & Refining Williamstown Twp., Oswego Co 9,750' N 43°25'; 11,250' W 75°50'
NY20 #1 J. DanisevichNew York State Natural Gas Brookfield Twp., Madison Co. 13,500'S 42°50'; 7,950'W 75°22'30"

NY21 #1 L. & N. Richards Fenix & Scisson Triangle Twp., Broome Oo. 3,600' S 42820«; 8,430' W 75°55«
NY22 #1 K. & O. Clou^i Delta Drilling Oo. Freetown Twp., Cortland Co. 23,500' S 42°35'; 250' W 76°00'
NY23 Gould Paper Co. #1 Humble Oil & Ref. High Market Twp., Lewis Co. 21,800' S 43°40'; 4,200' W 75°35«
NY24 Puskarenko #1Devonian Gas & Oil Co Stark Twp., Herkimer Co. 2,700' S 42°55'; 500' W 74°50«
NY25 lanzillotaGulf Oil & Refining Roxfoury Twp., Delaware Co. 24,600' S 42°20'; 15,200' W 74°35'
NY26 #1 L. Burkard N-946New York State Natural Gas & AcmeMaryland Twp., Otsego Oo.19,150' S 42°35'; 13,450' W 74°50'
NY27 Cans, Maurice #1 United Prod. Co. Windham Twp., Greene Oo. 100' N 42°20'; 5,200' E 74°15'
NY28 Amsterdam 15' Quad. Schenectady Co., NY 6.3 mi S 43°00'; 3.8 mi W 74°00'
NY29 Amsterdam 15' Quad. Schenectady Co., NY 6.35 mi S 43°00'; 3.8 mi W 74°00'
NY30 Randall 7 1/2' Quad. Montgomery Oo. 3.65 mi S 43°00'; 1.75 mi E 74°25»
NY31 Carlisle 7 1/2' Quad. Montgomery Oo. 2.4 mi N 42°50'; 2.5 mi E 74°30'
NY32 Canajoharie 7 1/2' Quad. Montgomery Co. 7.1 mi S 43°00'; 3.5 mi W 74°30'
NY33 Fort Plain 7 3/2" Quad. Montgomery Oo. 4.4 mi S 43°00«; 2.9 mi E 74°45«
NY34 Boonville 7 1/2' Quad. Qneida Co. 5.85 mi S 43°30'; 3.85 mi W 75°15«
NY35 Glenfield 7 1/2 Quad. " Lewis Co. 7.05 mi S 43°45«; 3.5 mi E 75°30'
NY36 Rodman 7 1/2' Quad. Jefferson Oo. 1.75 mi N 43°50«; 4.4 mi E 76°00'
NY37 Barnes Corner 7 1/2' Quad. Jefferson Co. 8.25 mi N 43°45'; 4.9 mi W 75°45'
NY38 Glenfield 7 1/2' Quad. Lewis Oo. 3.5 mi. S 43°45'; 1.65 mi E 75°30'
NY39 Fort Plain 7 1/2' Quad. Montgomery Oo. 4.5 mi S 43°00'; 2.85 mi E 74°45'
NY40 Vaa Hornesville 7 1/2 f Quad. Herkimer Co. 1 mi S 43°00'; 2.9 mi W 74°45«

Sample No. Sample Location
GH1 Kenneth D. & Pauline MacBurden Frank DeverAuglaize Twp., Alien Co. 230 ' FSL; 260' FEL; SW 1/4, Sec. 29
OH2 Kemmer UnitQuaker State Refining Co. Jefferson Twp., Ashtabula Co. 1,148' FSL; 880 IWL; Lot 134
OH3 D & B Hoelscher Comm. West Ohio Gas Co. St. Mary's Twp., Auglaize Co. .25 mi N 40°30'; 1 mi W 84°22'30"
OH4 #1 Clark et al. Unit Stocker & Sitler, Inc. Brown Twp., Carroll Co.I,590' FNL; 22' FWL; NW 1/4, Sec. 36
CHS Van PeltKewanee Oil Co.Wayne Twp., Clinton Co.II,200' W 83°35'; 12,800' S 39°25'
OH6 #1 Maynard BarnesNational Gas & Oil Co.Deerfield Twp., Morgan Co.700' JWL; 400' FSL; NE 1/4, Sec. 12
OH7 Nathan WickhamNational Oil & GasSalt Creek Twp., Muskingum Co.528' JWL; 660' FSL; NE, Sec. 10
OH8 Eldon E. Denny 2468 East Ohio Gas Co. Khox Twp., Columbiana Co. 1,153'FSL; 1,675'FWL; SW 1/4, Sec. 12
OH9 #1 Benley-APhillips PetroleumCrawford Twp., Coshocton Co.207' PNL; 800' FWL; SW 1/4, Sec. 16
OHIO Donald F. & Clara E. Higbea Sohio Pet. Co. Adams Twp., Defiance Co. 330' RJL; 330' FEL; SE 1/4, Sec. 18
OHIO
Sample No. Sample IiDcation
OH11 Melvin P. Sayler et al. Ohio Fuel Gas 10209 Florence Twp., Erie Co.I,350'FNL;l,200'J\*L;4th Qtr.,Iot 48
OH12 #1 Rosa Thcanas HeirsClark Oil & Refining Co. Clear Creek Twp., Fairfield Co. 430' FSL; 330' JWL; NE 1/4, Sec. 15
OH13 Maynard Hbppes Kewanee Oil Co. Perry Twp., Fayette Co.II,500' W 83°25'; 9,000' N 39°25'
OH14 #1 Marble Cliff Quarries Marble Cliff Quarries Franklin Twp., Franklin Co. 2,500'S Traboe Rd;3,100'W Sciota Rv
OH15 Noble W. Erbskorn McClure Oil Co. Gorham Twp., Fulton Co. 990«FNL; 4,600'FWL; NW 1/4, Sec. 19
»
OH16 #1 Mae & Charles Vessels Ridge Oil Co., Inc. Westland Twp., Guernsey Co. 1,520' FNL; 2 r603' FEL; -3rd Qtr. ~_
OH17 D & D JonesNorman EdmundJackson Twp., Hardin Co.660' FNL; 660' FEL; SW Sec. 30
OH18 #1 M. F. & H. Hockman E. J. Dunigan Jr. Starr Twp., Hocking Co. 660' FSL; 570' FWL; NE/R Sec. 31
OH19 Elizabeth GeibAmerada Petroleum Corp. Berlin Twp., Holmes Co. 660' FEL; 500' FSL; SE 1/4, lot 12
OH20 George D. & Ina WoodWorthington Oil Co., Inc. Frankin Twp., Jackson Co. 790'FSL; 730'FEL; SW 1/4, Sec. 23

Sample No. Sample location Sample No. Sample location
OH21 #1 Charles G. Huffman Kin-Ark Oil Hilliar Twp., Know Co. 500' IKL; 985' IWL; 3rd. Qtr., Lot 21
OH22 #1 Calhio Chemical Inc. Calhio Chemicals Inc. Perry Iwp., Lake Co. 1,52V 1 FSL; 435' PEL; Lot 47
OH23 #1 K. F. & M. I. WhiteSouthern Triangle Oil Co. Granville Twp., Licking Co. 2,030' FWL; 6,800' BNL; lot 6
OH24 #1 A. & A. Born 2155 East Ohio Gas Henrietta Twp., Lorain Co. 1,150' FEL; 700 f FSL; lot 8
OH25 Ketring UnitLiberty Pet. Corp.Harding Twp., Lucas Co.300' FSL; 500' FEL; SE 1/4, Sec. 9
OH26 #1 J. R. HumeAmerada Petroleum Corp. Fairfield Twp., Madison Co. 710' FSWL; 1,980' FNIW 1 lot 9717
PH2Z_H. E. WarnerOhio Fuel Gas Co. Granger Twp., Medina Co. 786' FWL; 540' FNL; lot 42
OH28 H. V. ThomasBuckeye Management Co.Beaverf ield Twp., Perry Co.1,100' FSL; 1,250' FEL; SW 1/4, Sec. 1
OH29 #1 Mable MoCoy Croman McMahon-Billington Jackson Twp., Pickaway Co. 2,700' S 39°40'; 2,400' W 83°05'
OH30 #1 D. WittmerB.B.M. Drilling Co. Springfield Twp., Richland Co. 955' FSL; 289' FWL; SE 1/4, Sec. 33
OH31 #1 O. & O. Clark Crest Oil Co. Concord Twp., Ross Co. 8,200' FWL; 3,200' FSL
OH32 #1 AyersE. J. Dunegan, Jr. Washington Twp., Sandusky Co. 230 I JKL;330 I FEL;SE 1/4, Sec. 31-N
OH33 4-A Erma SponsellerM.B. Oil & Gas & Prudent ResourcesCanton Twp., Stark Co.645 f FSL; 645' FWL; SW 1/4, Sec. 25
OH34 Carl Matheny Unit Guernsey Pet. Corp. Lawrence Twp., Washington Co. 500'FSL; 1,175'FEL; NE 1/4, Sec. 15
OH35 B. W. Williams Shure Oil Co. Sunfish Twp., Pike Co. 13,800' FSL; 1,500' FEL
OH36 R. R. ShultzR.I..G. Drilling, Inc.Concord Twp., Champaign Co.660' FSL; 660' FWL; SE 1/4 Sec. 22
OH37 A. & H. Bauer Bauer Bros.Polk Twp., Crawford Co. 676' PUL; 333' FEL; NE 1/4, Sec. 4

Sample No.
PI
Sample Location
PENNSYLVANIA
Sample No.
#2 Hammermill Plant Hammermill Paper Oo. City of Erie, Erie Oo., PA 8,700' S 42°10'; 12,900' W 80°00'
Jay Childs #1Ohio Oil Oo.Springfield Twp., Erie Oo, PA2.23 mi S 42°00'; .95 mi W 80°30'
1 Mike MillerJames Drilling Oo.Indian Springs Twp., Crawford Oo., PA22,800' S 4r50'; 17,400' W 80°20'
|1 W. MortonD. C. GarrettBloomfield Twp., Crawford Co., PA29,200' S 41°55«; 15,600' W 79°50'
Emma McKiightMeben Oil Oo.Pymatuning Twp., Mercer Co., PA.92 mi S 41°20«; 2.01 mi E 80°30«
Jessie Hockenberry Manufacturers Light & Heat Mercer Twp., Butler Co., PAI.60 mi N 41°05',; 2.13 mi W 80°00«
#1 ShawBiery & JohnsonLimestone Twp., Warren Co., PA.91 mi S 41°40'; 1.85 mi W 79°20'
#1 FeeMinard Pun Oil Co.Bradford Twp., McKean Co., PA12,650' S 41°55'; 8,600' W 78°35'
#1 Nellie C. Martin Peoples Natural Gas Wayne Twp., Armstrong Co., PAII,500' S 40°55'; 3,700' W 79°20'
#1 Leonard SvetzAmoco & FNGMiddle Creek Twp., Somerset Co., PA8,100' S 40°00'; 150' W 79°20«
Sample location
Pll #1 T. Miller Shellsburg Kerr-MoGee, et al. Napier Twp. , Bedford Co. , PA 22,400' S 40°10'; 9,300 W 78°35'
P12
P13
P14
P15
1 ShadeShell et alFayette Twp. , Juniata Co. , PA23,000' S 40°45'; 8,500' W 77°15«
# SolomonG. L. Cabot Inc.Buffalo Twp. , Union Co. , PA7,700' E 77°00'; 6,500' S 41°55'
#1 longMobile Oil Co.Marion Iwp. , Centre Co. , PA2,150' S 41°00' 4,700' W 77°35«
Mingoville 7 1/2' QuadrangleCentre Co. , PA1 mi E 77°45«; 3.8 mi S 41°00'
P16 MDJ. Hall 7 1/2' Quadrangle Clinton Co. , PA 4.6 mi E 77°30'; 4.7 mi N 41°00'
P17 Linden 7 1/2 ' Quandrangle Lycoming Co. , PA 1.5 mi E 77°15«; 5.9 mi S 41°15'
P18 Millheim 7 1/2 ' Quadrangle Clinton Co. , PA 3.8 mi E 77°30«; 1.1 mi S 40°00'
P19 Burnham 7 1/2' Quandrangle Mif flin Co. , PA 5.4 mi W 77°30'; 5.8 mi S 40°45'

Samp
le
IDOrganic
Carb
onS
1 Mc
r/qm
S2
Mcr/
qmS3
Mc
r/qm
ANALYSIS OF QRDOVICIAN SHALES
RIQ1 IN ORGANIC MATTER
I Hydrogen
Oxyg
en
Prod
ucti
on
Dept
h (f
t)
Tfc
Index
Inde
x In
dex
Surface
(S)
Form
atio
nNEW YOR
K
*NY
la Ib*N
Y 2a 2b
*NY
3a 3b*NY
4a 4b*N
Y 5a 5b
*NY
6a 6b*NY
7a 7b*NY
8a 8b*NY
9a 9b*N
Y lO
alOb
*NY
11*N
Y 12a
12b
*NY
13a
13b
*NY
14*N
Y 15a
15b
*NY
16*N
Y 17
1.25
0.59
0.72
0.68
'1.11
0.37
0.58
0.34
0.46
0.27
0.43
0.47
0.78
0.73
0.92
0.38
0.87
0.38
0.56
0.59
1.99
0.36
0.32
0.60
0.60
3.19
0.30
0.16
1.46
2.04
0.48
0.24
0.52
0.45
0.35
0.09
0.22
0.07
0.14
0.06
0.19
0.22
0.29
0.69
0.18
0.09
0.33
0.13
0.16
0.21
0.63
0.07
0.05
0.30
0.22
0.71
0.11
0.08
0.48
0.51
1.14
1.09
1.10
1.44
1.26
0.52
1.07
0.46
0.45
0.24
1.12
1.20
1.00
2.25
0.43
0.39
0.90
0.46
0.74
0.77
1.02
0.34
0.28
0.88
0.85
1.00
0.43
0.14
1.33
0.44
0.49
0.78
0.48
0.53
0.46
0.36
0.55
0.30
0.37
0.18
0.42
0.43
0.40
0.59
0.33
0.39
0.47
0.38
0.58
0.46
0.52
0.22
0.35
0.60
0.49
0.79
0.19
0.15
0.71
0.55
422
548
441
429
443
444
454
450
479
501
463
507
507
533
430
491
496
481
460
523
474
465
91 184
152
211
113
140
184
135
97 83260
255
128
308 46 102
103
121
132
130 51 94 87 146
141 31 143 87 91 21
39132 66 7741
97 94 88 80 66 97 91
51
80 35
102 54
100
103
77 26 61
109
100
81 24 63 93 48 26
0.30
0.18
0.32
0.24
0.22
0.15
0.17
0.13
0.24
0.20
0.15
0.15
0.23
0.23
0.30
0.19
0.27
0.22
0.18
0.21
0.38
0.17
0.16
0.25
0.21
0.42
0.20
0.36
0.27
0.54
3619-28
3526-36
5940-50
5810-20
2370-85
2304-16
1240-50
1160-70
1991-2005
1926-36
2440-50
2350-60
5290-5300
5200-10
6060-79
5872-98
1139-49
1127-39
4470-80
4370-80
9640-60
2470-80
2390-2400
2800-10
2740-50
8881-98
3520-40
3460-80
7720-50
4230-75
*Basal
Utic
aUt
ica
Utic
aUt
ica
Utic
aUtica
Utic
aUt
ica
Utic
aUtica
Utic
aUt
ica
Utic
aUtica
Utic
aUt
ica
Utic
aUt
ica
Utica
Utic
aUtica
Utic
aUtica
Utic
aUt
ica
Utic
aUt
ica
Utica
Utic
aUt
ica
Utic
a
Sh.
Sh.
Sh.
Sh.
Sh.
Sh.
Sh.
Sh.
Sh.
Sh.
Sh.
Sh.
Sh.
Sh.
Sh.
Sh.
Sh.
Sh.
Sh.
Sh.
Sh.
Sh.
Sh.
Sh.
Sh.
Sh.
Sh.
Sh.
Sh.
Sh.

Sample
ID
*NY
18a
18b
*NY
19*N
Y 20a
20b
*NY
2 la
21b
*NY
22a
22b
*NY
23*N
Y 24
*NY
25a
25b
*NY
26a
26b
*NY
27NY 28
NY 29
NY 30
NY 31
NY 32
Ni 33
NY 34
NY 35
NY 36
NY 37
NY 38
NY 39
NY 4
0
Organic
Carbon
0.95 0.
991.00
1.25
1.38
1.31
2.04
1.62
1.06
1.41
1.17
1.65
1.95
2.11
1.34
1.77
1.56
'
0.87
1.50
0.40
2.55
1.70
1.28
1.67
0.66
1.57
1.33
1.53
2.00
S1
Mcr/
qm
0.14
0.16
0.18
0.19
0.35
0.22
0.39
0.13
0.18
0.28
0.27
0.45
0.35
0.33
0.24
0.36
0.09
0.05
0.03
0.01
0.06
0.04
0.03
0.05
0.06
0.43
0.09
0.05
0.06
Mcr/qm
0.26
0.36
0.35
0.34
0.31
0.31
0.64
0.67
0.32
0.73
0.71
0.40
0.62
0.96
0.25
0.29
0.02
0.06
0.08
0.06
0.33
0.20
0.05
0.21
0.12
0.76
0.21
0.21
0.36
Mor/crm
0.26
0.34
0.33
0.47
0.55
0.59
1.02
1.10
0.42
0.49
0.59
0.52
0.48
0.98
0.42
0.41
0.54
0.40
0.36
0.29
0.58
0.28
0.33
0.45
0.53
0.31
0.16
0.44
0.23
tfc
428
452
419
J, 4 - 4
. -, _i 4 481
576
585
576
416
482
497
456
483
560
559
Hydrogen
Index
27 36 35 27 22 23 31 41 30 51 60 24 31 45 18 161 6 5 15 ,12
*11 3
12 18 48 15 13 18
Oxyg
en
Inde
x
27 34 33 37 39 45 50 67 39 34 50 31 24 46 31 23 34 45 24 72 22 16 25 26 80 19 12 28 11
Prod
uction
Dept
h (f
t)
Index
Surface
(S}
0.35
0.31
0.35
0.37
0.53
0.42
0.38
0.16
0.36
0.28
0.28
0.54
0.36
0.26
0.50
0.56
0.90
0.50
0.30
0.17
0.16
0.17
0.37
0.19
0.33
0.36
0.30
0.19
0.14
1902
-191
418
46-6
1822-35
3900-10
3700-13
7660
-65
7550
-60
6880-90
6730-40
1026-35
1721
-47
6740-50
6500-10
4295
-430
440
03-1
460
00-1
8S S S S S S S S S S S S S
*Basal Uti
ca
Formation
Utic
aUt
ica
Utica
Utic
aUt
ica
Utic
aUtica
Utic
aUtica
Utica
Utic
aUt
ica
Utica
Utic
aUt
ica
Utic
aUt
ica
Utic
aUt
ica
Utic
aUt
ica
Utica
Utic
aUtica
Utica
Utic
aUtica
Utic
aUt
ica
Sh.
Sh.
Sh.
Sh.
Sh.
Sh.
Sh.
Sh.
Sh.
Sh.
Sh.
Sh.
Sh.
Sh.
Sh.
Sh.
Sh.
Sh.
Sh.
Sh.
Sh.
Sh.
Sh.
Sh.
Sh.
Sh.
Sh.
Sh.
Sh.

Samp
le
IDOrganic
Carbon
Mcf/qm
ANALYSIS OF ORDOVTCIAN SH
ALES
'R
ICH IN
ORGANIC MATTER
S2
83
Hydr
ogen
Oxygen
Production
McT/
gm
Ma/qm
T°C____Index
Index____Index
Depth
(ft)
Surface
(SI
Form
atio
nOH
IO
O 1
1.29
0.61
3.73
0.53
440
289
410.
1414
38-4
0
0 2a
*0
2b*0
30
4a*0
4b
0 5a
*0
5b0
6a*0
6b0
7a*0
7b
O 8a
*0
8b0
9a
*O
9b*0
10
O lla
*O l
ib*0 1
2*O 1
3*0 1
4*0 15
*O 16
*0 17
*0 18
*0 19
2.43
1.37
1.36
0.32
2.83
0.29
0.66
2.30
1.08
0.69
1.81
0.40
1.68
0.54
2.86 '
1.82
0.97
1.55
2.02
0.72
1.38
1.80
2.27
0.99
0.28
2.70
3.01
1.56
0.58
0.18
1.15
0.04
0.20
1.15
0.49
0.29
1.96
0.19
0.65
0.12
1.58
0.88
0.16
0.55
0.69
0.11
0.51
0.75
2.03
0.16
0.06
1.03
4.45
2.10
4.06
0.75
1.56
0.39
2.17
5.03
2.27
0.95
3.42
0.54
1.66
0.71
6.40
4.26
2.24
4.56
10.00
3.10
4.86
3.95
4.33
2.86
0.33
5.56
0.62
0.56
0.87
0.55
0.80
0.45
0.37
0.83
0.63
0.61
0.81
0.40
0.59
0.54
0.79
0.69
0.57
0.79
1.63
0.63
1.03
0.68
0.89
0.66
0.65
1.07
439
444
444
466
430
439
441
440
433
443
425
461
439
440
435
435
434
436
432
440
440
438
439
437
438
183
153
298
234 55 134
328
218
210
137
188
135
.98
131
223
234
230
294
495
430
352
219
190
288
117
205
25 40 6317
1 28 155 56 36 58 88 44 100 35 100 27 37 58 50 80 87 74 37 39 66
232 39
0.40
0.43
0.12
0.20
0.43
0.10
0.08
0.19
0.18
0.23
0.36
0.26
0.28
0.15
0.20
0.17
0.07
0.11
0.06
0.03
0.10
0.16
0.32
0.05
0.16
0.16
4980-5000
5150-60
1040-50
6860-80
7300
-20
970-80
1090-95
5655-70
5705-19
5544
-61
5741-48
6880
-691
0
6970
-700
05130-40
5410-20
1840-45
2804
-281
3
3141
-52
2940
-60
1260-80
1700-10
2412-27
6300-10
1220
-30
4280-90
5670-80
Cincinnatian
Seri
es
Utica
Sh.
Utica
Sh.
Reedville
Sh.
Utica
Sh.
Utica
Sh.
Cincinnatian
Series
Pt.
Plea
sant
Fm.
Utica
Sh.
Utica
Sh.
Utica
Sh.
Utica
Sh.
Cincinnatian
Series
Utica
Sh.
Cincinnatian
Seri
es
Utica
Sh.
Utica
Sh.
Cinc
inna
tian
Seri
es
Utica
Sh.
Utica
Sh.
Utica
Sh.
Utica
Sh.
Utica
Sh.
Utica
Sh.
Utica
Sh.
Utica
Sh.
Utica
Sh.
6
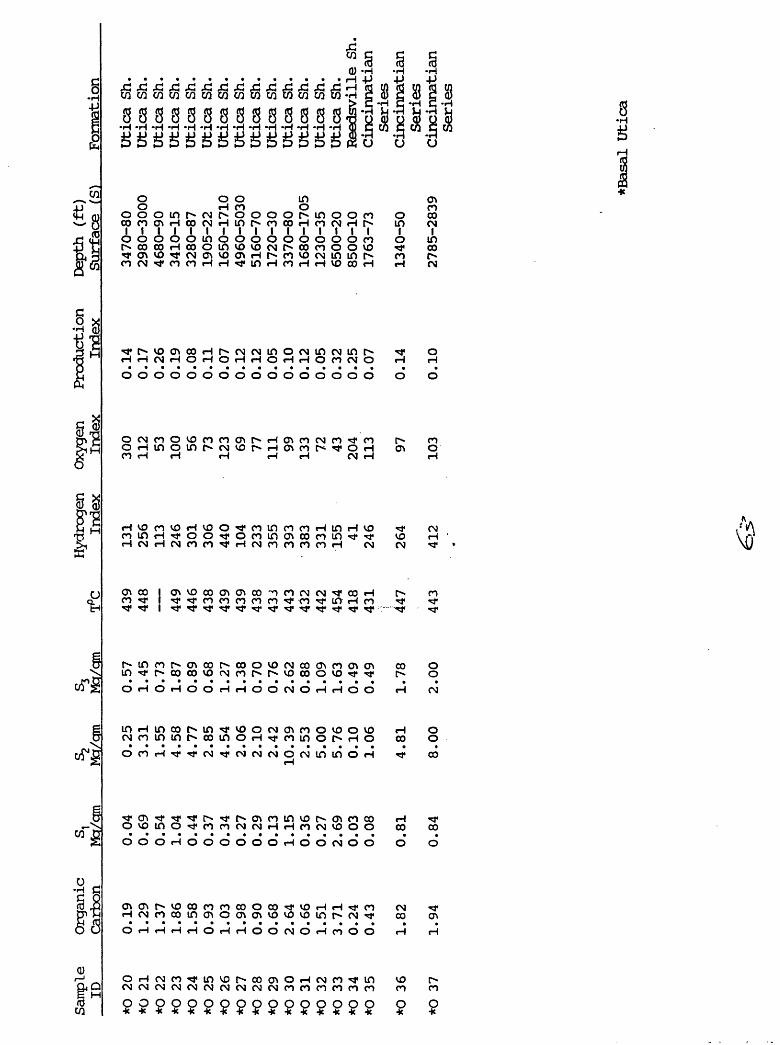
Sample
ID
*O 2
0*O
21
*0 22
*O 23
*0 24
*0 25
*0 26
*0 27
*0 28
*O 29
*O 30
*O 31
*O 32
*0 33
*0 34
*0 35
*O 36
*O 37
Organic
Carb
on
0.19
1.29
1.37
1.86
1.58
0.93
1.03
1.98
0.90
0.68
2.64
0.66
1.51
3.71
0.24
0.43
1.82
1.94
S1
Mcf/qm
0.04
0.69
0.54
1.04
0.44
0.37
0.34
0.27
0.29
0.13
1.15
0.36
0.27
2.69
0.03
0.08
0.81
0.84
S2
Mcf/qm
0.25
3.31
1.55
4.58
4.77
2.85
4.54
2.06
2.10
2.42
10.3
92.53
5.00
5.76
0.10
1.06
4.81
8.00
S3
Mcr/qm
0.57
1.45
0.73
1.87
0.89
0.68
1.27
1.38
0.70
0.76
2.62
0.88
1.09
1.63
0.49
0.49
1.78
2.00
^c
439
448
449
446
438
439
439
438
43J
443
432
442
454
418
431
' ] 447
443
Hydr
ogen
In
dex
131
256
113
246
301
306
440
104
233
355
393
383
331
155 41
246
264
412
Oxygen
Inde
x
300
112 53 100 56 73 123 69 77 111 99 133 72 43 204
113 97 103
Production
Index
0.14
0.17
0.26
0.19
0.08
0.11
0.07
0.12
0.12
0.05
0.10
0.12
0.05
0.32
0.25
0.07
0.14
0.10
Depth
(ft)
Surface
(S)
3470
-80
2980
-300
046
80-9
03410-15
3280
-87
1905-22
1650
-171
04960-5030
5160
-70
1720-30
3370-80
1680-1705
1230
-35
6500-20
8500
-10
1763
-73
1340-50
2785
-283
9
Form
atio
n
Utic
a Sh
.Utica
Sh.
Utic
a Sh
.Ut
ica
Sh.
Utic
a Sh
.Ut
ica
Sh.
Utic
a Sh
.Ut
ica
Sh.
Utic
a Sh
.Ut
ica
Sh.
Utic
a Sh
.Utica
Sh.
Utic
a Sh
.Ut
ica
Sh.
Reedsville S
h.Ci
ncin
nati
anSe
ries
Cinc
inna
tian
Seri
esCincinnatian
Seri
es
*Bas
al U
tica

Samp
le
IDOr
gani
c Carbon
S1
Mcr/
oro
Sz
Mcr/
crm
^
Mcf/
crm
TfC
Hydrogen
Index
Oxygen
Index
Production
Depth
(ft)
Index
Surface
(S)
Form
atio
nPENNSYLVANIA
*P P P P P P *p P P *P P P *P P P *p P P *P P P *P P P *P P P *P P P P
la Ib 1C Id 2a 2b 2c 3a 3b 3c 4a 4b 4c 5a 5b 5c 6a 6b 6c 7a 7b 7c 8a 8b 8c 9a 9b 9c 9d lOa
lOb
0.97
1.01
0.18
1.04
0.34
2.02
2.40
0.54
1.81
2.18
0.19
2.10
1.53
0.33
1.96
1.33
0.14
1.30
2.97
1.07
1.56
1.81
0.35
0.74
2.78
0.19
2.07
3.89
2.88
0.26
0.38
0.46
0.50
0.04
0.43
0.20
0.79
1.73
0.18
0.83
1.45
0.03
0.68
0.41
0.07
0.73
0.47
0.02
0.08
0.24
0.10
0.12
0.28
0.08
0.25
0.61
0.02
0.18
0.42
0.23
0.03
0.05
1.77
1.55
0.21
1.49
1.08
3.79
5.51
0.73
2.37
3.14
0.30
1.80
1.47
0.31
1.96
1.36
0.12
0.44
0.44
0.29
0.37
0.68
0.57
1.08
1.37
0.18
0.42
0.27
0.47
0.25
0.33
0.45
0.52
0.38
0.37
0.54
0.68
0.80
0.78
0.65
0.82
0.30
0.43
0.66
0.80
0.87
0.77
0.33
0.44
0.37
0.51
0.33
0.62
0.41
0.36
0.55
0.24
0.51
0.67
0.61
0.38
0.41
440
440
447
439
426
434
436
453
432
436
494
449
447
442
442
526
524
418
446
t
.55
3602
1
'49
351
5
578
563
182
153
116
143
317
187
229
135
130
144
157 85 96 93 100
102 85 33 14
..27 23 37 162
145 49 94 20 6 16 96 86
46 51 211 35 158 33 33 144 35 37 157 20 43 242 44 57 235 33 12 47 21 34 117 48 19 126 24 17 21 146
107
0.21
0.25
0.17
0.22
0.16
0.17
0.24
0.20
0.26
0.32
0.09
0.27
0.22
0.18
0.27
0.26
0.14
0.15
0.35
0.26
0.25
0.29
0.12
0.19
0.31
0.10
0.30
0.62
0.33
0.11
0.13
4320-30
4180-90
3860-70
4180
-435
039
73-8
24305-18
4372
-82
5126
-36
5246-56
5551-61
5980
-90
6380-90
6570-80
6470-80
6680-90
6720-30
8112
-27
8504
-13
8770
-84
8057
-66
8103-08
8272-82
8600-10
8730-40
9000-10
1156
0-70
1180
0-10
1207
0-80
11950-12110
14610-20
1480
0-10
Utica
Sh. (A
ntes
)Utica
Sh. (Antes)
Reedsville S
h.Ut
ica
Sh. (Antes)
Reedsville S
h.Utica
Sh. (A
ntes
)Ut
ica
Sh. (Antes)
Reedsville S
h.Ut
ica
Sh. (A
ntes
)Utica
Sh. (Antes)
Reedsville S
h.Ut
ica
Sh. (A
ntes
)Utica
Sh. (Antes)
Reedsville S
h.Utica
Sh. (A
ntes
)Ut
ica
Sh. (Antes)
Reedsville S
h.Ut
ica
Sh. (Antes)
Utic
a Sh
. (A
ntes
)Reedsville S
h.Ut
ica
Sh. (A
ntes
)Ut
ica
Sh. (A
ntes
)Reedsville S
h.Ut
ica
Sh. (A
ntes
)Ut
ica
Sh. (Antes)
Reedsville S
h.Ut
ica
Sh. (A
ntes
)Ut
ica
Sh. (A
ntes
)Ut
ica
Sh. (Antes)
Reedsville S
h.Ut
ica
Sh. (Antes)
*Bas
al U
tica

Samp
le
ID
*P l
OcP
lOd
P lla
P li
b*P
lie
P 12a
P 12
b*P
12c
P 13
aP
IJb
*P 1
3eP
13d
P 14a
P 14
b*P
14c
P 15
aP
15b
P 15c
P 16
P 17
P 18
P ly
Orga
nic
Carbon
1.93
1.61
0.73
0.71
2.18
1.98
3.48
2.36
0.36
0.80
1.32
1.59
0.19
1.00
2.66
2.65
0.17
0.13
2.46
2.02
0.26
2.49
S1
Mcr/
qrn
0.56
0.16
0.16
0.09
0.24
0.24
0.41
0.36
0.17
0.16
0.28
0.50
0.06
0.37
0.43
0.480 0
0.06
0.030
0.06
S2
Mcr/
cm
0.90
0.42
1.33
0.83
1.05
0.68
0.93
1.01
0.32
0.33
0.47
0.53
0.32
0.41
0.42
3.160
0.03
0.10
0.080
0.13
Mcr/qm
0.95
0.51
0.58
0.55
0.82
0.56
0.63
0.75
0.43
0.28
0.40
0.43
0.73
0.41
0.52
0.14
0.06
0.06
0.41
0.24
0.04
0.47
Hydr
ogen
T^C
Inde
x
46497
26
182
116 48 34 26 42
412
88
41
35
33 168 41 15
452
119
023
595
4585
3 0597
* 5
Oxygen
Index
49 31 79 77 37 28 18 31 119 35 30 27
384 41 19 5 35 46 16 11 15 18
Production
Index
0.38
0.28
0.11
0.10
0.19
0.26
0.31
0.26
0.35
0.33
0.38
0.49
0.16
0.47
0.51
0.130 0
0.37
0.300
0.33
Dept
h (f
t)
Surf
ace
(S)
1540
0-10
15150-15470
6800
-10
7100-10
7620
-30
3230
-40
3510-20
3780
-90
5103-12
5286-5301
5408-19
5584
-95
1344
0-50
1398
0-90
1421
0-20
S S S S S S S*Basal Uti
ca
Form
atio
n
Utic
a Sh
. (Antes)
Utic
a Sh. (A
ntes
)Re
edsv
ille
Sh.
Utica
Sh. (Antes)
Utica
Sh. (A
ntes
)Utica
Sh. (A
ntes
)Utica
Sh. (A
ntes
)Utica
Sh. (A
ntes
)Ut
ica
Sh. (A
ntes
)Utica
Sh. (Antes)
Utica
Sh. (Antes)
Tren
ton
Gp.
Reed
svil
le S
h.Utica
Sh. (A
ntes
)Ut
ica
Sh. (Antes)
Utic
a Sh
. (Antes)
Utica
Sh. (Antes)
Reed
svil
le S
h.Ut
ica
Sh. (A
ntes
)Ut
ica
Sh. (Antes)
Utic
a Sh
. (A
ntes
)Utica
Sh. (Antes)

ANALYSIS OF ORDOVICIAN SHALES
RICH IN ORGANIC MATTER
Sample
IDOr
gani
c Ca
rbon
S1
Mcr/qm
S2
Mcr/qm
S3
Mcr/qm
T°C
Hydrogen
Inde
x WEST
Oxyg
en
Inde
xVIRGINIA
Production
Inde
xDe
pth
(ft)
Su
rfac
e (S)
Form
atio
n
W l
a *W
V lb
WV 2a
WV 2b
WV 2
cWV 3
a*WV
3bWV
4a
*WV
4b*WV
5a
WV 5
b WV
6a
*WV
6b*WV
7aWV 7
bWV
8a
*WV
8bWV 8c
0.21
0.
211.62
3.36
2.10
0.30
3.85
0.17
1.54
0.35
0.23
0.
250.
252.
250.26
0.22
0.40
0.44
0.11
0.11
0.45
1.
080.
450.
070.
990.14
0.26
0.03
0.
05
0.07
0.05
0.32
0.02
0.10
0.13
0.14
0.68
0.54
0.57
1.86
0.52
0.22
1.06
0.45
0.43
0.09
0.14
0.11
0.05
0.41
0.05
0.18
0.
270.
19
0.75
0.
720.83
3.35
0.92
0.50
1.74
0.45
0.50
0.25
0.47
0.34
0.34
0.57
0.42
0.38
0.37
0.44
427
507
419
437
465
437
323
257 35
55 24 73 27264 27 25
60
44 20 18. 19
* 81
67 43
357
342 51
99 43 166 45 264 32 71
204
136
136 25 161
172 92 100
0.14
0.
170.
44
0.37
0.47
0.25
0.49
0.24
0.38
0.25
0.28
0.39
0.50
0.44
0.33
0.36
0.32
0.44
5300-50
5660-5710
8680-8710
8930-60
8800
-10
12680-710
13040-60
12140-360
12780-870
11750-70
1093
0-80
8310-30
8460-70
1397
0-90
1350
0-30
8505-25
8845-65
8785-8815
*Basal Uti
ca
Martinsburg
Sh.
Utic
a Sh.
Mart
insb
urg
Sh.
Utic
a Sh.
Utica
Sh.
Utic
a Sh
.Utica
Sh.
Utic
a Sh
.Utica
Sh.
Martinsburg
Sh.
Martinsburg
Sh.
Utica
Sh.
Utic
a Sh.
Utic
a Sh.
Utica
Sh.
Mart
ings
burg
Sh.
Ut
ica
Sh.
Utic
a Sh.