Petroleum Markets “The meek shall inherit the Earth, but not the mineral rights.” - J. Paul...
31
Petroleum Markets “The meek shall inherit the Earth, but not the mineral rights.” - J. Paul Getty
-
Upload
roberto-killman -
Category
Documents
-
view
220 -
download
0
Transcript of Petroleum Markets “The meek shall inherit the Earth, but not the mineral rights.” - J. Paul...
Petroleum Markets“The meek shall inherit the Earth, but not the mineral rights.”
- J. Paul Getty
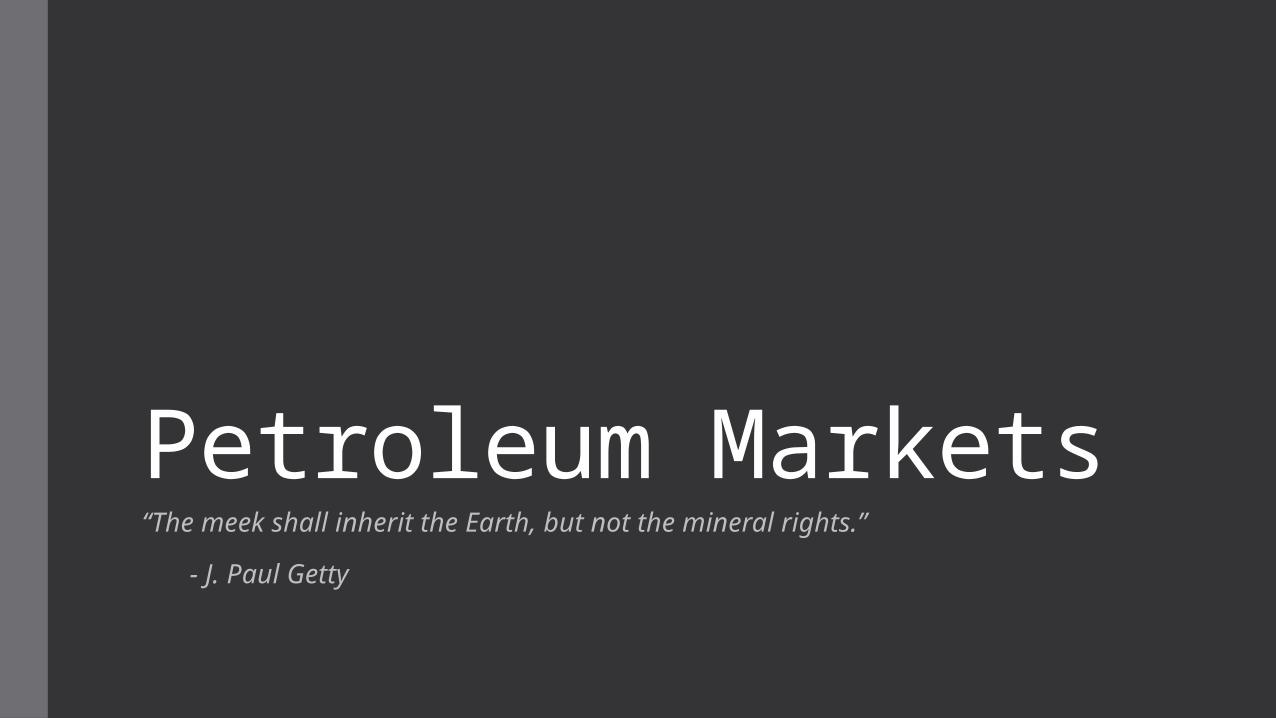
Agenda• Resource assessments
Crude Oil Natural Gas
• Natural Gas Value Chain
• Key Market Issues Shifting demand – power generation Shifting supply – reversal of producing/consuming regions Firm vs. Interruptible Rates
• Regulatory Framework & Emerging Issues Federal Regulation Inter-fuel competition Full-Fuel Cycle Analysis

Resource AssessmentOil vs. Gas
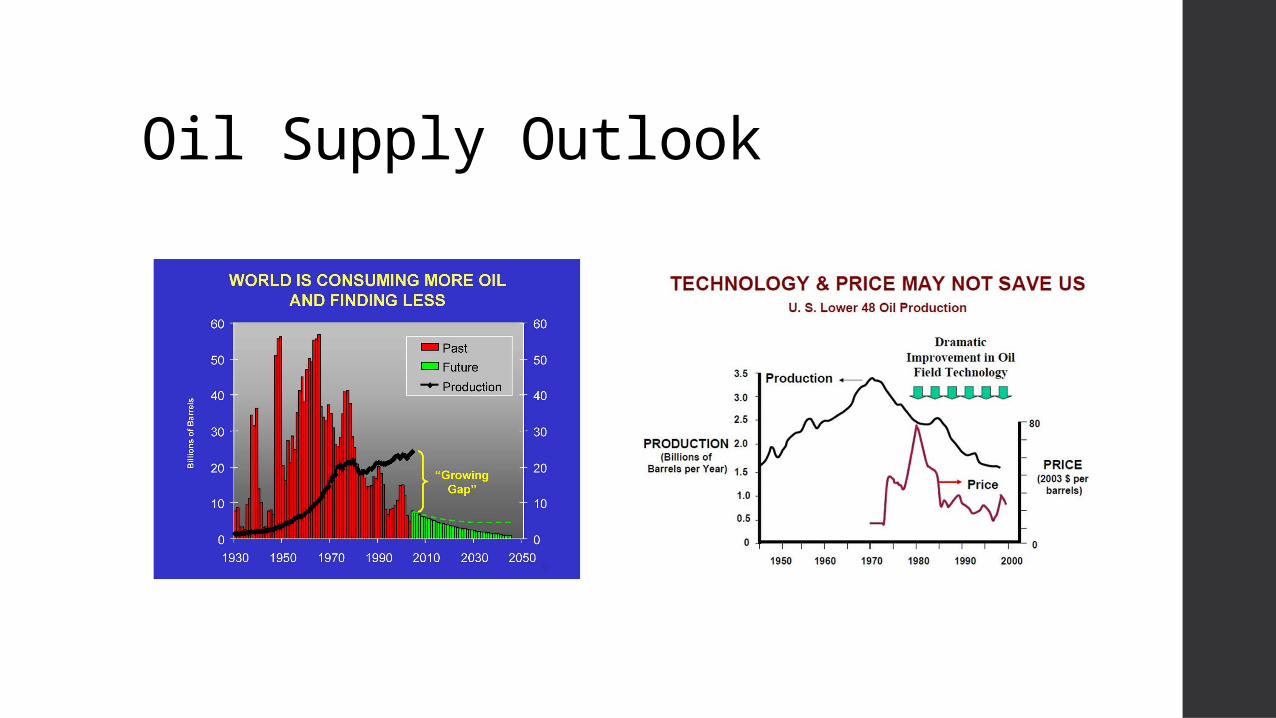
Oil Supply Outlook
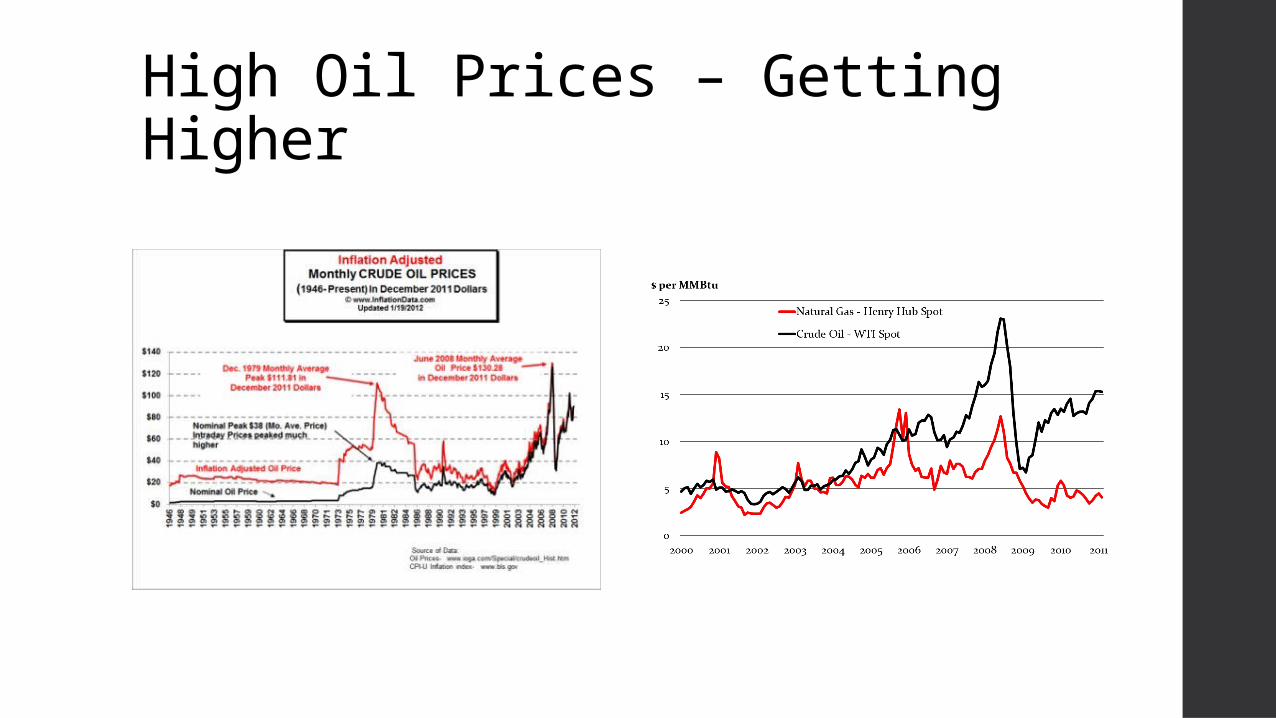
High Oil Prices – Getting Higher
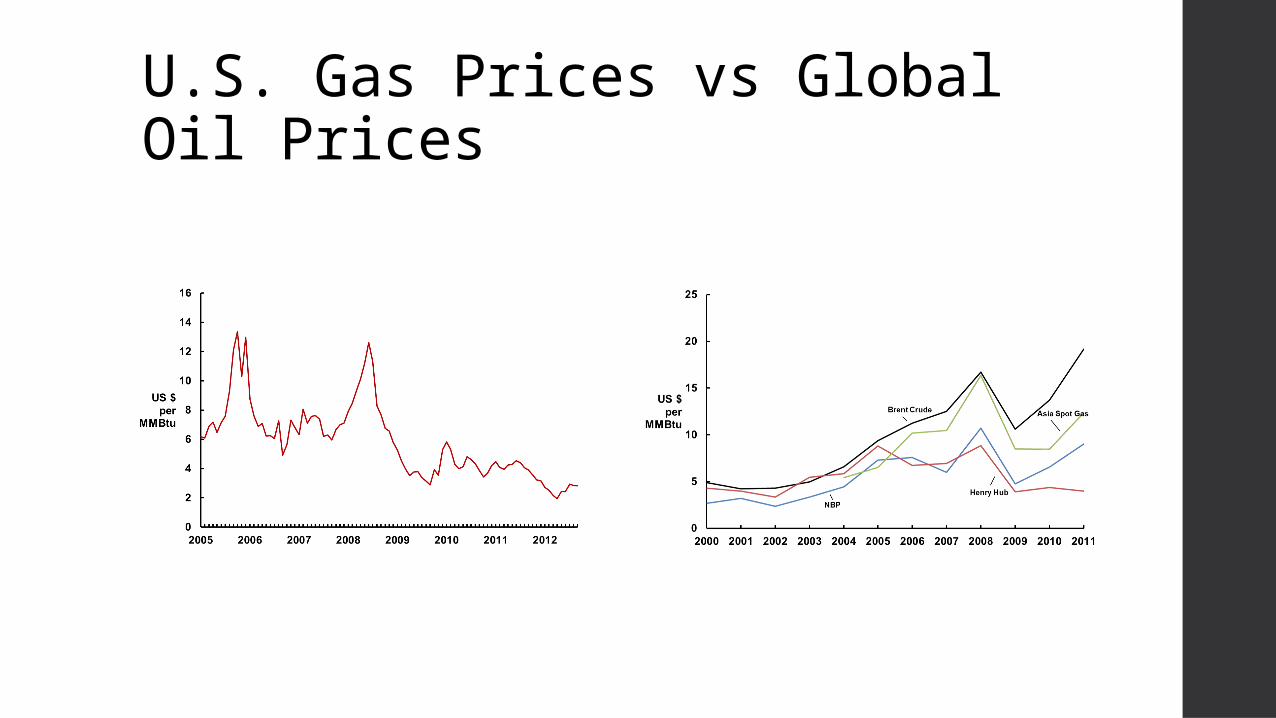
U.S. Gas Prices vs Global Oil Prices
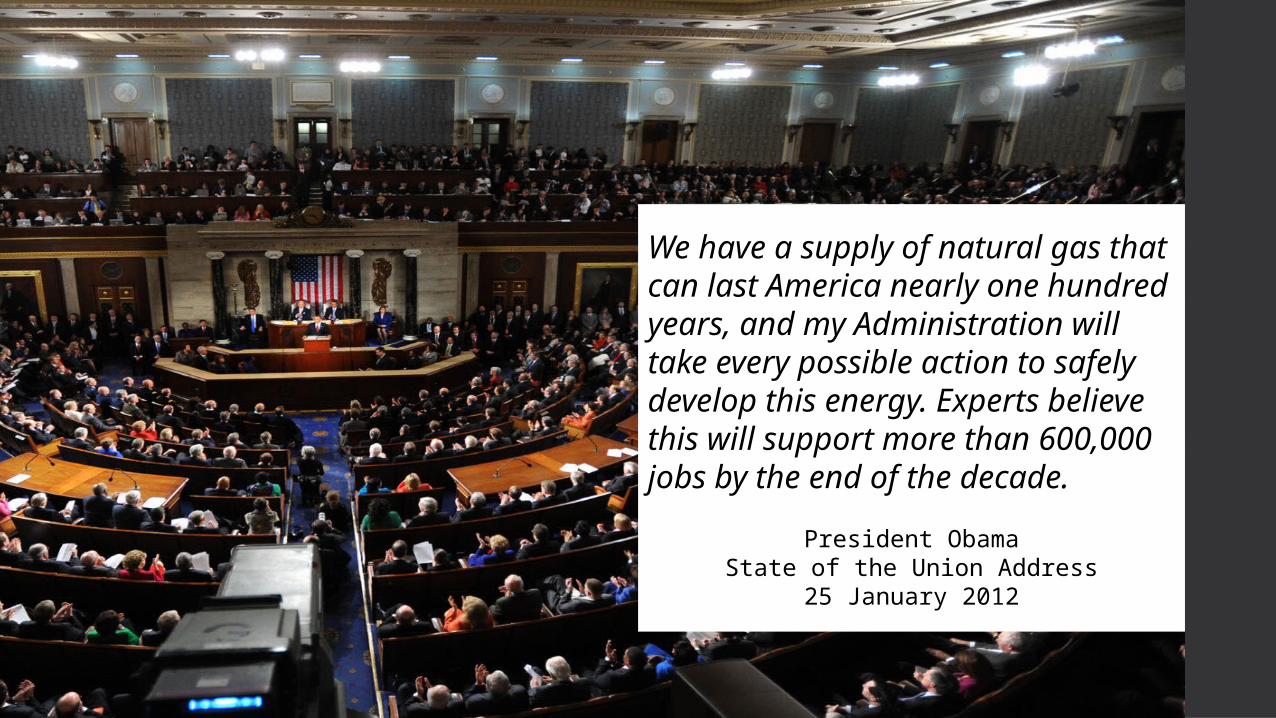
We have a supply of natural gas that can last America nearly one hundred years, and my Administration will take every possible action to safely develop this energy. Experts believe this will support more than 600,000 jobs by the end of the decade.
President ObamaState of the Union Address
25 January 2012
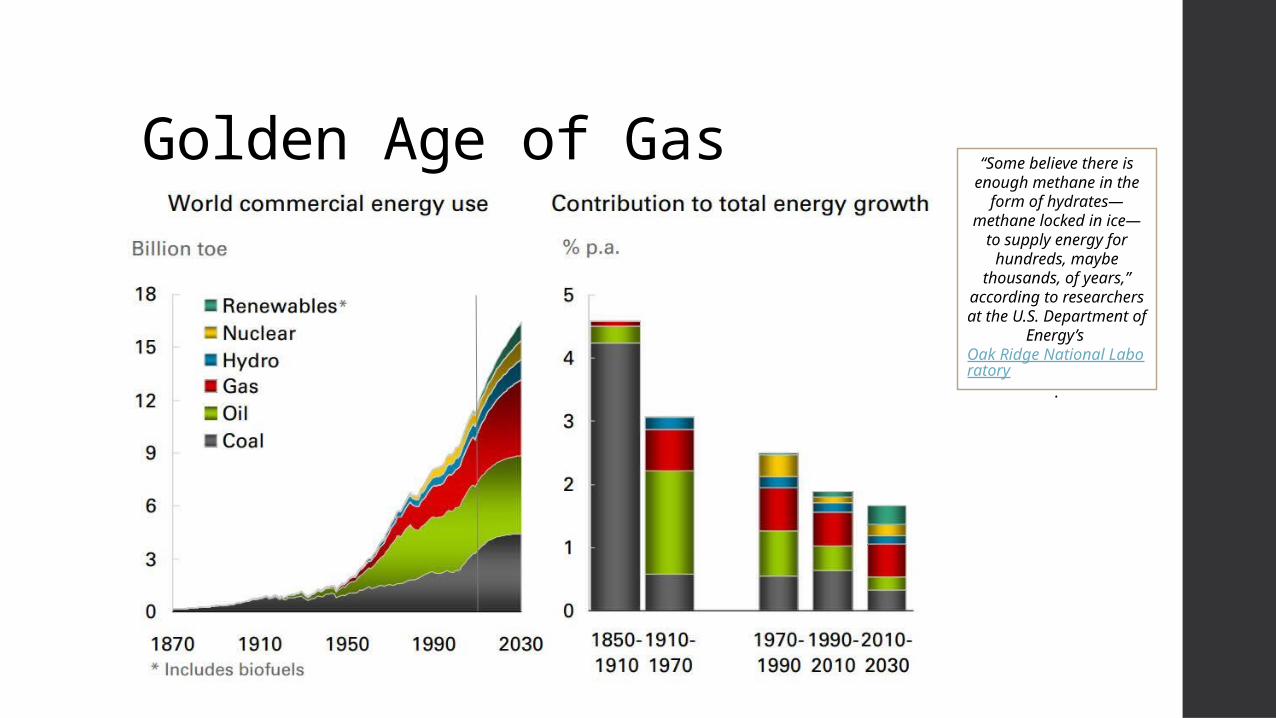
Golden Age of Gas “Some believe there is enough methane in the form of hydrates—methane locked in ice—to supply energy for hundreds, maybe thousands, of years,”
according to researchers at the U.S. Department of
Energy’s Oak Ridge National Laboratory
.
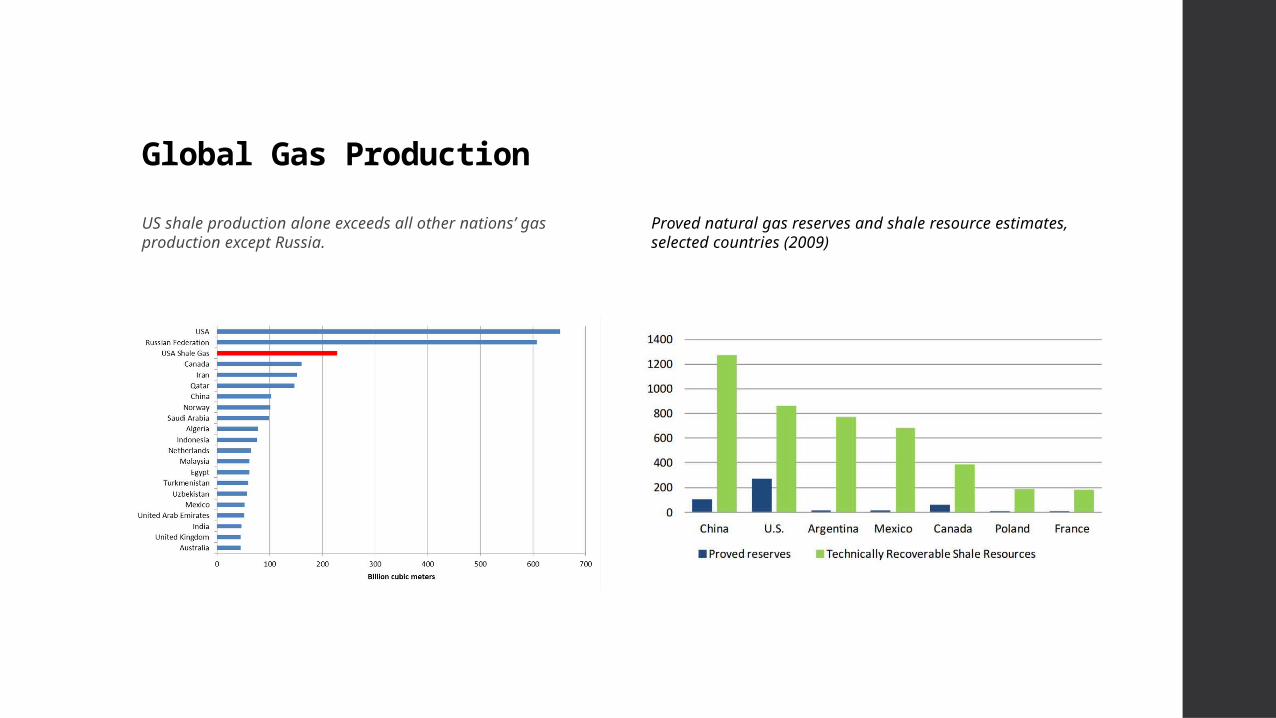
Global Gas Production
US shale production alone exceeds all other nations’ gas production except Russia.
Proved natural gas reserves and shale resource estimates, selected countries (2009)
World Energy Outlook (WEO) 2012• North America is at the forefront of a sweeping transformation in oil
and gas production that will affect all regions of the world, yet the potential also exists for a similarly transformative shift in global energy efficiency
• The WEO finds that the extraordinary growth in oil and natural gas output in the United States will mean a sea-change in global energy flows. In the New Policies Scenario, the WEO’s central scenario, the United States becomes a net exporter of natural gas by 2020 and is almost self-sufficient in energy, in net terms, by 2035.
• North America emerges as a net oil exporter, accelerating the switch in direction of international oil trade, with almost 90% of Middle Eastern oil exports being drawn to Asia by 2035.

Natural Gas Value ChainUpstreamMidstreamDownstream
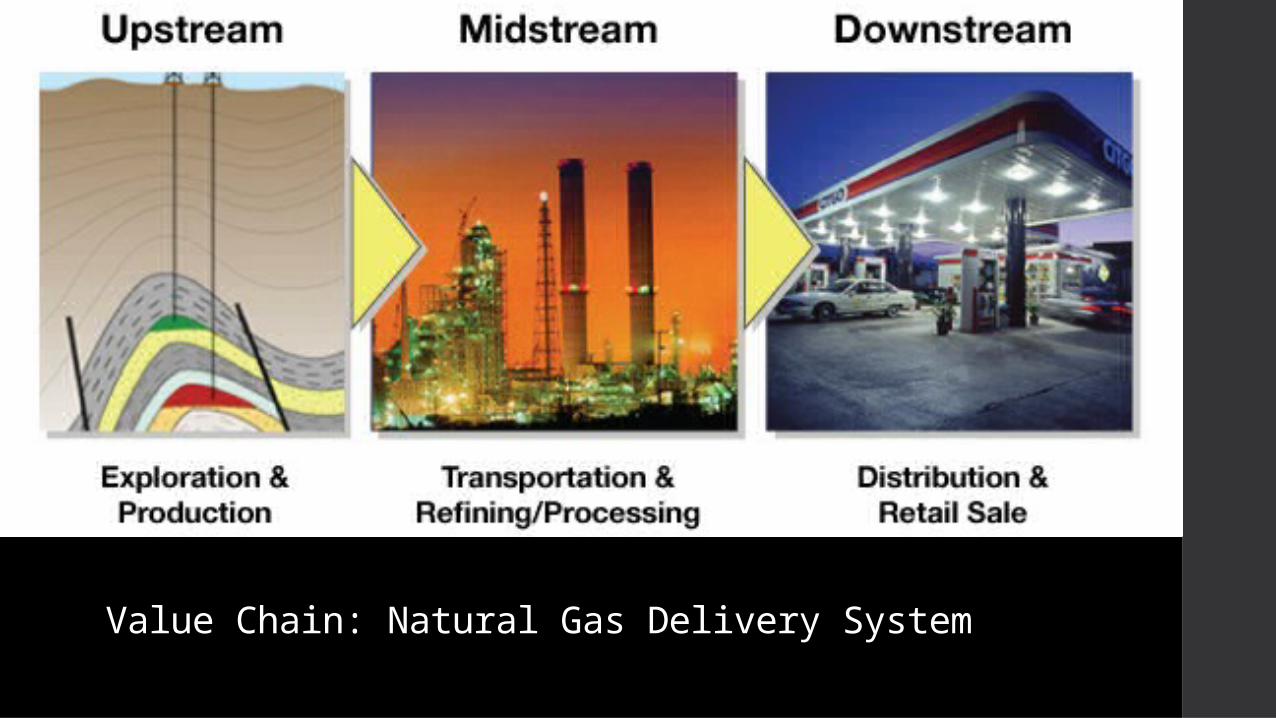
Value Chain: Natural Gas Delivery System
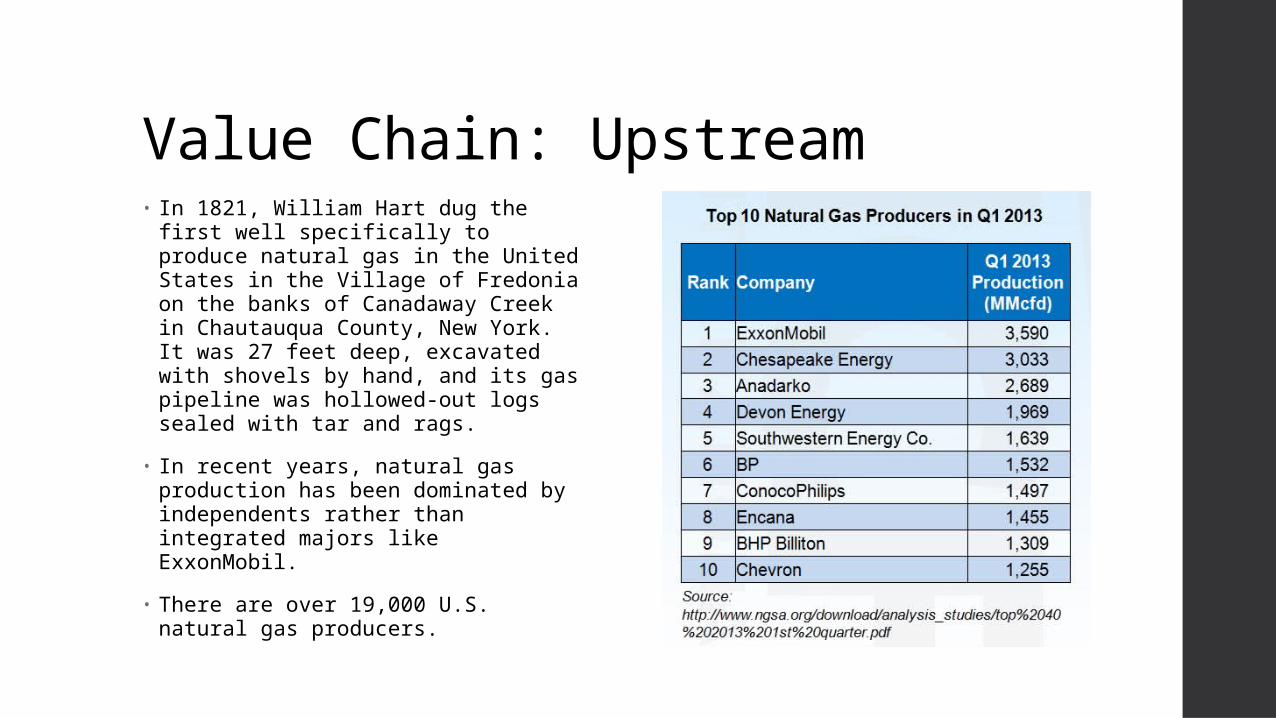
Value Chain: Upstream• In 1821, William Hart dug the first
well specifically to produce natural gas in the United States in the Village of Fredonia on the banks of Canadaway Creek in Chautauqua County, New York. It was 27 feet deep, excavated with shovels by hand, and its gas pipeline was hollowed-out logs sealed with tar and rags.
• In recent years, natural gas production has been dominated by independents rather than integrated majors like ExxonMobil.
• There are over 19,000 U.S. natural gas producers.
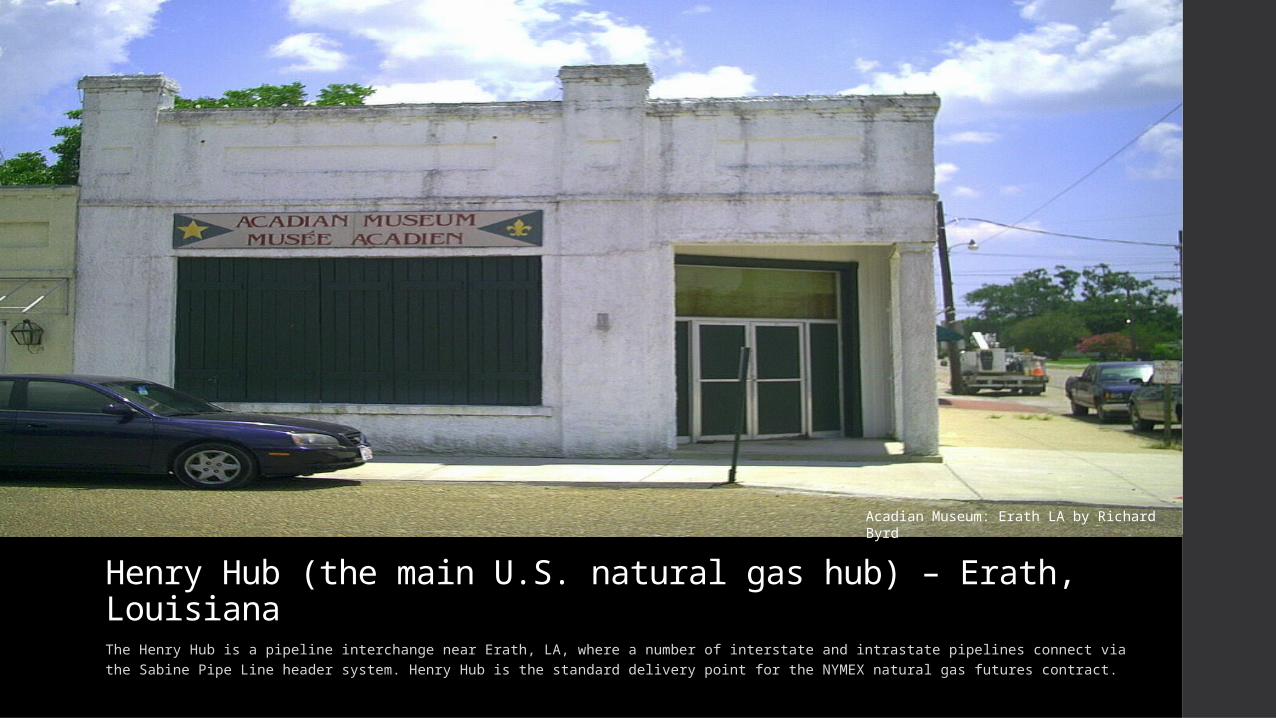
Henry Hub (the main U.S. natural gas hub) – Erath, LouisianaThe Henry Hub is a pipeline interchange near Erath, LA, where a number of interstate and intrastate pipelines connect via the Sabine Pipe Line header system. Henry Hub is the standard delivery point for the NYMEX natural gas futures contract.
Acadian Museum: Erath LA by Richard Byrd
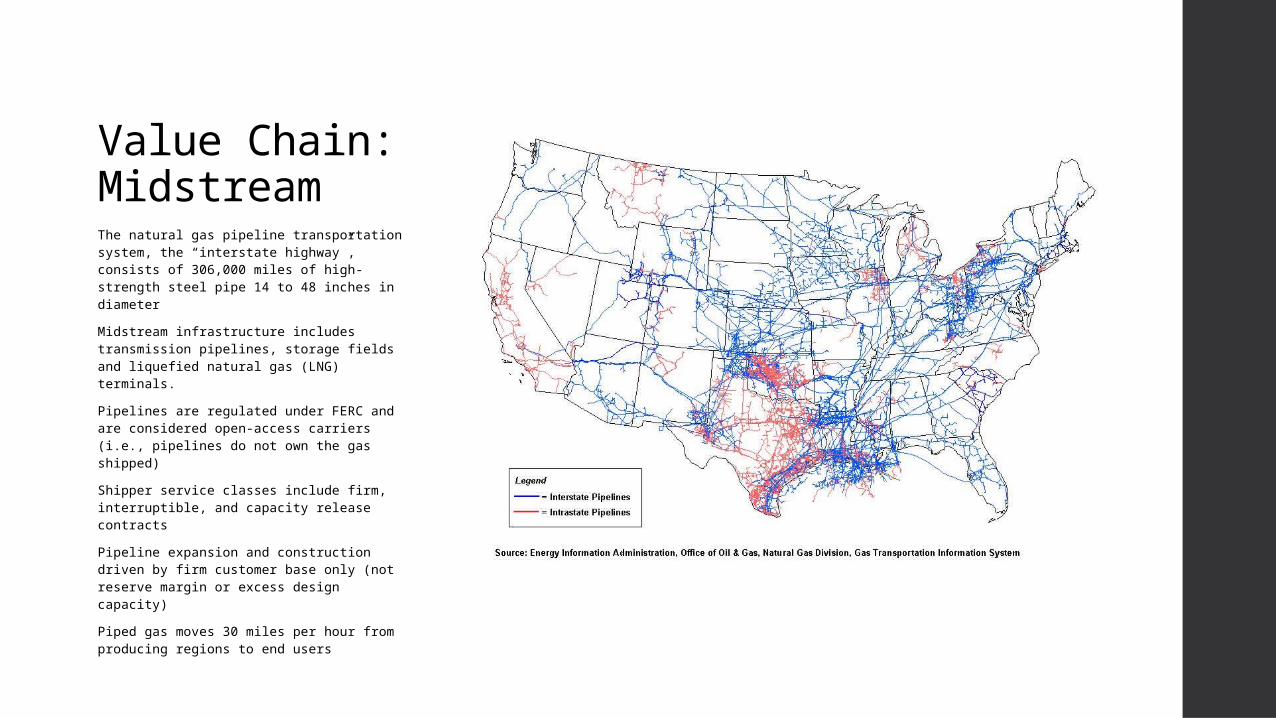
Value Chain: MidstreamThe natural gas pipeline transportation system, the “interstate highway”, consists of 306,000 miles of high-strength steel pipe 14 to 48 inches in diameter
Midstream infrastructure includes transmission pipelines, storage fields and liquefied natural gas (LNG) terminals.
Pipelines are regulated under FERC and are considered open-access carriers (i.e., pipelines do not own the gas shipped)
Shipper service classes include firm, interruptible, and capacity release contracts
Pipeline expansion and construction driven by firm customer base only (not reserve margin or excess design capacity)
Piped gas moves 30 miles per hour from producing regions to end users
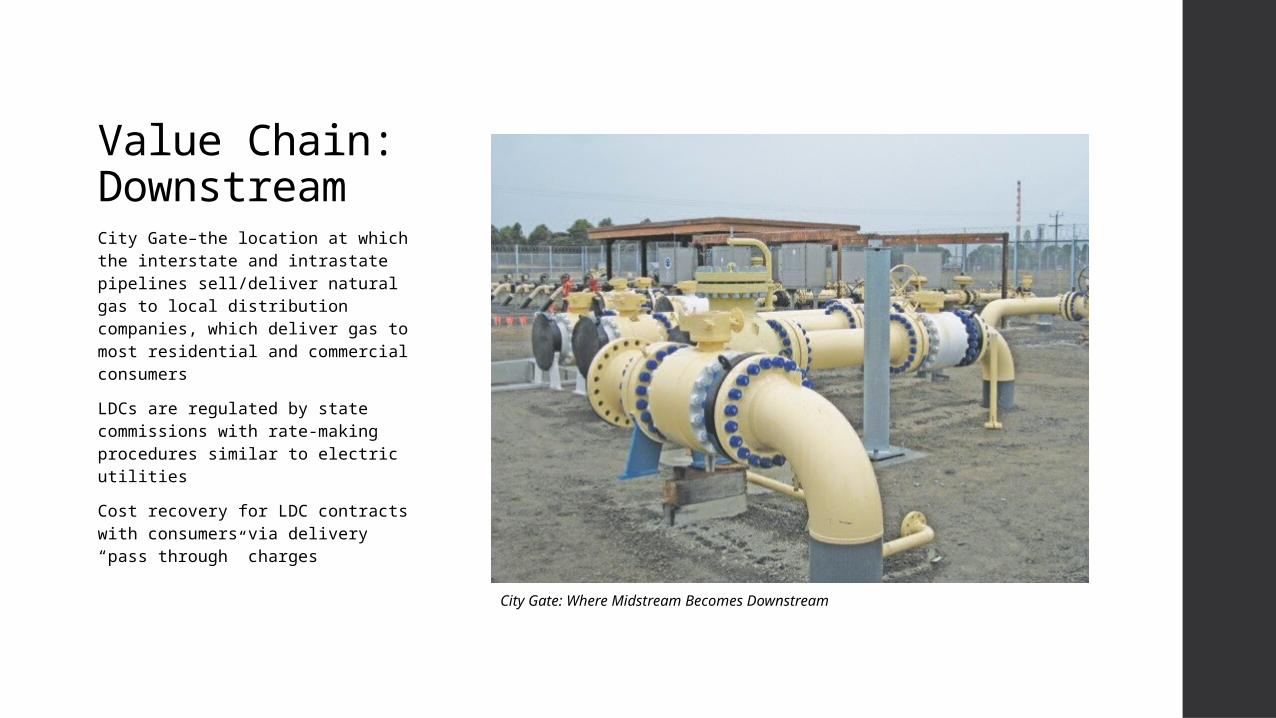
Value Chain: DownstreamCity Gate–the location at which the interstate and intrastate pipelines sell/deliver natural gas to local distribution companies, which deliver gas to most residential and commercial consumers
LDCs are regulated by state commissions with rate-making procedures similar to electric utilities
Cost recovery for LDC contracts with consumers via delivery “pass through” charges City Gate: Where Midstream Becomes Downstream
Key Market IssuesShifting demand – power generation
Shifting supply – reversal of producing/consuming regions
Firm vs. Interruptible Rates
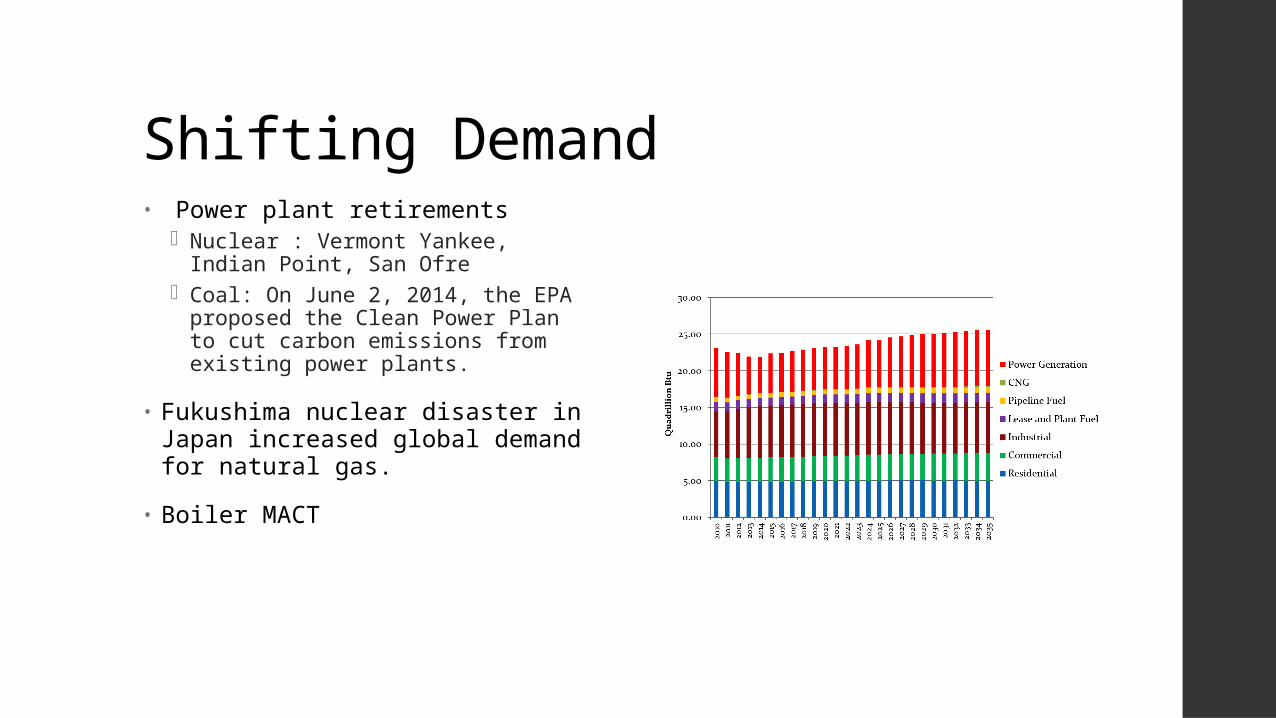
Shifting Demand• Power plant retirements
Nuclear : Vermont Yankee, Indian Point, San Ofre
Coal: On June 2, 2014, the EPA proposed the Clean Power Plan to cut carbon emissions from existing power plants.
• Fukushima nuclear disaster in Japan increased global demand for natural gas.
• Boiler MACT
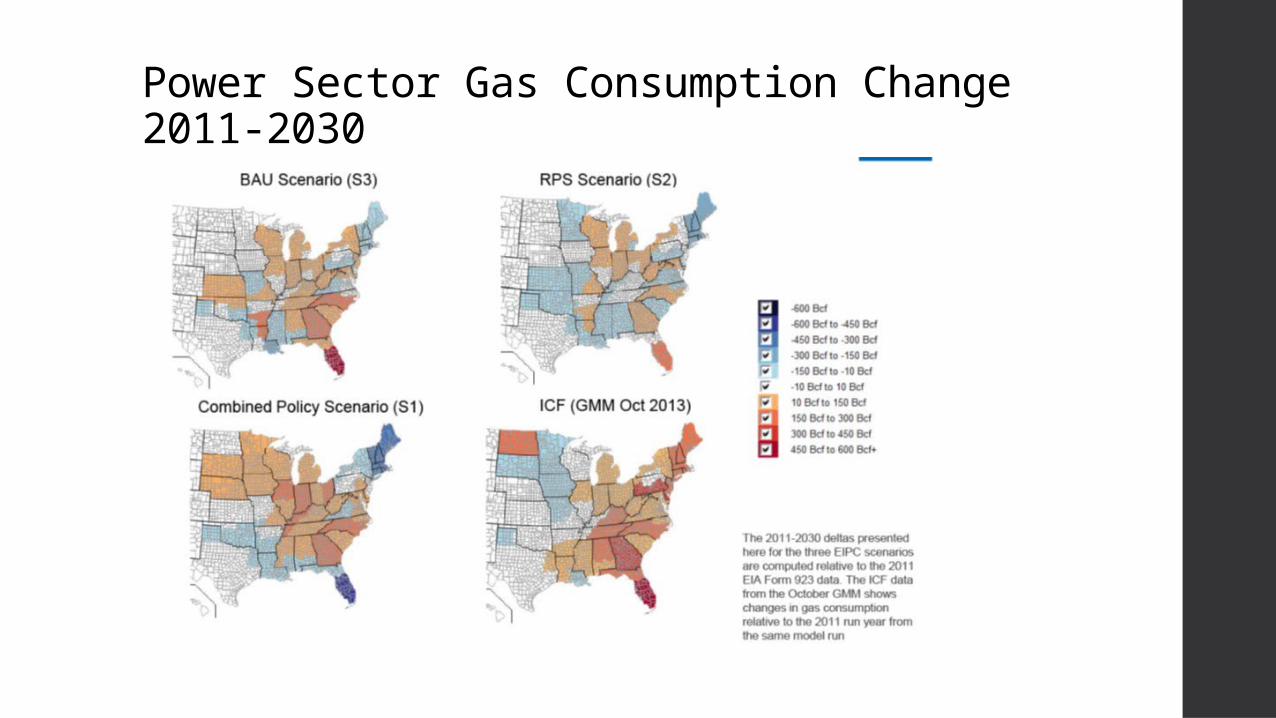
Power Sector Gas Consumption Change 2011-2030
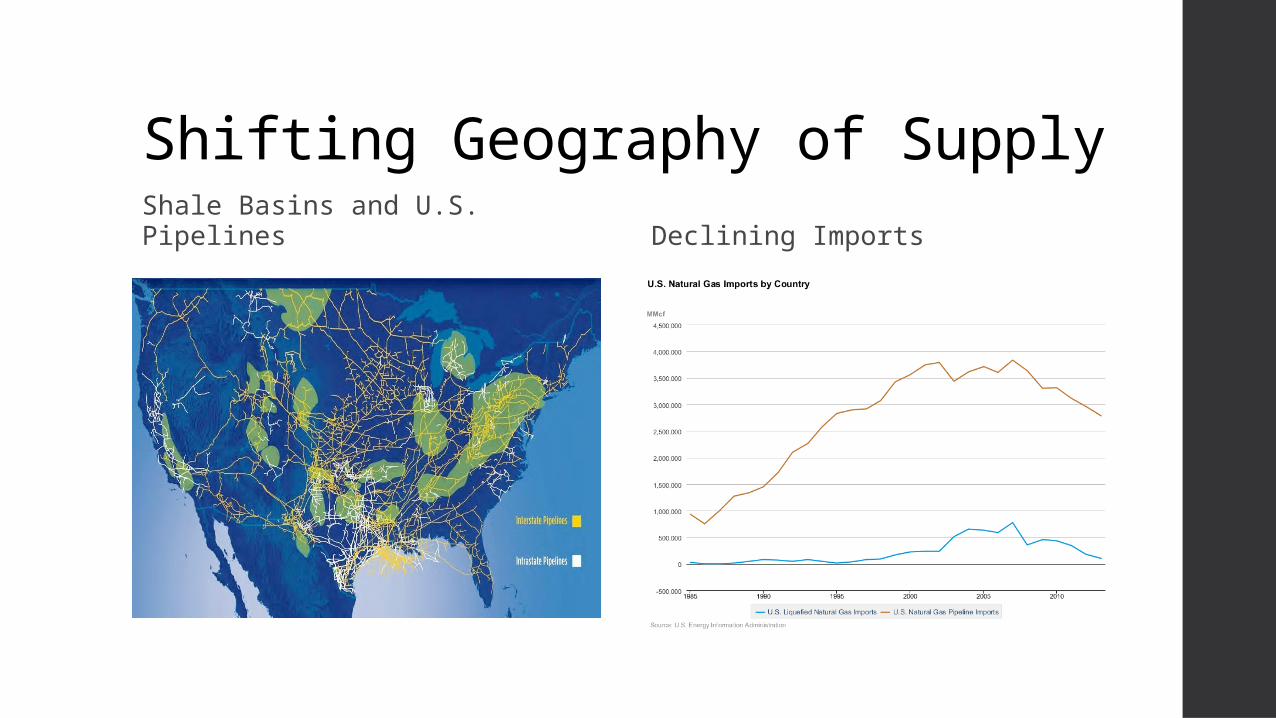
Shifting Geography of Supply
Shale Basins and U.S. Pipelines Declining Imports
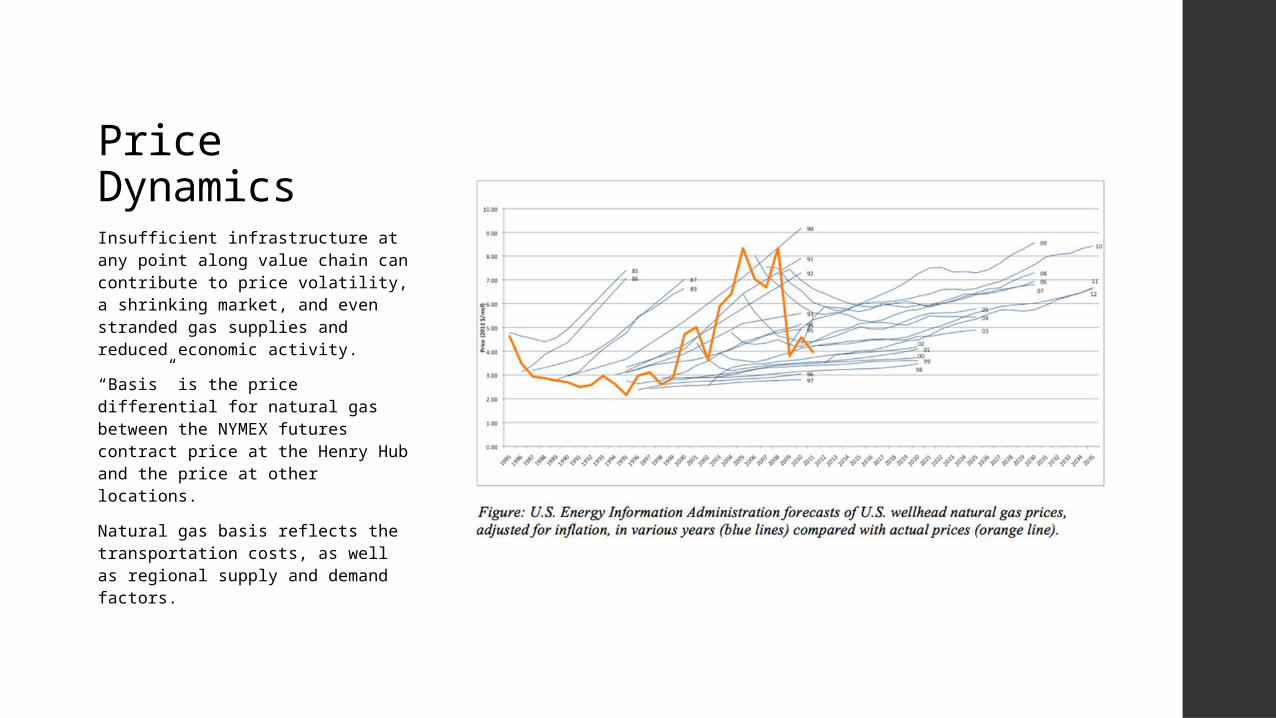
Price Dynamics Insufficient infrastructure at any point along value chain can contribute to price volatility, a shrinking market, and even stranded gas supplies and reduced economic activity.
“Basis” is the price differential for natural gas between the NYMEX futures contract price at the Henry Hub and the price at other locations.
Natural gas basis reflects the transportation costs, as well as regional supply and demand factors.

Infrastructure Constraints
Constraints on gas supply into New England due to: 1) decline of Atlantic Canada supplies and LNG Imports, 2) increased demand, and 3) no new infrastructure to bring supplies to New England
Source: Platt’s Daily January 22, 2014
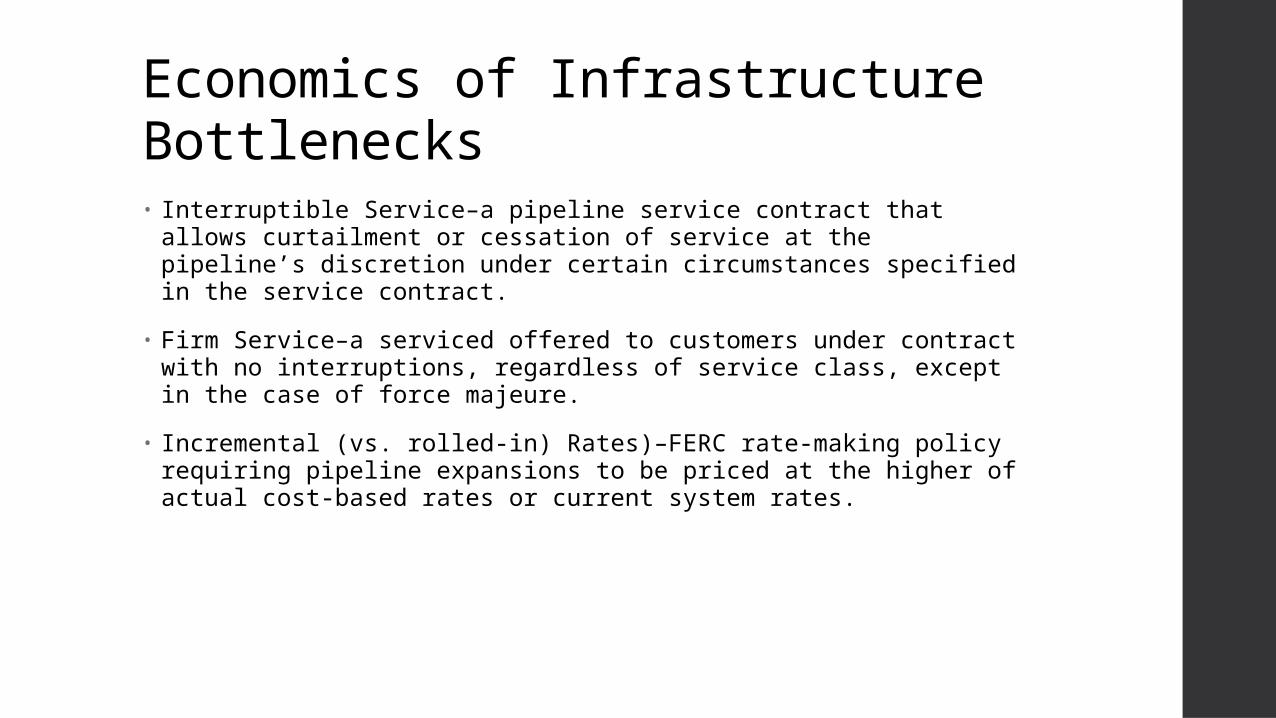
Economics of Infrastructure Bottlenecks • Interruptible Service–a pipeline service contract that allows
curtailment or cessation of service at the pipeline’s discretion under certain circumstances specified in the service contract.
• Firm Service–a serviced offered to customers under contract with no interruptions, regardless of service class, except in the case of force majeure.
• Incremental (vs. rolled-in) Rates)–FERC rate-making policy requiring pipeline expansions to be priced at the higher of actual cost-based rates or current system rates.
Regulatory Framework & Emerging IssuesHistory of federal regulation
Inter-fuel competition
Full-Fuel Cycle Analysis
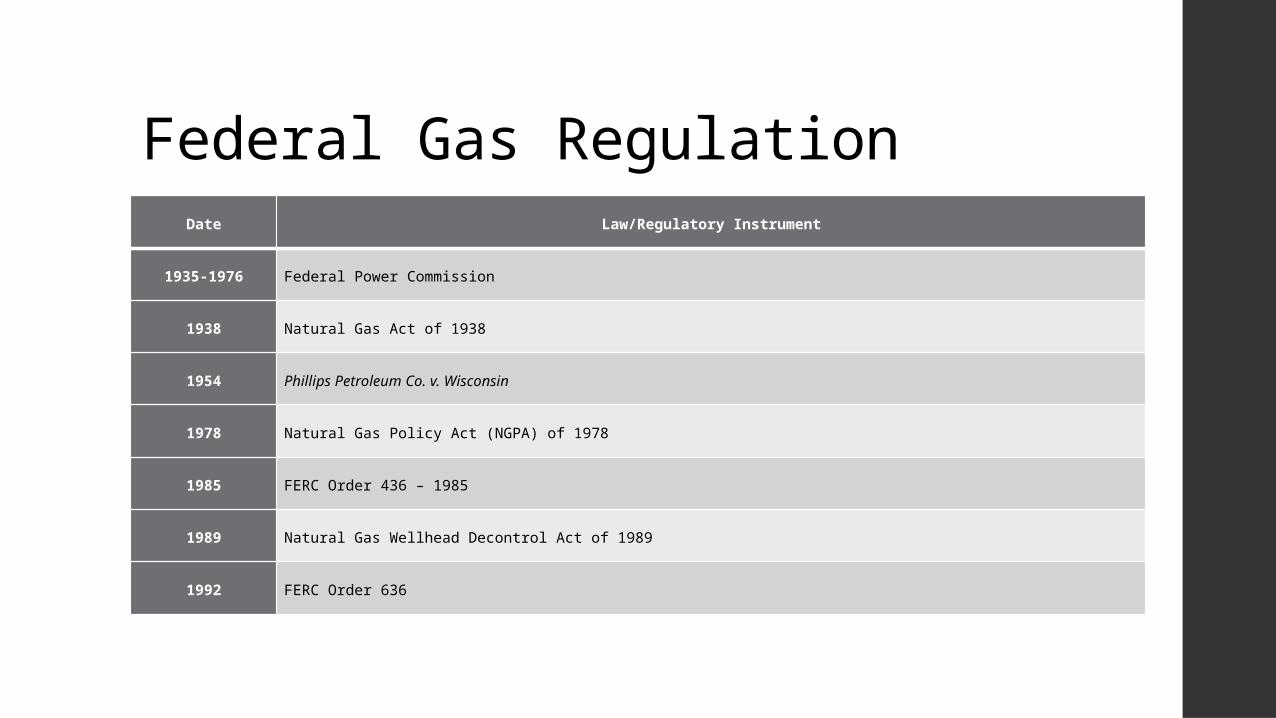
Federal Gas RegulationDate Law/Regulatory Instrument
1935-1976 Federal Power Commission
1938 Natural Gas Act of 1938
1954 Phillips Petroleum Co. v. Wisconsin
1978 Natural Gas Policy Act (NGPA) of 1978
1985 FERC Order 436 – 1985
1989 Natural Gas Wellhead Decontrol Act of 1989
1992 FERC Order 636
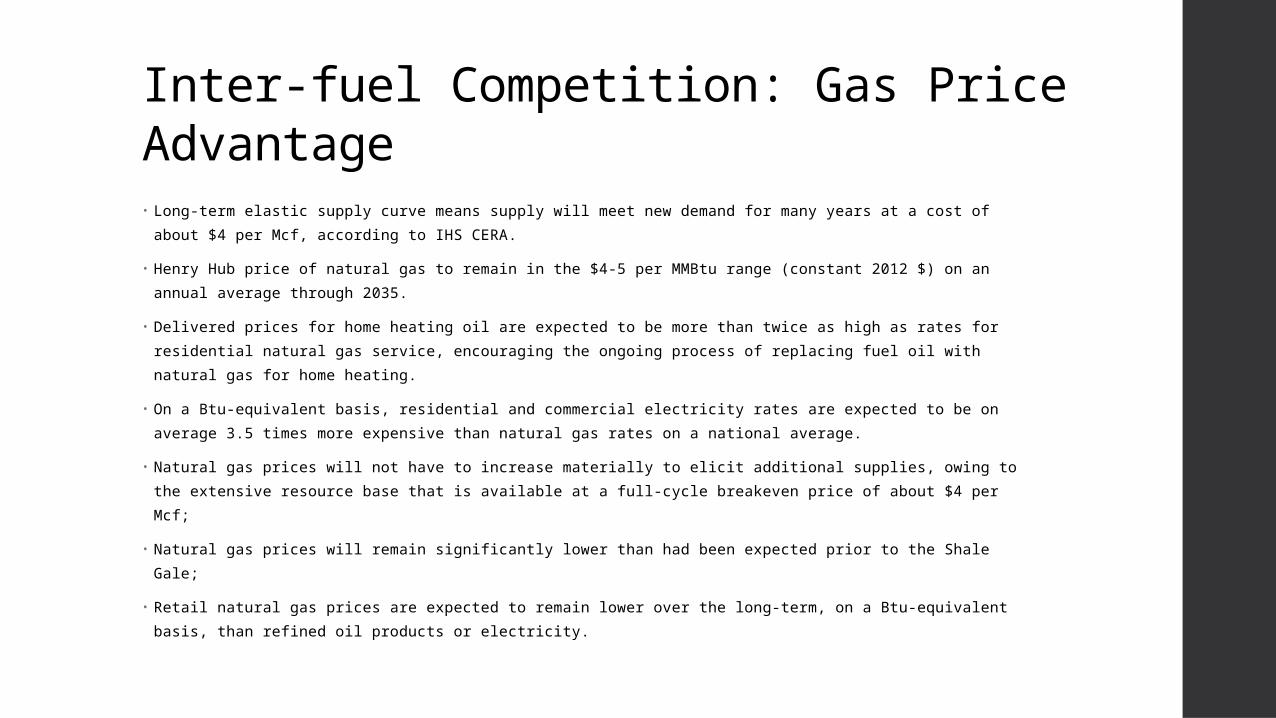
Inter-fuel Competition: Gas Price Advantage• Long-term elastic supply curve means supply will meet new demand for many years at a cost of
about $4 per Mcf, according to IHS CERA.
• Henry Hub price of natural gas to remain in the $4-5 per MMBtu range (constant 2012 $) on an annual average through 2035.
• Delivered prices for home heating oil are expected to be more than twice as high as rates for residential natural gas service, encouraging the ongoing process of replacing fuel oil with natural gas for home heating.
• On a Btu-equivalent basis, residential and commercial electricity rates are expected to be on average 3.5 times more expensive than natural gas rates on a national average.
• Natural gas prices will not have to increase materially to elicit additional supplies, owing to the extensive resource base that is available at a full-cycle breakeven price of about $4 per Mcf;
• Natural gas prices will remain significantly lower than had been expected prior to the Shale Gale;
• Retail natural gas prices are expected to remain lower over the long-term, on a Btu-equivalent basis, than refined oil products or electricity.
The Durst ExperienceWhen did you first experiment with co-gen power?
• Jody Durst: Our first experience with distributed generation was with our installation of fuel cells at 4 Times Square in 1999.
And what was the hurdle to using it in an office building?
• Jody Durst: There were cost challenges, but the biggest hurdle was getting acceptance from Con Edison.
What was Con Edison’s fear?
• Douglas Durst: Con Edison makes its money now by transporting electricity so if you’re generating it on site they don’t get paid. And they didn’t like to think about a world where all building owners generate their own power over the course of Manhattan’s 400 million square feet of office space.
Have they since warmed up to the idea?
• Jody Durst: No, not really. We experienced the same sort of hurdles from them with subsequent co-gen installations.
Source: Jotham Sederstrom, “The Power Generator, The Commercial Observer, March 13, 2012
Full-Fuel Cycle Regulations • Extant natural gas regulation was developed in a time of perceived scarcity and is poorly designed for
today’s and tomorrow’s gas markets.
• Full fuel-cycle analysis more accurately assesses impact of natural gas of vis-à-vis emissions and costs of energy.
• Many states have implemented revenue decoupling adjustments to assure gas LDCs that they can recover their fixed costs even if energy efficiency efforts reduce natural gas throughput on their systems. These adjustments are intended to make a gas LDC indifferent to changes in the amount of natural gas delivered on its system. decoupling programs to encourage the adoption of full fuel-cycle energy efficiency goals which could result in increased direct use of natural gas, thereby reducing total energy consumption.
• Residential gas and electric prices reflect full fuel-cycle costs: residential electric prices are substantially higher than residential natural gas prices because electric prices include the generating cost of converting natural gas, coal, oil and nuclear fuel into electricity.
• The higher the ratio to gas prices to electric prices, the easier for natural gas to displace electricity. In 2011, the ratio of residential electric retail prices to residential gas prices ranged from a low of 2.2 in the Pacific Northwest to a high of 3.7 in the Middle Atlantic. The ratio of average projected electric residential prices to average projected residential natural gas prices for 2012-35 ranges from a low of 2.5 for the Pacific Northwest to a high of 5.2 for California.
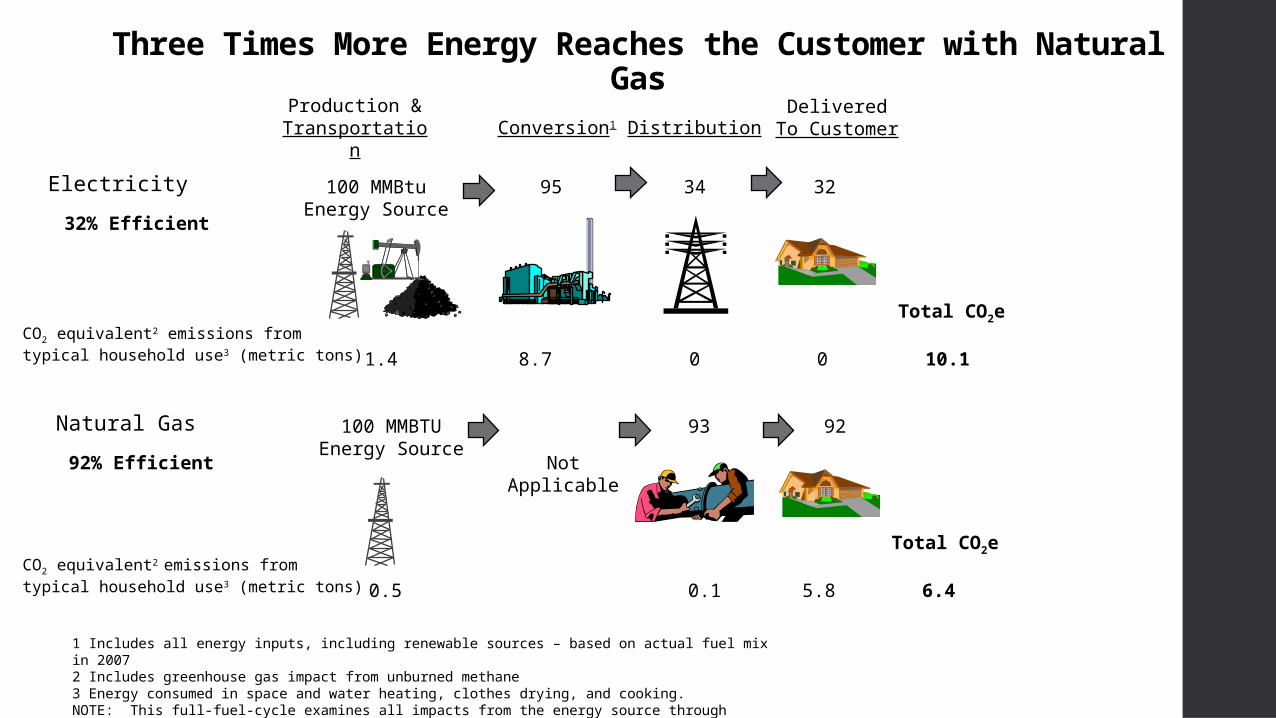
Three Times More Energy Reaches the Customer with Natural Gas
Electricity
Natural Gas
DeliveredTo Customer
32
Conversion1
100 MMBtuEnergy Source
95 34
93
Production &Transportation Distribution
100 MMBTUEnergy Source
1.4 8.7 0 0
Total CO2e
10.1
92
0.5 0.1 5.8
Total CO2e
6.4
NotApplicable
32% Efficient
92% Efficient
1 Includes all energy inputs, including renewable sources – based on actual fuel mix in 20072 Includes greenhouse gas impact from unburned methane3 Energy consumed in space and water heating, clothes drying, and cooking.NOTE: This full-fuel-cycle examines all impacts from the energy source through consumption
CO2 equivalent2 emissions from typical household use3 (metric tons)
CO2 equivalent2 emissions from typical household use3 (metric tons)
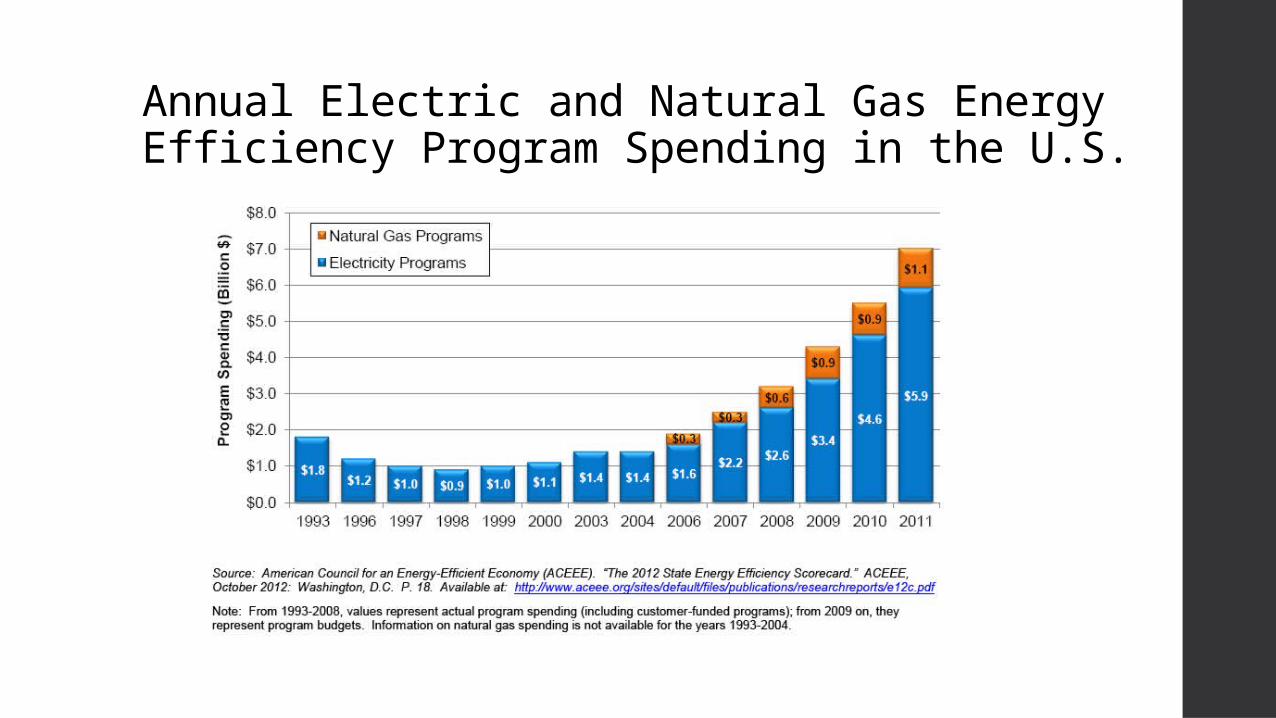
Annual Electric and Natural Gas Energy Efficiency Program Spending in the U.S.
Innovative Business Strategies• Enron’s gas bank
• NG Advantage

![The Gospel of the Kingdom …blessed are the meek, for they shall inherit the earth. [Matthew 5:7 - 3 Nephi 5:52] By Seventy James Noland 2010.](https://static.fdocuments.us/doc/165x107/56649d245503460f949fac0a/the-gospel-of-the-kingdom-blessed-are-the-meek-for-they-shall-inherit-the.jpg)