Mobile Agent for Secure Web-Service Debashis Roy Katayoon Moazzami Rachita Singh.

VOL. 78, NOS. 1–2 29
Introduction
World’s dependence on oil and gas is immense.Petroleum and its products are widely usedthroughout the world on daily basis in a huge
amount. But finding out oil and gas (commonly known as‘hydrocarbon’) is not an easy job. These fluids occur as asubsurface reserve at a depth of few hundreds of meters tokilometers. The depth of their occurrence depends on manygeological and physical factors. Several surface geophysicalmethods are widely used to delineate the subsurface insearch of hydrocarbon. The branch of geophysics whichdeals with all these methods is called “ExplorationGeophysics”. Apart from that there are also reservoirengineering methods for calculation of subsurfacehydrocarbon volume to be explored for estimatingeconomic viability. Reserve estimation and management isa very vital job in the project of hydrocarbon exploration.From old days of exploration history, the strategy has beenchanged a lot both in technological and theoretical aspects,which has changed the whole picture of explorationbusiness enabling smooth supply of oil and gas to theever increasing population of the world.
PETROLEUM EXPLORATION AND GLOBAL OIL SCENARIO
DEBASHIS SAHA*
The momentum of modern civilization solely depends on hydrocarbon. The subsurface reserve ofhydrocarbon is investigated and estimated using some geophysical and engineering techniques.With the increase of automobiles, factories and outburst of population the demand and usage ofoil and gas have also increased and as a consequence, reserves are declining fast. The era of easyoil is now behind us. Innovative ideas, technological developments and new discoveries are necessaryto keep up with the situation
ARTICLE
* Address of correspondence: B-215, ONGC Inside Colony, AssamAsset, ONGC, Nazira, Sivasagar, Assam, PIN-785685Email: [email protected]
But these natural resources are limited and rapidlydepleting day by day with increasing demand. Newmethodologies, novel ideas and people’s consciousness canonly alter the situation.
Petroleum and its Occurrences
In most of the text books petroleum is defined as“rock oil” (Greek Petra means rock, Latin Oleum meansoil). In common language petroleum is made of hydrogenand carbon atoms and so commonly referred as‘hydrocarbon’. It is now widely accepted that petroleumhas its organic origin1. The marine organisms after deathsettle in the ocean bottom in calm, quiet environment andoxygen free ambient and it got buried by other sediments.As the time passes the overburden increases and wholepile of sediment starts to subside due to its own weight.The increase of depth results increase of temperatureaccording to the geothermal gradient of that province.Given proper time to cook, at particular temperature theorganic matter starts maturing and first form highly viscous,insoluble constitute called “kerogen”. This is the motherproduct of petroleum. As the temperature increases withfurther burial this viscous mass starts becoming lighter dueto break down of carbon atoms (called cracking) and formliquid petroleum. Depending upon the temperature achieved

30 SCIENCE AND CULTURE, JANUARY-FEBRUARY, 2012
and extent of cracking heavy and light oils are formed.The temperature range at which dominantly oil is formedis called ‘Oil window’ and it ranges from 50°-150° C,above it dry gas ( gas which does not contain anycondensate or liquid hydrocarbon)2, is the dominantproduct.
So the oil generation needs three things:
1. Organic matter (not degraded or oxidized)
2. Favorable temperature
3. Time of exposure
It is should be remembered that all types of organicmatter can’t generate petroleum. It needs Type-I and Type-II (lipid rich) organic matter to generate oil. The organicmatters with in sediments are converted to oil and sedimentsto rocks. The rock within which oil is generated is called“source rock”. It is mainly shale.
Oil once generated starts moving along the micro-fractures in the source rock. This process is called‘migration’. It can migrate several hundred to thousandsof kilometers from its place of origin unless trapped. Thegeological structures which trap and hold oil are called“trap”. The structures like anticline, fault, pinch out, saltdome can act as good trap. The trap must have animpermeable boundary around it to stop the seepage of oilany further. This impermeable boundary is called “seal”.Shale, evaporites and gas hydrates commonly act as seals.A body of rock having good porosity and permeability toyield good amount of hydrocarbon is called “reservoir”1.Porosity determines how much volume of the rock cancontain hydrocarbon; on the other hand permeabilitydenotes the movement of fluid through interconnectedpores. Effective porosity and permeability are two mainfactors in recovery of oil from reservoir.
The job of a geophysicist is to find out the subsurfacestructures which can trap hydrocarbons and releasing thesite for drilling a potential well. Once the well is drilledthe geophysical measurement (called Well logging) withinthat well can produce a better picture of the zones in thesubsurface where hydrocarbon plays are present. All theavailable geophysical data of an area should be integratedafter optimum processing to characterize the reservoir. Thegeneral geology, stratigraphy and rock types of the area ofinterest should be studied thoroughly both from geologicalsurveys and available published literatures to get a broaderidea about the evolution history. Geochemical surveys arealso carried out in the area to detect free hydrocarbon (gas)in the soil samples and from the data anomalous zones are
detected over the entire region by contouring theconcentration of the various gas obtained in the respectivesurvey locations.
Exploration Methods
In a virgin land first some reconnaissance surveys arecarried out to get a general idea about the subsurface.However, the resolution of these surveys is not goodenough. Gravity and magnetic methods are commonly usedfor this purpose.
A. Gravity Method3,4 : Gravity method is based onthe Newton’s law of gravitation which states that the mutualforce of attraction F acting between two bodies of massm1 & m2 separated by a distance r is given by,
F = (Gm1m2)/r2
G is the universal gravity constant.
According to Newton’s second law of motion, forceacting on a mass m1 falling freely due to action of gravityis m1g. So,
m1g = (Gm1m2)/r2
or, g = (Gm2)/r2
m2 is the mass of the attracting body. If we considerm2 is the mass of the earth and r is the radius, then gdenotes the acceleration due to gravity of all bodies onthe earth surface. It can also be written as,
g = (4πGr3ρ)/3
So, g is directly proportional to ñ (density of earth).Thus gravity method measures the relative variation ofgravity value from place to place on the earth surfacecaused by the subsurface variation of density. Gravitysurvey is a three step process:
1. Acquisition
2. Reduction of data
3. Interpretation
Acquisition is done by a portable instrument called“Gravimeter” which, measures the gravity values by aninternal spring mass system calibrated to measuring scale.LaCoste Romberg, Worden are some commonly usedgravimeters3. Now digital gravimeters (Figure 1) are alsoavailable in market and it can speed up the data acquisitiontask. Before starting the survey a base station (whereabsolute value of g is known) and datum is fixed. Thensurvey is carried out in all predefined field stations notingthe value of latitude, longitude, height, reading from

VOL. 78, NOS. 1–2 31
gravimeter and time. At the end of survey again anotherreading at the base station is taken for drift correctionpurpose.
Figure 1. CG-5 Autograv Digital Gravity Meter.
Variation of gravity value is very small. Hence verysensitive instruments and measurements are required forgood interpretation. Gravity data are affected by severalfactors. So, following corrections are necessary on the rawfield data.
a. Free air correction (gF.A): It takes into accountthe elevation of the station above the datum. Asgravity is inversely proportional to the height fromthe surface this correction is needed to removeeffect of elevation. The value of this correction is-0.3085mgal/m, which implies that this correctionis to be added with the field data if the station isabove the predefined datum and vice versa.
b. Bouguer correction (gB): Excess mass betweendatum and the survey station is taken care by thiscorrection. This mass is the same mass betweendatum and station which is ignored in free aircorrection. The value of this correction is .04188ómgal/m, where ó is the density of the mass. Thiscorrection is applied in opposite sense of free aircorrection.
(c) Latitude correction (gL): The centrifugalacceleration of the earth reduces the gravity valueat any latitude on the globe (except poles) (Figure2). So this correction must be applied to
compensate the reduced gravity whenever there islarge N-S excursion of the study area.
Figure 2. Effect of centrifugal acceleration on gravity value. AfterRobbinson and Coruh (1988)5.
d. Terrain Correction (gT): It is done to correct dataerror caused by the topographic effect around thestation. Both surface elevation and depressionaround the station reduced the gravity value(Figure 3). So this correction always must be addedto the field reading. Hammer chart is generallyused for terrain correction purpose.
Figure 3. Principle of terrain correction (source anonymous).
e. Drift Correction: It is applied to correct theinstrumental drift during survey.
f. Isostatic correction: It takes care of thegravitationally compensated and uncompensatedstructure. Two hypotheses are proposed for thispurpose namely Airy’s hypothesis and Pratt’shypothesis3.
g. Tide correction: It is used for nullifying the effectof attraction of sun and moon.
h. Eötvös correction: This mainly applied onairborne and ship borne gravity data. For aneastward moving aircraft, the velocity of aircraft
Vertical Plumb Line
Plumb line deflected due todeficit mass on right
Plumb line defalected due toexcess mass on left
Centrifugalacceleration
g’
Ellipsoid ofrotation
Resultantgravity
g
Gravitationalacceleration
d
Rp
Equator Re
N
M

32 SCIENCE AND CULTURE, JANUARY-FEBRUARY, 2012
is added with the rotational velocity of earth andthus increases the centrifugal acceleration than thestatic condition at that latitude. So gravimeterreading shows lower value than the restingcondition value. Opposite thing happens for awestward moving aircraft. Application of Eötvöscorrection compensates this gravity value changedue to movement of the ship or aircraft.
Applying all these corrections to the survey data weget error free gravity values called “Bouguer gravity”. Thedifference between Bouguer gravity value and theoreticalvalue of gravity at any point is called Bouguer anomaly.
Gravity data is also affected by the local densitycontrast in relatively uniform surrounding causing anomalyin the data. The former is called residual anomaly and thelater is regional anomaly. Downward continuation of datacan enhance the residual anomaly, whereas upwardcontinuation improves regional.
Once Bouguer gravity is obtained to all stations a mapis prepared with those values. The variations of values inthe map are interpreted for subsurface mass distributionwhich in other words signifies the availability of favorablestructure for trapping and accumulation of oil.
B. Magnetic Method
The magnetic3,6 method measures the variation ofmagnetic field caused by subsurface variation of distributionof magnetized rocks and magnetic minerals. Igneous rocks,which commonly make the basement, show strongermagnetic field than other rock types. For the prospectingpurpose generally the variation of the order of 1/104 ofearth’s main field (~0.5 oersted) is measured. The unit usedfor prospecting purpose is ‘gamma’ (γ) where 1γ = 10-5
oersted. The magnetization of a body always consists ofresidual and induced magnetization parts and it is almostimpossible to separate these two quantities. Residualmagnetization has a pronounced effect on the totalmagnetization of a rock body. Field measurements are doneby a device called ‘magnetometer’. Fluxgate, protonprecession, optical pump and cryogenic (SQUID)magnetometer are common types of magnetometer2,7.Susceptibility measurement is generally done in laboratoryusing tangent magnetometer by comparing standard samplewith sample of interest. Residual or remnant magnetizationcan also be estimated in laboratory using astaticmagnetometer and spinner magnetometer. Another quantityis sometimes mention in this context is Konigsberger ratio6
which is the ratio of induced magnetization to remnantmagnetization in a given field. Magnetic method is also
suffered from various noises like power line interference,close vicinity of magnetic object and more intensely bythe diurnal variation of earth’s magnetic field. Proper noiseremoval approaches are implemented for getting error freedata set. Like gravity, then a magnetic map is preparedand it is more complex and variation of field is more erraticthan gravity. This variation is caused by inhomogeneity incomposition of basement or by structural or topographicvariation of basement3. From this variation probablebasement structure, sediment thickness above it andbasement depth can be estimated. These parameters arevery crucial for oil prospecting purpose.
C. Seismic Method
Seismic is the most important and expensivegeophysical method3,8-10 used in oil exploration. Manpower,cost, resolution, reliability of this method are more thanany other methods. Seismic is based on common opto-elastic phenomena (reflection, refraction and diffraction)of the elastic wave field introduced in the ground. Threesteps below are followed in seismic prospecting.
1. Acquisition (A)
2. Processing (P)
3. Interpretation (I)
Data is acquired both on land and offshore. A source(generally dynamite or vibrators for land and air gun forsea) generates elastic waves, which pass through theinfinitely layered earth, having variable composition, modeof generation, density and wave velocity of each layer.Depending upon the contrast of acoustic impedance (AI)(product of density ρ and velocity v) of each layerreflection and transmission occur. The amount of reflectionis decided by a quantity called reflection coefficient (R)and given by:
R = (ρ2v2 – ρ1v1)/ (ρ2v2 + ρ1v1), where subscriptdenotes the layer number.
The reflected wave is recorded by some sensors/receivers (called Channel) laid on the ground. For landsurvey it is geophone and for sea hydrophone. Geophoneis a velocity transducer which has a moving coil inmagnetic field and hydrophone is piezoelectric transducer.Both of them generate electrical signal in response toground motion and signal is recorded in the recordermodule in binary numbers. The recorded parameters aretravel time and amplitude of the reflected wave. Thedistance between source and receiver is called ‘offset’. Twotypes of source receiver arrangement is available namely‘off-end’ and ‘split spread’. Receivers are arranged in one
VOL. 78, NOS. 1–2 33
side of the source in the former and in both sides in caseof later.
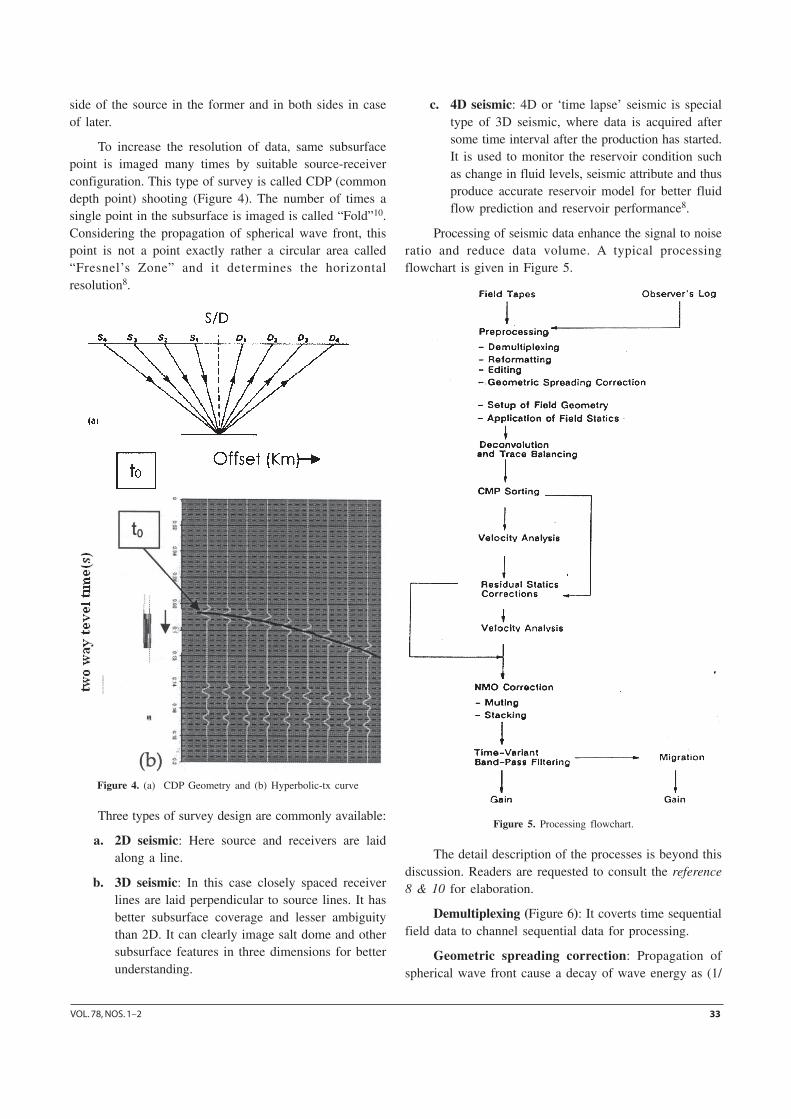
To increase the resolution of data, same subsurfacepoint is imaged many times by suitable source-receiverconfiguration. This type of survey is called CDP (commondepth point) shooting (Figure 4). The number of times asingle point in the subsurface is imaged is called “Fold”10.Considering the propagation of spherical wave front, thispoint is not a point exactly rather a circular area called“Fresnel’s Zone” and it determines the horizontalresolution8.
Figure 4. (a) CDP Geometry and (b) Hyperbolic-tx curve
Three types of survey design are commonly available:
a. 2D seismic: Here source and receivers are laidalong a line.
b. 3D seismic: In this case closely spaced receiverlines are laid perpendicular to source lines. It hasbetter subsurface coverage and lesser ambiguitythan 2D. It can clearly image salt dome and othersubsurface features in three dimensions for betterunderstanding.
c. 4D seismic: 4D or ‘time lapse’ seismic is specialtype of 3D seismic, where data is acquired aftersome time interval after the production has started.It is used to monitor the reservoir condition suchas change in fluid levels, seismic attribute and thusproduce accurate reservoir model for better fluidflow prediction and reservoir performance8.
Processing of seismic data enhance the signal to noiseratio and reduce data volume. A typical processingflowchart is given in Figure 5.
Figure 5. Processing flowchart.
The detail description of the processes is beyond thisdiscussion. Readers are requested to consult the reference8 & 10 for elaboration.
Demultiplexing (Figure 6): It coverts time sequentialfield data to channel sequential data for processing.
Geometric spreading correction: Propagation ofspherical wave front cause a decay of wave energy as (1/

34 SCIENCE AND CULTURE, JANUARY-FEBRUARY, 2012
Fig.7. Graph showing oil reserves of different parts of world.
r2), where r is the radius of wave front10 and it increaseswith time. So, a gain function is applied to recover thelost energy, called geometric spreading compensation.
Figure 6. Demultiplexed and multiplexed data.
Deconvolution: It is the process of increasingtemporal resolution by compressing the introduced seismicwavelet. It is a type of inverse filtering in which when thefilter operator is convolved with the recorded trace; givesthe reflectivity function of the earth. This process isimportant for eliminating multiples (waves which arereflected more than once before reaching to receivers).
CMP sorting: CMP represents common midpoint. Forhorizontal reflector it is directly above the CDP but fordipping horizon it does not coincide with vertical projectionof CDP. Traces corresponding to same CMP are groupedin CMP sorting.
Velocity analysis: By using t2-x2 (travel time2 vs.offset2) plot, constant velocity stack (CVS), Constantvelocity panels (CVP) and velocity spectrummethods10, velocity of a layer in considerationis estimated. This velocity is used for NMOcorrection and stacking. The process isrepeated until best stack amplitude isobtained.
NMO (normal move out) correction:From Figure 4 the travel time curve shows ahyperbolic trajectory indicating an increasein travel time from left to right receivers. tois travel time if source and receiver are keptat same position above the CDP. The job ofNMO is to flatten the hyperbola to t0 planeby collapsing all offsets to zero. The timeshift required for that is denoted as ÄtNMOand given by, ∆∆∆∆∆tNMO = √√√√√(t0
2 + x2/v2) – t0,where ‘x’ is the offset. As the offset increasesthe correction increases. That is why it iscalled dynamic correction. After NMOcorrection the traces are stacked. The ratio
of stacked amplitude to sum of amplitudes of all traces iscalled ‘semblance’ and it measures the coherency of signals.
Residual static: Reflection travel times are affectedby the receiver positions associated with surfaceirregularities, soil and low velocity layer over the reflector.Static correction reduces all the data to a suitable datumto remove those errors. But the effect of lateral velocityvariation in the subsurface is still there and it hampers theNMO and sacking. Residual static removes this ambiguity.
Filtering: It sieves out both undesirable frequency andvelocity events from data. It is used for noise eliminationfrom traces.
Migration: For a dipping horizon the reflector imagedis not in correct position and dimension of the reflectorbecause of dip and the fact that, the assumption of truezero offset condition does not fulfill in this case and thusa geometric distortion occurs during processing of stackedevent. Migration is a mathematical algorithm, which placesthe reflector to its correct position, by moving it up dip,increasing dip and shortening the length of reflector thanpreviously imaged. Three types of algorithm are availablefor this namely: Kirchhoff’s migration, finite differencemigration and F-K migration. Migration can be prestackor post stack. Depth migration is useful to image complexstructures.
Ultimately gain is applied to the data for betterdisplay.
After processing is complete the trickiest job,interpretation starts. The aim is to find out the structures

VOL. 78, NOS. 1–2 35
TABLE 1. Different logs and uses7,8
Name of Log Principle and method Use
Self Potential (SP) Naturally occurring potential difference between an electrode in Permeability recognition, mineralborehole and another in surface is measured. It is caused due to salinity identification, and formation waterdifference between borehole mud and formation water resistivity (Rw) determination.
Temperature Temperature in borehole is measured by three pressure resistant thermometers Over pressure identification,or a metal whose resistance is sensitive to temperature change fitted into the locating fluid movement andcircuit of Wheatstone bridge. Temperature correction of SP data.
Resistivity Measurement of formation resistivity is done by two potential and two Gross lithology, compaction, sourcecurrent electrodes. Both shallow and deep measurement settings are available. rock identification and most
importantly hydrocarbonsaturation determination.
Gamma and spectral Gamma ray log measures natural radioactivity of rocks by counting gamma Shale volume determination,gamma ray radiation by scintillation detector. Spectral gamma log can differentiate the lithology identification.
contribution of uranium, potassium, thorium to total radiation.
Sonic Measures the transit time (reciprocal of velocity) of acoustic wave, generated Porosity determination, lithology,from a piezoelectric source kept in the sonde, by detector or array of receivers. feature, compaction identification.
Density Formation density is measured by bombarding the formation of gamma ray Density, porosity, mineral andfrom 137Cs and measuring the attenuation of detected gamma ray by receiver. evaporate identification.Attenuation of gamma ray is proportional to the formation electronic densitywhich closely equal to bulk density.
Neutron log Measures the hydrogen index (HI) of the formation by bombarding the Porosity measurement and gas oilformation by fast neutrons and measuring the attenuated fast neutrons called contact identification.thermal neutrons. Attenuation is caused due to collision with hydrogennuclei within the formation.
Caliper Variation of borehole diameter is measured by two articulated arms, linked to Measurement of change in holethe cursor of a rheostat, pushed against the hole wall. Lateral movement of diameter with depth.arms change the rheostat resistance and current out put, which is calibrated tohole diameter change.
Figure 8. Increase oil production in next 40 years, b. decrease oil production due to alternative sources c. peak oil production won’t be able tofulfill demand. The oil scenario over the world is shocking. But improves technologies, innovative ideas, theoretical invention in future may resultsa drastic situation in the current situation13.
Pessimistic Scenario
Oil
Pro
duct
ion
Peak oil is near andalternative energysources won’t be ableto replace the lasses
Pollyanna Scenario Optomistic Scenario
Oil
Pro
duct
ion
Oil
Pro
duct
ion
Time
TimeTime
Conventional Oil
Today
TodayToday
Conventional Oil
Conventional Oil
2060
20602060
Alternative SourcesHydrogen, Solar, EthanolOil Shalo, Oil Sands, Wind
Alternative SourcesHydrogen, Solar, EthanolOil Shalo, Oil Sands, Wind
AlternativeSources

36 SCIENCE AND CULTURE, JANUARY-FEBRUARY, 2012
for favorable traps. Apart from that the available allstructures are find out from the whole traces. AVO, AVAanalysis are done to find out seismic anomalies like brightspot, dim spot, chimney effect, flat spot to ensure thepresence of hydrocarbon. Seismic inversion, shear wavestudy are also carried out for better understanding.
D. Well Logging
Well logging11,12, first invented by ConradSchlumberger and Henry Doll in France, is continuousrecord of geophysical properties of rocks with in borehole7.A cylindrical measuring device, connected via wire islowered in the hole, called ‘Sonde’ and measurement ismade ascending mode of sonde (except temperature).Values are plotted continuously along the depth axis. Welllogging produces very precise measurement of differentparameters and can indicate the hydrocarbon bearing zonesand its saturation. The methods and use of various logsare presented in Table.1.
Global Oil Scenario
Petroleum is 40% of global primary energy demandand has a requirement 22 billion bbl/yr. World’s totalendowment is 6000 billion bbl among which 2300 billionbbl is recoverable by common methods. The figure 7 belowshows the reserves in different parts of world, OPEC(Organization of the Petroleum Exporting Countries)countries mainly Middle East contributes the most in globaloil market. Considering world’s annual production and
proved & inferred reserves, the estimated life of globalproved reserve is ~39 years and inferred adds to another~39 years to it for a total <80 years. OECD/OAS reservesare most depleted (>50%) and have a short life (40 yearsin current rates). But for OPEC countries the reserve willsustain for another 100 years with current production rate.
It is true that OPEC reserves have been exaggeratedfor political reasons but reserve estimates were increasedsignificantly in the late 80’s. A super giant field lies inAlaska, which may be another major contributor in future.Figure 8 & 9 are showing oil production scenario indifferent situations9 and production from differentenvironments respectively.
Conclusion
Necessity of fossil fuels is never ending. But theseproved natural reserves are declining very rapidly. In thissituation, role of geophysicist becomes critical towardsreplenishing old fields. It is also possible that we are notrunning out of oil, rather new ideas. Hopefully, deep waterexplorations will change the situation to some extent. ❐
References1. F.K North, Petroleum geology (1985), Allen & Unwin.
2. http://www.glossary.oilfield.slb.com/Display.cfm?Term=dry%20gas
3. W.M Telford, L.P Geldart, Applied Geophysics (1990), CambridgeUniversity press.
4. L.L Nettleton, Gravity and Magnetics in Oil Prospecting (1976),McGraw Hill Book Company.
5. E.S Robbinson and C CoruhBasic Exploration Geophysics(1988), John Wiley: New York.
6. John Milsom, Field Geophysics 3rd Ed. (2003) John Wiley &Sons.
7. John M. Reynolds, An Introduction to Applied and EnvironmentalGeophysics (1998), John Wiley and Sons.
8. M.R Gadallah & L.R Fisher, Applied Seismology (2005),PenWell.
9. P. Kerry & M .Brooks, An Introduction to Geophysicalexploration (1988), Black Well publication.
10. O.Yilmaz, Seismic Data Analysis (Vol. I), (1987) Society ofExploration Geophysicist.
11. M .Rider, The Geological Interpretation of Well Logs (2nd Ed.)(2000), Rider French Consulting ltd.
12. O.Serra Fundamentals of well-log interpretation (Vol. I acquisitionof logging data) (1984), Elsevier.
13. http://www.oilscenarios.info/
14. Schlumberger Oilfield Review spring 2007.Figure 9. Oil production in different environments14