Petrobras Investments Webcast Pn 2010 2014
38
1 STRATEGIC PLAN PETROBRAS 2020 BUSINESS PLAN 2010 BUSINESS PLAN 2010 - - 2014 2014 Webcast Webcast Jos Jos é é Sergio Sergio Gabrielli Gabrielli – – CEO CEO Almir Almir Barbassa Barbassa – – CFO CFO
-
Upload
joaquim-leao -
Category
Business
-
view
3.602 -
download
2
Transcript of Petrobras Investments Webcast Pn 2010 2014

1
STRATEGIC PLAN PETROBRAS 2020
BUSINESS PLAN 2010 BUSINESS PLAN 2010 -- 20142014WebcastWebcast
JosJoséé Sergio Sergio GabrielliGabrielli –– CEOCEOAlmir Almir BarbassaBarbassa –– CFOCFO

2
STRATEGIC PLAN PETROBRAS 2020
DISCLAIMERDISCLAIMER
FORWARD-LOOKING STATEMENTS:
DISCLAIMER
The presentation may contain forward-looking statements about future events within the meaning of Section 27A of the Securities Act of 1933, as amended, and Section 21E of the Securities Exchange Act of 1934, as amended, that are not based on historical facts and are not assurances of future results. Such forward-looking statements merely reflect the Company’s current views and estimates of future economic circumstances, industry conditions, company performance and financial results. Such terms as "anticipate", "believe", "expect", "forecast", "intend", "plan", "project", "seek", "should", along with similar or analogous expressions, are used to identify such forward-looking statements. Readers are cautioned that these statements are only projections and may differ materially from actual future results or events. Readers are referred to the documents filed by the Company with the SEC, specifically the Company’s most recent Annual Report on Form 20-F, which identify important risk factors that could cause actual results to differ from those contained in the forward-looking statements, including, among other things, risks relating to general economic and business conditions, including crude oil and other commodity prices, refining margins and prevailing exchange rates, uncertainties inherent in making estimates of our oil and gas reserves including recently discovered oil and gas reserves, international and Brazilian political, economic and social developments, receipt of governmental approvals and licenses and our ability to obtain financing.
We undertake no obligation to publicly update or revise any forward-looking statements, whether as a result of new information or future events or for any other reason. Figures for 2010 on are estimates or targets.
All forward-looking statements are expressly qualified in their entirety by this cautionary statement, and you should not place reliance on any forward-looking statement contained in this presentation.
NON-SEC COMPLIANT OIL AND GAS RESERVES:
CAUTIONARY STATEMENT FOR US INVESTORS
We present certain data in this presentation, such as oil and gas resources, that we are not permitted to present in documents filed with the United States Securities and Exchange Commission (SEC) under new Subpart 1200 to Regulation S-K because such terms do not qualify as proved, probable or possible reserves under Rule 4-10(a) of Regulation S-X.

3
STRATEGIC PLAN PETROBRAS 2020
CHALLENGES TO WORLD OIL SUPPLYCHALLENGES TO WORLD OIL SUPPLYNatural decline requires finding new reserves to meet world demaNatural decline requires finding new reserves to meet world demandnd
20
30
40
50
60
70
80
90
100
110
120
2000 2005 2010 2015 2020 2025 2030
2020: 43 – 48 MM bpd
2030: 65 – 78 MM bpdProjected Decline
Required Addition to CapacityScenario: Sustainable Development
Scenario: Business as Usual
28%
59%
13%
Source: Estimates using WoodMackenzies’ data
Production from revaluation of existing reserves (increases to Oil in Place or the recovery factor )
Production from reserves not yet discovered or without a development plan
Production currently developed with operations in short and medium term
87% of needed supply must come from re-valuing existing reserves, or from reserves not yet discovered or declared commercial

4
STRATEGIC PLAN PETROBRAS 2020
PRIMARY DEMAND FOR ENERGYPRIMARY DEMAND FOR ENERGYDespite growth of alternatives, oil will maintain its importanceDespite growth of alternatives, oil will maintain its importance
2008 20302008 2030
28%
22%
28%
6%7%2%7%
1%
2008 2030
0.4%0.5%
33%
22%
26%
6%6%7%
29%
22%
29%
6%
7%1%
6%1%
Average Annual Change
+5.2% p.y.
+4.2% p.y.
Traditional Biomass
Other Renewable sourcesBiofuels
Hydro
Nuclear
Coal
Gas
Oil
MM
TOE
* Aeolian, Solar and Geothermal
1.32%1.30%
17,32417,236
12,974
Sustainable Development
Business as Usual
+6.1% p.y.
+7.8% p.y.
Sustainable Development
Business as Usual
Aggressive growth in biofuels will only slow the rate of growth in the consumption of Petroleum products

5
STRATEGIC PLAN PETROBRAS 2020
Per capita petroleum consumption
DEMAND FOR PETROLEUMDEMAND FOR PETROLEUMDeveloping country demand should exceed reduced OECD demandDeveloping country demand should exceed reduced OECD demand
-2 0 2 4 6 8
Transport Eletrical Generation Others
Petroleum demand – 2009-2030 (variation million bpd)
USA
China
India
Middle East
OECD Europe
Brazil
•Considering France, Germany, Italy and UK
0
5
10
15
20
25
30
per c
apita
- ba
rrel
s pe
r yea
r
US Japan OECD* Brazil China India
1980 2000 2009
Source: BP

6
STRATEGIC PLAN PETROBRAS 2020
500
1000
1500
2000
2500
3000
3500
4000
4500
5000
5500
6000
2000
2001
2002
2003
2004
2005
2006
2007
2008
2009
2010
2011
2012
2013
2014
2015
2016
2017
2018
2019
2020
Source: PFC Energy and Company reports
OIL AND GAS PRODUCTION TARGETS: SUPERMAJORS AND PETROBRASOIL AND GAS PRODUCTION TARGETS: SUPERMAJORS AND PETROBRASPetrobras has the highest growth rate target of the industryPetrobras has the highest growth rate target of the industry
ExxonMobil: Productiongrowth rate ~3-4% in 2010; ~2-3% p.y. up to 2013
BP: Production growth rate ~1-2% p.y. up to 2015
Shell: ~3.5 MM boe/d in 2012 and ~3.7 MM boe/d in 2014
Petrobras: 3.9 MM boe/d in 2014 and 5.4 MM boe/d in 2020
thou
sand
boe
/d
Chevron: production growthrate ~1% p.y. between 2010-2014 and 4.5% p.y. between 2014-2017

7
STRATEGIC PLAN PETROBRAS 2020
PETROBRAS CORPORATE STRATEGY to 2020PETROBRAS CORPORATE STRATEGY to 2020Integrated, profitable growth, on a sustainable basisIntegrated, profitable growth, on a sustainable basis
Commitment to Sustainable Development
Integrated Growth
Expand operations in target markets for oil, oil products, petrochemicals, gas and energy, biofuels and distribution and to be recognized as a benchmark among integrated energy companies
Cor
pora
te S
trat
egy
Bus
ines
s Se
gmen
ts
Grow oil and gas production in a sustainable manner, becoming one of the five largest oil producers in the world
Expand refining in Brazil, ensuring sufficiency in domestic supply and leadership in distribution, while developing export markets for products, with emphasis in the Atlantic basin
Consolidate leadership in the Brazilian natural gas market, and establishing an international presence and increasing the domestic electricity generation business and gas chemical, emphasizing fertilizers
Operate in the petrochemical sector in activities that are integrated manner with the other businesses of the Petrobras system
Operate in Brazil and abroad in the biofuels sector in activities that are integrated with the Petrobras system, and to do so on a sustainable basisl
Operational excellence, in management, in energy efficiency, in human resources and in technology
E&P Downstream
(RTC)
Gas and Energy Petrochemicals BiofuelsDistribution
Social and Environmental ResponsibilityProfitability
8
STRATEGIC PLAN PETROBRAS 2020
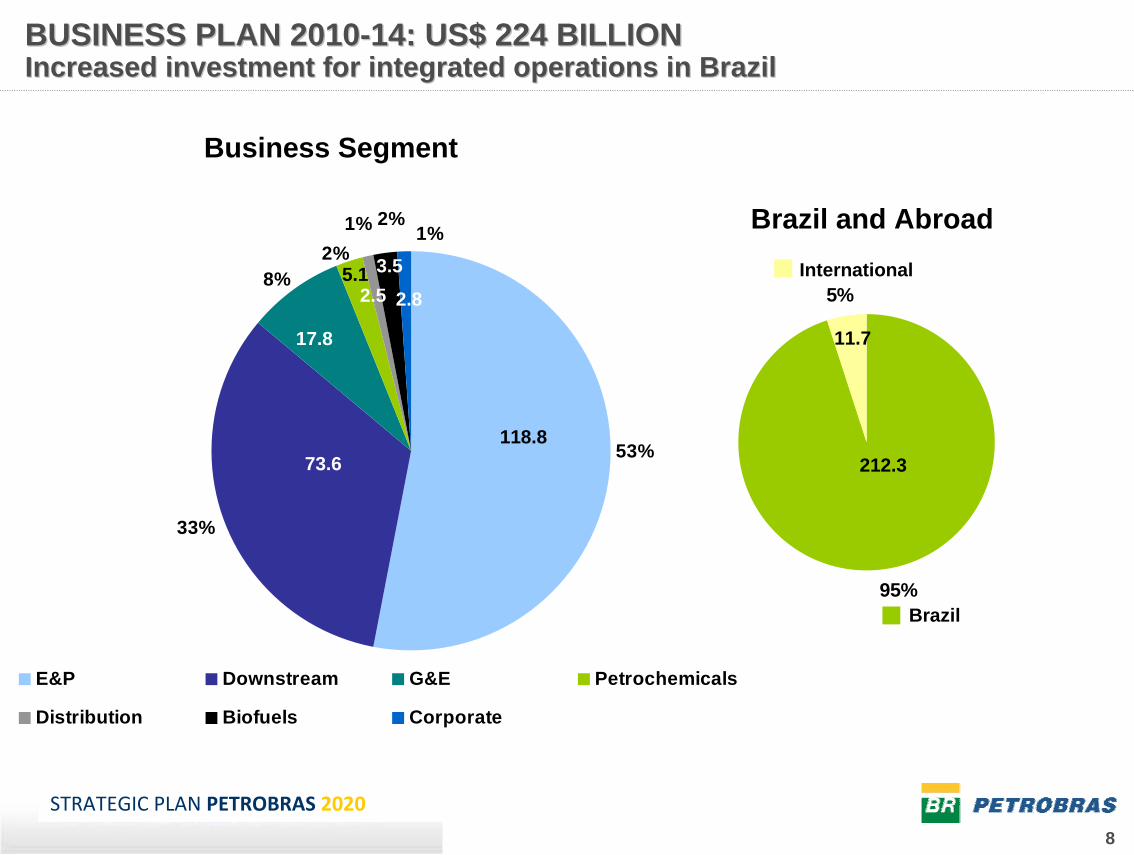
BUSINESS PLAN 2010BUSINESS PLAN 2010--14: US$ 224 BILLION14: US$ 224 BILLIONIncreased investment for integrated operations in BrazilIncreased investment for integrated operations in Brazil
95%
5%International
Brazil
212.3
Brazil and Abroad
11.7
Business Segment
33%
53%
1%2%
8%
2%1%
E&P Downstream G&E Petrochemicals
Distribution Biofuels Corporate
118.873.6
5.13.5
2.8
17.8
3.52.5

9
STRATEGIC PLAN PETROBRAS 2020
ADJUSTMENTS TO THE 2010ADJUSTMENTS TO THE 2010--2014 PORTFOLIO2014 PORTFOLIOIncreased spending on infrastructure, logistics, value chain in Increased spending on infrastructure, logistics, value chain in BrazilBrazil
• New projects for pre-salt, logistics, increased utilization of domestic oil, and monetization of natural gas.
• Change in partnership participation reflecting uncertainty about participation of partners in downstream projects
E&P
Downstream
Gas & Energy
Corporate
0.3
6.5
5.1 19.7
62%16%
21%1%
5.1 19.7
6.50.3
CAPEX 2010-2014 in 2009-2013
Business Plan
2010-2014 Business Plan
New Projects
Projects Excluded
Change in project timeline
Change in project design and cost
Change in Stake
186.6
31.6 (17.0) (6.8) 19.210.3
224

10
STRATEGIC PLAN PETROBRAS 2020
APPROVAL STATUS OF 2010APPROVAL STATUS OF 2010--2014 PORTFOLIO2014 PORTFOLIOFlexibility to adjust Flexibility to adjust CapexCapex for projects in Phases I and IIfor projects in Phases I and II
Phase I – Identification of OpportunityPhase II – In Conceptual PhasePhase III – In Basic ProjectPhase IV+ ‐ Authorization for Execution/Implementation/Operations
0,9
US$ 224 Billion686 projects
23.6
17.5
0.9
122.6
10.5%
54.7%
0.4%
7.9%
26.5%Phase I
Phase II
Phase III
Phase IV +
Aquisitions23.6
17.5
59.4
0,9
122.6

11
STRATEGIC PLAN PETROBRAS 2020
LOCAL CONTENT PARTICIPATION 2010LOCAL CONTENT PARTICIPATION 2010--20142014Brazilian suppliers expected to provide nearly 70% of total needBrazilian suppliers expected to provide nearly 70% of total needss
• Petrobras purchases in Brazil of approximately $28 billion per year (versus $20 billion per year in prior plan)
Capex in Brazil (US$ billion)
Brazilian Content0 %
40 %
60 %
80 %
100 %
20 %
E&P(53%)
Gas & Energy (82%)
Distribution and Biofuels (100%)
Downstream and
Corporate (80%)
100%2.32.3Biofuels
82%14.417.6Gas & Energy
100%2.32.3Distribution
80%2.63.3Corporate
Total
RTM and Petrochem
E&P
Business unit
67%
80%
53%
Braziliancontent
(%)
142.2
62.8
57.8
Purchased inBrazilianMarket
Investmentsin Brazil
212.3
78.6
108.2
+US$ 46.4 billion from Partners

12
STRATEGIC PLAN PETROBRAS 2020
Goals and Principal ProjectsGoals and Principal Projects
STRATEGIC PLAN PETROBRAS 2020

13
STRATEGIC PLAN PETROBRAS 2020
OIL AND GAS PRODUCTION TARGETS 2010OIL AND GAS PRODUCTION TARGETS 2010--20202020Domestic targets unchanged, international targets reducedDomestic targets unchanged, international targets reduced
(Tho
us. b
oe/d
ay)
1,500 1,540 1,493 1,684 1,778 1,792 1,855 1,971 2,100
2,980
3,950252 251 265
274 277 273 321 316384
623
1109
35 161 168163 142 126 124 141
146
176
203
85 94 96 101 110 100 9793
128
120
22
2002 2003 2004 2005 2006 2007 2008 2009 2010 2014 2020
Oil Production - Brazil Gas Production - Brazil Oil Production - International Gas Production - International
2,4002,3012,2972,2172,0202,0371,810
2,525
4.9% p.y.
2,723
5,382
3,9077.1% p.y.
9.4% p.y.
1.183152
Pre-Salt241
1, 078
• Production curve for domestic oil gas production consistent with prior Business Plan
• Projected international production reduced as a result of decrease in investment
• Production curve does not currently assume any contribution from Transfer of Rights

14
STRATEGIC PLAN PETROBRAS 2020
2,980
2,100
1200
1600
2000
2400
2800
2010 2011 2012 2013 2014
Tupi NE EWT30.000 bpd
Tupi NE EWT30.000 bpdGuará EWT
Dynamic Producer30,000 bpd
Guará EWTDynamic Producer
30,000 bpd
Th. bpd
Tupi PilotCidade de Angra dos
Reis100,000 bpd
Tupi PilotCidade de Angra dos
Reis100,000 bpd
Cachalote eBaleia Franca
FPSO Capixaba100,000 bpd
Cachalote eBaleia Franca
FPSO Capixaba100,000 bpd
Marlim Sul
SS P-56Module 3
100,000 bpd
Marlim Sul
SS P-56Module 3
100,000 bpd
JubarteFPSO P-57180,000 bpd
JubarteFPSO P-57180,000 bpd
Antecipation of Baleia Azul
FPSO Espadarte100,000 bpd
Antecipation of Baleia Azul
FPSO Espadarte100,000 bpd
RoncadorFPSO P-62Module 4
180,000 bpd
RoncadorFPSO P-62Module 4
180,000 bpd
RoncadorSS P-55Module 3
180,000 bpd
RoncadorSS P-55Module 3
180,000 bpd
Papa-Terra TLWP P-61 &FPSO P-63150,000 bpd
Papa-Terra TLWP P-61 &FPSO P-63150,000 bpd
Guará Pilot FPSO120,000 bpd
Guará Pilot FPSO120,000 bpd
Pre‐salt
Whales ParkFPSO P-58180,000 bpd
Whales ParkFPSO P-58180,000 bpd
Tupi NE Pilot FPSO
120,000 bpd
Tupi NE Pilot FPSO
120,000 bpd
Tiro/SidonFPSO
100,000 bpd
Tiro/SidonFPSO
100,000 bpd
Aruanã EWTCidade Rio das Ostras
15,000 bpd
Aruanã EWTCidade Rio das Ostras
15,000 bpd
Tiro EWTSS-11
30,000 bpd
Tiro EWTSS-11
30,000 bpd
MexilhãoNG
MexilhãoNG
AruanãFPSO
100,000 bpd
AruanãFPSO
100,000 bpd
GuaiamáFPSO
100,000 bpd
GuaiamáFPSO
100,000 bpd
Uruguá/TambaúFPSO Cidade de Santos
NG/35,000bpd
Uruguá/TambaúFPSO Cidade de Santos
NG/35,000bpd
Natural Gas
PRINCIPAL PROJECTS SCHEDULED DURING 2010PRINCIPAL PROJECTS SCHEDULED DURING 2010--20142014Updated business plan added new projectsUpdated business plan added new projects
Oil
4 EWTPre-salt4 EWTPre-salt
4 EWTPre-salt4 EWTPre-salt
3 EWTPre-salt3 EWTPre-salt
2 EWTPre-salt2 EWTPre-salt
EWT = Extended Well Test

15
STRATEGIC PLAN PETROBRAS 2020
E&PE&P--BRAZIL INVESTMENTS 2010BRAZIL INVESTMENTS 2010--2014 2014 Continued emphasis on PostContinued emphasis on Post--Salt acreage, growing spending on PreSalt acreage, growing spending on Pre--SaltSalt
Exploration Development Infrastructure
• Annual expenditures for exploration of more than US$4 billion annually
• Development capex in Pre-salt approaching 50% of Post-salt spending
27.8
0.9
4.3
84%
3%13%
Pre-Salt
US$ 33.0 Billion
Post-Salt
US$ 75.2 Billion
50.1
11.413.7
15% 18%
67%

16
STRATEGIC PLAN PETROBRAS 2020
NEW VESSELS AND PURCHASE OF NEW EQUIPMENTSNEW VESSELS AND PURCHASE OF NEW EQUIPMENTSPetrobras critical resources demand will drive Brazilian and intPetrobras critical resources demand will drive Brazilian and international industryernational industry
26 RIGS CONTRACTED, 28 MORE TO BE BUILT BY 2020:26 RIGS CONTRACTED, 28 MORE TO BE BUILT BY 2020:o Until 2013: 13 rigs contracted before 2008 and 1 rig relocated from international operations*;
+12 new rigs contracted in 2008 , through international bidding;o 2013-2020: Bidding process in progress, to contract 28 rigs to be built in Brazil.
By 2013
79
41
254
5
Current Situation(Dec/09)
Others (Jacket and TLWP)
Production Platforms SS e FPSO
Supply and Special Vessel
Drilling Rigs Water Depth Above 2.000 m
Critical ResourcesDelivery Plan (to be contracted)
Accumulated Value
By 2015 By 2020
26 31 53*
465 491 504
53 63 84
81 83 85
Production
Platform (FPSO)Drilling RigsSupply Vessel
* The rig reallocated from international operations, expire in 2015, so it is not considered in the 2020 accumulated value

17
STRATEGIC PLAN PETROBRAS 202017
RTM
(Refining, Transportation and Marketing)
and PETROCHEMICALS
Market Demand, Goals and Principal ActivitiesMarket Demand, Goals and Principal Activities
BUSINESS PLAN PETROBRAS 2020STRATEGIC PLAN PETROBRAS 2020

18
STRATEGIC PLAN PETROBRAS 2020
2,7943,196
3,9502,356
2,260
2,980
1,9331,791
1,971
1,0361,393
181
2009 2014E 2020E
kbpd
110%
132%
• Oil Production and the Brazilian market demand currently exceed refining capacity
• By 2014, exports are projected to reach nearly 1 million bpd, even as refining capacity is expanded to process Brazilian production to meet demand
BRAZILIAN PRODUCTION, REFINING AND DEMANDBRAZILIAN PRODUCTION, REFINING AND DEMANDLong term plans to achieve greater balance and integrationLong term plans to achieve greater balance and integration
ThroughputProduction Oil Product Demand
124%
1980
13%
Production as a % of refining

19
STRATEGIC PLAN PETROBRAS 2020
BRAZILIAN DEMAND AND REFINING CAPACITYBRAZILIAN DEMAND AND REFINING CAPACITYStrong Brazilian GDP growth projected to increase demand 3.4% Strong Brazilian GDP growth projected to increase demand 3.4% p.yp.y..
• Domestic production will represent 91% of refinery throughput by 2020
• Comperj’s first phase is now a new refinery
403
769937
826
452338
1,187
1,155
1,016
0
1000
2000
3000
Thousand bpd
1,933
PREMIUM I(1ª phase)
300 thou. bpd(2014)
2,356
1,831
2,260REPLANRevamp
U200+PAM33 thous. bpd
(2010)
COMPERJ(1º phase)
165 thous. bpd(2013)
RNE230 thous. bpd
(2013)
2020
...
3,196
2,794
2009 20142010
Gasoline Diesel Others
PREMIUM I(2ª fase)
300 thous. bpd
(2016)
...
COMPERJ(2º phase)
165 thous. bpd(2018)
Throughput
Clara Camarão
2010
PREMIUM II300 thous.
bpd(2017)

20
STRATEGIC PLAN PETROBRAS 2020
50%
29%
11%
6% 3%1%
Additional capacity Quality and conversionOperational Improvement Fleet expansionLogistics for oil International
RTM AND PETROCHEMICALS INVESTMENTS 2010RTM AND PETROCHEMICALS INVESTMENTS 2010--20142014New refineries, fuel quality, and modernization account for 70% New refineries, fuel quality, and modernization account for 70% of capexof capex
• Additional capacity:• Refinery NE• Premium I• Comperj
• Quality and conversion• Sulfur removal• Modernization• Upgrading (coker)
• Operating improvement and logistics:• Maintenance• HSE• Logistics for oil and biofuels
US$ 73.6 Billion
• Investments of US$ 5.1 Billion in Petrochemical (includes acquisition of Quattor)

21
STRATEGIC PLAN PETROBRAS 2020BUSINESS PLAN PETROBRAS 2020
Demand, Goals and Principal ActivitiesDemand, Goals and Principal Activities
GAS, ENERGY AND GASCHEMICAL
STRATEGIC PLAN PETROBRAS 2020

22
STRATEGIC PLAN PETROBRAS 2020
NATURAL GAS MARKET AND POWER CAPACITY NATURAL GAS MARKET AND POWER CAPACITY Growth in natural gas demand, consolidation in Thermo Power capaGrowth in natural gas demand, consolidation in Thermo Power capacitycity
41
32
53
5.324.32.0
4
14.4
2009 2014
Electrical Generation Industrial Fertilizers Other uses
137 365
1,090 1,093
6,437 5,997
2010 2014International Thermoelectrical and Co-generation Renewables Sources
Installed Capacity of Electrical Energy Generation (MW)
+9%7,227 7,892
* 2014 – Thermooelectrical generationa refers to full and simultaneous dispatch of plants
Natural Gas Demand
46
130*
Mill
ion
m3/
day

23
STRATEGIC PLAN PETROBRAS 2020
NATURAL GAS BASED FERTILIZERSNATURAL GAS BASED FERTILIZERSFertilizer plants to take advantage of available gas and infrastFertilizer plants to take advantage of available gas and infrastructureructure
• Manage total demand for gas by transforming natural gas into fertilizers needed by Brazilian agriculture (substituting demand that is currently imported)
8441,076
2,104
807
298274
2010 2014 2015Ammonia Urea
+160%
Th. t
on/y
ear 1,374
2,911
1,118
UFN III (sep/14)Ammonia:
81th. ton/yearUrea 1.210 th.
ton/year
UFN IV (dec/15)
Urea 763 th. ton/year
Ammonia Plant(Dec/14)519 th.
ton/year

24
STRATEGIC PLAN PETROBRAS 2020
15%
23%
32%
30%
GAS, POWER AND GAS CHEMICAL INVESTMENTS 2010GAS, POWER AND GAS CHEMICAL INVESTMENTS 2010--20142014Transition from investment in infrastructure to gas demand flexiTransition from investment in infrastructure to gas demand flexibilitybility
LNG Pipeline network
Electrical Energy Chemical Gas Facilities (Fertilizers, ammonia)
Investments 2010Investments 2010--1414US$ 17.8 US$ 17.8 billionbillion
• Completion of the natural gas transport and processing infrastructure
• Consolidating investment in power generation: thermo-electric, wind, biomass
• Presence in LNG chain for transport and distribution of pre-salt gas
• Major investments in the conversion of natural gas in to Urea and Ammonia
5.7
4.1
2.75.3

25
STRATEGIC PLAN PETROBRAS 2020
Goals and Main Projects Goals and Main Projects
INTERNATIONALDISTRIBUTION
BUSINESS PLAN PETROBRAS 2020STRATEGIC PLAN PETROBRAS 2020
BIOFUELS

26
STRATEGIC PLAN PETROBRAS 2020
BR market share in the total and automotive market (%)
Distribution CAPEX – Brazil
30.438.6 40.0
22.430.6 33.6
2004 2009 2014
BR market share in total market in Brazil (%) BR market share in automotive market in Brazil (%)
US$ 2.5 BillionUS$ 2.5 Billion
DISTRIBUTION INVESTMENTS 2010DISTRIBUTION INVESTMENTS 2010--20142014Leading the Brazilian market for distribution, increasing the maLeading the Brazilian market for distribution, increasing the market sharerket share
• 8 p.p. increase in the global and automotive market share in the last 5 years.
• We intend to continue leading the Brazilian distribution market of oil products and biofuels, increasing our share in the market.
27%
26%24%
23%Gas station
Wholesales consumers
Operation and Logistics
Liquigás + Others

27
STRATEGIC PLAN PETROBRAS 2020
INTERNATIONAL STRATEGYINTERNATIONAL STRATEGYReduced allocation of Reduced allocation of capexcapex, with focus on upstream, with focus on upstream
Ramp up of existing developments, stable production in long term
Reduced investment and production a reflection of greater opportunities in Brazil
• Development focus: Gulf of Mexico, West Coast of Africa and Latin America
• Exploration focus: Atlantic Project, West coast of Africa, aligned with domestic E&P
• Reduced emphasis on refining
• Reduced emphasis on LNG, alignment with domestic Gas and Power segment
RTCP615 5%
E&P10,330 90%
CORPORATE123 1%G&E
186 2%
DISTRIBUTION221 2%
INTERNATIONAL PRODUCTION OF OIL AND GASINTERNATIONAL PRODUCTION OF OIL AND GASBP 2010 BP 2010 -- 20142014
INVESTMENTS 2010INVESTMENTS 2010--2014: 2014: US$ 11.5 biUS$ 11.5 bi
Thousand bpd
239 304
146 176 20393 128 120
0
200
400
600
800
2010 2014 2020
Oil and NGL Natural Gas BP 2009-2013 Target
323
632BP 2009-2013
Target
- 49%
28
STRATEGIC PLAN PETROBRAS 2020
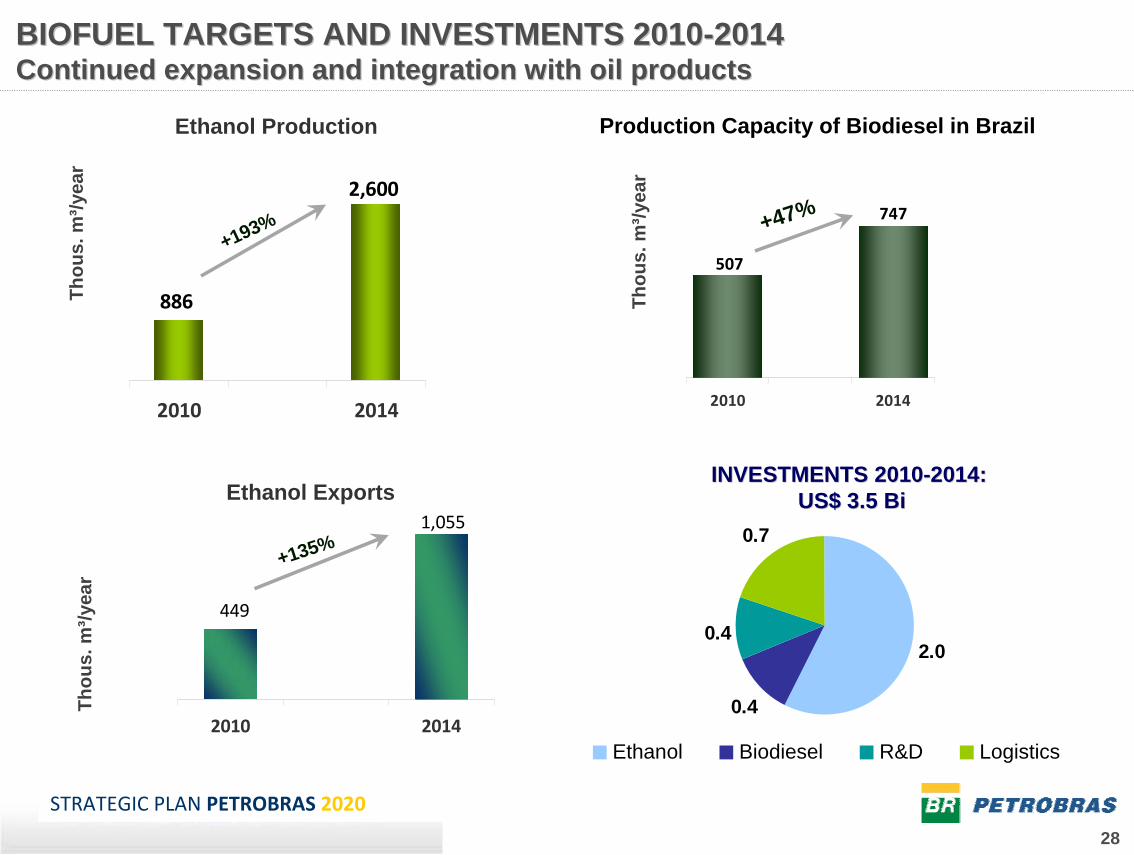
BIOFUEL TARGETS AND INVESTMENTS 2010BIOFUEL TARGETS AND INVESTMENTS 2010--20142014Continued expansion and integration with oil productsContinued expansion and integration with oil products
2,600
886
2010 2014
+193%
Thou
s. m
³/yea
r
Ethanol Production
747
507
2010 2014
Production Capacity of Biodiesel in Brazil
+47%
2.0
0.4
0.4
0.7
Ethanol Biodiesel R&D Logistics
INVESTMENTS 2010INVESTMENTS 2010--2014:2014:US$ 3.5 BiUS$ 3.5 Bi
Thou
s. m
³/yea
r
Thou
s. m
³/yea
r
1,055
449
2010 2014
Ethanol Exports
+135%

29
STRATEGIC PLAN PETROBRAS 2020
Targets and Goals, HSE, Technology, and Research Targets and Goals, HSE, Technology, and Research and Developmentsand Developments
BUSINESS PLAN PETROBRAS 2020STRATEGIC PLAN PETROBRAS 2020
RESEARCH & DEVELOPMENT

30
STRATEGIC PLAN PETROBRAS 2020
Other Renewable sources Energy
Maximizing recovery factor
Developing Production,
Operation and Pre Salt Logistic
Operational Optimization
Solutions for Natural Gas
logistic in harsh environments
New Exploratory Frontier
CO2 and other gas management Energetic
Efficiency
TECNOLOGICAL CHANGESTECNOLOGICAL CHANGES3 Key pillars3 Key pillars
Middle distillate Maximization
Petrochemicals Gas Chemic
Fuel, Lubricants and special
products innovation Biofuels
Sediments and other fuels
characterization of the pre salt
and other complex
reservoirs
Development of new generation Sea and Subsea
Systems
Expanding Limits
Sustainability
Adding value and Diversifying Products
Water management

31
STRATEGIC PLAN PETROBRAS 2020
Reduction in the complexity of the projects, using standard solutions
Contributing for the consolidation of Brazil as a supplying hub with international competitive level
Using international engineering patterns and metrics in our facility projects
ENGINEERING CHALLENGESENGINEERING CHALLENGES
Simplification and Standardization
Competitiveness/ Sustainability
Brazilian ContentTechnological & Engineering
Drivers

32
STRATEGIC PLAN PETROBRAS 2020
ESTRUTURA CORPORATIVA DE RESPOSTA CDA / BASES AVANÇADAS / EDR&D INVESTMENTS ALLOW TECHNOLOGICAL LEADERSHIP WITH R&D INVESTMENTS ALLOW TECHNOLOGICAL LEADERSHIP WITH FOCUS IN HSEFOCUS IN HSE
Investments in HSE, IT and R&D
US$ 11.4 Billion
29%
25%
46% HSE
IT
R&D
• Continued spending of $1 billion per year on Research and Development
• Continued focus on Health, Safety and Environment

33
STRATEGIC PLAN PETROBRAS 2020
Cash generation and Funding needsCash generation and Funding needs
BUSINESS PLAN PETROBRAS 2020STRATEGIC PLAN PETROBRAS 2020
PLAN FINANCING

34
STRATEGIC PLAN PETROBRAS 2020
FORECASTED OIL PRICE VERSUS Business PLAN 2010FORECASTED OIL PRICE VERSUS Business PLAN 2010--20142014Petrobras base case planning price at lower end of forecast rangPetrobras base case planning price at lower end of forecast rangee
3629
2723 21 22 26 24
1622
34 29 2933
42
59
6975
78
72
84
0
10
20
30
40
50
60
70
80
90
100
110
120
130
140
1990 1995 2000 2005 2010 2015 2020 2025 2030
Forecasts: CERA, PIRA, WoodMackenzie, EIA e IEA.
Petrobras budget price62
98
35
STRATEGIC PLAN PETROBRAS 2020
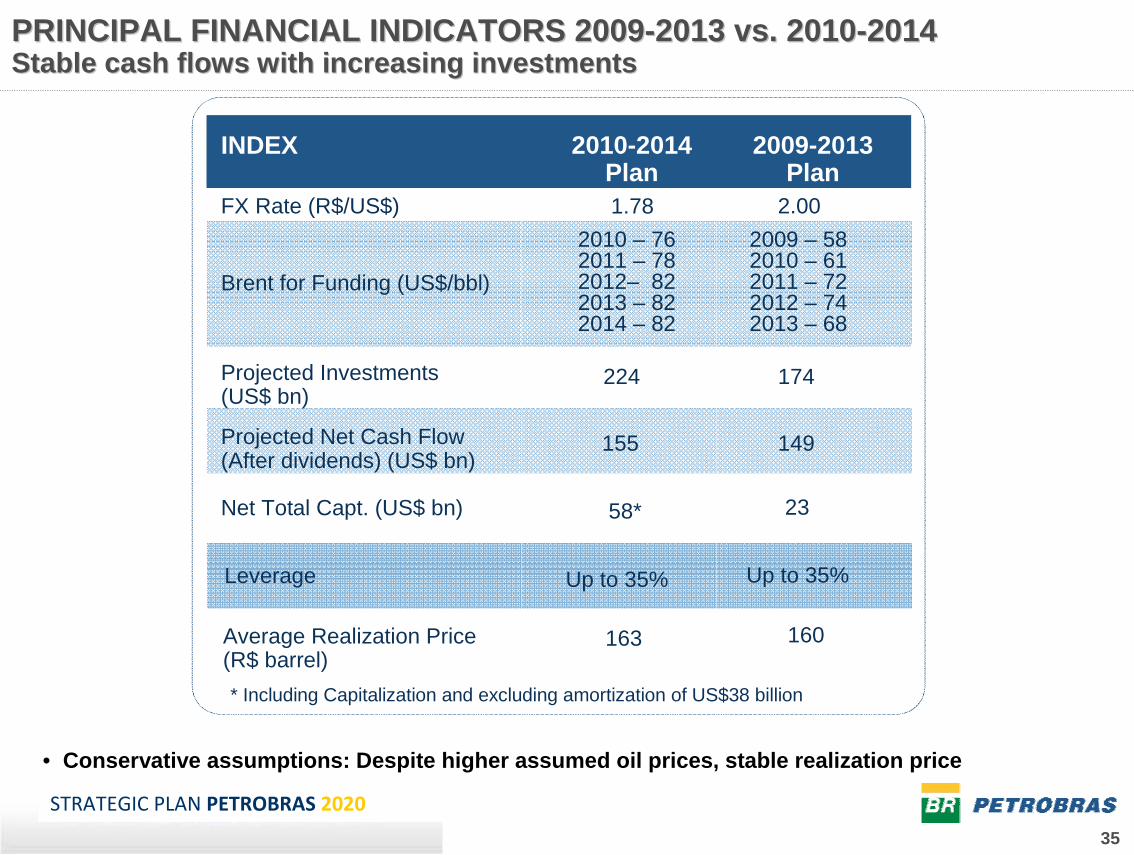
PRINCIPAL FINANCIAL INDICATORS 2009PRINCIPAL FINANCIAL INDICATORS 2009--2013 vs. 20102013 vs. 2010--20142014Stable cash flows with increasing investmentsStable cash flows with increasing investments
• Conservative assumptions: Despite higher assumed oil prices, stable realization price
INDEX 2009-2013 Plan
2010-2014 Plan
FX Rate (R$/US$) 2.00
Brent for Funding (US$/bbl)
Projected Investments (US$ bn)
174
Projected Net Cash Flow (After dividends) (US$ bn)
149
Net Total Capt. (US$ bn) 23
Leverage Up to 35%
1.78
224
155
58*
Up to 35%
2010 – 762011 – 782012– 822013 – 822014 – 82
2009 – 582010 – 612011 – 722012 – 742013 – 68
Average Realization Price (R$ barrel)
163 160
* Including Capitalization and excluding amortization of US$38 billion

36
STRATEGIC PLAN PETROBRAS 2020
CASH GENERATION AND INVESTMENTCASH GENERATION AND INVESTMENTProfitable investments funded with cash flow, debt and equity caProfitable investments funded with cash flow, debt and equity capitalpital
• Plan requires additional debt and equity capital
• Return on portfolio of approximately 14% on the aggregate of projects in the Plan substantially exceeds cost of capital
PROJECTED Operating Cash Flow(2010 – 2014)
OCF(after dividends)US$ 155 billion
Funding(debt + equity)US$ 96 billion
InvestmentsUS$ 224 billion
Sources Uses
CashUS$ 11 billion
AmortizationUS$ 38 billion

37
STRATEGIC PLAN PETROBRAS 2020
CHALLENGESCHALLENGES
•• Capacity to execute a huge portfolio projectCapacity to execute a huge portfolio project
•• Strength and reliability of supply chainStrength and reliability of supply chain
•• Resource management and efficiencyResource management and efficiency
•• Human Resources challengesHuman Resources challenges
•• Funding requirements Funding requirements

38
STRATEGIC PLAN PETROBRAS 2020
Thank youThank you