Petition Requesting That The Federal Emergency Management ...
58
NATURAL RESOURCES DEFENSE COUNCIL ASSOCIATION OF STATE FLOODPLAIN MANAGERS, INC. Petition Requesting That The Federal Emergency Management Agency Amend Its Regulations Implementing the National Flood Insurance Program Jan. 5, 2021 Filed with: Regulatory Affairs Division Office of Chief Counsel, 8NE FEMA 500 C St. SW Washington, DC 20472
Transcript of Petition Requesting That The Federal Emergency Management ...

NATURAL RESOURCES DEFENSE COUNCIL ASSOCIATION OF STATE FLOODPLAIN MANAGERS, INC.
Petition Requesting That The Federal Emergency Management Agency Amend Its Regulations Implementing the
National Flood Insurance Program
Jan. 5, 2021
Filed with: Regulatory Affairs Division
Office of Chief Counsel, 8NE FEMA
500 C St. SW Washington, DC 20472

1
I. Introduction
Flooding poses a significant threat to life and property and is the most common natural hazard in the United States. Since 1973, the National Flood Insurance Program (NFIP) has paid more than $69 billion in flood insurance claims, half of which have occurred in the last 12 years. Further, the risk of flooding is increasing due to climate change impacts, like sea level rise and changing precipitation patterns, and increased development in the nation’s floodplains. As atmospheric greenhouse gas concentrations continue to rise, flood risk will continue to increase, presenting grave challenges to our nation’s cities, towns, and neighborhoods when floods strike. Congress established the NFIP in 1968 to reduce flood damages nationwide and to ease the federal government’s financial burden for providing disaster recovery. To achieve this goal, the NFIP was designed to perform three primary functions. First, the NFIP provides federally backed flood insurance to property owners and renters. Second, the NFIP establishes minimum building, land use, and floodplain management criteria designed to reduce future flood damages that participating communities must adopt to enable their residents to purchase NFIP insurance coverage. Third, the NFIP develops maps that depict certain high flood-risk areas, which not only provide the basis for the application of the NFIP’s construction and land-use requirements, but also inform community planning, the design and construction of critical infrastructure, and local land use decisions. Theoretically, the NFIP should deter development in flood-prone areas, ensure that any new development occurring in the nation’s floodplains is done in a way that minimizes the potential for flood-damage, and reduce federal expenditures on disaster recovery costs. In practice, the rising incidents of flood damages in the nation, increasing numbers of repetitive loss properties, and the growing debts of the NFIP all indicate the program is failing to achieve its primary purpose. In 2017, Congress canceled $16 billion of debt owed to the U.S. Treasury. The NFIP now has a debt of $20.5 billion. The Federal Emergency Management Agency (FEMA) plays a central role in the NFIP’s ability to guide the development of proposed construction away from locations which are threatened by flood hazards and to assist in reducing the damage caused by floods to the built environment. Per the National Flood Insurance Act, as amended, 42 U.S.C. §4001 et seq., FEMA is required to establish the building, land use, and floodplain management criteria that to the “maximum extent feasible” will limit risk development and reduce flood damages. Communities must adopt and enforce such criteria to participate in the program. Additionally, FEMA must develop, update, and maintain the NFIP’s flood maps. The FEMA flood maps serve as the basis for application of the specific NFIP minimum building, land use and floodplain management standards to all development. However, FEMA has not comprehensively amended the minimum criteria for construction and land-use in flood-prone areas since the early 1970’s despite the increasing amount of flood damages nationwide and more protective standards being feasible to implement. Nor has FEMA developed flood maps that depict: the true extent of the 1 percent and 0.2 percent chance floodplain in the nation; flood risks and residual risk associated with levees, dams and flood

2
control structures, including the additional risk should these structures fail; and future flood risks due to climate change, as required by law. Given the substantial amount of credible, scientific evidence concerning climate change’s role in increasing flood risk, coupled with growing development in flood-hazard areas, the nation cannot rely on a federal program that is failing to adequately account for these impacts. Smart policy and the law both mandate that FEMA revise the NFIP-implementing regulations to adequately account for the increasing risk of flooding due to climate change. Forward-looking construction and land-use standards as well as mapping future conditions provide communities the opportunity to anticipate and reduce flood risk, saving lives and protecting property. Through this petition, the Natural Resources Defense Council (NRDC) and the Association of State Floodplain Managers (ASFPM) request that FEMA initiates a new rulemaking under its authority under the National Flood Insurance Act, as amended, 42 U.S.C. §4001 et seq., to revise the NFIP-implementing regulations to ensure the program’s construction, land-use, mapping, and mitigation components account for current and future flood risk.
II. Petitioners
Petitioner NRDC is an international, non-profit environmental and public health membership organization with more than three million members and online activists. NRDC’s advocates to reduce greenhouse gas emissions that cause climate change, increase the resilience of communities to the unavoidable impacts of climate change, safeguard human health, and ensure safe drinking water for all. NRDC’s members are at risk of harm because FEMA’s regulations implementing the NFIP fail to adequately account for increased flood risk due to climate change. Petitioner ASFPM is a non-profit scientific and educational organization with a mission to reduce flood risk and recognize the natural functions of floodplains. ASFPM and its 37 Chapters represent over 20,000 flood risk management professionals. Our members work with FEMA every day, implementing the NFIP, the Robert T. Stafford Disaster Relief and Emergency Assistance Act, and a variety of agency programs. In addition, ASFPM works with USACE, HUD, NOAA, EPA, and others to reduce future risk from existing storms and rainfalls and to help communities prepare for, mitigate, and reduce flood risk, deaths, and damages.
III. Basis for Petition: Statement of FEMA Authority
Pursuant to the Administrative Procedure Act1 and FEMA’s governing regulations,2 NRDC and ASFPM hereby petition FEMA for the promulgation and/or amendment of a rule.
1 Administrative Procedure Act § 4(e), 5 U.S.C. § 553(e). 2 44 C.F.R. § 1.18.

3
FEMA, a division of the Department of Homeland Security, works to “help people before, during, and after disasters.”3 Pursuant to this mission, FEMA, as authorized by Congress, administers the NFIP.4 Congress intended the NFIP to be a key mechanism for reducing flood damages nationwide.5 Toward this goal, Congress and FEMA require NFIP-participating communities to adopt and enforce adequate construction and land-use measures, which meet or exceed the minimum criteria put forth by FEMA in 44 C.F.R. § 60.3, before flood insurance can be sold in the community.6 The NFIP’s minimum floodplain management criteria for construction and land-use have long been intended to limit risky development and assist in reducing future flood damages to the maximum extent feasible.7 In addition, FEMA develops Flood Insurance Rate Maps (hereafter “NFIP floodplain maps”) that depict a community’s flood hazards.8 NFIP floodplain maps are used to not only determine flood insurance rates, but also to determine which of FEMA’s construction and land-use requirements communities must adopt and enforce. Without adequate, accurate, and current floodplain maps, neither the NFIP construction and land-use requirements nor the insurance regulatory elements can be effective.9 In addition, communities, developers, and individuals rely on NFIP floodplain maps for planning purposes and risk identification when designing and constructing housing and critical facilities, such as hospitals, nursing homes, highways, bridges, and water treatments facilities.10 Under the National Flood Insurance Act, as amended, 42 U.S.C. §4001 et seq., FEMA must implement and administer the NFIP. In relevant part, the statute requires FEMA to develop comprehensive criteria that to the maximum extent feasible will “constrict the development of land which is exposed to flood damage where appropriate, guide the development of proposed construction away from locations which are threatened by flood hazards, assist in reducing the damage caused by floods, and otherwise improve the long-range land management and use of flood-prone areas.”11 In addition, FEMA must, from “time to time” develop and update these criteria, ostensibly to learn from experience and ensure that the program is meeting its flood loss
3 About Us, https://www.fema.gov/about (last visited Dec. 8, 2020). 4 42 U.S.C. § 4011(a) (stating: “[t]he Administrator of the Federal Emergency Management Agency is authorized to establish and carry out a national flood insurance program”). 5 See, id. § 4001(e) (establishing a primary purpose of the NFIP is to encourage state and local governments to constrict development in and guide development away from flood prone areas). 6 See, id. § 4022(a)(1) (stating that no new flood insurance coverage shall be provided in any area “unless an appropriate public body shall have adopted adequate land use and control measures (with effective enforcement provisions) which the Administrator finds are consistent with the comprehensive criteria for land management and use under section 4102 of this title”); see also, 44 C.F.R. 60.1(a). 7 See, 42 U.S.C. § 4001(e) (declaring a purpose of the program is to encourage states and local governments to adopt measures to limit floodplain development and reduce flood damages); 42 U.S.C. § 4102(c); see also, Legislative History of the Housing and Urban Development Act of 1968 : P.L. 90-448 : 82 Stat. 476 : Aug. 1, 1968. (1968) (providing the objectives of the land-use criteria are to inhibit the development of flood-prone land and reduce flood damages) 8 42 § 4101a, 4101b. 9 Association of State Floodplain Managers, Flood Mapping for the Nation: A Cost Analysis for Completing and Maintaining the Nation’s NFIP Flood Map Inventory 8 (2020). 10 Cf., id. at 7-8 (discussing the broad applicability of NFIP floodplain maps). 11 42 USC § 4102.

4
reduction goals.12 Further, the law requires FEMA to develop, update, and maintain floodplain maps, which must include future conditions, such as projections of sea level rise and projections of future development.13 Flooding is the most common natural hazard in the United States.14 Ongoing and future changes to the climate, combined with growing population density in coastal and other flood-prone areas, are increasing flood risk, and thus, the likelihood of damage caused by floods. NFIP policyholders and others who inhabit or utilize structures designed according to the current NFIP criteria for construction and land-use in high-risk flood areas—which are based on a historical analysis of flood risk as depicted on FEMA floodplain maps—are increasingly vulnerable to flooding, especially as climate change exacerbates flood risk. FEMA has not comprehensively amended the NFIP criteria for building and land-use in flood-prone areas since the 1970’s, despite growing flood risks and the existence of more protective standards at the state and local levels, demonstrating their feasibility. In contrast to the overarching mandate of the NFIP, the program is failing, and will fail more often in the future, to limit risky development and reduce damage caused by floods, and thus, the financial exposure of the federal government. FEMA, as the sole administrator of the NFIP, has a legal duty to promulgate and/or amend the NFIP-implementing regulations to ensure the construction and land-use criteria are to the maximum extent feasible for flood-prone areas. In addition, FEMA is vested with a mandate to develop NFIP floodplain maps that incorporate current and future conditions.
IV. Actions Requested
Pursuant to the Right to Petition the Government Clause contained in the First Amendment
of the United States Constitution,15 the Administrative Procedure Act (APA),16 and FEMA’s regulations for petitions for rulemaking,17 NRDC and ASFPM request that FEMA initiates a new rulemaking amending the agency’s NFIP-implementing regulations to adequately account for increased flood risk due to climate change and to reflect over 50 years of increased knowledge/experience managing flood risk in the country (See Section VII for specific recommendations).
V. Factual Background Flood risk is increasing across the United States due in part to increased development in the nation’s floodplains and impacts of climate change such as sea level rise and changing precipitation patterns. FEMA is obligated to establish the NFIP’s minimum land-use and
12 Id. 13 42 USC § 4101a(d)(2); 42 USC § 4101b(b)(3)(D)-(E). 14 Floods, https://www.ready.gov/floods, (last visited Dec. 8, 2020). 15 “Congress shall make no law . . . abridging . . . the right of the people . . . to petition Government for a redress of grievances.” U.S. Const. amend. I. The right to “petition for a redress of grievances [is] among the most precious of the liberties safeguarded by the Bill of Rights.” United Mine Workers of Am, Dist. 12 v. Illinois State Bar Ass’n et al, 389 U.S. 217, 222 (1967). 16 5 U.S.C. § 553(e). 17 44 C.F.R. § 1.18.

5
construction provisions to reduce the number of vulnerable properties that would be at risk in floodplains, and thus, the potential for flood damages. Yet, continued reliance on NFIP’s existing minimum building and land-use standards, and incomplete and out-of-date NFIP floodplain maps, is inadequate to achieve the goals of the program given the increased risk of flooding. In contrast, designing and constructing residential, commercial, and public infrastructure to exceed the existing minimum NFIP requirements and more stringent land-use requirements, can reduce flood risk, increase safety, and is feasible. As required by the National Flood Insurance Act, it is time FEMA amended the NFIP-implementing regulations to adequately account for the nation’s growing vulnerability to flooding due to climate change and increased development.
a. Climate Change and Population Growth are Increasing the Nation’s Flood Risk
i. Increasing Flood Risk in the United States due to Climate Change
Human emissions of greenhouse gases are the primary driver of climate change.18 The extent to which the climate will change depends on the amount of greenhouse gas emissions already released into the atmosphere and those yet to be emitted in the future.19 Under current policies worldwide, the average global temperature could be 3.8 deg to 7 deg F (2.7 to 3.1 deg C) higher than pre-industrial levels by 2100.20 Ambitious and rapid cuts in greenhouse gas emissions are needed to limit future warming to 2.7 deg F (1.5 deg C), the long-term goal of the Paris Agreement.21
1. Coastal Environments
The Global Mean Seal Level (GMSL) has risen by about 7–8 inches (about 16–21 cm)
since 1900, with about 3 of those inches (about 7 cm) occurring since 1993.22 This is the fastest rate of sea level rise over a century in at least the last 2,800 years.23 There is high scientific confidence that a significant fraction of observed GMSL rise since 1900 is associated with anthropogenic climate change.24 Climate warming is driving both increases in ocean mass through the melting of land-based ice, and ocean volume through thermal expansion.25 The
18 1 Katharine Hayhoe et al., Ch 4: Climate Models, Scenarios and Projections, in Climate Science Special Report: Fourth National Climate Assessment 133, 134 (Donald Wuebbles et al., eds., 2017) (stating: “The Earth’s climate, past and future, is not static; it changes in response to both natural and anthropogenic drivers. Humans emissions of carbon dioxide, methane, and other greenhouse gases now overwhelm the influence of natural drivers on the external forcing of Earth’s climate”). 19 See, id. at 133. 20 Temperatures: Assessing Global Warming, https://climateactiontracker.org/global/temperatures/, (last visited Dec. 8, 2020). 21 Id. 22 1 William V. Sweet et al., Ch 12: Sea Level Rise in Climate Science Special Report: Fourth National Climate Assessment 333, 333 (Donald Wuebbles et al., eds., 2017). 23 Id. 24 Id. (finding with high confidence that human-caused climate change has made a substantial contribution to sea level rise since 1900). 25 William V. Sweet et al., National Oceanic and Atmospheric Administration, NOAA Technical Report CO-OPS 083, Global and Regional Sea Level Rise Scenarios for the United States 8 (2017).

6
oceans are absorbing over 90 percent of the increased atmospheric heat associated with greenhouse gas emissions from human activity, causing them to expand.26
If global average temperature increases between from 4.2°F to 8.6°F, GMSL is very
likely (90 percent probability) to rise by 0.3 – 0.6 feet (9-18 cm) by 2030, 0.5 – 1.2 feet by 2050 (15-38 cm), and 1 – 4.3 ft (30-130 cm) by 2100 relative to the year 2000.27 Emerging science concerning Antarctic ice sheet loss, suggests that GMSL rise exceeding 8 feet (2.5 m) is possible by 2100.28
However, even if human-caused greenhouse gases emissions abruptly ceased, GMSL will
still rise by roughly 1 foot by 2100, which tracks the current rate of GMSL rise of 0.1 inches/year.29 Thus, GMSL rise is a certain impact of climate change.
Importantly, sea levels are not rising uniformly across the globe due to factors such as
geological subsidence and local ocean currents.30 In the United States, sea level rise has been greater than the global average in the Northeast and western Gulf Coast.31 Between 1992 - 2016, the highest rates of sea level rise were found in regions of Louisiana (0.3 inch/year), Texas (0.2 inch/year), and along the Northeast Atlantic from Virginia to New Jersey (0.1 inch/year).32 This pattern of uneven sea level rise will continue. For instance, if GMSL rises by 4.9 feet (1.5 meters) by 2100, sea levels may be about 1.3–2.3 feet (0.4–0.7 m) higher than GMSL rise along the U.S. East Coast and 0.7–3.2 feet (0.2–1.0 m) higher along the Gulf Coast.33
As discussed below, rising sea levels have already exacerbated several threats to coastal communities, including increased tidally driven flooding, larger storm surges, and increased severity of coastal storms.34 Flooding amplified by sea level rise poses significant economic, social, health, and environmental risks to coastal land, infrastructure, property, ecosystems, and communities.35
26 1 Libby Jewett et al., Ch 13: Ocean Acidification and Other Ocean Changes in Climate Science Special Report: Fourth National Climate Assessment 364, 365 (Donald Wuebbles et al., eds., 2017). 27 1 William V. Sweet et al., Ch 12: Sea Level Rise in Climate Science Special Report: Fourth National Climate Assessment 333, 333 (Donald Wuebbles et al., eds., 2017) (having very high confidence in lower bounds, medium confidence in upper bounds for 2030 and 2050, and low confidence in upper bounds by 2100). 28 Id. 29 Id. at 342. 30 National Oceanic and Atmospheric Administration, What is the Difference Between Local Sea Level and Global Sea Level?, https://oceanservice.noaa.gov/facts/sealevel-global-local.html, (last visited Dec. 8, 2020). 31 William V. Sweet et al., National Oceanic and Atmospheric Administration, NOAA Technical Report CO-OPS 083, Global and Regional Sea Level Rise Scenarios for the United States 9 - 10 (2017). 32 Id. (land subsidence plays a role). 33 Id. at 29 34 2 Elizabeth Fleming et al., Ch 8: Coastal Effects: Impacts, Risks, and Adaptation in the United States in Fourth National Climate Assessment 332 (David Reidmiller et al., eds., 2018); Maya K. Buchanan, Michael Oppenheimer, & Robert F. Kopp, Amplification of Flood Frequencies with Local Sea Level Rise and Emerging Flood Regimes, 12 Envt.l Research Letters 1 (2017); Hamed Moftakhari et al., Increased Nuisance Flooding Along the Coasts of the United States due to Sea Level Rise: Past and Future, 42 Geophysical Research Letters 9846 (2015). 35 2 Elizabeth Fleming et al., Ch 8: Coastal Effects: Impacts, Risks, and Adaptation in the United States in Fourth National Climate Assessment 332 (David Reidmiller et al., eds., 2018); Maya K. Buchanan, Michael Oppenheimer, & Robert F. Kopp, Amplification of Flood Frequencies with Local Sea Level Rise and Emerging Flood Regimes, 12

7
A. Tidal Flooding
The increasing frequency, depth, and extent of tidal flooding due to sea level rise threatens coastal properties and public infrastructure.36 As sea levels have risen, the number of tidal floods each year that cause minor damage (i.e., “nuisance levels” of about 1-2 feet) have increased 5- to 10-fold since the 1960s in multiple U.S. coastal cities.37 Atlantic City and Sandy Hook, NJ; Philadelphia, PA; Baltimore and Annapolis, MD; Norfolk, VA; Wilmington, NC; Charleston, SC; Savannah, Georgia; Mayport, Key West, and Port Isabel, FL are all experiencing such trends.38 In fact, tidal flood rates have been accelerating in more than 25 East and Gulf Coast cities over the last several decades.39
The annual number of tidal floods is projected to increase as sea levels continue to rise.40
Under the Intermediate Low and Intermediate scenarios for GMSL, by 2050, high tide flooding could occur on average about:
• 45 and 130 days/year (30 and 45% from tidal forcing alone) along the Northeast Atlantic and 25 and 85 days/year (35 and 65% from tides) along the Southeast Atlantic, respectively; and
• 25 and 80 days/year (0 and 55% from tides) along the Eastern Gulf and 80 and 185 days/year (45 and 80% from tides) along the Western Gulf, respectively.41
By 2100, high tide flooding could occur the equivalent of every other day (182 days/year) or more under the Intermediate Low Scenario within the Northeast and Southeast Atlantic, the Eastern and Western Gulf, and the Pacific Islands.42
These more frequent flood events are also expected to impose significant socioeconomic
costs, including property damage, long term effects on crucial infrastructure, and negative impacts on public health.43 In the next 30 years, nearly 300,000 of today’s residential and commercial properties could be at risk of chronic coastal flooding—flooding that occurs 26 times per year or more.44 By the end of the 21st century, nearly 2.5 million properties may be at
Envt.l Research Letters 1 (2017); Hamed Moftakhari et al., Increased Nuisance Flooding Along the Coasts of the United States due to Sea Level Rise: Past and Future, 42 Geophysical Research Letters 9846 (2015). 36 1 William V. Sweet et al., Ch 12: Sea Level Rise in Climate Science Special Report: Fourth National Climate Assessment 333, 333 (Donald Wuebbles et al., eds., 2017). 37 Id.at 347. 38 Id. 39 Id. 40 See generally, William V. Sweet et al., National Oceanic and Atmospheric Administration, NOAA Technical Report CO-OPS 086, Patterns and Projections of High Tide Flooding Along the U.S. Coastline Using a Common Impact Threshold (2018) (finding that with continued sea level rise, high tide flood frequencies will continue to increase rapidly), 41 Id. at 32. 42 Id. at ix. 43 See, Maya K. Buchanan, Michael Oppenheimer, & Robert F. Kopp, Amplification of Flood Frequencies with Local Sea Level Rise and Emerging Flood Regimes, 12 Envt.l Research Letters 1, 1 (2017); see also, Hamed Moftakhari et al., Increased Nuisance Flooding Along the Coasts of the United States due to Sea Level Rise: Past and Future, 42 Geophysical Research Letters 9846, 9847 (2015). 44 Union of Concerned Scientists, Underwater: Rising Seas, Chronic Floods, and the Implications for US Coastal Real Estate, 1 (2018)

8
risk.45 Millions of Americans living in these areas will be negatively impacted as their homes and businesses become untenable due to persistent, high-tide flooding. These economic losses are exacerbated by increased exposure from continued development in coastal areas.46
B. Larger Storm Surge Higher storm surges due to sea level rise, and the increasing probability of heavy precipitation events, further exacerbate risk to coastal communities. Even the relatively small increases in sea level over the last several decades have led to greater storm impacts at many places along the U.S. coast.47 For example, sea level rise since 1800 has sharply increased the frequency of coastal floods of the magnitude seen during Hurricane Sandy.48
Flood events, like the 1 percent chance annual flood (“100-year flood”) or events with a smaller probability will become more frequent in the future. Such events have the possibility of occurring decadally or even yearly at some locations by 2050.49 The majority of coastal locations in the U.S. will experience substantially higher frequencies of previously rare storm-driven water heights. Sea level rise will cause new flood regimes to emerge in different regions of the country based on factors such as hydrology, topography, and meteorology.50 Some coastal communities will be subject to a greater increase in higher frequency flood events (i.e. 10-year floods) while other communities will face disproportionately greater risks of more severe, lower frequency flood events (i.e. 500-year floods).51 For example, under approximately 20 inches (50 cm) of local sea level rise, the frequency of the 10-year, 100-year, and 500-year floods are expected to increase by 148, 16, and 4 times in Charleston, SC, and by 109, 335, and 814 times in Seattle, WA.52
At tide gauge locations across the contiguous U.S. coastline, a median 25-fold increase of the expected annual number of local 100-year floods is expected by 2050 under an intermediate greenhouse gas emissions scenario (RCP 4.6) and a median 40-fold increase is projected under a high greenhouse gas emissions scenario (RCP 8.5), and these numbers jump significantly by the
45 Id. 46 2 Elizabeth Fleming et al., Ch 8: Coastal Effects in Impacts, Risks, and Adaptation in the United States: Fourth National Climate Assessment 332, 333 (David Reidmiller et al., eds., 2018) 47 See, William V. Sweet et al., National Oceanic and Atmospheric Administration, NOAA Technical Report CO-OPS 086, Patterns and Projections of High Tide Flooding Along the U.S. Coastline Using a Common Impact Threshold 1 (2018) 48 Ning Lin et al., Hurricane Sandy’s Flood Frequency Increasing from year 1800 to 2100, 113 (43) Proceedings of the National Academy of Sciences 12071, 12071 (2016); William Sweet et al., Hurricane Sandy Inundation Probabilities Today and Tomorrow in Explaining Extreme Events of 2012 from a Climate Perspective, 94 (9) Bulletin of the American Meteorological Society S17, S17 (2013). 49 Michael Oppenheimer et al., Sea Level Rise and Implications for Low-Lying Islands, Coasts, and Communities in IPCC Special Report on the Ocean and the Cryosphere in a Changing Climate 321, 357 – 360 (Hans-Otto et al., eds. 2019). 50 See, Maya K. Buchanan, Michael Oppenheimer, & Robert F. Kopp, Amplification of Flood Frequencies with Local Sea Level Rise and Emerging Flood Regimes, 12 Envt.l Research Letters 1, 4 (2017). 51 Id. at 1. 52 Id.

9
year 2100.53 These estimates demonstrate that the expected number of occurrences in a single year of today’s 100-year flood in one year will be significantly higher than today and will vary by location.54
C. Increased Severity of Coastal Storms
As the global average temperatures rise, hurricanes and tropical storms are projected to be stronger and wetter.55 The intensity of tropical cyclones is projected to increase, with a higher frequency of Category 4-5 storms.56 Precipitation rates of tropical cyclones are also projected to increase globally. Multiple studies have found that anthropogenic warming increased the probability, rate, and/or total amount of rainfall of Tropical Storm Imelda and Hurricanes Harvey, Irma, and Florence.57
The projected increases in sea level, average tropical storm intensity, and tropical cyclone rainfall rates will act to further elevate future storm surge risk. By one estimate, the combination of changes in sea level and characteristics of tropical storms under a high-emissions scenario (RCP 8.5) could bring what were historically 100-year floods on an annual basis to New England and the mid-Atlantic.58
2. Inland Environments
Climate change “has detectably influenced” important drivers of floods, such as rainfall and snowmelt.59 Well-established relationships between temperature and humidity suggest that warming temperatures increase evaporation rates and the atmosphere’s water holding capacity,
53 Id. 54 Id. 55 1 James P. Kossin,et al., Ch 9: Extreme Storms in Climate Science Special Report: Fourth National Climate Assessment 257, 258-9 (Donald Wuebbles et al., eds., 2017). 56 Id. at 260; see also, Thomas Knutson, et al., Tropical Cyclones and Climate Change Assessment: Part II: Projected Response to Anthropogenic Warming, 101 (3) Bulletin of American Meteorological Society E303, E306 - 08 (2019). 57 Kevin Reed et. al., Forecasted Attribution of the Human Influence on Hurricane Florence, 6 Science Advances 1 (2020); David J. Frame et al., The Economic Costs of Hurricane Harvey Attributable to Climate Change, 160 Climatic Change 271(2020); Geert Jan van Oldenborgh et al., Rapid Attribution of the Extreme Rainfall in Texas from Tropical Storm Imelda (2019) available at https://www.worldweatherattribution.org/rapid-attribution-of-the-extreme-rainfall-in-texas-from-tropical-storm-imelda/; Geert Jan van Oldenborgh et al., Attribution of Extreme Rainfall from Hurricane Harvey, 12 (12) Environmental Research Letters 1 (2018); Christina M. Patricola and Michael Wehner, Anthropogenic Influences on Major Tropical Cyclones, 563 Nature 339 (2018); Kerry Emanuel, Assessing the Present and Future Probability of Hurricane Harvey’s Rainfall, 114 (48) Proceedings of the National Academy of Sciences 12681 (2017); Mark D. Risser and Michael F. Wehner, Attributable Human-Induced Changes in the Likelihood and Magnitude of the Observed Extreme Precipitation during Hurricane Harvey, 44 (24) Geophysical Research Letters 12,457 (2017). 58 Reza Marsooli et al., Climate Change Exacerbates Hurricane Flood Hazards Along US Atlantic and Gulf Coasts in Spatially Varying Patterns, 10 Nature Communications 1, 2 (2019) 59 Sonia Seneviratne et al., Ch 3: Changes in Climate Extremes and their Impacts on the Natural Physical Environment in IPCC Special Report on Managing the Risks of Extreme Events and Disasters to Advance Climate Change Adaptation 109, 177 (2012).

10
leading to higher levels of water vapor in the atmosphere. This increases the likelihood of more frequent and intense precipitation events.60 Anthropogenic climate change has already affected U.S. rainfall patterns over the last century, with strong regional variation.61 Annual precipitation has increased across most of the northern and eastern United States since 1901, while the Southwest, and the Southeast have seen decreases.62 Averaged across the United States, annual precipitation has increased more than 4 percent.63 Heavy precipitation events have also gotten more frequent and intense over the same time period in nearly every region of the country, with the largest changes in the northern Great Plains, the Midwest, and the Northeast.64 In 2018, for instance, anthropogenic climate change made exceptional rainfall across the mid-Atlantic 1.1 to 2.3 times more likely and contributed to months of severe flooding.65 Extreme precipitation events are expected to get even more frequent and severe as the climate warms.66 One recent study found that by the 2020 to 2049 period, even a medium-emissions scenario could increase the frequency of extreme precipitation by more than 200 percent in some U.S. regions, and increase the magnitude of those events by more than 20 percent.67 The largest projected increases in magnitude may happen in the southeastern U.S., and the largest increases in frequency in the southeast, Eastern Seaboard, and the west from the Pacific Coast to the western Rocky Mountains.68
ii. Increasing Flood Risk in the United States due to Population Growth Even without factoring in the effects of climate change, damages from coastal and inland flooding are projected to increase significantly as the U.S. population grows and development in flood-prone areas expands.69 In 2010, the total U.S. population was 309 million, almost a 10 percent increase from the population in 2000.70 The U.S. Census Bureau predicts that the U.S. population will reach 400 million by mid-century.71
60 2 Katharine Hayhoe et al., Ch 2: Our Changing Climate in Impacts, Risks, and Adaptation: Fourth National Climate Assessment 72, 88 (2018); Louise J. Slater and Gabriele Villarini, Recent Trends in U.S. Flood Risk, 43 (24) Geophysical Research Letters 12,428, 12,435 (2016). 61 Megan Kirchmeier-Young & Xuebin Zhang, Human Influence Has Intensified Extreme Precipitation in North America, 117 (24) Proceedings of the National Academy of Sciences 13308, 13309 (2020). 62 1 David R. Easterling et al., Ch 7: Precipitation Change in the United States in Climate Science Special Report: Fourth National Climate Assessment 207, 208 (Donald Wuebbles et al., eds., 2017) 63 Id. 64 Id. at 210. 65 Jonathan M. Winter et al., Anthropogenic Impacts on the Exceptional Precipitation of 2018 in the Mid-Atlantic United States in Explaining Extreme Events of 2018 from a Climate Perspective S5, S8 (2020). 66 2 Katharine Hayhoe et al., Ch 2: Our Changing Climate in Impacts, Risks, and Adaptation: Fourth National Climate Assessment 72, 88 (2018) 67 Daniel Swain et al., Increased Flood Exposure Due to Climate Change and Population Growth in the United States, 8 (11) Earth’s Future 1, 9 (2020). 68 Id. 69 Oliver Wing et al., Estimates of present and future flood risk in the conterminous United States, 13 (3) Environmental Research Letters 1, 6 (2018). 70 Technical Mapping Advisory Council, Future Conditions Risk Assessment and Modeling 3-13 (2015). 71 Id.
11
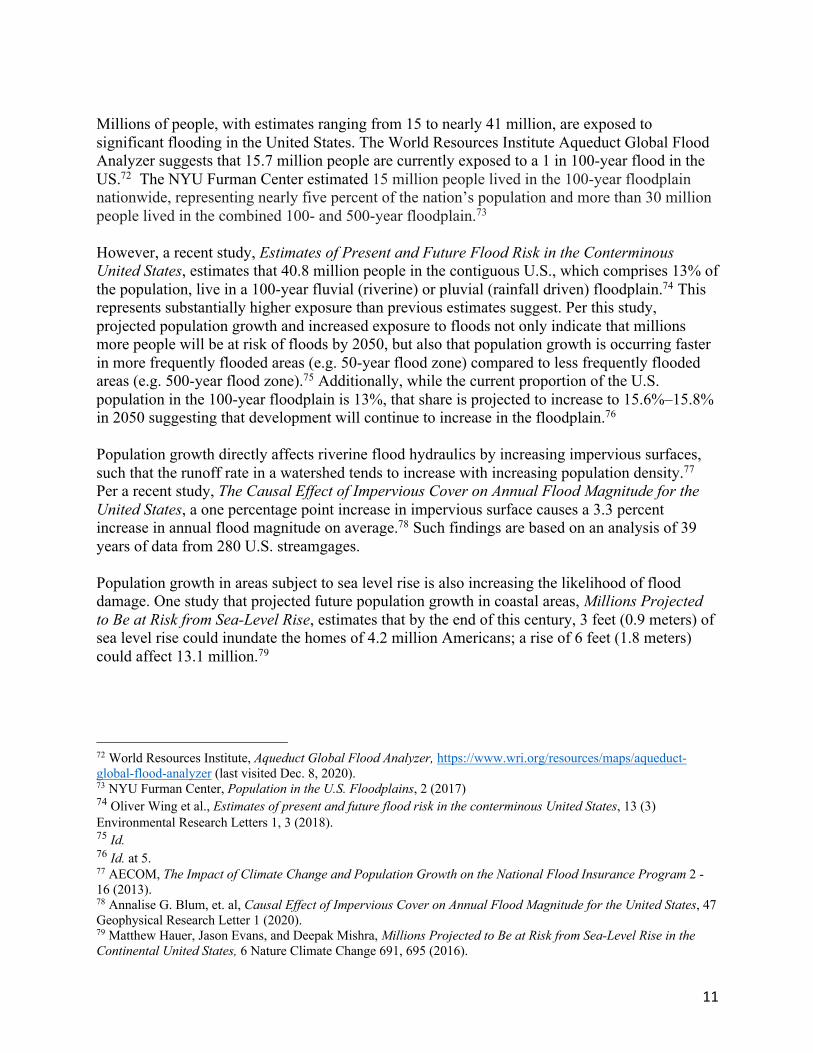
Millions of people, with estimates ranging from 15 to nearly 41 million, are exposed to significant flooding in the United States. The World Resources Institute Aqueduct Global Flood Analyzer suggests that 15.7 million people are currently exposed to a 1 in 100-year flood in the US.72 The NYU Furman Center estimated 15 million people lived in the 100-year floodplain nationwide, representing nearly five percent of the nation’s population and more than 30 million people lived in the combined 100- and 500-year floodplain.73 However, a recent study, Estimates of Present and Future Flood Risk in the Conterminous United States, estimates that 40.8 million people in the contiguous U.S., which comprises 13% of the population, live in a 100-year fluvial (riverine) or pluvial (rainfall driven) floodplain.74 This represents substantially higher exposure than previous estimates suggest. Per this study, projected population growth and increased exposure to floods not only indicate that millions more people will be at risk of floods by 2050, but also that population growth is occurring faster in more frequently flooded areas (e.g. 50-year flood zone) compared to less frequently flooded areas (e.g. 500-year flood zone).75 Additionally, while the current proportion of the U.S. population in the 100-year floodplain is 13%, that share is projected to increase to 15.6%–15.8% in 2050 suggesting that development will continue to increase in the floodplain.76 Population growth directly affects riverine flood hydraulics by increasing impervious surfaces, such that the runoff rate in a watershed tends to increase with increasing population density.77 Per a recent study, The Causal Effect of Impervious Cover on Annual Flood Magnitude for the United States, a one percentage point increase in impervious surface causes a 3.3 percent increase in annual flood magnitude on average.78 Such findings are based on an analysis of 39 years of data from 280 U.S. streamgages. Population growth in areas subject to sea level rise is also increasing the likelihood of flood damage. One study that projected future population growth in coastal areas, Millions Projected to Be at Risk from Sea-Level Rise, estimates that by the end of this century, 3 feet (0.9 meters) of sea level rise could inundate the homes of 4.2 million Americans; a rise of 6 feet (1.8 meters) could affect 13.1 million.79
72 World Resources Institute, Aqueduct Global Flood Analyzer, https://www.wri.org/resources/maps/aqueduct-global-flood-analyzer (last visited Dec. 8, 2020). 73 NYU Furman Center, Population in the U.S. Floodplains, 2 (2017) 74 Oliver Wing et al., Estimates of present and future flood risk in the conterminous United States, 13 (3) Environmental Research Letters 1, 3 (2018). 75 Id. 76 Id. at 5. 77 AECOM, The Impact of Climate Change and Population Growth on the National Flood Insurance Program 2 - 16 (2013). 78 Annalise G. Blum, et. al, Causal Effect of Impervious Cover on Annual Flood Magnitude for the United States, 47 Geophysical Research Letter 1 (2020). 79 Matthew Hauer, Jason Evans, and Deepak Mishra, Millions Projected to Be at Risk from Sea-Level Rise in the Continental United States, 6 Nature Climate Change 691, 695 (2016).

12
Economic activity, development, and population growth have occurred and are continuing to grow in high flood hazard areas.80 Given these projections, the NFIP must update the construction and land-use requirements to constrict such increasing development in flood-prone areas.
b. The 100-year Flood Standard is an Increasingly Inadequate Indicator of Risk
The national standard for assessing, managing, and rating flood risk under the NFIP is the floodwater surface elevation having a 1 percent chance of being equaled or exceeded in any given year, also referred to as the “100-year flood.”81
The 100-year flood standard is a statistical construct representing the probability that a
flood of a certain discharge will have a 1 percent chance of occurrence in any year and will produce a specific flood elevation with that discharge.82 The computed elevation of the 1 percent discharge is used to delineate the extent of the 1 percent floodplain on NFIP floodplain maps (i.e., FIRMs). Areas that are inundated at the 100-year flood level are identified as falling within the Special Flood Hazard Area (SFHA) in FEMA flood studies and mapping.83Communities desiring to participate in the NFIP must agree to regulate the use of the 1 percent floodplain. Those community floodplain management regulations must equal or exceed the NFIP’s minimum land use and building standards for development in the SFHA. For instance, the NFIP requires communities to ensure that new construction or substantially improved existing buildings in the SFHA have their lowest floor (including basement) elevated to or above the elevation of the 1 percent flood.84 The NFIP building and land-use regulations were established to reduce the number of vulnerable properties that would be at risk in floodplains, and thus, the potential costs to the government of post-flood assistance.85
The accuracy of the SFHA depends on the resolution of the mapping data, the availability of stream and meteorological data, and the accuracy of the flow computations. Current mapping practice is to apply historical climate information to existing topography and development conditions. However, there are two potential problems with this approach: (1) observations and data for the past are incomplete or inaccurate; and (2) past averages and trends are not accurate
80 Oliver Wing et al., Estimates of present and future flood risk in the conterminous United States, 13 (3) Environmental Research Letters 1, 3 (2018); Thomas Peterson et al., Monitoring and Understanding Changes in Heat Waves, Cold Waves, Floods and Droughts in the United States: State of Knowledge, 94 (6) Bulletin of the American Meteorological Society 821, 825-26 (2013). 81 See, 44 C.F.R. § 60.3 (requiring a structure’s lowest floor be at the height the base flood); see also, 44 C.F.R. § 59.1(defining the base as the flood having a one percent chance of being equaled or exceeded in any given year and defining the 100–year flood as the base flood); Gerald E. Galloway et al., American Institutes for Research, Assessing the Adequacy of the National Flood Insurance Program’s 1 Percent Flood Standard, 2 (2006) (stating: “the Federal Insurance Administration (FIA), the agency within the HUD responsible for the NFIP, issued a final rule that established the 100-year flood as the regulatory standard for implementation of the NFIP”). 82 Gerald E. Galloway et al., American Institutes for Research, Assessing the Adequacy of the National Flood Insurance Program’s 1 Percent Flood Standard 17 (2006). 83 44 C.F.R. § 59.1 (defining the SFHA as the land in the flood plain within a community subject to a 1 percent or greater chance of flooding in any given year). 84 44 C.F.R § 60.3. 85 Gerald Galloway et. al, American Institutes for Research, Assessing the Adequacy of the National Flood Insurance Program’s 1 percent Flood Standard ix. (2006)
13
indicators of the future if large changes occur in natural and manmade systems. As detailed above, the impacts of climate change and population growth in high-flood risk areas, coupled with incomplete and/or out-of-date underlying flood risk data, render determinations of the 1 percent annual chance flood increasingly inaccurate.
i. Current Shortcomings of Building to 100-year Flood Standard
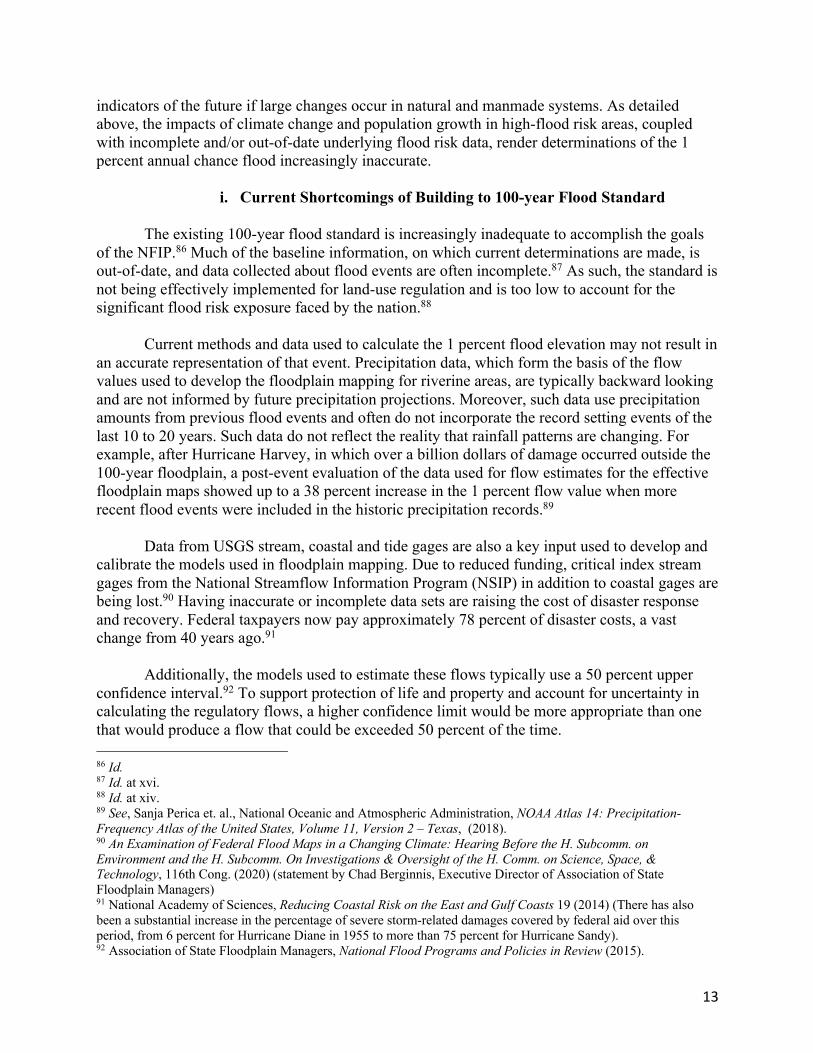
The existing 100-year flood standard is increasingly inadequate to accomplish the goals of the NFIP.86 Much of the baseline information, on which current determinations are made, is out-of-date, and data collected about flood events are often incomplete.87 As such, the standard is not being effectively implemented for land-use regulation and is too low to account for the significant flood risk exposure faced by the nation.88
Current methods and data used to calculate the 1 percent flood elevation may not result in an accurate representation of that event. Precipitation data, which form the basis of the flow values used to develop the floodplain mapping for riverine areas, are typically backward looking and are not informed by future precipitation projections. Moreover, such data use precipitation amounts from previous flood events and often do not incorporate the record setting events of the last 10 to 20 years. Such data do not reflect the reality that rainfall patterns are changing. For example, after Hurricane Harvey, in which over a billion dollars of damage occurred outside the 100-year floodplain, a post-event evaluation of the data used for flow estimates for the effective floodplain maps showed up to a 38 percent increase in the 1 percent flow value when more recent flood events were included in the historic precipitation records.89
Data from USGS stream, coastal and tide gages are also a key input used to develop and
calibrate the models used in floodplain mapping. Due to reduced funding, critical index stream gages from the National Streamflow Information Program (NSIP) in addition to coastal gages are being lost.90 Having inaccurate or incomplete data sets are raising the cost of disaster response and recovery. Federal taxpayers now pay approximately 78 percent of disaster costs, a vast change from 40 years ago.91
Additionally, the models used to estimate these flows typically use a 50 percent upper
confidence interval.92 To support protection of life and property and account for uncertainty in calculating the regulatory flows, a higher confidence limit would be more appropriate than one that would produce a flow that could be exceeded 50 percent of the time.
86 Id. 87 Id. at xvi. 88 Id. at xiv. 89 See, Sanja Perica et. al., National Oceanic and Atmospheric Administration, NOAA Atlas 14: Precipitation-Frequency Atlas of the United States, Volume 11, Version 2 – Texas, (2018). 90 An Examination of Federal Flood Maps in a Changing Climate: Hearing Before the H. Subcomm. on Environment and the H. Subcomm. On Investigations & Oversight of the H. Comm. on Science, Space, & Technology, 116th Cong. (2020) (statement by Chad Berginnis, Executive Director of Association of State Floodplain Managers) 91 National Academy of Sciences, Reducing Coastal Risk on the East and Gulf Coasts 19 (2014) (There has also been a substantial increase in the percentage of severe storm-related damages covered by federal aid over this period, from 6 percent for Hurricane Diane in 1955 to more than 75 percent for Hurricane Sandy). 92 Association of State Floodplain Managers, National Flood Programs and Policies in Review (2015).
14
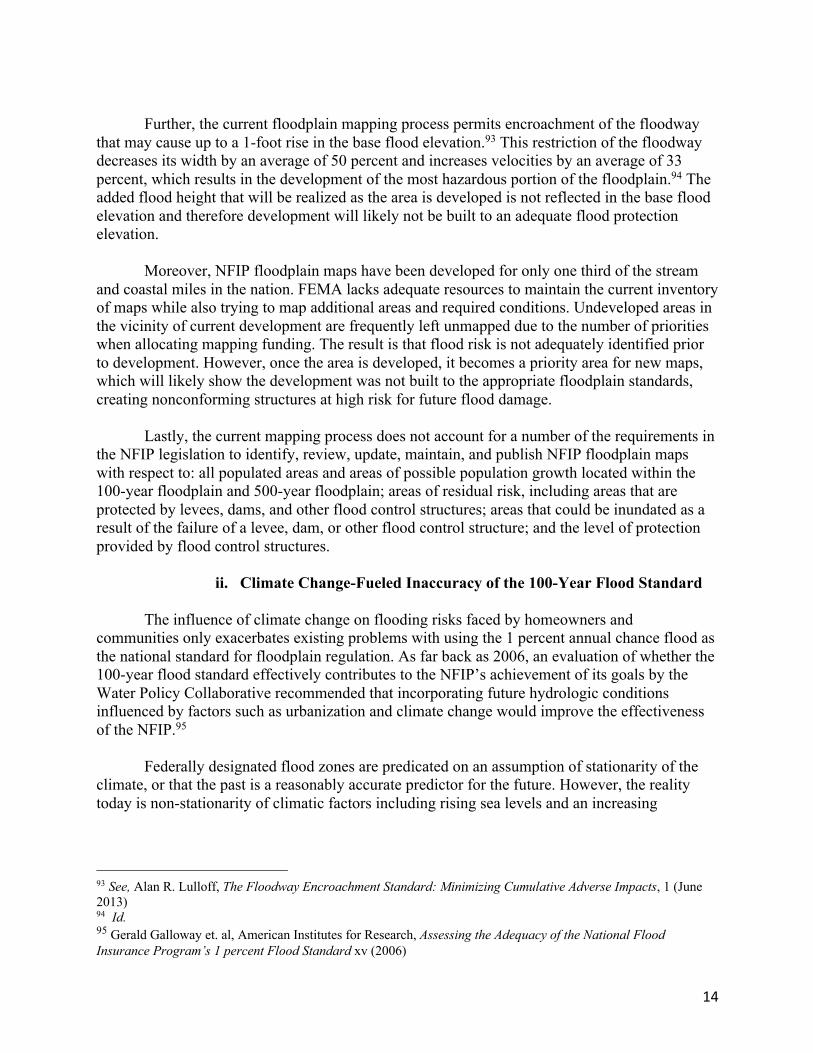
Further, the current floodplain mapping process permits encroachment of the floodway
that may cause up to a 1-foot rise in the base flood elevation.93 This restriction of the floodway decreases its width by an average of 50 percent and increases velocities by an average of 33 percent, which results in the development of the most hazardous portion of the floodplain.94 The added flood height that will be realized as the area is developed is not reflected in the base flood elevation and therefore development will likely not be built to an adequate flood protection elevation.
Moreover, NFIP floodplain maps have been developed for only one third of the stream and coastal miles in the nation. FEMA lacks adequate resources to maintain the current inventory of maps while also trying to map additional areas and required conditions. Undeveloped areas in the vicinity of current development are frequently left unmapped due to the number of priorities when allocating mapping funding. The result is that flood risk is not adequately identified prior to development. However, once the area is developed, it becomes a priority area for new maps, which will likely show the development was not built to the appropriate floodplain standards, creating nonconforming structures at high risk for future flood damage.
Lastly, the current mapping process does not account for a number of the requirements in
the NFIP legislation to identify, review, update, maintain, and publish NFIP floodplain maps with respect to: all populated areas and areas of possible population growth located within the 100-year floodplain and 500-year floodplain; areas of residual risk, including areas that are protected by levees, dams, and other flood control structures; areas that could be inundated as a result of the failure of a levee, dam, or other flood control structure; and the level of protection provided by flood control structures.
ii. Climate Change-Fueled Inaccuracy of the 100-Year Flood Standard
The influence of climate change on flooding risks faced by homeowners and communities only exacerbates existing problems with using the 1 percent annual chance flood as the national standard for floodplain regulation. As far back as 2006, an evaluation of whether the 100-year flood standard effectively contributes to the NFIP’s achievement of its goals by the Water Policy Collaborative recommended that incorporating future hydrologic conditions influenced by factors such as urbanization and climate change would improve the effectiveness of the NFIP.95
Federally designated flood zones are predicated on an assumption of stationarity of the climate, or that the past is a reasonably accurate predictor for the future. However, the reality today is non-stationarity of climatic factors including rising sea levels and an increasing
93 See, Alan R. Lulloff, The Floodway Encroachment Standard: Minimizing Cumulative Adverse Impacts, 1 (June 2013) 94 Id. 95 Gerald Galloway et. al, American Institutes for Research, Assessing the Adequacy of the National Flood Insurance Program’s 1 percent Flood Standard xv (2006)
15
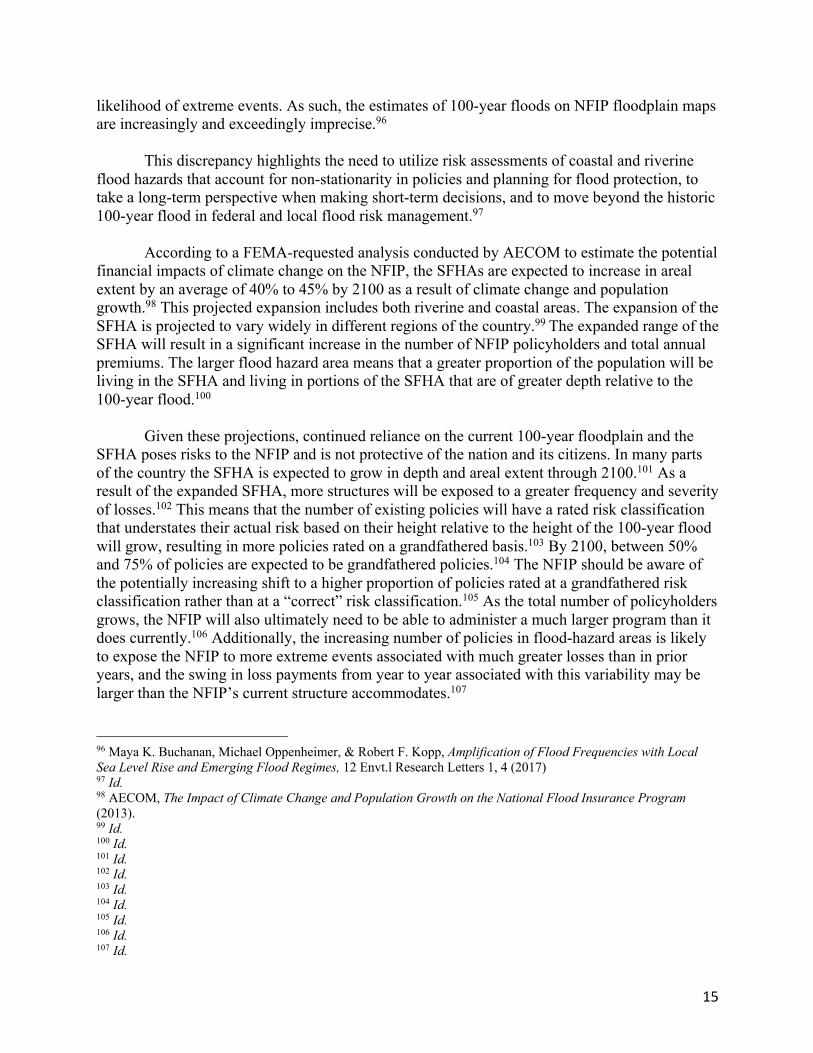
likelihood of extreme events. As such, the estimates of 100-year floods on NFIP floodplain maps are increasingly and exceedingly imprecise.96
This discrepancy highlights the need to utilize risk assessments of coastal and riverine
flood hazards that account for non-stationarity in policies and planning for flood protection, to take a long-term perspective when making short-term decisions, and to move beyond the historic 100-year flood in federal and local flood risk management.97
According to a FEMA-requested analysis conducted by AECOM to estimate the potential financial impacts of climate change on the NFIP, the SFHAs are expected to increase in areal extent by an average of 40% to 45% by 2100 as a result of climate change and population growth.98 This projected expansion includes both riverine and coastal areas. The expansion of the SFHA is projected to vary widely in different regions of the country.99 The expanded range of the SFHA will result in a significant increase in the number of NFIP policyholders and total annual premiums. The larger flood hazard area means that a greater proportion of the population will be living in the SFHA and living in portions of the SFHA that are of greater depth relative to the 100-year flood.100
Given these projections, continued reliance on the current 100-year floodplain and the SFHA poses risks to the NFIP and is not protective of the nation and its citizens. In many parts of the country the SFHA is expected to grow in depth and areal extent through 2100.101 As a result of the expanded SFHA, more structures will be exposed to a greater frequency and severity of losses.102 This means that the number of existing policies will have a rated risk classification that understates their actual risk based on their height relative to the height of the 100-year flood will grow, resulting in more policies rated on a grandfathered basis.103 By 2100, between 50% and 75% of policies are expected to be grandfathered policies.104 The NFIP should be aware of the potentially increasing shift to a higher proportion of policies rated at a grandfathered risk classification rather than at a “correct” risk classification.105 As the total number of policyholders grows, the NFIP will also ultimately need to be able to administer a much larger program than it does currently.106 Additionally, the increasing number of policies in flood-hazard areas is likely to expose the NFIP to more extreme events associated with much greater losses than in prior years, and the swing in loss payments from year to year associated with this variability may be larger than the NFIP’s current structure accommodates.107
96 Maya K. Buchanan, Michael Oppenheimer, & Robert F. Kopp, Amplification of Flood Frequencies with Local Sea Level Rise and Emerging Flood Regimes, 12 Envt.l Research Letters 1, 4 (2017) 97 Id. 98 AECOM, The Impact of Climate Change and Population Growth on the National Flood Insurance Program (2013). 99 Id. 100 Id. 101 Id. 102 Id. 103 Id. 104 Id. 105 Id. 106 Id. 107 Id.

16
c. Forward-Looking Construction and Land-Use Standards and Mapping Future Conditions Reduce Flood Risk
Designing and constructing residential, commercial, and public infrastructure to exceed minimum NFIP requirements can reduce flood risk, increase safety, and prevent property loss.108 Additionally, such mitigation has been adopted by multiple state and local jurisdictions and is a sound financial investment, demonstrating feasibility. For instance, building single family homes to the flood elevation requirements of most recent International Residential Code and the International Building Code (“the I-Codes”) in comparison to the NFIP’s flood elevation requirement provides a 6:1 benefit-cost ratio.109 The I-Codes are the most widely accepted, comprehensive set of model codes used in the United States.110
i. Current Minimum Elevation Standard for Flood Safety under the I-Codes
Since 2015, the I-Codes have required at least 1 foot of elevation (“freeboard”) above the height of the 1 percent annual chance flood. This aspect of the I-Codes saves $550 million over the long-term for every year of new buildings built to the code.111 Eighty-seven percent ($470 million) of the benefit is in the form of avoided property damage.112 Freeboard for new construction has a high benefit-cost ratio because freeboard provides a factor of safety both for current flood events where due to uncertainty the flood level for a flood more frequent than the 1 percent annual chance event could exceed BFE and to address future conditions where flood elevations can change due to future development, which can either constrict flow or increase runoff. Additionally, freeboard can provide added protection against future climate change impacts, such as sea level rise, that could make higher flood levels more frequent.113 However, as of 2015, approximately 38 percent of communities that participate in the NFIP do not incorporate freeboard into their floodplain ordinances.114 In these communities, buildings constructed in the SFHA are only required to be built to the NFIPs’ minimum requirement, the height of the 1 percent annual chance flood.
108 See generally, National Institute of Building Sciences, Natural Hazard Mitigation Saves: 2019 Report (2019) (finding the benefits, which include avoided damages, of exceeding the NFIP’s building criteria greatly exceed the costs). 109 Id. at 9. 110 International Codes Council, The International Codes, https://www.iccsafe.org/products-and-services/i-codes/the-icodes/#:~:text=The%20International%20Codes%20(I%2DCodes,sustainable%2 C%20affordable%20and%20resilient%20structures (last visited Dec. 9, 2020). 111 National Institute of Building Sciences, Natural Hazard Mitigation Saves: 2019 Report 70 - 71 (2019) 112 Id. 113 Id. at 141; see also, Christopher P. Jones et al., American Institutes for Research, Evaluation of the National Flood Insurance Program’s Building Standards xiii – ix (2006). 114 National Institute of Building Sciences, Natural Hazard Mitigation Saves: 2019 Report 141 (2019)

17
ii. Exceeding Minimum Elevation Standard under the I-Codes Even exceeding the 2015 I-codes elevation requirement for riverine and coastal flooding enjoys a benefit-cost ratio of 5:1 and 7:1, respectively.115 The costs reflect only the added cost relative to the 2015 I-Codes, which provide a higher elevation standard than the NFIP minimum requirements. For riverine flooding, every $1 spent to build new homes higher out of the floodplain – up to 5 feet above the height of the 100-year flood – saves $5 in costs.116
Benefits and Costs for Additional Elevation above I-Code Minimum in Sample of Communities that Represent Common Floodplain Conditions and Residential Structures
Found in Riverine Flooding Height Cost Benefit BCR ΔCost ΔBenefit DB/DC Allen County, IN
BFE + 2 $793,972 $3,275,548 4.13 $793,972 $3,275,548 4.13 BFE + 3 $1,191,106 $5,665,808 4.76 $397,134 $2,390,260 6.02 BFE + 4 $1,588,023 $7,614,300 4.79 $396,917 $1,948,493 4.91 BFE + 5 $2,022,687 $8,418,696 4.16 $434,663 $804,396 1.85 Elkhart County, IN
BFE + 2 $2,537,343 $9,534,636 3.76 $2,537,343 $9,534,636 3.76 BFE + 3 $3,806,507 $15,925,500 4.18 $1,269,164 $6,390,864 5.04 BFE + 4 $5,074,995 $19,968,948 3.93 $1,268,488 $4,043,448 3.19 BFE + 5 $6,464,192 $22,607,799 3.50 $1,389,197 $2,638,850 1.90 Fulton County, GA
BFE + 2 $3,516,281 $14,810,326 4.21 $3,516,281 $14,810,326 4.21 BFE + 3 $5,275,131 $28,508,125 5.40 $1,758,849 $13,697,800 7.79 BFE + 4 $7,033,070 $39,734,000 5.65 $1,757,940 $11,225,874 6.39 BFE + 5 $8,958,412 $48,776,327 5.44 $1,925,342 $9,042,327 4.70 Monroe County, GA
BFE + 2 $185,855 $1,619,143 8.71 $185,855 $1,619,143 8.71 BFE + 3 $270,575 $2,868,257 10.60 $84,720 $1,249,113 14.74 BFE + 4 $359,165 $3,450,872 9.61 $88,591 $582,615 6.58 BFE + 5 $452,175 $3,826,023 8.46 $93,010 $375,151 4.03
Source: National Institute of Building Sciences, Natural Hazard Mitigation Saves: 2019 Report, Table 2-2, p. 42.
115 Id. at 37. 116 Id. at 41.
18
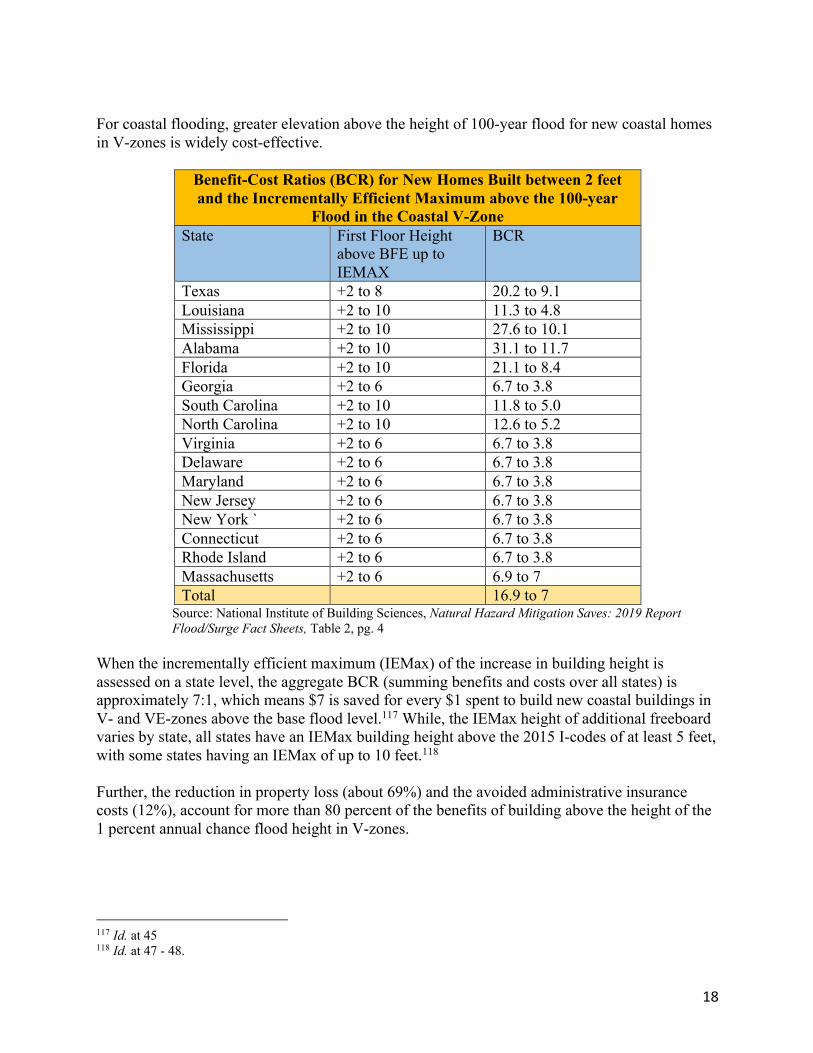
For coastal flooding, greater elevation above the height of 100-year flood for new coastal homes in V-zones is widely cost-effective.
Benefit-Cost Ratios (BCR) for New Homes Built between 2 feet and the Incrementally Efficient Maximum above the 100-year
Flood in the Coastal V-Zone State First Floor Height
above BFE up to IEMAX
BCR
Texas +2 to 8 20.2 to 9.1 Louisiana +2 to 10 11.3 to 4.8 Mississippi +2 to 10 27.6 to 10.1 Alabama +2 to 10 31.1 to 11.7 Florida +2 to 10 21.1 to 8.4 Georgia +2 to 6 6.7 to 3.8 South Carolina +2 to 10 11.8 to 5.0 North Carolina +2 to 10 12.6 to 5.2 Virginia +2 to 6 6.7 to 3.8 Delaware +2 to 6 6.7 to 3.8 Maryland +2 to 6 6.7 to 3.8 New Jersey +2 to 6 6.7 to 3.8 New York ` +2 to 6 6.7 to 3.8 Connecticut +2 to 6 6.7 to 3.8 Rhode Island +2 to 6 6.7 to 3.8 Massachusetts +2 to 6 6.9 to 7 Total 16.9 to 7
Source: National Institute of Building Sciences, Natural Hazard Mitigation Saves: 2019 Report Flood/Surge Fact Sheets, Table 2, pg. 4
When the incrementally efficient maximum (IEMax) of the increase in building height is assessed on a state level, the aggregate BCR (summing benefits and costs over all states) is approximately 7:1, which means $7 is saved for every $1 spent to build new coastal buildings in V- and VE-zones above the base flood level.117 While, the IEMax height of additional freeboard varies by state, all states have an IEMax building height above the 2015 I-codes of at least 5 feet, with some states having an IEMax of up to 10 feet.118 Further, the reduction in property loss (about 69%) and the avoided administrative insurance costs (12%), account for more than 80 percent of the benefits of building above the height of the 1 percent annual chance flood height in V-zones.
117 Id. at 45 118 Id. at 47 - 48.

19
Benefits and Costs of Building New Houses in V-zones above 2015 I-Code Requirements for 1 Year
Height Property loss
Additional living expenses & Indirect business interruption
Insurance fees
Death, injury
Benefit (B) Cost (C) BCR
BFE + 2 $10.67 $2.80 $1.81 $0.05 $15.33 $0.90 16.9 BFE + 3 $17.60 $4.67 $2.99 $0.09 $25.36 $1.80 14.1 BFE + 4 $24.66 $6.76 $4.19 $0.12 $35.73 $2.71 13.2 BFE + 5 $27.96 $7.70 $4.75 $0.14 $40.55 $3.60 11.2 BFE + 6 $31.11 $8.74 $5.29 $0.15 $45.28 $4.50 10.1 BFE + 7 $32.66 $9.12 $5.55 $0.16 $47.50 $5.41 8.8 BFE + 8 $34.21 $9.61 $5.82 $0.17 $49.80 $6.30 7.9 BFE + 9 $34.93 $9.80 $5.94 $0.17 $50.84 $7.20 7.1 BFE +10 $35.64 $10.07 $6.06 $0.17 $51.94 $8.11 6.4 BFE + 11 $35.88 $10.12 $6.10 $0.17 $52.27 $9.01 5.8
Source: National Institute of Building Sciences, Natural Hazard Mitigation Saves: 2019 Report, Table 2-3, p. 46.
iii. Mapping Future Conditions FEMA’s Flood Insurance Rate Maps (“NFIP floodplain maps”), the basis for local floodplain management and development decisions, “are a snapshot in time,” only depicting current flood risk.119 For example, current NFIP flood maps do not project future flood hazards based on future climate and sea level rise. Instead, current mapping practice is to apply historical climate information to existing topography and development conditions. However, per the Technical Mapping Advisory Council (TMAC), a Federal advisory committee established to review and make recommendations to FEMA on matters related to the national flood mapping program, “future conditions data can save lives; protect property and the environment; and allow for focused, planned recovery when keeping future conditions flood hazards in mind.”120
d. FEMA has acknowledged both the importance of accounting for changing flood risk and the effectiveness and feasibility of stronger building and land-use standards to address increasing flood risk
FEMA has explicitly recognized the significant impacts posed by climate change and has clearly supported forward-looking construction and land-use standards to address increasing flood risk.
119 Technical Mapping Advisory Council, Future Conditions Risk Assessment and Modeling 1 (2015). 120 Id.

20
i. Climate Impacts FEMA acknowledges climate change will increase flood risk and “strongly encourages communities to incorporate future conditions and information into [their] projects and plans.”121 FEMA’s voluntary Community Rating System (CRS) encourages NFIP-participating communities to account for future flood hazards by adopting and enforcing forward-looking regulations that exceed the NFIP’s minimum standards, so that more flood protection is provided for new and existing development. FEMA, in the CRS Coordinator’s Manual, explicitly states “that floodplains and watersheds change over time, driven by many natural and manmade changes. Good floodplain management acknowledges this and includes thinking about how floodplains might look in the future under different scenarios. Increased impervious surfaces in developing watersheds, new fill in floodways, rising sea levels, changes in natural functions, and many other factors contribute to the character of the future with which floodplain managers must cope.”122 FEMA provides credit toward insurance premium discounts to communities that “anticipate the future insofar as it relates to flood risk and natural floodplain functions and climate resilience, and take actions that can mitigate any adverse impacts that could materialize.”123 For example, FEMA encourages NFIP-participating communities to account for the impacts of climate change by providing credit for the following activities:
• The use of regulatory flood elevations in the V and coastal A Zones that reflect future conditions, including sea level rise;
• The use of regulatory flood maps based on future-conditions hydrology, including sea level rise;
• The community’s stormwater program regulates runoff from future development; • The communities have flood hazard assessments and problem analyses that address areas
likely to flood, and flood problems that are likely to get worse in the future, including: (1) changes in floodplain development and demographics, (2) development in the watershed, and (3) climate change or SLR; and
• When prospective buyers of a property are advised of the potential for flooding due to climate changes and/or sea level rise.
For purposes of the CRS, FEMA requires the use “intermediate-high” projection of sea level rise by 2100 (3.9 feet), as included in the 2012 report Global Sea Level Rise Scenarios for the United States National Climate Assessment, as the base minimum projection for sea level rise. For example, if coastal communities seek credit via higher study standards by accounting for sea level rise, then they must use an estimate of the anticipated sea level rise that is at least as high as the NOAA “intermediate –high” projections for 2100 to establish the base flood elevation on
121 An Examination of Federal Flood Maps in a Changing Climate: Hearing Before the H. Subcomm. on Environment and the H. Subcomm. On Investigations & Oversight of the H. Comm. on Science, Space, & Technology, 116th Cong. 5 (2020) (statement of Michael Grimm, Assistant Administrator for Risk Management, Federal Emergency Management Agency). 122 Federal Emergency Management Agency, FIA-15/2017, National Flood Insurance Program Community Rating System Coordinator’s Manual 110-15 (2017). 123 Id.

21
their FIRM. Accordingly, the community must adopt floodplain development regulations that use sea level rise adjusted base flood elevation. Additionally, FEMA has asserted addressing future risk, such as those posed by extreme weather events, is key to the agency’s mission.124 Per the Assistant Administrator for Risk Management, Michael Grimm, FEMA has conducted several pilot studies on sea level rise, and is currently coordinating with New York City to pilot flood products that address future flooding scenarios for the boroughs.125 The pilot project’s goal is to “address future risk by integrating sea level rise data into building code requirements and for floodplain management.”126 Further, per Assistant Administrator Grimm, FEMA requires states to evaluate the probability of future hazard events, including the effects of long-term changes in weather patterns and climate on the identified hazards, in their State Hazard Mitigation Plans (SHMPs).127 FEMA’s State Mitigation Plan Review Guide, the agency’s official policy on the natural hazard mitigation requirements, asserts “[s]tate risk assessments must be current, relevant, and include … consideration of changing environmental or climate conditions that may affect and influence the long-term vulnerability from hazards in the state.”128 FEMA’s State Mitigation Plan Review Guide also states
Hazard mitigation planning includes a process to assess vulnerability, identify a strategy to guide decisions and investments, and implement actions that will reduce risk, including impacts from a changing climate. Changes in the probability of future hazard events may include changes in location, increases or decreases to the impacts, and/or extent of known natural hazards, such as floods or droughts. Changes in temperature, intensity, hazard distribution, and/or frequency of weather events may increase vulnerability to these hazards in the future.129
States must submit SHMPs to FEMA for approval to remain eligible to receive certain types of non-emergency disaster assistance, including funding for mitigation projects,130 which must include the identification of hazard mitigation goals to reduce the vulnerabilities identified in the risk assessment. As such, FEMA explicitly requires states to mitigate the impacts of climate change.
124 An Examination of Federal Flood Maps in a Changing Climate: Hearing Before the H. Subcomm. on Environment and the H. Subcomm. On Investigations & Oversight of the H. Comm. on Science, Space, & Technology, 116th Cong. 5 (2020) (statement of Michael Grimm, Assistant Administrator for Risk Management, Federal Emergency Management Agency). 125 Id. at 6. 126 Id. 127 Id. 128 Federal Emergency Management Agency, FP 302-094-2, State Mitigation Plan Review Guide 3 (2015). 129 Id. at 13. 130 Id. at 9
22
ii. Higher Standards FEMA has long encouraged local communities to adopt higher standards, such as up to date I-codes, to reduce growing future flood risk.131 Explicitly, “FEMA encourages States and communities to adopt standards that are more protective than the NFIP minimum requirements, [in particular freeboard], to reduce flood risk.”132 Moreover, FEMA led the development of the 2019 National Mitigation Investment Strategy (NIMS). This single national strategy seeks to identify and measure the effectiveness of mitigation investments and inform decisions on when and where to make investments to reduce future risk, “such as those posed by changing coastal patterns and weather events.”133 NIMS seeks to support mitigation investment decision-making that involves changing conditions, such as population growth, development, changing weather conditions, and sea level rise. As part of that effort, NIMS calls for states and local communities to adopt and enforce up-to-date building codes, explicitly stating “the Federal Government and nonfederal partners should commit to supporting the development, use and enforcement of meaningful, up-to-date building codes, specifications, and standards.”134 FEMA has yet to make such a commitment for revising the NFIP minimum building and land-use criteria. Despite a statutory obligation to review these standards, “from time to time,” decades have passed since FEMA last reviewed or revised these standards.” Multiple FEMA studies and investigations have found or acknowledged that stronger requirements than the NFIP minimum building and land-use criteria, such as adding freeboard, are more effective at reducing flood losses in hazardous flood zones. For example, the following non-exclusive list of studies and investigations, from the past 20 years, acknowledge and/or recommended the adoption of such stronger requirements:
• Building Codes Save: A Nationwide Study: Losses Avoided as a Result of Adopting Hazard-Resistant Building Codes (2020) Through this study, FEMA estimated the losses avoided when communities adopt a freeboard standard for building in the 100-year floodplain. Roughly 15,000 NFIP participating communities have adopted a freeboard standard that exceeds the NFIP’s minimum elevation standard.135 FEMA analyzed roughly 786,000 structures in the floodplain of those communities and found about 400,000 had freeboard. The Average
131 Federal Emergency Management Agency, Building Codes Save: A Nationwide Study: Losses Avoided as a Result of Adopting Hazard-Resistant Building Codes ES-2 (2020). 132 Federal Emergency Management Agency, FEMA P-2022, Hurricane Harvey in Texas: Building Performance Observations, Recommendations, and Technical Guidance 2-3 (2019). 133 An Examination of Federal Flood Maps in a Changing Climate: Hearing Before the H. Subcomm. on Environment and the H. Subcomm. On Investigations & Oversight of the H. Comm. on Science, Space, & Technology, 116th Cong. 6 (2020) (statement of Michael Grimm, Assistant Administrator for Risk Management, Federal Emergency Management Agency). 134 Mitigation Framework Leadership Group, National Mitigation Investment Strategy 17 (2019). 135 Federal Emergency Management Agency, Building Codes Save: A Nationwide Study: Losses Avoided as a Result of Adopting Hazard-Resistant Building Codes Appendices D-25 (2020).

23
Annual Losses Avoided (AALA) for freeboard structures was approximately $484 million.136
• Reducing Flood Losses Through the International Codes: Coordinating Building Codes and Floodplain Management Regulations (2019) Per the report, many requirements in the I-Codes are more restrictive than the NFIP requirements. In addition, the report specifies that “FEMA supports the adoption and use of the latest published editions of the I-Codes as a minimum standard for hazard resistance, including food hazards.”137
• Mitigation Assessment Team Report, FEMA P-2022, Hurricane Harvey in Texas: Building Performance Observations, Recommendations, and Technical Guidance (2019) Through FEMA’s Mitigation Assessment Teams (MAT), FEMA develops recommendations to make building codes more hazard resistant. Multiple MAT investigations have shown that strengthening buildings reduces losses. Per the FEMA P-2022 investigation, building elevation was a universal indicator of the level of flood damage. The investigation found many older buildings built before communities joined the NFIP and began regulating SFHA development were inundated 3 to 6 feet, while newer elevated residential buildings performed much better. 138 FEMA’s Mitigation Assessment Team recommended Harvey-impacted communities require new and substantially improved/damaged buildings to be elevated beyond the minimum NFIP elevation standard to reduce future flood damage.139 In addition, the Team recommended future conditions be considered in zoning, building code, and floodplain management requirements.140
• Mitigation Assessment Team Report, FEMA P-2023, Hurricane Irma in Florida: Building Performance Observations, Recommendations, and Technical Guidance (2018) FEMA’s Mitigation Assessment Team found more than 30 communities have adopted freeboard of 2 or 3 feet above the BFE, more than 10 have adopted 1.5 feet above the BFE, and many have adopted a minimum elevation above the crown of the road (typically 12 to 18 inches).141 Given buildings with freeboard suffered less flood damage, the Team recommended freeboard be incorporated into the design flood elevation based on the building use.142
136 Federal Emergency Management Agency, Building Codes Save: A Nationwide Study: Losses Avoided as a Result of Adopting Hazard-Resistant Building Codes 4-24 (2020). 137 Federal Emergency Management Agency, Reducing Flood Losses Through the International Codes: Coordinating Building Codes and Floodplain Management Regulations 1-2 (2019). 138 Federal Emergency Management Agency, FEMA P-2022, Hurricane Harvey in Texas: Building Performance Observations, Recommendations, and Technical Guidance 3-5 (2018) 139 Id. at 5-6. 140 Id. 141 Federal Emergency Management Agency, FEMA P-2023, Hurricane Irma in Florida: Building Performance Observations, Recommendations, and Technical Guidance 2-9 (2018). 142 Id. at 5-6.

24
• Elevating Floodprone Buildings Above Minimum NFIP Requirements, Iowa Floods of
2016 Recovery Advisory (2017) Per FEMA, elevating to the BFE does not provide complete protection against flooding. Storms more severe than the base flood can and do occur as was seen in 2008 and 2016 in Iowa.143 FEMA recommended the addition of at least 1 or 2 feet of freeboard to account for uncertainties, future development, and floods higher than the base flood.144
• Flood Protection for Critical and Essential Facilities, Iowa Floods of 2016 Recovery Advisory (2017) “As a best practice, FEMA recommends protection from flood hazards that exceeds code minimums.” For example, FEMA recommends protecting critical facilities to withstand at least a 0.2-percent-annual-chance flood event (often called the “500-year flood event”).145
• 2016 Evaluation of the Benefits of Freeboard for Public and Nonresidential Buildings in Coastal Areas (2016) Per FEMA’s 2016 study, freeboard provides owners an increased level of protection against potential errors, oversights, or changes in flood conditions.146 The study states “the data in this analysis clearly indicates that it is often cost effective to incorporate increased freeboard into new construction for several public building type uses as well as for large commercial buildings.”147
• Loss Avoidance Study: Reducing Losses through Higher Regulatory Standards, 2013 Colorado Floods (2015)
The results of this study demonstrate that higher floodplain regulations result in a reduction in flood-related losses 148 For example, per FEMA, if freeboard had never been adopted, there would have been a 331 percent increase in estimated losses for Boulder (2 feet), 68 percent increase in losses in Larmier (1 foot), and 148 percent increase in losses for Weld (1 foot) for the 100-year flood.149
143 Federal Emergency Management Agency, Elevating Floodprone Buildings Above Minimum NFIP Requirements, Iowa Floods of 2016 Recovery Advisory 1 (2017). 144 Id. at 4. 145 Federal Emergency Management Agency, Flood Protection for Critical and Essential Facilities, Iowa Floods of 2016 Recovery Advisory 6 (2017). 146 Federal Emergency Management Agency, 2016 Evaluation of the Benefits of Freeboard for Public and Nonresidential Buildings in Coastal Areas 22 (2016). 147 Id. at 22. 148 Federal Emergency Management Agency, FEMA-DR-4145-CO, Loss Avoidance Study: Reducing Losses through Higher Regulatory Standards, 2013 Colorado Floods Case Study 7-2 (2015) 149 Id. at 7-1.

25
• Designing for Flood Levels Above the BFE After Hurricane Sandy, Hurricane Sandy Recovery Advisory (2013) FEMA’s advisory states “design and construction practices can minimize damage to buildings, particularly by elevating the building higher than the minimum required elevation.” 150
• Mitigation Assessment Team Report, FEMA P-942, Hurricane Sandy in New Jersey and New York: Building Performance Observations, Recommendations, and Technical Guidance (2013) FEMA’s Mitigation Assessment Team recommended that new structures and structures undergoing Substantial Improvement or that have sustained Substantial Damage be elevated at least 2 feet above the height of the 100-year flood. For critical facilities, such as hospitals, police stations, fire stations, and emergency communication centers, the Team recommended they be elevated above the height of the 500-year flood.151
• Including Building Codes in the National Flood Insurance Program: Fiscal Year 2013 Report to Congress: Impact Study for Biggert-Waters Flood Insurance Reform Act of 2012 (2013) Per the report, the most significant benefits from incorporating I-Code provisions into the NFIP would likely arise from the required added elevation above flood levels (freeboard) for dwellings in certain locations. In addition, insurance losses would be reduced for the properties required to comply with building codes because those properties would sustain less damage. The reduction of losses would lower actuarially rated insurance premiums for those structures, which in turn would make insurance more affordable and attract a broader participant pool, further enhancing soundness and reducing subsidy needs of the NFIP.152
• Mitigation Assessment Team, FEMA P-765, Midwest Floods of 2008 in Iowa and Wisconsin: Building Performance Observations, Recommendations, and Technical Guidance (2009) FEMA’s Mitigation Assessment Team recommended that elevation, as it relates to new construction, should be considered and freeboard requirements should be adopted for additional protection. In addition, the Team recommended critical facilities be located outside the 0.2-percent-annual-chance flood hazard area (500-year floodplain). If this is
150 Federal Emergency Management Agency, Designing for Flood Levels Above the BFE After Hurricane Sandy (April 2013) 151 Federal Emergency Management Agency, FEMA P-942, Mitigation Team Assessment Report: Hurricane Sandy in New Jersey and New York: Building Performance Observations, Recommendations, and Technical Guidance iii-iv (2013). 152 Federal Emergency Management Agency, Including Building Codes in the National Flood Insurance Program: Fiscal Year 2013 Report to Congress: Impact Study for Biggert-Waters Flood Insurance Reform Act of 2012 v (2013).

26
not possible, the Team recommended equipment and utilities in exposed facilities should be protected to the 0.2-percent-annual-chance flood level.153
• Mitigation Assessment Team Report, FEMA P-757, Hurricane Ike in Texas and Louisiana: Building Performance Observations, Recommendations, and Technical Guidance (2009) FEMA’s Mitigation Assessment Team recommended Ike-impacted communities require the freeboard specified by the ASCE 24-05, Flood Resistant Design and Construction, plus 3 feet. for new construction, substantial improvements, and repair of substantial damage until new maps were adopted. Once new flood maps were adopted, the Team recommended all new construction, substantial improvements, and repair of substantial damage to be elevated to or above the freeboard elevation specified by ASCE 24-05. In addition, the Team recommended all new and replacement critical facilities be sited outside the 500-year floodplain, where possible. And, where not possible, the critical facilities should be, At a minimum, elevated above the 500-year flood level or the freeboard requirements of ASCE 24-05, whichever offers more protection to the facility.154
• 2008 Supplement to the 2006 Evaluation of the National Flood Insurance Program’s Building Standards (2008) Per the report, freeboard, in almost all situations studied, proved cost-effective for both 1 and 2 feet above the minimum NFIP requirements. In V-Zones, 3 and 4 feet of freeboard were deemed cost-effective.155
• Mitigation Assessment Team Report, FEMA 489, Hurricane Ivan in Alabama and Florida: Observations, Recommendations, and Technical Guidance (2005) FEMA’s Mitigation Assessment Team recommended Ivan-impacted communities elevate all new construction (including substantially improved structures and replacement of substantially damaged structures) in coastal A Zones with the bottom of the lowest horizontal supporting member above the base flood level, require freeboard for all structures in all flood hazard zones with the amount varying with building importance (see ASCE 7-05 and ASCE 24-05 for building importance classification and freeboard requirements) and anticipated exposure to wave effects; and require V-Zone design and
153 Federal Emergency Management Agency, FEMA P-765, Mitigation Assessment Team Report: Midwest Floods of 2008 in Iowa and Wisconsin: Building Performance Observations, Recommendations, and Technical Guidance (2009). 154 Federal Emergency Management Agency, FEMA P-757, Mitigation Team Assessment Report: Hurricane Ike in Texas and Louisiana: Building Performance Observations, Recommendations, and Technical Guidance v (2009). 155 Federal Emergency Management Agency, 2008 Supplemental to the 2006 Evaluation of the National Flood Insurance Program’s Building Standards 3 (2008).

27
construction for new construction in coastal A Zones subject to erosion, scour, velocity flow, and/or wave heights greater than 1.5 feet.156
• Federal Emergency Management Agency’s National Flood Insurance Program Call for
Issues Status Report (2000)
Per the report, FEMA stated that “requiring freeboard or incorporating the floodway surcharge into the BFE are worthwhile ideas that deserve further investigation.” FEMA stated it will “consider it for future incorporation into the NFIP floodplain management regulations.”157 In addition, FEMA stated that “the location of critical facilities is a concern to the NFIP. For example, it is critical that emergency facilities, such as fire and police stations, need to be operable during flood disasters. Nursing homes are a concern due to short warning times and rapidly rising floodwaters that would prevent evacuation in a safe and orderly manner. These facilities should be located outside the special flood hazard area or well above the base flood elevation, such as to the 500-year level of protection. The NFIP floodplain management regulations currently do not require such protection.”158
1. Non-FEMA Studies and Investigations Concerning Higher
Standards than the NFIP’s Minimum Criteria In addition, multiple studies and investigations have assessed the NFIP’s existing building and land-use standards and have found them inadequate. Such studies are likely well-known to FEMA.
• American Institutes for Research, Assessing the Adequacy of the National Flood
Insurance Program’s 1 percent Flood Standard (2006) Per the study, the 1 percent standard, as currently applied, is inadequate and as a result is not contributing effectively to accomplishment of the goals of the NFIP. The standard is not being effectively implemented for land use regulation and, for insurance purposes, is too low to properly address the significant flood risk exposure faced by the Nation.159 As such, the study held the 1 percent standard was not appropriate for the siting of critical facilities. The study recommended that FEMA should ensure that NFIP guidance and program activities clearly indicate that critical facilities should be located outside the 0.2 percent floodplain.160
156 Federal Emergency Management Agency, FEMA 489, Mitigation Assessment Team Report: FEMA 489, Hurricane Ivan in Alabama and Florida: Observations, Recommendations, and Technical Guidance vi (2005). 157 Federal Emergency Management Agency, National Flood Insurance Program Call for Issues Status Report II-3-4 (2000). 158 Id. at II-3-3. 159 Gerald E. Galloway et al., American Institutes for Research, Assessing the Adequacy of the National Flood Insurance Program’s 1 Percent Flood Standard xiv (2006). 160 Id. at xvi.

28
• American Institutes for Research, Evaluation of the National Flood Insurance Program’s Building Standards (2006) While the study found that “generally speaking” NFIP building standards do reduce flood losses to new construction under pre-2006 flood events, the building standards are implemented in conjunction with NFIP floodplain maps, which do not account for increasing flood hazards in the future. Thus, NFIP building standards’ future effectiveness will be reduced as the flood maps becomes obsolete due to changing flood conditions. The study recommended revising building standards as one way to compensate for changing flood conditions in the future.161 This study found, for the residential buildings analyzed, the cost of adding freeboard or installing a more flood-resistant foundation at the time of construction is modest but the benefit of doing so can be great, particularly in coastal areas subject to wave effects and riverine floodplains with small flood hazard factors.162
• ASFPM, Report of the 2004 Assembly of the Gilbert F. White National Flood Policy
Forum, Reducing Flood Losses: Is the 1% Chance Standard Sufficient? (2004) This study recommended the use of freeboard to account for the uncertainty of the underlying data that comprises the 1 percent standard.163
• ASFPM, National Flood Programs and Policies in Review (2015) This 2015 report provided multiple recommendations to FEMA on how to best improve the NFIP to achieve sound floodplain management.
• ASFPM, The Floodway Encroachment Standard: Minimizing Cumulative Adverse Impacts (2013). Per the study, setting the designated height at which floodplain development can encroach upon the floodway one (1) foot of rise in flood waters perpetuates an upward trend of increased flood damages. Allowing the designated height to be anything greater than zero is problematic.164 Illinois and Indiana permit less than 0.1 foot of rise. Wisconsin permits less than 0.01 foot of rise.165
• ASFPM, States and Other Communities in FEMA CRS with Building Freeboard Requirements (2015).
161 Christopher P. Jones et al., American Institutes For Research, Evaluation of the National Flood Insurance Program’s Building Standards ix (2006). 162 Id. 163 Association of State Floodplain Managers, Report of the 2004 Assembly of the Gilbert F. White National Flood Policy Forum, Reducing Flood Losses: Is the 1% Chance Standard Sufficient? 26 (2004). 164 Alan R. Lulloff, The Floodway Encroachment Standard: Minimizing Cumulative Adverse Impacts, 1 (June 2013). 165 Id. at 5.

29
Per the 2015 report, 22 states and 596 local communities located outside those 22 states have freeboard standards, which exceed the NFIP’s minimum elevation standard.166
• Mitigation Framework Leadership Group, National Mitigation Investment Strategy (2019). This federal strategy for improving resilience and reducing vulnerability to hazards explicitly recognizes that the NFIP standards are less protective than other consensus-based codes.167 The strategy emphasizes that, “[t]he Federal Government and nonfederal partners should commit to supporting the development, use and enforcement of meaningful, up-to-date building codes, specifications, and standards.”168 Moreover, the strategy recognizes that, “[u]p-to-date building codes and standard criteria should be required in federal and state grants and programs.” and specifically recognizes the minimum standards established under the NFIP.169
e. The NFIP’s minimum building and land-use criteria are widely adopted. However, the number of flood damage claims on structures, built in accordance with such criteria, is trending upward.
The NFIP building and land use requirements are the most widely adopted development/construction standards in the nation as compared to building codes, subdivision standards, or zoning.170 FEMA estimates 90 percent of U.S. communities identified as having some degree of flood risk participate in the NFIP, which obligates them to comply with FEMA’s minimum requirements for new or substantially improved buildings and land-use.171 Yet, the NFIP requirements for buildings and structures have remained largely unchanged since 1971 and no longer meet the minimum industry standards for flood safety.172 And since the early 1970s, there has been an upward trend in the number of annual claims. Specifically, the “total volume of annual claims has increased on average by roughly 2,100 claims per year.”173 Even excluding the high-loss years of 2005, 2012, and 2017, the total
166 See generally, Association of State Floodplain Managers, States and Other Communities in FEMA CRS with Building Freeboard Requirements (2015) (detailing states and local jurisdictions that have freeboard requirements and the height of those requirements). 167 Mitigation Framework Leadership Group, National Mitigation Investment Strategy 16 (2019). 168 Id. at 17. 169 Id. at 18. 170 Preparing for the Storm: Reauthorization of the National Flood Insurance Program: Hearing Before the H. Comm. on Financial Services, 116th Cong. 9 (2019) (statement of Maria Cox Lamm, Chair, Association of State Floodplain Managers). 171 Congressional Budget Office, Expected Costs from Hurricane Winds and Storm-Related Flooding, 26 (2019) 172 Federal Emergency Management Agency, Reducing Flood Losses Through the International Codes: Coordinating Building Codes and Floodplain Management Regulations 13 (2019); see also, Congressional Budget Office, Expected Costs from Hurricane Winds and Storm-Related Flooding, 26 (2019) 173 Jacob Bradt and Carolyn Kousky, Risk Management and Decision Process Center, Part I: Flood Insurance in the US: Lessons from FEMA’s Recent Data Releases, https://riskcenter.wharton.upenn.edu/lab-notes/lessonsfromfemadatapart1/ (last visited Dec. 8, 2020).
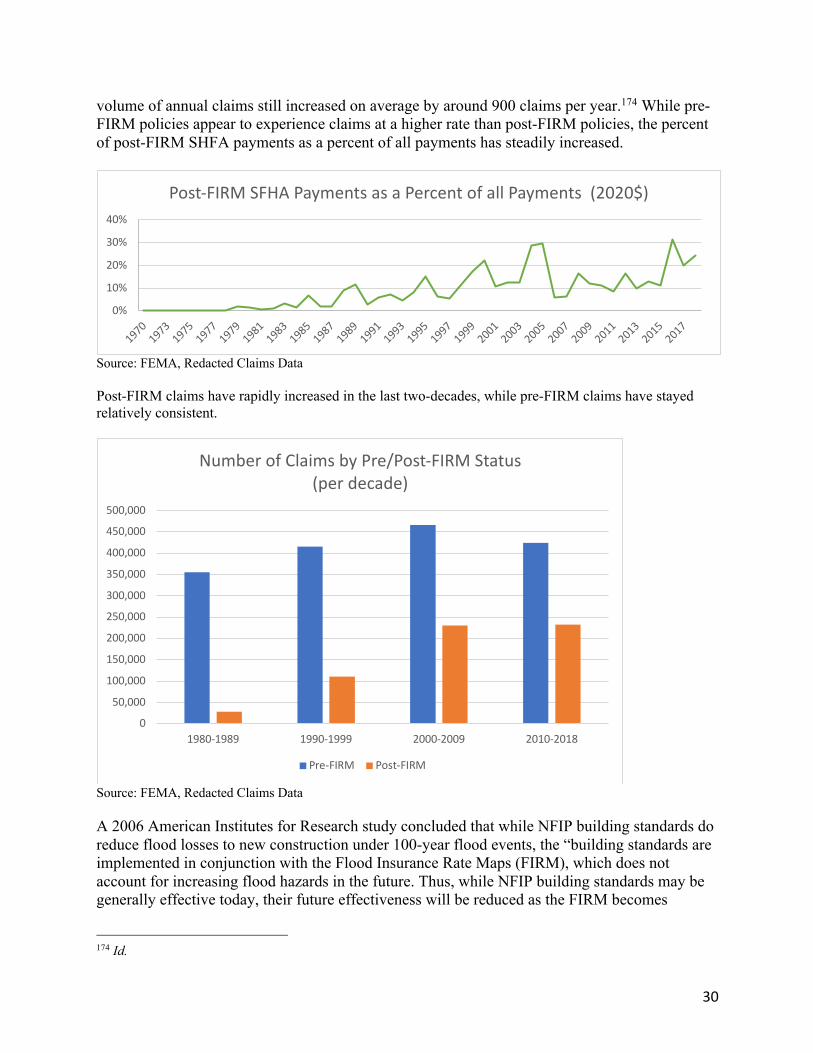
30
volume of annual claims still increased on average by around 900 claims per year.174 While pre-FIRM policies appear to experience claims at a higher rate than post-FIRM policies, the percent of post-FIRM SHFA payments as a percent of all payments has steadily increased.
Source: FEMA, Redacted Claims Data Post-FIRM claims have rapidly increased in the last two-decades, while pre-FIRM claims have stayed relatively consistent.
Source: FEMA, Redacted Claims Data A 2006 American Institutes for Research study concluded that while NFIP building standards do reduce flood losses to new construction under 100-year flood events, the “building standards are implemented in conjunction with the Flood Insurance Rate Maps (FIRM), which does not account for increasing flood hazards in the future. Thus, while NFIP building standards may be generally effective today, their future effectiveness will be reduced as the FIRM becomes
174 Id.
0%
10%
20%
30%
40%
19701973
19751977
19791981
19831985
19871989
19911993
19951997
19992001
20032005
20072009
20112013
20152017
Post-FIRM SFHA Payments as a Percent of all Payments (2020$)
0
50,000
100,000
150,000
200,000
250,000
300,000
350,000
400,000
450,000
500,000
1980-1989 1990-1999 2000-2009 2010-2018
Number of Claims by Pre/Post-FIRM Status (per decade)
Pre-FIRM Post-FIRM

31
obsolete due to changing flood conditions. Revising building standards may be one way to compensate for changing flood conditions in the future.”175 The lack of freeboard in FEMA’s building standards increases the chance areas below the BFE will be exposed to floodwater. For example, in FEMA-designated A zones only the top of the lowest floor must be at or above BFE. Constructing residential homes in A-zones with the top of the lowest floor at the BFE guarantees some level of damage will occur during the base flood.176 However, with a minimum of 1 foot of freeboard, even during a 1 percent annual chance flood event, most of that damage could be avoided. Additionally, the NFIP regulations treat building standards for A zones in riverine and coastal areas the same, even though flood hazards and building damage in coastal A zones is more similar to V zones than riverine A zones.177 The principal source of flooding in coastal A zones are astronomical tides and storm surge, not riverine flooding.178 During the 100-year flood event in a coastal A zone, the potential for breaking wave heights is between 1.5 feet and 3 feet.179 While FEMA adopted a policy that new flood studies in coastal communities must determine if the areas that comprise the coastal A zone are subject to waves between 3 feet and 1.5 feet, FEMA still does not require safer construction standards in those areas. The agency only encourages local adoption of safer standards through the Community Rating System. Despite the potential for breaking waves to cause severe damage, a building in a coastal A zone vulnerable to 2.9 feet breaking wave would only need to conform to the NFIP building requirements for riverine A zones as stipulated in the NFIP regulations.180 For example, the top of the lowest floor, including the basement, would only need to be at the height of the mapped 100-year flood. Claims paid in coastal counties account for the majority of NFIP payouts. Per the Wharton Risk Management and Decision Processes Center’s analysis of NFIP claims data, coastal claims account for over 75% of claims paid.181
175 Christopher P. Jones et al., American Institutes For Research, Evaluation of the National Flood Insurance Program’s Building Standards viii (2006). 176 Id. 177 Christopher P. Jones et al., American Institutes For Research, Evaluation of the National Flood Insurance Program’s Building Standards 5 (2006). 178 Id. 179 Id. 180 Id. 181 Jacob Bradt and Carolyn Kousky, Wharton Center for Risk Management and Decision Process, Part II: Flood Insurance in the US: Lessons from FEMA’s Recent Data Releases, https://riskcenter.wharton.upenn.edu/lab-notes/lessonsfromfemadatapart2/ (last visited Dec. 8, 2020).

32
Source: Jacob Bradt and Carolyn Kousky, Wharton Risk Management and Decision Processes Center Post-FIRM claims in USGS-defined coastal counties reflect a similar trend.
Source: FEMA, Redacted Claims Data
0
50,000
100,000
150,000
200,000
250,000
300,000
350,000
400,000
1980-1989 1990-1999 2000-2009 2010-2018
A Zone Claims in Coastal vs. Non-Coastal Counties (per decade)
Coastal Non-Coastal
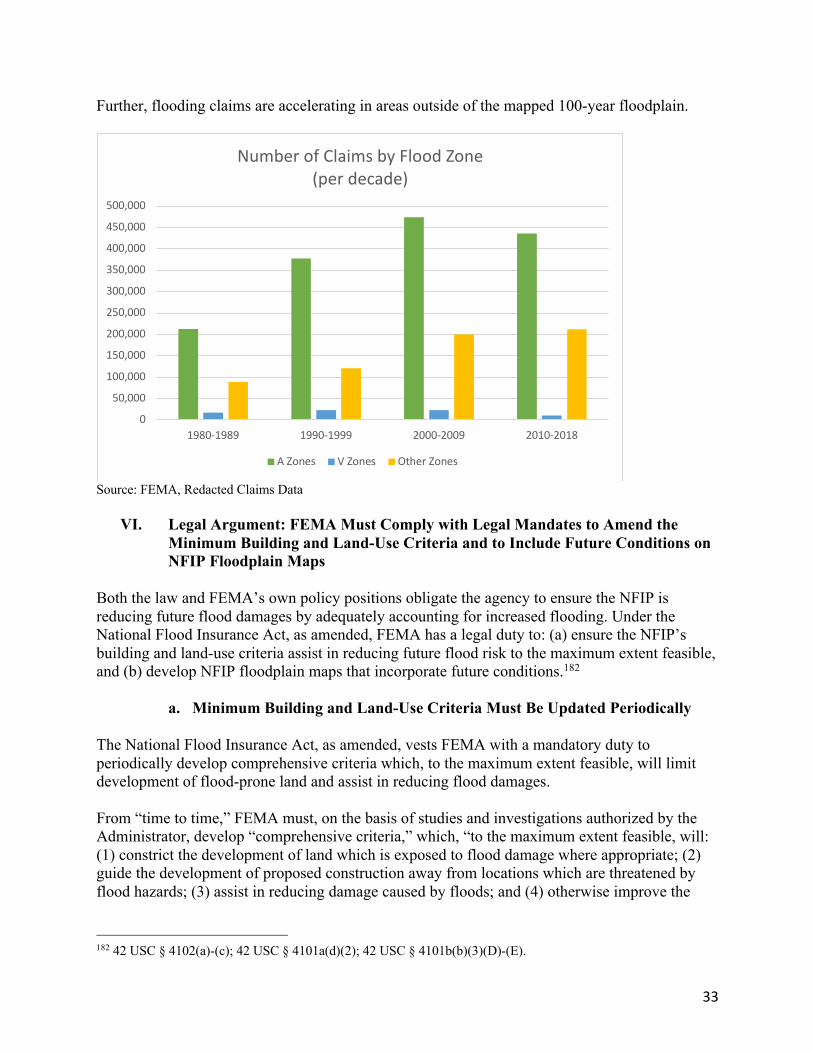
33
Further, flooding claims are accelerating in areas outside of the mapped 100-year floodplain.
Source: FEMA, Redacted Claims Data
VI. Legal Argument: FEMA Must Comply with Legal Mandates to Amend the Minimum Building and Land-Use Criteria and to Include Future Conditions on NFIP Floodplain Maps
Both the law and FEMA’s own policy positions obligate the agency to ensure the NFIP is reducing future flood damages by adequately accounting for increased flooding. Under the National Flood Insurance Act, as amended, FEMA has a legal duty to: (a) ensure the NFIP’s building and land-use criteria assist in reducing future flood risk to the maximum extent feasible, and (b) develop NFIP floodplain maps that incorporate future conditions.182
a. Minimum Building and Land-Use Criteria Must Be Updated Periodically The National Flood Insurance Act, as amended, vests FEMA with a mandatory duty to periodically develop comprehensive criteria which, to the maximum extent feasible, will limit development of flood-prone land and assist in reducing flood damages. From “time to time,” FEMA must, on the basis of studies and investigations authorized by the Administrator, develop “comprehensive criteria,” which, “to the maximum extent feasible, will: (1) constrict the development of land which is exposed to flood damage where appropriate; (2) guide the development of proposed construction away from locations which are threatened by flood hazards; (3) assist in reducing damage caused by floods; and (4) otherwise improve the
182 42 USC § 4102(a)-(c); 42 USC § 4101a(d)(2); 42 USC § 4101b(b)(3)(D)-(E).
0
50,000
100,000
150,000
200,000
250,000
300,000
350,000
400,000
450,000
500,000
1980-1989 1990-1999 2000-2009 2010-2018
Number of Claims by Flood Zone(per decade)
A Zones V Zones Other Zones

34
long-range land management and use of flood-prone areas.”183 State and local governments are prohibited from participating in the NFIP, unless those entities have adopted adequate land use and control measures that equal or exceed the comprehensive criteria.184 As cited earlier, FEMA has authorized numerous studies and investigations related to floodplain management. Such studies and investigations have compiled issues and suggestions to improve the minimum building and land-use criteria, assessed the role of modern building codes in reducing flood damages, evaluated the efficaciousness of the NFIP, and addressed the impact of climate change on the long-term viability of the NFIP. Collectively, the finding of these studies and investigations demonstrate stronger floodplain management standards are effective and necessary to address growing flood risk. FEMA has also explicitly acknowledged stronger standards than the agency’s current building and land-use criteria are better at reducing flood risk, often encouraging states and communities to adopt standards that are more protective than the NFIP minimum requirements. Further, multiple states and local communities have adopted stronger building and land-use standards than the NFIP’s minimum criteria – demonstrating that stronger standards are feasible. (See Appendix A). For example, a minimum of 42 NFIP-participating communities, which are outside of states with statewide freeboard requirement, mandate 3 feet of freeboard for all construction in the 100-year floodplain.185 An additional 192 NFIP-participating communities. which are outside of states with statewide freeboard requirement, mandate 2 feet of freeboard for all construction in the 100-year floodplain.186 Further, Indiana, Montana, New York, and Wisconsin require a minimum of 2 feet of freeboard statewide for construction in the 100-year floodplain.187 Despite the findings of such studies and investigation, and FEMA’s advocacy for stronger standards at the state and community level, FEMA has not comprehensively updated its minimum building and land-use criteria since the 1970’s. And as indicated above, flood damages for structures built to the NFIP’s building and land-use standards are actually increasing. The plain meaning rule dictates that statutory terms are to be interpreted using the ordinary meaning of the language of the statute. The plain meaning of “maximum extent feasible” implies FEMA is required to adopt building and land-use criteria that to the greatest degree possible (maximum extent) are reasonably capable (feasible) of achieving the following results: “(1) constrict the development of land which is exposed to flood damage where appropriate; (2) guide the development of proposed construction away from locations which are threatened by flood hazards; (3) assist in reducing damage caused by floods; and (4) otherwise improve the long-range land management and use of flood-prone areas.”188
183 42 USC § 4102(a)-(c). 184 42 USC § 4022 (a)(1). 185 Association of State Floodplain Managers, States and Other Communities in FEMA CRS with Building Freeboard Requirements 2 (2015). 186 Id. at 6. 187 Id. at 1. 188 42 USC § 4102(a)-(c).

35
As noted above, multiple jurisdictions already have stronger building and land-use standards than the NFIP’s standards. As such, stronger standards are feasible. Additionally, multiple studies and investigations, including ones developed by FEMA, demonstrate such building and land-use standards limit risky floodplain development and assist in reducing floodplain damages to a greater extent than the NFIP’s existing standards. FEMA has repeatedly recommended adoption of stronger standards. As such, the NFIP’s existing building and land-use standards do not meet the “maximum extent feasible” requirement. FEMA is and will continue to, as flood risk worsens due to climate change and growing development in high-risk flood areas, breach its mandatory legal duty to periodically update the comprehensive criteria to ensure that flood damages are being reduced to the maximum extent feasible.
b. Flood Mapping must Include Future Conditions FEMA is not meeting the non-discretionary legal duty to include several flood hazards as part of the National Flood Mapping Program, including future conditions like projections of sea level rise and projections of future development, when revising and updating NFIP flood maps. As required by law, FEMA must include (i) “relevant information or data from the National Oceanic and Atmospheric Administration [(NOAA)] and the United States Geological Survey [(USGS)] relating to the best available science regarding future changes in sea levels, precipitation, and hurricane intensity” and (ii) “any future risk assessment” issued by the Technical Mapping Advisory Council [(TMAC)] whenever FEMA revises and updates an NFIP floodplain map.189 Per law, FEMA must update NFIP floodplain maps every 5 years.190
i. NOAA/USGS Since the enactment of the Biggert-Waters Flood Insurance Reform Act of 2012 (BW-2012), extensive NOAA-produced data and information regarding future changes in sea level rise, precipitation, and hurricane intensity have been available to FEMA. For example, NOAA has produced the following report, NOAA Technical Report CO-OPS 083, Global and Regional Sea Level Rise Scenarios for the United States, which provides regional sea level rise scenarios for the entire United States. In addition, NOAA’s “Sea Level Rise Viewer” provides projections on sea level rise and potential coastal flooding impacts areas and relative flood depth.191 FEMA has issued and/or updated more than 8,000 NFIP floodplain maps between the enactment of the BW-2012 and 2020.192 As far as can be determined by NRDC and ASFPM, FEMA has not included “any relevant information or data from [NOAA] and [USGS] relating to the best available science regarding future changes in sea levels, precipitation, and hurricane intensity.”
189 42 USC § 4101a(d)(2); 42 USC § 4101b(b)(3)(D)-(E). 190 42 USC § 4101(e). 191 National Oceanic and Atmospheric Administration, Sea Level Rise Viewer, https://coast.noaa.gov/slr/ (last visited Dec. 30, 2020). 192 Federal Emergency Management Agency, NFIP Community Status Report, https://www.fema.gov/cis/nation.html (last visited November 30, 2020).

36
Given that FEMA is required to incorporate such information into all revised and updated NFIP floodplain maps, FEMA is not satisfying its legal duty.
ii. TMAC In December 2015, TMAC published the Future Conditions Risk Assessment and Modeling report. The report asserts “[t]he identification and broad availability of future conditions hazard and risk information is of utmost importance to our Nation’s citizens and economy as development and population growth occur in areas that are at risk now or will be in the future.”193 As such, the report makes seven primary recommendations, and multiple sub-recommendations to FEMA about how to provide such information. The seven primary recommendations as are follows:
(1) Provide future conditions flood risk products, tools, and information for coastal, Great Lakes, and riverine areas. The projected future conditions should use standardized timeframes and methodologies wherever possible to encourage consistency and should be adapted as actionable science evolves.
(2) Identify and quantify accuracy and uncertainty of data and analyses used to produce future conditions flood risk products, tools, and information.
(3) Provide flood hazard products and information for coastal and Great Lakes areas that include the future effects of long-term erosion and sea/lake level rise. Major elements are:
a. Provide guidance and standards for the development of future conditions coastal flood risk products.
b. Incorporate local relative sea/lake level rise scenarios and long-term coastal erosion into coastal flood hazard analyses.
c. Consider the range of potential future natural and man-made coastal changes, such as inundation and coastal erosion.
(4) Provide future conditions flood risk products and information for riverine areas that include the impacts of future development, land use change, erosion, and climate change, as actionable science becomes available. Major elements are:
a. Provide guidance and standards for the development of future conditions riverine flood risk products.
b. Future land use change impacts on hydrology and hydraulics can and should be modeled with land use plans and projections, using current science and build upon existing model study methods where data are available and possible.
c. Future land use should assume built-out floodplain fringe and take into account the decrease of storage and increase in discharge.
d. No actionable science exists at the current time to address climate change impacts to watershed hydrology and hydraulics. If undertaken, interim efforts to incorporate climate change impacts in flood risk products and information should
193 Technical Mapping Advisory Council, Future Conditions Risk Assessment and Modeling 3 (2015).

37
be based on existing methods, informed by historical trends, and incorporate uncertainty based upon sensitivity analyses.
e. Where sufficient data and knowledge exist, incorporate future riverine erosion (channel migration) into flood risk products and information.
(5) Generate future conditions data and information such that it may frame and communicate flood risk messages to more accurately reflect the future hazard in ways that are meaningful to and understandable by stakeholders. This should enable users to make better-informed decisions about reducing future flood-related losses.
(6) Perform demonstration projects to develop future conditions data for representative coastal and riverine areas across the Nation to evaluate the costs and benefits of different methodologies or identify/address methodological gaps that affect the creation of future conditions data.
(7) Data and analysis used for future conditions flood risk information and products should be consistent with standardized data and analysis used to determine existing conditions flood risk, but also should include additional future conditions data, such as climate data, sea level rise information, long-term erosion data; and develop scenarios that consider land use plans, planned restoration projects, and planned civil works projects, as appropriate, that would impact future flood risk.
Further, the TMAC report recommended the following sub-recommendations which explicitly address future climate and development impacts:
• FEMA should incorporate Local Relative Sea Level Rise scenarios into the existing FEMA coastal flood insurance study process in one of the following ways:
o Direct Analysis – Incorporate sea level rise directly into process modeling (i.e., surge, wave setup, wave runup, overtopping, and erosion) for regions where additional sea level is determined to impact the Base Flood Elevation non-linearly (for example, where a 1-foot sea level rise equals a two-foot or more increase in the base flood).
o Linear Superposition – Add sea level to the final calculated total water level and redefine the Base Flood Elevation for regions where additional sea level is determined to impact the base flood linearly (for example, 1 foot of sea level rise equals a 1-foot increase in the base flood).
• FEMA should take into account future development (excluding proposed flood control structures for the base condition/scenario) for future conditions mapping.
• FEMA should use a scenario approach for future conditions flood hazards calculation and mapping that will allow users to evaluate the robustness of proposed solutions to a range of plausible future conditions, including uncertain land use and climate change impacts.
• FEMA should take the impacts of future development and land use change on future conditions hydrology into account when computing future conditions for riverine areas.

38
• FEMA should use observed riverine trends to help estimate what future conditions might look like. In watersheds where floods of interest may decrease in magnitude and frequency, then use existing riverine study results as the basis for flood hazard mapping. In watersheds where floods exhibit increase in magnitude or frequency, then use best available science to determine future hydrology and flood hazards.
TMAC stated the majority of the above-listed sub-recommendations should occur in the “short-term” Per the report, “short-term” means up to 2 years to accomplish.194 In 2016, TMAC reiterated the FEMA implement all of the recommendations in the Future Conditions report to assist FEMA to provide credible flood hazard data.195 To date, FEMA has not included such required information in revising and updating the NFIP flood maps. Subsequent annual reports from TMAC imply FEMA has failed to incorporate the recommendations of the 2015 Future Conditions report. For example, TMAC’s 2017 Annual Report states “TMAC assumed (based on preliminary statements from FEMA) that FEMA intended to complete future conditions analyses as an add-on to the existing FIS engineering workflow and then issue the results as an additional, non-regulatory layer onto the existing FIRM product. FEMA has since indicated this is not a foregone conclusion; the agency is currently taking a broad view in evaluating options for developing future conditions products, including those that could be done separately from the FIS/FIRM production process.”196 In addition, TMAC’s 2018 Annual Report states “expedited efforts to create datasets and products recommended previously by TMAC should be considered” by FEMA. The statement is in reference to FEMA’s minimal progress on addressing the recommendations of the 2015 Future Conditions report. Further, TMAC’s 2019 report to FEMA states “with the recent increased intensity of storm events, the general public has increased interest on the risk of future flood conditions. It is important that FEMA generates future conditions data in a format that communicates the increased risk flood risk in an understandable way. FEMA has not finalized the future conditions data to be generated….”197 This statement was in reference to primary recommendation 5 of the Future Conditions report and how FEMA not developing the future conditions data, as required by the other recommendations, hindered TMAC from suggesting a communications format.198 FEMA has and continues to breach its legal duty by neither including the relevant NOAA and USGS information data nor including the recommendations from the 2015 TMAC Future Conditions Risk Assessment and Modeling report in any of its updates to NFIP floodplain maps.
iii. NFIP Legislative Requirements The Biggert-Waters Flood Insurance Reform Act of 2012 (HR 4348) required that the FEMA Administrator shall—
194 Technical Mapping Advisory Council, Future Conditions Risk Assessment and Modeling 7-2 (2015). 195 Technical Mapping Advisory Council, 2018 Annual Report 8 (2019) 196 Technical Mapping Advisory Council, 2017 Annual Report 43 (2018). 197 Technical Mapping Advisory Council, FEMA 2019 TMAC Subcommittee Report c-5 (2020). 198 Id.

39
(A) identify, review, update, maintain, and publish National Flood Insurance Program rate maps with respect to—
(i) all populated areas and areas of possible population growth located within the 100-year floodplain;
(ii) all populated areas and areas of possible population growth located within the 500-year floodplain;
(iii) areas of residual risk, including areas that are protected by levees, dams, and other flood control structures;
(iv) areas that could be inundated as a result of the failure of a levee, dam, or other flood control structure; and
(v) the level of protection provided by flood control structures.
While progress has been made on the first two requirements, minimal progress has been made on addressing iii through v. This results in an incomplete identification of knowing risk and leaves people who live behind or downstream of levees, dams, and other flood control structures unaware of the risk they pose if they do not function as designed or are overwhelmed by an extreme flood event.
VII. FEMA Must Revise the NFIP-Implementing Regulations to Achieve the
Congressional Intent of the NFIP and Fulfill the NFIP Mandate Flood losses happen when development and population growth occur in areas prone to flooding. Guiding where and how development and redevelopment occurs is the most effective means to reducing flood losses.199 Besides the provision of affordable insurance, Congress established the NFIP to reduce flood losses. To achieve such, Congress explicitly required FEMA to develop comprehensive criteria that “to the maximum extent feasible” would “constrict development of land which is exposed to flood damage where appropriate; guide the development of proposed construction away from locations which are threatened by flood hazards; assist in reducing damage caused by floods; and improve long-range land management and the use of flood-prone areas.”200 However, annual flood losses are increasing. This is due to a variety of factors including inadequate criteria for construction and land use, flood maps that neither reflect the array of flood hazards nor the extent of them, climate change making floods more severe and frequent, and the accelerating development and population growth in areas prone to worsening floods. Structures designed according to the current minimum criteria for construction and land-use in high-risk flood areas are increasingly vulnerable to flood damage. While acknowledging that the NFIP minimum standards do reduce flood damages to an extent, such standards are falling far short of the “maximum feasible extent” requirement. In the context of the overarching mandate of the NFIP, the program is making inadequate progress in reducing flood damages and has done nearly nothing to guide development away from locations threatened by flooding. FEMA, as the sole administrator of the NFIP, must promulgate and/or amend the NFIP-implementing regulations to develop forward-looking minimum construction and land-use criteria for flood-
199 Association of State Floodplain Managers, National Flood Programs and Policies in Review 26 (2015). 200 42 U.S.C. § 4102(c).

40
prone areas to satisfy the Congressional mandates for the flood insurance program. FEMA should revise the NFIP-implementing regulations as follows:
a. Building Requirements Elevating buildings to the height of the 1 percent annual chance flood is the primary NFIP requirement to reduce flood risk. As detailed above, higher freeboard is necessary to ensure public safety, minimize flood-related property damage, and reduce the financial exposure of the NFIP. However, the NFIP’s elevation standard has not changed since its inception 45 years ago, despite the current shortcomings with the NFIP’s mapping program and the well-documented impacts on flooding due to climate change and watershed development. The NFIP’s elevation standard now lags behind widely adopted minimum industry standards for flood safety, clearly falling short of the “maximum extent feasible” requirement.201 States and communities throughout the country successfully implement freeboard requirements above the base flood elevation. For new construction, the cost of meeting a freeboard standard can vary depending on the method used and the elevation height. These costs, which are rolled into the cost of construction, can typically be recouped in a few years due to lower flood insurance premiums for the elevated structure, and over the life of a 30-year mortgage can provide significant savings for the property owner. The elevated structure may also have a higher resale value due to lower risk and insurance costs.202 To satisfy the Congressional mandates for the NFIP, FEMA must adopt a higher freeboard standard that accounts for the uncertainty of future flood conditions. FEMA itself has long urged communities and states to adopt higher freeboard standards and many communities and states have done so, demonstrating the practicality and feasibility of such standards. To date, FEMA has not included a higher freeboard standard in its own regulations implementing the NFIP. Nor has the agency significantly revised such standards since their adoption decades ago. For non-critical structures in A-zones, FEMA should adopt a higher freeboard standard, requiring, at minimum, 2 feet of freeboard above the BFE for new construction and for substantial damage or improvements to existing structures. Multiple states and NFIP-participating communities have already adopted a freeboard standard requiring structures be elevated 2 feet above the height of the 100-year flood, which demonstrates feasibility. In addition, Benefit-Cost analysis conducted by National Institute of Building Sciences and FEMA have shown such a standard in riverine areas provides significant cost savings in avoided flood damages. For non-critical structures in V zones, FEMA should require a higher freeboard standard of 4 feet above the non-sea level rise adjusted BFE for new construction and for substantial damage or improvements to existing structures. Per FEMA’s study, 2008 Supplement to the 2006 Evaluation of the National Flood Insurance Program’s Building Standards, 4 feet of freeboard was found to be highly cost-effective. The additional cost to elevate to 4 feet above the 100-year
201 Since 2015, the I-Codes have required higher freeboard for all structures built in 1 percent annual chance floodplain 202 Association of State Floodplain Managers, The Costs & Benefits of Building Higher 1 (2017).
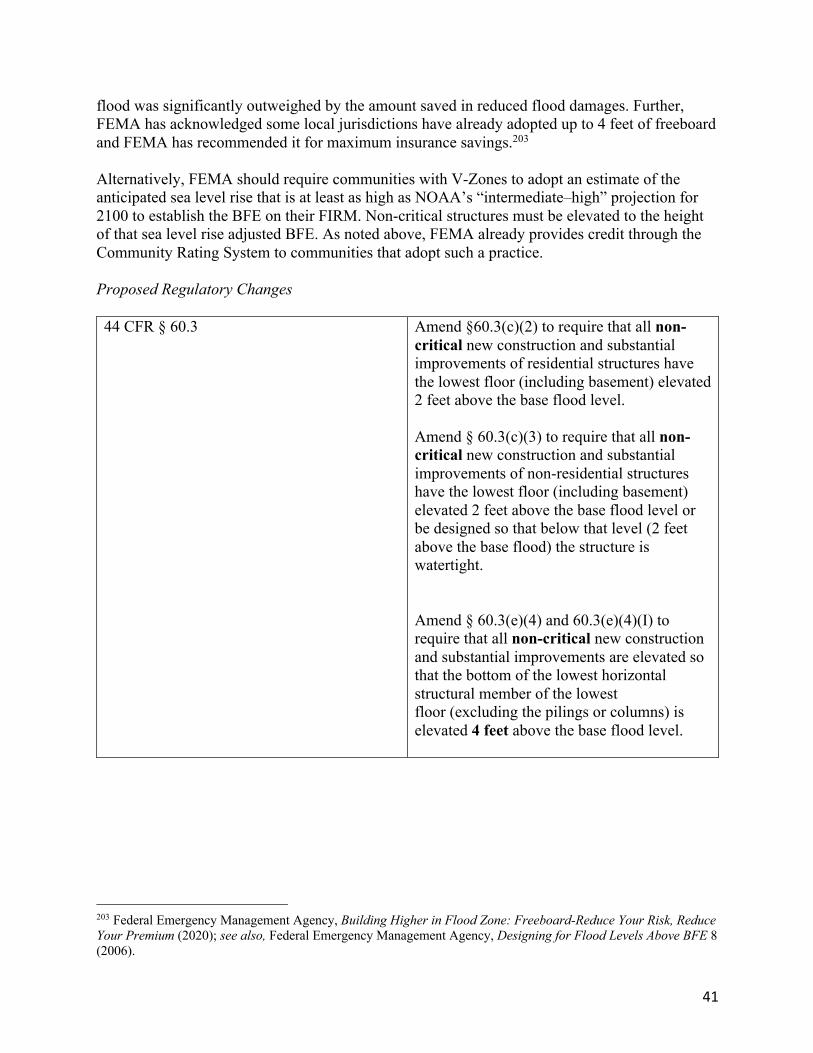
41
flood was significantly outweighed by the amount saved in reduced flood damages. Further, FEMA has acknowledged some local jurisdictions have already adopted up to 4 feet of freeboard and FEMA has recommended it for maximum insurance savings.203 Alternatively, FEMA should require communities with V-Zones to adopt an estimate of the anticipated sea level rise that is at least as high as NOAA’s “intermediate–high” projection for 2100 to establish the BFE on their FIRM. Non-critical structures must be elevated to the height of that sea level rise adjusted BFE. As noted above, FEMA already provides credit through the Community Rating System to communities that adopt such a practice. Proposed Regulatory Changes 44 CFR § 60.3 Amend §60.3(c)(2) to require that all non-
critical new construction and substantial improvements of residential structures have the lowest floor (including basement) elevated 2 feet above the base flood level. Amend § 60.3(c)(3) to require that all non-critical new construction and substantial improvements of non-residential structures have the lowest floor (including basement) elevated 2 feet above the base flood level or be designed so that below that level (2 feet above the base flood) the structure is watertight. Amend § 60.3(e)(4) and 60.3(e)(4)(I) to require that all non-critical new construction and substantial improvements are elevated so that the bottom of the lowest horizontal structural member of the lowest floor (excluding the pilings or columns) is elevated 4 feet above the base flood level.
203 Federal Emergency Management Agency, Building Higher in Flood Zone: Freeboard-Reduce Your Risk, Reduce Your Premium (2020); see also, Federal Emergency Management Agency, Designing for Flood Levels Above BFE 8 (2006).

42
44 CFR § 65 Accordingly, amend Part 65 to reflect the addition of freeboard concerning statements about elevating to the base flood, and as needed in other sections.
i. Critical Infrastructure
Unlike other FEMA disaster programs, the NFIP does not require a higher level of flood protection for critical infrastructure. The 1 percent standard is universally applied to all infrastructure types. A critical facility that produces toxic chemicals or a hospital must adhere to the identical flood risk standard as a single-family residential structure. In contrast, the Federal government, including FEMA, has required higher flood protection for federally funded critical infrastructure for decades. Executive Order 11988, signed by President Carter in 1978, requires all executive agencies to take special care when funding infrastructure projects that may affect floodplains by avoiding those areas whenever there is a practicable alternative. If avoidance of the floodplain is not practicable, agencies are required to protect federally funded infrastructure against flood damages. The implementing guidance (prepared by the Water Resources Council) established the 0.2 percent annual chance flood (500-year flood) as the minimum level of protection for critical infrastructure projects undertaken by the Federal government in floodplains. FEMA’s regulations for implementation of Executive Order 11988 (44 C.F.R. Part 9) defines a critical action as an action for which even a slight chance of flooding is too great. Critical actions include, but are not limited to, those which create or extend the useful life of structures or facilities:
(a) Such as those which produce, use or store highly volatile, flammable, explosive, toxic or water-reactive materials; (b) Such as hospitals and nursing homes, and housing for the elderly, which are likely to contain occupants who may not be sufficiently mobile to avoid the loss of life or injury during flood and storm events; (c) Such as emergency operation centers, or data storage centers which contain records or services that may become lost or inoperative during flood and storm events; and (d) Such as generating plants, and other principal points of utility lines.204
The 2006 AIR report, Assessing the Adequacy of the National Flood Insurance Program’s 1 Percent Standard, explicitly states a critical facility standard in the NFIP is warranted, recommending the NFIP prohibit critical facilities from the 0.2 percent floodplain or, if that is not practicable, to be protected to that elevation.205 Further, FEMA already encourages NFIP
204 44 C.F.R. § 9.4 205 Gerald E. Galloway et al., American Institutes for Research, Assessing the Adequacy of the National Flood Insurance Program’s 1 Percent Flood Standard 106 (2006).

43
communities to adopt a critical facilities standard by providing CRS credit to communities that prohibit construction of critical facilities in the 0.2 percent annual chance floodplain, and partial credit to communities that protect critical facilities to the height of the 500-year flood. For critical infrastructure, FEMA should
1) Prohibit new critical infrastructure, where feasible, from the 0.2 percent annual chance floodplain
2) Require redeveloped, substantially improved, or new critical infrastructure (location outside of the 0.2 percent annual chance floodplain is not feasible) to be elevated (flood-proofed) to the 0.2 percent chance flood elevation, plus freeboard to account for future conditions, or the historical flood of record, whichever is greater.
3) Ensure access to and operability of the critical infrastructure during the 0.2 percent annual chance flood event, and where that is not feasible, require a viable continuity of operations plan (COOP)
Proposed Regulatory Changes 44 CFR § 59.1 Add a definition for “Critical Action.” The
definition, at minimum, should mirror the 44 CFR § 9.4 definition of “Critical Action.”
44 CFR § 60.3 Add a new regulatory requirement for critical facilities, as defined under “Critical Action,” prohibiting new critical infrastructure from A, V, and X (0.2 percent chance flood) zones, where feasible. Require substantially damaged/improved or new critical facilities (location outside of the 0.2 percent annual chance floodplain is not feasible) to be elevated (flood-proofed) at a minimum to the 0.2 percent chance flood elevation, plus freeboard to account for future conditions, or the historical flood of record, whichever is greater.
b. Land Use Requirements
Improvement to NFIP’s minimum land use requirements hold the most potential to constrict development of land which is exposed to flood damage where appropriate and guide the development of proposed construction away from locations which are threatened by flood hazards

44
i. Zero-Rise Regulatory Floodway FEMA’s regulatory floodway standard undercuts the objectives of the NFIP to reduce future flood damage and to improve long-range land management. FEMA’s regulatory floodway standard is meant to address the combined, incremental effects of human activity, known as cumulative impacts, in the floodplain by limiting the increase in flood elevations caused by these impacts to one foot above the BFE.206 In practice, however, the regulatory floodway standard “perpetuates an upward trend of increased flood damages” because the standard:
• permits new development within the Special Flood Hazard Area that will increase flooding on existing development;
• avoids amending BFEs to avoid new development also being placed at risk; and • allows encroachments that can be detrimental to the natural and beneficial functions of
the floodplain.207 As noted above, multiple states already require a near-zero regulatory floodway requirement, which demonstrates feasibility. Proposed Regulatory Changes 44 CFR § 59.1 Amend the definition of Regulatory
Floodway to, “means the channel of a river or other watercourse and the adjacent land areas that must be reserved in order to discharge the base flood without cumulatively increasing the water surface elevation (0.00 feet).”
44 CFR § 60.3 Amend § 60.3(10) by striking “more than one foot at any point within the community” and insert “(0.00 feet)” after “without increasing the water surface elevation.” Amend § 60.3(d)(2) by striking “more than one foot at any point” and insert “(0.00 feet)” after “without increasing the water surface elevation.”
ii. Subdivisions Subdivision requirements that are incorporated to the NFIP minimum standards neither steer development away from special flood hazard areas nor provide a significant level of protection to some of the physical infrastructure and buildings within them. However, better performing states and communities have shown ways to develop subdivisions and other large-scale developments in a way that minimizes future flood damages and preserves the floodplain. For
206 See, Alan R. Lulloff, The Floodway Encroachment Standard: Minimizing Cumulative Adverse Impacts, 1 (June 2013). 207 Id. at 13-14.
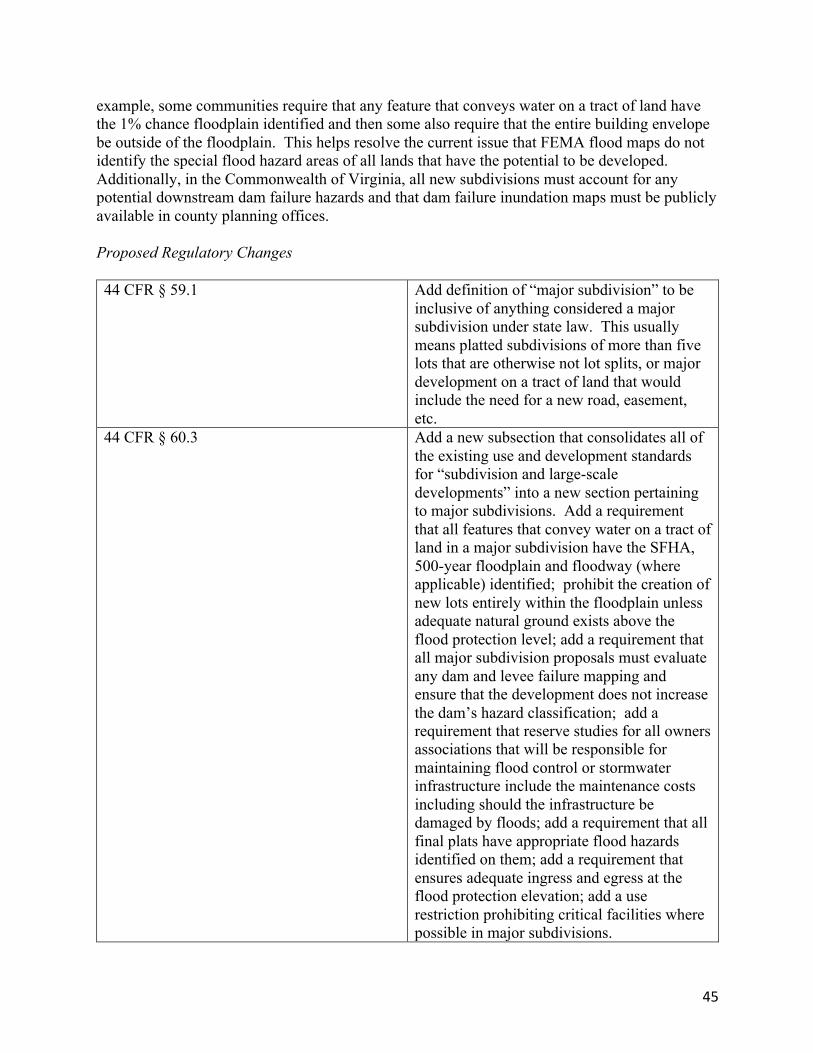
45
example, some communities require that any feature that conveys water on a tract of land have the 1% chance floodplain identified and then some also require that the entire building envelope be outside of the floodplain. This helps resolve the current issue that FEMA flood maps do not identify the special flood hazard areas of all lands that have the potential to be developed. Additionally, in the Commonwealth of Virginia, all new subdivisions must account for any potential downstream dam failure hazards and that dam failure inundation maps must be publicly available in county planning offices. Proposed Regulatory Changes 44 CFR § 59.1 Add definition of “major subdivision” to be
inclusive of anything considered a major subdivision under state law. This usually means platted subdivisions of more than five lots that are otherwise not lot splits, or major development on a tract of land that would include the need for a new road, easement, etc.
44 CFR § 60.3 Add a new subsection that consolidates all of the existing use and development standards for “subdivision and large-scale developments” into a new section pertaining to major subdivisions. Add a requirement that all features that convey water on a tract of land in a major subdivision have the SFHA, 500-year floodplain and floodway (where applicable) identified; prohibit the creation of new lots entirely within the floodplain unless adequate natural ground exists above the flood protection level; add a requirement that all major subdivision proposals must evaluate any dam and levee failure mapping and ensure that the development does not increase the dam’s hazard classification; add a requirement that reserve studies for all owners associations that will be responsible for maintaining flood control or stormwater infrastructure include the maintenance costs including should the infrastructure be damaged by floods; add a requirement that all final plats have appropriate flood hazards identified on them; add a requirement that ensures adequate ingress and egress at the flood protection elevation; add a use restriction prohibiting critical facilities where possible in major subdivisions.
46
c. Mapping
Despite a non-discretionary duty to do such, FEMA has not developed flood maps that reflect current and future flood risks. Most of the flood hazard maps that are used nationwide to determine minimum building design and other floodplain development standards are, at best, a reflection of the current flood risk. The issue with using historical risk alone to predict current risk is that these risks will change in the future due to foreseeable factors such as rising sea levels, heavier precipitation events, and population growth. In many places these factors will cause floods to increase in both frequency and severity, putting an increasing number of Americans at risk. To meet its non-discretionary duty concerning floodplain mapping, FEMA must incorporate relevant information from NOAA and USGS relating to the best available science regarding sea levels, precipitation, and intensity of hurricanes, as well as, incorporate TMAC’s future risk assessment in any revision or update of NFIP flood maps. As such, FEMA must incorporate multiple future conditions flood elevations as advisory layers onto Flood Insurance Rate Maps. For coastal areas, FEMA should use NOAA’s most recent global mean sea level rise scenarios and regional variations to determine future coastal flood hazard estimates out to the year 2100. As noted above, NOAA has produced extensive data on sea level rise projections. FEMA should incorporate sea level rise directly into process modeling (i.e., surge wave setup, wave runup, overtopping, and erosion) for regions where additional sea level is determined to impact the BFE non-linearly. For regions with linear impacts to the BFE, FEMA should add sea level to the final calculated total water level and redefine the BFE. For riverine areas, FEMA should take the impacts of future development and land use change on future conditions hydrology into account when computing future conditions for riverine areas. Future development and land use should assume built-out floodplain fringe, taking into account the decrease of storage and increase in discharge. Mecklenburg County, North Carolina was the first jurisdiction in the nation to delineate floodplains and floodways based on potential future development.208 Community SFHAs, Community Encroachment Areas, and other features were delineated by Charlotte-Mecklenburg Stormwater Services based on ultimate buildout of areas that would influence flooding. These supplement the FEMA delineated SFHA and floodways respectively. The Community SFHA and Encroachment areas establish higher standards that are, “used to regulate development activities so they are at less risk to future flooding.”209 The Community SFHA and Community Encroachment Areas have been explicitly incorporated into the official Flood Insurance Rate Maps published by FEMA and adopted by Mecklenburg County. According to the FEMA-produced Flood Insurance Study, “Floodplains resulting from runoff based on future land use conditions are shown on the FIRM in addition to the floodplains
208 Charlotte-Mecklenburg Stormwater Services, Floodplain Regulations Technical Guidance Document, 6 (March 2008). 209 Id.

47
that reflect existing land use conditions,” and, “the future conditions floodplain and elevations are used locally to regulate new development.”210 In addition, FEMA should use observed riverine trends to estimate what conditions might look like in the future. In watersheds where floods of interest may decrease in magnitude and frequency, FEMA should use existing riverine study results as the basis for flood hazard mapping. In watersheds where floods exhibit increase in magnitude or frequency, FEMA should use best available science to determine future hydrology and flood hazards. Proposed Regulatory Changes 44 CFR § 59.1
Amend the definition of “future-conditions hydrology” to include flood discharges associated with climate change impacts, such as sea level rise and changing precipitation patterns, and projected land-use conditions.
44 CFR § 64.3(a)(1) Strike the following “The FIRM also may indicate, at the request of the community, zones to identify areas of future-conditions flood hazards” and insert “The FIRM must indicate future-conditions flood hazards as an advisory layer.”
44 CFR Parts 64 and 65 Amend Parts 64 and 65 to clearly reflect the mandatory mapping requirements of BW-2012 concerning flood control structures.
d. Mitigation Breaking the cycle of flood damage is an important objective of the NFIP. As such, the NFIP requires pre-FIRM buildings that are improved beyond a certain threshold or that incur a certain level of damage to be brought into compliance with current floodplain management regulations. The NFIP’s Increased Cost of Compliance (ICC) coverage provides funds – up to $30,000 – to assist NFIP policyholders whose homes are repetitively or substantially damaged by a flood satisfy that requirement. ICC coverage is a mandatory part of most NFIP policies. For residential structures, ICC provides funds for mitigation measures, which include elevation, relocation, demolition, and floodproofing of certain residential structures with basements.211 The majority of ICC payments are used to elevate a structure.212
210 Federal Emergency Management Agency and State of North Carolina, Flood Insurance Study: A Report of Flood Hazards in Mecklenburg County, North Carolina and Incorporated Areas, 79 (2015). 211 44 CFR Pt. 61, App. A(1). 212 Carolyn Kousky and Brett Lingle, Post-Flood Mitigation: The NFIP’s Increased Cost of Compliance (ICC) Coverage, 5 (2017).

48
Unfortunately, ICC coverage often does not provide enough funds to cover the required flood mitigation expenses. The maximum payout of $30,000 is insufficient to cover the cost of measures to elevate flood-damaged structures, which can easily be 3-5 times that amount.213 Floods are occurring with greater frequency and severity due to climate change. Heavier precipitation events and rising seas are increasing the occurrence of 1 percent annual chance or greater flood events, which may increase the likelihood NFIP-insured homes are substantially damaged during flood events. Substantially flood-damaged homes must be brought into compliance with current floodplain management regulations. Per 42 U.S.C § 4011, FEMA must provide NFIP-policyholders the ability to purchase insurance to cover the cost of implementing measures that are consistent with the NFIP’s land use and control measures. FEMA has the authority to establish the mechanism, including the premium rate up to $75, and coverage amount of that insurance. As such, FEMA should increase the cap on primary ICC coverage and provide an optional ICC coverage option that exceeds the primary coverage cap. Proposed Regulatory Changes 44 C.F.R. § Pt. 61, App. A(1) Amend subsection D(2) by striking “$30,000”
and inserting $60,000.
44 CFR § Pt. 61 Add a new optional ICC coverage option above $60,000, with a maximum cap of $100,000. Expand eligible activities to include buyout cost-shares
VIII. Conclusion Much has been learned since the enactment of the NFIP over 50 years ago. FEMA, states and communities have learned the strengths and weaknesses of different land use and building standards to reduce flood damage over this time. Additionally, technological advancements to identify and map flood hazard areas have evolved tremendously. The body of science connecting climate change to an increased risk of flooding is clear. Numerous studies, including federal agency reports, prove a substantial connection between climate change and the growing frequency and severity of flood events, which greatly challenge our nation’s cities, towns, and neighborhoods. Congress created the NFIP to reduce flood damages nationwide and to ease the federal government’s financial burden for providing disaster recovery. However, flood damages and federal spending on flood recovery are rising, implying the NFIP program is failing to achieve its
213 Id. at 4.
49
primary goal. To reduce future flood damage, strengthen minimum standards and improve flood mapping, the NFIP must adequately account for the impact of climate change and increasing development on flood hazards. Therefore, NRDC and ASFPM request that FEMA, as administrator of the NFIP, comply with its legal and policy obligations to ensure the program is reducing future flood damage by initiating a rulemaking amending the NFIP-implementing regulations, 44 CFR §§ 59.1 – 80.21, to ensure the program’s construction, land-use, mapping, and mitigation components account for future flood risk. We request that FEMA initiate this rulemaking promptly given the quickly growing threat to lives and property from flooding and climate change. Respectfully submitted, NATURAL RESOURCES DEFENSE COUNCIL ASSOCIATION OF STATE FLOODPLAIN MANAGERS
Joel Scata 20 N. Wacker Dr Suite 1600 Chicago, IL 60606 (630) 631-1378 [email protected] Attorney for Natural Resources Defense Council
Chad Berginnis, CFM 8301 Excelsior Drive Madison, WI 53717 (608) 828-3000 [email protected] Executive Director of Association of State Floodplain Managers
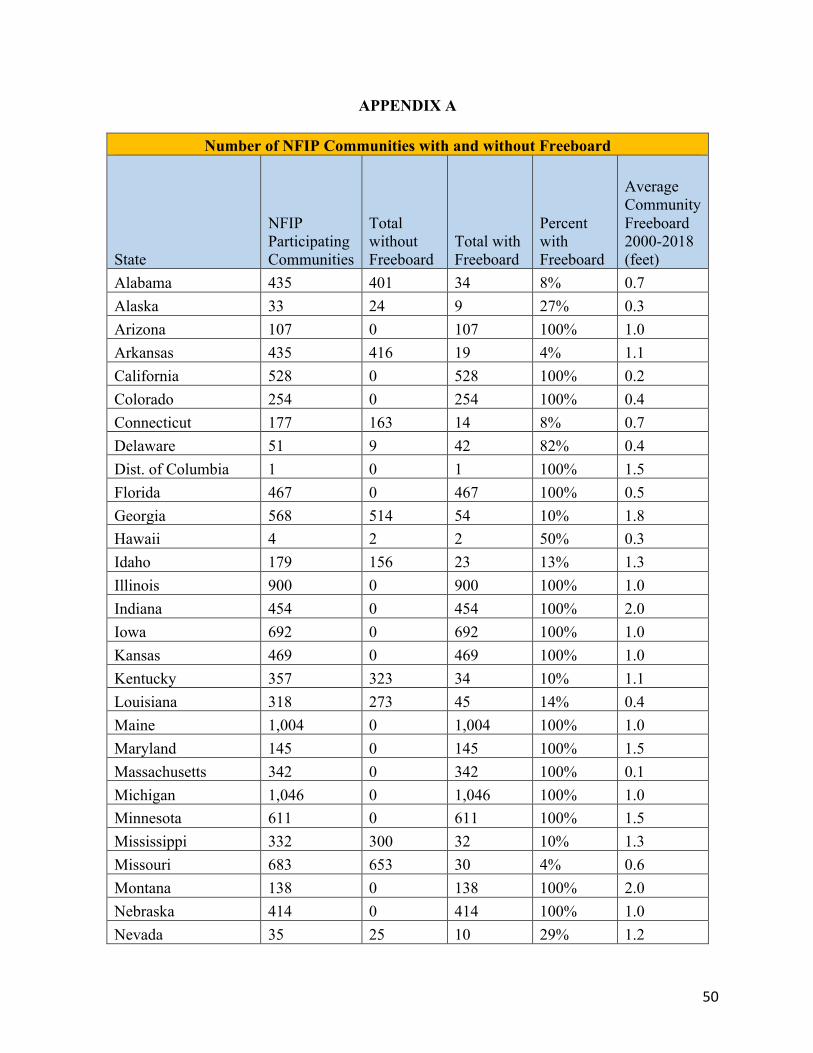
50
APPENDIX A
Number of NFIP Communities with and without Freeboard
State
NFIP Participating Communities
Total without Freeboard
Total with Freeboard
Percent with Freeboard
Average Community Freeboard 2000-2018 (feet)
Alabama 435 401 34 8% 0.7 Alaska 33 24 9 27% 0.3 Arizona 107 0 107 100% 1.0 Arkansas 435 416 19 4% 1.1 California 528 0 528 100% 0.2 Colorado 254 0 254 100% 0.4 Connecticut 177 163 14 8% 0.7 Delaware 51 9 42 82% 0.4 Dist. of Columbia 1 0 1 100% 1.5 Florida 467 0 467 100% 0.5 Georgia 568 514 54 10% 1.8 Hawaii 4 2 2 50% 0.3 Idaho 179 156 23 13% 1.3 Illinois 900 0 900 100% 1.0 Indiana 454 0 454 100% 2.0 Iowa 692 0 692 100% 1.0 Kansas 469 0 469 100% 1.0 Kentucky 357 323 34 10% 1.1 Louisiana 318 273 45 14% 0.4 Maine 1,004 0 1,004 100% 1.0 Maryland 145 0 145 100% 1.5 Massachusetts 342 0 342 100% 0.1 Michigan 1,046 0 1,046 100% 1.0 Minnesota 611 0 611 100% 1.5 Mississippi 332 300 32 10% 1.3 Missouri 683 653 30 4% 0.6 Montana 138 0 138 100% 2.0 Nebraska 414 0 414 100% 1.0 Nevada 35 25 10 29% 1.2

51
New Hampshire 221 215 6 3% 0.3 New Jersey 554 0 554 100% 0.7 New Mexico 105 0 105 100% 0.1 New York 1,511 0 1,511 100% 1.4 North Carolina 594 505 89 15% 1.4 North Dakota 335 0 335 100% 1.0 Ohio 762 748 14 2% 0.9 Oklahoma 416 377 39 9% 0.5 Oregon 261 0 261 100% 0.9 Pennsylvania 2,486 0 2,486 100% 1.5 Rhode Island 40 0 40 100% 0.5 South Carolina 236 0 236 100% 0.3 South Dakota 230 220 10 4% 0.6 Tennessee 400 384 16 4% 1.1 Texas 1,259 930 329 26% 1.3 Utah 222 0 222 100% 0.1 Vermont 255 248 7 3% 0.8 Virginia 292 267 25 9% 1.1 Washington 296 0 296 100% 0.2 West Virginia 278 259 19 7% 0.8 Wisconsin 569 0 569 100% 2.0 Wyoming 86 77 9 10% 0.2
Source: FEMA, Building Codes Save: A Nationwide Study: Losses Avoided as a Result of Adopting Hazard- Resistant Building Codes Appendices D-25 (2020).

52
APPENDIX B: List of Exhibits214
AECOM, The Impact of Climate Change and Population Growth on the National Flood Insurance Program (2013).
Association of State Floodplain Managers, Testimony on Hearing: An Examination of Federal
Flood Maps in a Changing Climate Before Committee on Science, Space, and Technology 116th Cong. (2020) (statement by Chad Berginnis).
Association of State Floodplain Managers, Testimony on Hearing: National Flood Insurance
Program Reauthorization and Reform Before House Financial Services Committee 116th Cong. (2019) (statement by Maria Cox Lamm)
Association of State Floodplain Managers, Flood Mapping for the Nation: A Cost Analysis for
Completing and Maintaining the Nation’s NFIP Flood Map Inventory (2020). Association of State Floodplain Managers, The Costs & Benefits of Building Higher (2017). Association of State Floodplain Managers, National Flood Programs & Policies in Review
(2015). Association of State Floodplain Managers, Report of the 2004 Assembly of the Gilbert F. White
National Flood Policy Forum, Reducing Flood Losses: Is the 1% Chance Flood Standard Sufficient? (2004).
Association of State Floodplain Managers, States and Other Communities in FEMA CRS with
Building Freeboard Requirements (2015). Blum, Annalise G., et.al., Causal Effect of Impervious Cover on Annual Flood Magnitude for the
United States, 47 Geophysical Research Letters 1 (2020). Buchanan, Maya K., Michael Oppenheimer, and Robert F. Kopp, Amplification of Flood
Frequencies with Local Sea Level Rise and Emerging Flood Regimes, 12 Environmental Research Letters 1 (2017).
Charlotte-Mecklenburg Stormwater Services, Floodplain Regulations Technical Guidance
Document (2008). Congressional Budget Office, Expected Costs of Damage from Hurricane Winds and Storm-
related Flooding (2019). Emanuel, Kerry, Assessing the Present and Future Probability of Hurricane Harvey’s Rainfall
114 (48) Proceedings of the National Academy of Sciences 12681 (2017).
214 A digital copy of each exhibit document has been included on compact disc with a hard copy of this petition via mail and is hereby incorporated by reference as an attachment.

53
Federal Emergency Management Agency, 2016 Evaluation of the Benefits of Freeboard for Public and Nonresidential Buildings in Coastal Areas (2016).
Federal Emergency Management Agency, 2008 Supplement to the 2006 Evaluation of the
National Flood Insurance Program’s Building Standards (2008) Federal Emergency Management Agency, Building Codes Save: A Nationwide Study: Losses
Avoided as a Result of Adopting Hazard-Resistant Building Codes (2020). Federal Emergency Management Agency, Building Codes Save: A Nationwide Study: Losses
Avoided as a Result of Adopting Hazard-Resistant Building Codes Appendices (2020). Federal Emergency Management Agency, Elevating Floodprone Buildings Above Minimum
NFIP Requirements: Iowa Floods of 2016 Recovery Advisory (2017). Federal Emergency Management Agency, Flood Protection for Critical and Essential Facilities:
Iowa Floods of 2016 Recovery Advisory (2017). Federal Emergency Management Agency, Including Building Codes in the National Flood
Insurance Program: Fiscal Year 2013 Report to Congress: Impact Study for Biggert-Waters Flood Insurance Reform Act of 2012 (2013).
Federal Emergency Management Agency, Building Higher in Flood Zone: Freeboard-Reduce
Your Risk, Reduce Your Premium (2020) Federal Emergency Management Agency, Designing for Flood Levels Above BFE (2006). Federal Emergency Management Agency, FEMA P-2022, Mitigation Assessment Team Report:
Hurricane Harvey in Texas: Building Performance Observations, Recommendations, and Technical Guidance (2019).
Federal Emergency Management Agency, FEMA P-2023, Mitigation Assessment Team Report:
Hurricane Irma in Florida: Building Performance Observations, Recommendations, and Technical Guidance (2018).
Federal Emergency Management Agency, FEMA P-765, Mitigation Assessment Team Report:
Midwest Floods of 2008 in Iowa and Wisconsin: Building Performance Observations, Recommendations, and Technical Guidance (2009)
Federal Emergency Management Agency, FEMA P-757, Mitigation Assessment Team Report:
Hurricane Ike in Texas and Louisiana: Building Performance Observations, Recommendations, and Technical Guidance (2009)
Federal Emergency Management Agency, FEMA 489, Mitigation Assessment Team Report:
Hurricane Ivan in Alabama and Florida: Observations, Recommendations, and Technical Guidance (2005).
54
Federal Emergency Management Agency, FIA-15/2017, National Flood Insurance Program
Community Rating System Coordinator’s Manual (2017). Federal Emergency Management Agency, Reducing Flood Losses Through the International
Codes: Coordinating Building Codes and Floodplain Management Regulations (2019). Federal Emergency Management Agency, FEMA-DR-4145-CO, Reducing Losses through
Higher Regulatory Standards: 2013 Colorado Floods Case Study (2015). Federal Emergency Management Agency, FP 302-094-2, State Mitigation Plan Review Guide
(2016). Federal Emergency Management Agency, National Flood Insurance Program Call for Issues
Status Report (2000). Federal Emergency Management Agency and State of North Carolina, Flood Insurance Study: A
Report of Flood Hazards in Mecklenburg County, North Carolina and Incorporated Areas (2015).
Frame, David J., et. al., The Economic Costs of Hurricane Harvey Attributable to Climate
Change, 160 Climatic Change 271 (2020). Galloway, Gerald E., et. al., American Institutes for Research, Assessing the Adequacy of the
National Flood Insurance Program’s 1 percent Flood Standard (2006). Hauer, Matthew, Jason Evans, and Deepak Mishra, Millions Projected to Be at Risk from Sea-
Level Rise in the Continental United States, 6 Nature Climate Change 691 (2016). Intergovernmental Panel on Climate Change, Special Report on Managing the Risks of Extreme
Events and Disasters to Advance Climate Change Adaptation (2012). Intergovernmental Panel on Climate Change, Special Report on The Ocean and Cryosphere in a
Changing Climate (2019). Jones, Christopher, American Institutes for Research, Evaluation of the National Flood
Insurance Program’s Building Standards (2006). Kirchmeier-Young, Megan C. and Xuebin Zhang, Human Influence Has Intensified
Precipitation in North America, 117 (24) Proceedings of the National Academy of Sciences 13308 (2020).
Knutson, Thomas, et al., Tropical Cyclones and Climate Change Assessment: Part II: Projected
Response to Anthropogenic Warming, 101 (3) Bulletin of American Meteorological Society E303 (2019).

55
Kousky, Carolyn and Brett Lingle, Wharton Center for Risk Management and Decision Processes, Post-Flood Mitigation: The NFIP’s Increased Cost of Compliance (ICC) Coverage (2017).
Lin, Ning, et. al., Hurricane Sandy’s Flood Frequency Increasing from Year 1800 to 2100, 113
(43) Proceedings of the National Academy of Sciences 12071 (2016). Lulloff, Alan R., Association of State Floodplain Managers, The Floodway Encroachment
Standard: Minimizing Cumulative Adverse Impacts (2013). Marsooli, Reza, et. al., Climate Change Exacerbates Hurricane Flood Hazards Along U.S.
Atlantic and Gulf Coasts in Spatially Varying Patterns, 10 Nature Communications 1 (2019).
Grimm, Michael, Assistant Administrator for Risk Management, Federal Emergency
Management Agency, Testimony on Hearing: An Examination of Federal Flood Maps in a Changing Climate Before Committee on Science, Space, and Technology 116th Cong. (2020)
Mitigation Framework Leadership Group, National Mitigation Investment Strategy (2019). Moftakhari, Hamed, et. al., Increased Nuisance Flooding Along the Coasts of the United States
due to Sea Level Rise: Past and Future, 42 Geophysical Research Letters 9846 (2015). National Academy of Sciences, Reducing Coastal Risk on the East and Gulf Coasts (2014). National Institute of Building Sciences, Natural Hazard Mitigation Saves: 2019 Report (2019). NYU Furman Center, Population in the U.S. Floodplains (2017). Office of Inspector General, Department of Homeland Security, OIG-17-110, FEMA Needs to
Improve Management of its Flood Mapping Programs (2017). Perica, Sanja, et. al., National Oceanic and Atmospheric Administration, NOAA Atlas 14:
Precipitation-Frequency Atlas of the United States: Volume 11 Version 2.0 – Texas (2018).
Peterson, Thomas, et. al., Monitoring and Understanding Changes in Heat Waves, Cold Waves,
Floods, and Droughts in the United States: State of Knowledge, 94 (6) Bulletin of the American Meteorological Society 821 (2013).
Reed, Kevin A., et. al., Forecasted Attribution of the Human Influence on Hurricane Florence, 6
Science Advances 1 (2020)

56
Risser, Mark D. and Michael F. Wehner, Attributable Human-Induced Changes in the Likelihood and Magnitude of the Observed Extreme Precipitation during Hurricane Harvey, 44 (24) Geophysical Research Letters 12,457 (2017).
Slater, Louise and Gabriele Villarini, Recent Trends in U.S. Flood Risk, , 43 (24) Geophysical
Research Letters 12,428 (2016). Swain, D.L., et. al., Increased Flood Exposure due to Climate Change and Population Growth in
the United States, 8 (11) Earth’s Future 1 (2020). Sweet, William, et. al., National Oceanic and Atmospheric Administration, NOAA Technical
Report NOS CO-OPS 083, Global and Regional Sea Level Rise Scenarios for the United States (2017).
Sweet, William, et. al., National Oceanic and Atmospheric Administration, NOAA Technical
Report NOS CO-OPS 086, Patterns and Projections of High Tide Flooding Along the U.S. Coastline Using a Common Impact Threshold (2018).
Sweet, William, et al., Hurricane Sandy Inundation Probabilities Today and Tomorrow in
Explaining Extreme Events of 2012 from a Climate Perspective, 94 (9) Bulletin of the American Meteorological Society S17 (2013).
Technical Mapping Advisory Council, FEMA 2019 TMAC Subcommittee Report (2020). Technical Mapping Advisory Council, 2018 Annual Report (2019) Technical Mapping Advisory Council, 2017 Annual Report (2018). Technical Mapping Advisory Council, Future Conditions Risk Assessment and Modeling (2015). Union of Concerned Scientists, Underwater: Rising Seas, Chronic Floods, and the Implications
for US Coastal Real Estate (2018). U.S. Global Change Research Program (USGCRP), Fourth National Climate Assessment:
Volume I, Climate Science Special Report (2017). U.S. Global Change Research Program (USGCRP), Fourth National Climate Assessment:
Volume II, Impacts, Risks, and Adaptation in the United States (2018). Van Oldenborgh, Geert Jan, et. al., Attribution of Extreme Rainfall from Hurricane Harvey,
August 2017 (2018) Wing, Oliver, et. al., Estimates of Present and Future Flood Risk in the Conterminous United
States (2018).

57
Winter, Jonathon, et. al., Anthropogenic Impacts on the Exceptional Precipitation of 2018 in the Mid-Atlantic United States in Explaining Extreme Events of 2018 from a Climate Perspective (2020).