Peters & Co. Limited 2019 Energy Conference · calculated using the Benchmark Prices –$40 stress...
19
1 Peters & Co. Limited 2019 Energy Conference September 2019
Transcript of Peters & Co. Limited 2019 Energy Conference · calculated using the Benchmark Prices –$40 stress...
1
Peters & Co. Limited
2019 Energy ConferenceSeptember 2019
Husky Energy Inc.
◼ Supplies gas
to Corridor
◼ Competitive,
standalone
business
Western Canada
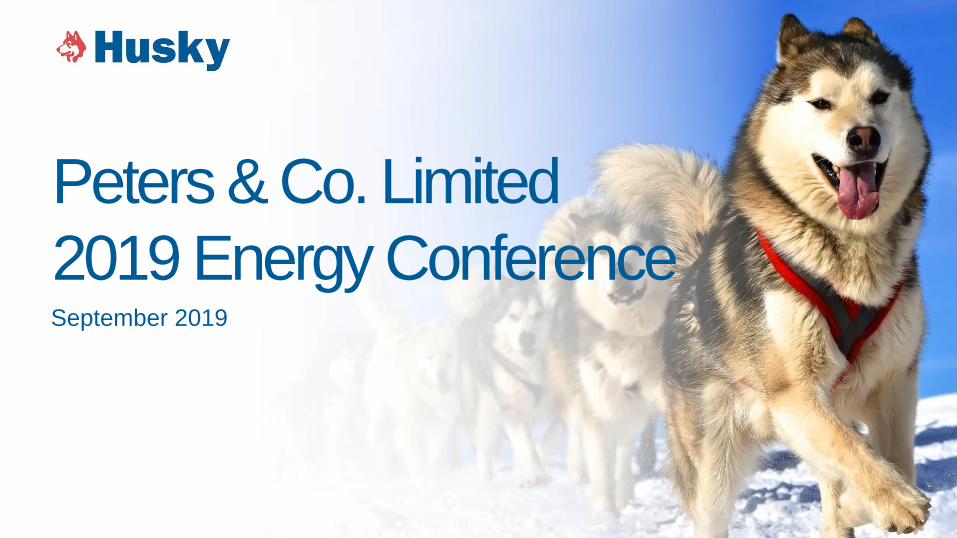
Integrated & Fixed-Price Businesses Drive Stable Cash Flow While Preserving Upside
Competitively Advantaged Business Model
1, 2, 3 See Slide Notes and Advisories
Atlantic
◼ High-netback
production
◼ Global pricing
◼ Production
growth
Asia Pacific
◼ Attractive,
long-term
contracts
◼ Fast-growing
market
Integrated Corridor (~80% Contribution)
DownstreamUpstream
Production
’19 Q2 YTD
223mboe/day
Throughput
’19 Q2 YTD
337mboe/day
Thermal &
Heavy Oil
◼ Large supply of
low-cost, reliable
feedstock
Downstream
◼ Captures
full value for
all Corridor
production
Netback2
’19 Q2 YTD
$24/boe
Offshore(~20% Contribution) 1
Production’19 Q2 YTD
54mboe/day
Netback2
’19 Q2 YTD
$57/boe
Gross Margin3
’19 Q2 YTD
$20/bbl
2
Husky Energy Inc. 3
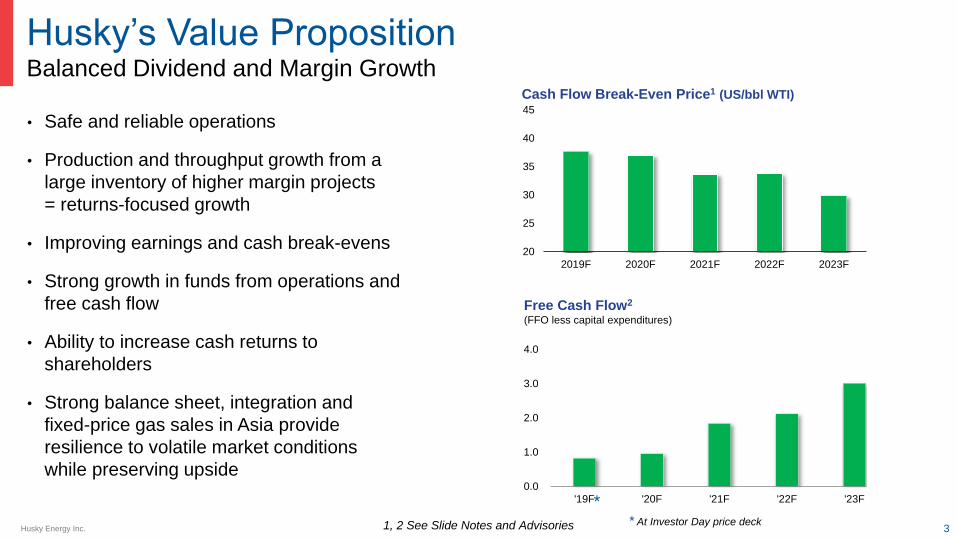
Balanced Dividend and Margin Growth
Husky’s Value Proposition
• Safe and reliable operations
• Production and throughput growth from a
large inventory of higher margin projects
= returns-focused growth
• Improving earnings and cash break-evens
• Strong growth in funds from operations and
free cash flow
• Ability to increase cash returns to
shareholders
• Strong balance sheet, integration and
fixed-price gas sales in Asia provide
resilience to volatile market conditions
while preserving upside
20
25
30
35
40
45
2019F 2020F 2021F 2022F 2023F
Cash Flow Break-Even Price1 (US/bbl WTI)
0.0
1.0
2.0
3.0
4.0
'19F '20F '21F '22F '23F
Free Cash Flow2
(FFO less capital expenditures)
* At Investor Day price deck
*
1, 2 See Slide Notes and Advisories

Husky Energy Inc. 4
Focus On Safety And ReliabilityDriving Towards World-Class Performance
CompetentDocumented Accountable VerifiedSystematic and
in Control
Leadership & HRO Principles
• Appointed SVP of Safety & Operations Integrity; reports to CEO
• Aligned compensation more tightly to safety performance
• Engaged world-leading safety experts to review operations
• Continuing journey to becoming a High Reliability Organization
a
a
a
2019 Actions
• Knowledge & learning
• Standards & procedure
compliance
• Questioning attitude
• Team backup
• Integrity
Five Principles of a High
Reliability Organization

Husky Energy Inc. 5
Leadership In ESG Performance
Responsible Energy Production
ESG Ratings by Major Oil-Producing Country
Source: BMO Capital Markets, Yale Environmental Performance Index (EPI); Social Progress
Imperative; World Bank Worldwide Governance Indicators
Notes: Equal weighting applied to all three indices
• Canada is a leader amongst major oil
producing nations in terms of:
• Environment performance
• Social progress
• Governance
• Husky adheres to the same high standards of
performance when operating in other
jurisdictions
Canada

Husky Energy Inc. 6
ESG Performance & Reporting
Priority Topics
Water Use & Availability
Air Emissions Management,
including GHGs
Land Use & Reclamation
Community & Indigenous
People’s EngagementBusiness Ethics and
Transparency
Talent Management
& Culture of Inclusion
Process Safety
& Asset IntegrityBusiness Resilience
Innovation & Advanced
Technology
Husky Energy Inc.
0.0
1.0
2.0
3.0
4.0
'19F '20F '21F '22F '23F
'19-'23 Plan
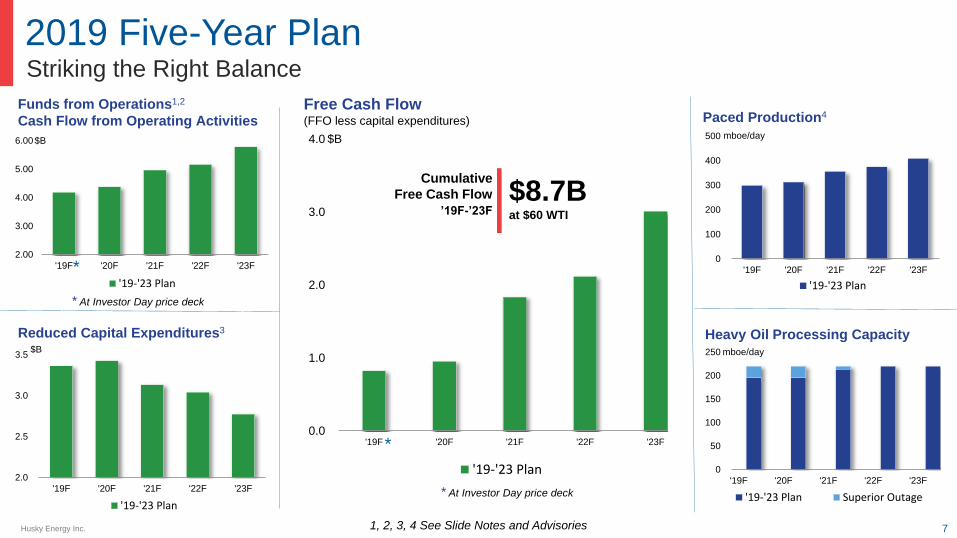
2019 Five-Year Plan
0
100
200
300
400
500
'19F '20F '21F '22F '23F
'19-'23 Plan
mboe/day
$B
1, 2, 3, 4 See Slide Notes and Advisories
Free Cash Flow (FFO less capital expenditures)
$B
0
50
100
150
200
250
'19F '20F '21F '22F '23F
'19-'23 Plan Superior Outage
mboe/day
Paced Production4
Heavy Oil Processing Capacity
7
Cumulative
Free Cash Flow
’19F-’23F $8.7B at $60 WTI
$B
Striking the Right Balance
* At Investor Day price deck
2.00
3.00
4.00
5.00
6.00
'19F '20F '21F '22F '23F
'19-'23 Plan
Funds from Operations1,2
Cash Flow from Operating Activities
*
*
2.0
2.5
3.0
3.5
'19F '20F '21F '22F '23F
'19-'23 Plan
Reduced Capital Expenditures3
* At Investor Day price deck
Husky Energy Inc.
0.0
1.0
2.0
3.0
4.0
5.0
6.0
FFO / CFOA Uses FFO / CFOA Uses
Planned
Growth
Capital3
Sustaining
Capital4
*
8
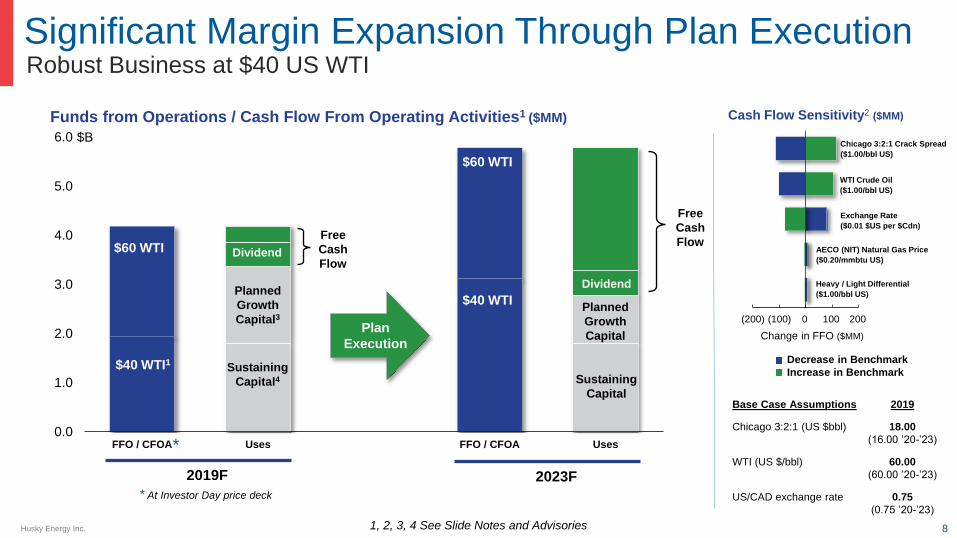
Robust Business at $40 US WTI
Significant Margin Expansion Through Plan Execution
$60 WTI Dividend
Planned
Growth
Capital
Dividend
Sustaining
Capital
$60 WTI
$B
Plan
Execution
2023F
$40 WTI1
Funds from Operations / Cash Flow From Operating Activities1 ($MM)
Free
Cash
Flow
$40 WTI
(200) (100) 0 100 200
Cash Flow Sensitivity2 ($MM)
Chicago 3:2:1 Crack Spread
($1.00/bbl US)
WTI Crude Oil
($1.00/bbl US)
AECO (NIT) Natural Gas Price
($0.20/mmbtu US)
Heavy / Light Differential
($1.00/bbl US)
Exchange Rate
($0.01 $US per $Cdn)
Decrease in Benchmark
Increase in Benchmark
Change in FFO ($MM)
Free
Cash
Flow
$60 WTI
Dividend
2019F
1, 2, 3, 4 See Slide Notes and Advisories
* At Investor Day price deck
Base Case Assumptions 2019
Chicago 3:2:1 (US $bbl) 18.00
(16.00 ’20-’23)
WTI (US $/bbl) 60.00
(60.00 ’20-’23)
US/CAD exchange rate 0.75
(0.75 ’20-’23)
Husky Energy Inc. 9
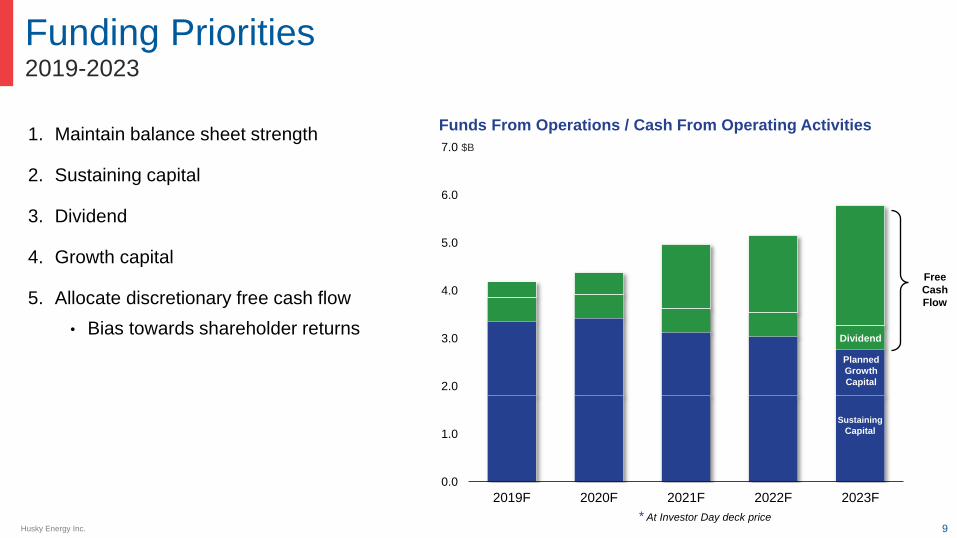
2019-2023
Funding Priorities
1. Maintain balance sheet strength
2. Sustaining capital
3. Dividend
4. Growth capital
5. Allocate discretionary free cash flow
• Bias towards shareholder returns
0.0
1.0
2.0
3.0
4.0
5.0
6.0
7.0
2019F 2020F 2021F 2022F 2023F
Sustaining
Capital
Planned
Growth
Capital
Dividend
$B
Free
Cash
Flow
Funds From Operations / Cash From Operating Activities
* At Investor Day deck price
Husky Energy Inc.
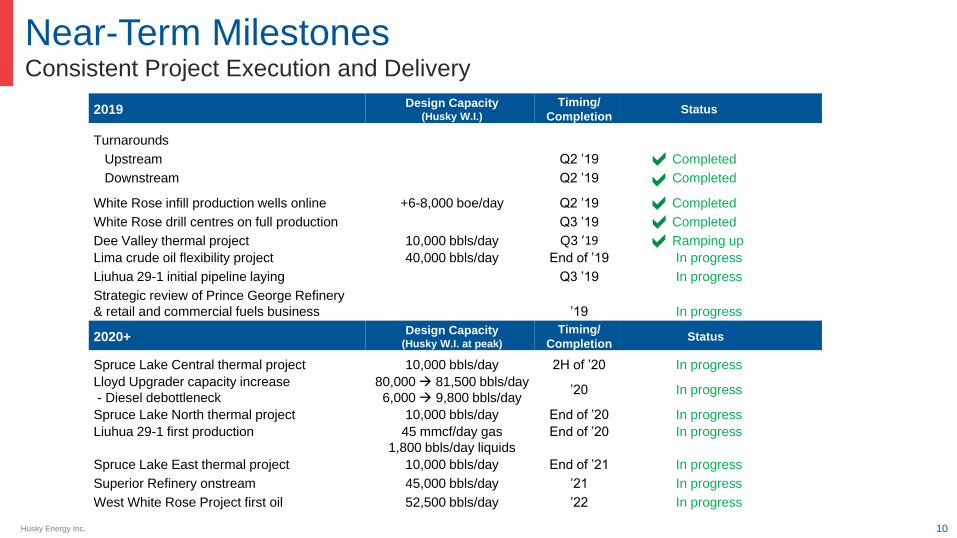
Near-Term Milestones
10
2019Design Capacity
(Husky W.I.)
Timing/
CompletionStatus
Turnarounds
Upstream Q2 ’19 Completed
Downstream Q2 ’19 Completed
White Rose infill production wells online +6-8,000 boe/day Q2 ’19 Completed
White Rose drill centres on full production Q3 ’19 Completed
Dee Valley thermal project 10,000 bbls/day Q3 ’19 Ramping up
Lima crude oil flexibility project 40,000 bbls/day End of ’19 In progress
Liuhua 29-1 initial pipeline laying Q3 ’19 In progress
Strategic review of Prince George Refinery
& retail and commercial fuels business ’19 In progress
2020+Design Capacity
(Husky W.I. at peak)
Timing/
Completion Status
Spruce Lake Central thermal project 10,000 bbls/day 2H of ’20 In progress
Lloyd Upgrader capacity increase
- Diesel debottleneck
80,000 → 81,500 bbls/day
6,000 → 9,800 bbls/day’20 In progress
Spruce Lake North thermal project 10,000 bbls/day End of ’20 In progress
Liuhua 29-1 first production 45 mmcf/day gas
1,800 bbls/day liquids
End of ’20 In progress
Spruce Lake East thermal project 10,000 bbls/day End of ’21 In progress
Superior Refinery onstream 45,000 bbls/day ’21 In progress
West White Rose Project first oil 52,500 bbls/day ’22 In progress
Consistent Project Execution and Delivery
a
aa
a
a

Husky Energy Inc. 11
Balanced Dividend and Margin Growth
Husky’s Value Proposition
• Safe and reliable operations
• Production and throughput growth from a
large inventory of higher margin projects
= returns-focused growth
• Improving earnings and cash break-evens
• Strong growth in funds from operations and
free cash flow
• Ability to increase cash returns to
shareholders
• Strong balance sheet, integration and
fixed-price gas sales in Asia provide
resilience to volatile market conditions
while preserving upside0.0
1.0
2.0
3.0
4.0
5.0
6.0
7.0
2019F 2020F 2021F 2022F 2023F
Sustaining
Capital
Planned
Growth
Capital
Dividend
$B
Free
Cash
Flow
Funds From Operations / Cash From Operating Activities
* At Investor Day deck price
12
Appendix
Husky Energy Inc. 13
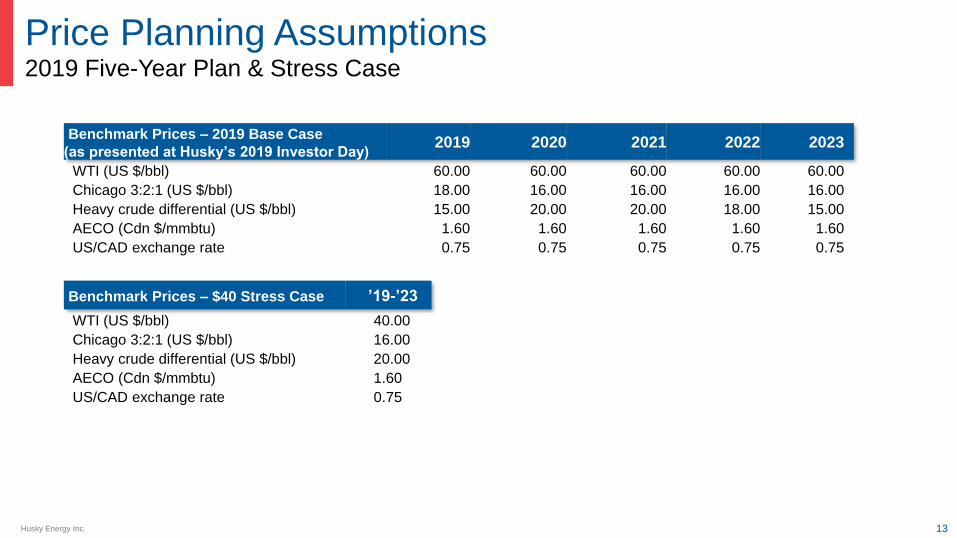
Price Planning Assumptions2019 Five-Year Plan & Stress Case
Benchmark Prices – $40 Stress Case ’19-’23
WTI (US $/bbl) 40.00
Chicago 3:2:1 (US $/bbl) 16.00
Heavy crude differential (US $/bbl) 20.00
AECO (Cdn $/mmbtu) 1.60
US/CAD exchange rate 0.75
Benchmark Prices – 2019 Base Case
(as presented at Husky’s 2019 Investor Day)2019 2020 2021 2022 2023
WTI (US $/bbl) 60.00 60.00 60.00 60.00 60.00
Chicago 3:2:1 (US $/bbl) 18.00 16.00 16.00 16.00 16.00
Heavy crude differential (US $/bbl) 15.00 20.00 20.00 18.00 15.00
AECO (Cdn $/mmbtu) 1.60 1.60 1.60 1.60 1.60
US/CAD exchange rate 0.75 0.75 0.75 0.75 0.75

Husky Energy Inc. 14
Investor Relations Contacts
Director, Investor Relations
[email protected] Cuthbertson
Senior Manager, Investor Relations
[email protected] Villegas
Investor Relations Specialist
[email protected] Pickering
Contact us: www.huskyenergy.com [email protected] 1-855-527-5005

15
Slide Notes
& Advisories
Husky Energy Inc. 16
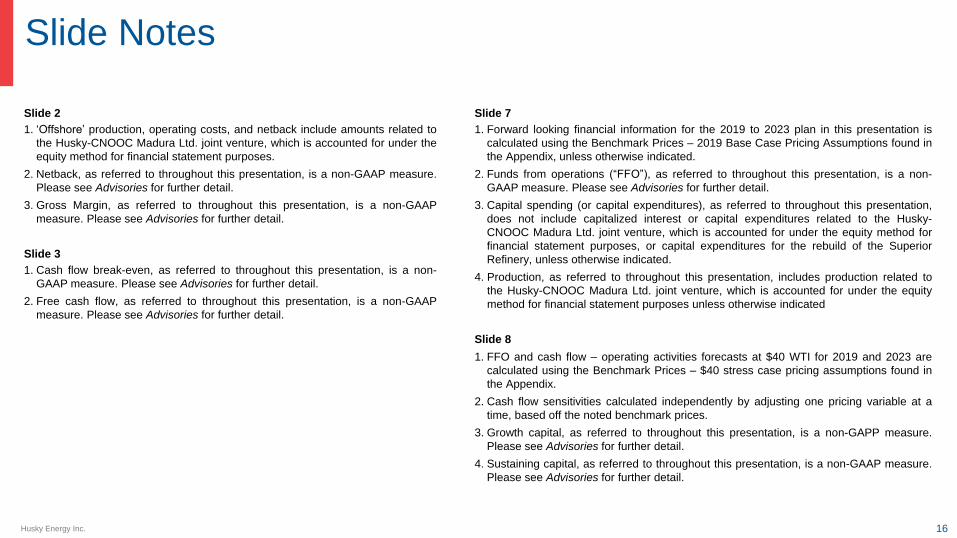
Slide Notes
Slide 2
1. ‘Offshore’ production, operating costs, and netback include amounts related to
the Husky-CNOOC Madura Ltd. joint venture, which is accounted for under the
equity method for financial statement purposes.
2. Netback, as referred to throughout this presentation, is a non-GAAP measure.
Please see Advisories for further detail.
3. Gross Margin, as referred to throughout this presentation, is a non-GAAP
measure. Please see Advisories for further detail.
Slide 3
1. Cash flow break-even, as referred to throughout this presentation, is a non-
GAAP measure. Please see Advisories for further detail.
2. Free cash flow, as referred to throughout this presentation, is a non-GAAP
measure. Please see Advisories for further detail.
Slide 7
1. Forward looking financial information for the 2019 to 2023 plan in this presentation is
calculated using the Benchmark Prices – 2019 Base Case Pricing Assumptions found in
the Appendix, unless otherwise indicated.
2. Funds from operations (“FFO”), as referred to throughout this presentation, is a non-
GAAP measure. Please see Advisories for further detail.
3. Capital spending (or capital expenditures), as referred to throughout this presentation,
does not include capitalized interest or capital expenditures related to the Husky-
CNOOC Madura Ltd. joint venture, which is accounted for under the equity method for
financial statement purposes, or capital expenditures for the rebuild of the Superior
Refinery, unless otherwise indicated.
4. Production, as referred to throughout this presentation, includes production related to
the Husky-CNOOC Madura Ltd. joint venture, which is accounted for under the equity
method for financial statement purposes unless otherwise indicated
Slide 8
1. FFO and cash flow – operating activities forecasts at $40 WTI for 2019 and 2023 are
calculated using the Benchmark Prices – $40 stress case pricing assumptions found in
the Appendix.
2. Cash flow sensitivities calculated independently by adjusting one pricing variable at a
time, based off the noted benchmark prices.
3. Growth capital, as referred to throughout this presentation, is a non-GAPP measure.
Please see Advisories for further detail.
4. Sustaining capital, as referred to throughout this presentation, is a non-GAAP measure.
Please see Advisories for further detail.
Husky Energy Inc. 17
Advisories
Forward-Looking Statements and Information
Certain statements in this presentation are forward-looking statements and information (collectively “forward-looking statements”), within the meaning of the applicable Canadian securities
legislation, Section 21E of the United States Securities Exchange Act of 1934, as amended, and Section 27A of the United States Securities Act of 1933, as amended. The forward-looking
statements contained in this presentation are forward-looking and not historical facts.
Some of the forward-looking statements may be identified by statements that express, or involve discussions as to, expectations, beliefs, plans, objectives, assumptions or future events or
performance (often, but not always, through the use of words or phrases such as “will likely result”, “are expected to”, “will continue”, “is anticipated”, “is targeting”, “estimated”, “intend”, “plan”,
“projection”, “could”, “aim”, “vision”, “goals”, “objective”, “target”, “schedules” and “outlook”). In particular, forward-looking statements in this presentation include, but are not limited to, references
to:
• with respect to the business, operations and results of the Company generally: the Company’s general strategic plans and growth strategies and the results thereof; forecast cash flow break-
even prices for 2019 to 2023; forecast FFO, cash flow from operating activities, free cash flow, capital expenditures, production and heavy oil processing capacity for 2019 to 2023; safety and
operations integrity priorities; cash flow sensitivities, forecast FFO, cash flow from operating activities, growth capital and sustaining capital in 2019 and 2023 based on US$40 WTI and US$60
WTI; funding priorities for 2019 to 2023; forecast cumulative free cash flow for 2019 to 2023 and the allocation thereof; and the ability to increase shareholder returns;
• with respect to the Company's Downstream operating segment: estimated processing capacity resulting from, and expected completion date of, the crude oil flexibility project at the Lima
Refinery; expected timing for the Superior Refinery to come onstream; forecast heavy oil blend (in total and by product type) versus Downstream processing and pipeline capacity (in total and
by facility) for 2019 to 2023; and the expected timing of, and capacity increase resulting from, the diesel debottleneck at the Lloyd Upgrader;
• with respect to the Company's heavy oil and thermal developments in the Integrated Corridor: estimated production capacity and expected timing of start-up at the Spruce Lake Central, Spruce
Lake North and Spruce Lake East thermal bitumen projects; planned pacing of construction of new thermal developments; project break-evens for Lloyd thermals; expected 2019 exit production
rate; and capacity to be added by 2022;
• with respect to the Company's Offshore business in the Atlantic region: estimated production for 2019 to 2026; expected timing of tow out, installation and first oil at the West White Rose
Project; strategic plans and growth strategy for the Atlantic region; and expected benefits of the West White Rose Project once it is onstream; and
• with respect to the Company's Offshore business in the Asia Pacific region: estimated production from 2019 to 2026; estimated production capacity and expected timing of start-up at Liuhua
29-1; and strategy plans and growth strategy for the Asia Pacific region.
Certain of the information in this presentation is “financial outlook” within the meaning of applicable securities laws. The purpose of this financial outlook is to provide readers with disclosure
regarding the Company’s reasonable expectations as to the anticipated results of its proposed business activities. Readers are cautioned that this financial outlook may not be appropriate for
other purposes.
Husky Energy Inc. 18
Advisories
Although the Company believes that the expectations reflected by the forward-looking statements presented in this presentation are reasonable, the Company’s forward-looking statements have
been based on assumptions and factors concerning future events that may prove to be inaccurate. Those assumptions and factors are based on information currently available to the Company
about itself and the businesses in which it operates. Information used in developing forward-looking statements has been acquired from various sources including third party consultants, suppliers,
regulators and other sources.
Because actual results or outcomes could differ materially from those expressed in any forward-looking statements, investors should not place undue reliance on any such forward-looking
statements. By their nature, forward-looking statements involve numerous assumptions, inherent risks and uncertainties, both general and specific, which contribute to the possibility that the
predicted outcomes will not occur. Some of these risks, uncertainties and other factors are similar to those faced by other oil and gas companies and some are unique to Husky.
The Company’s Annual Information Form for the year ended December 31, 2018 and other documents filed with securities regulatory authorities (accessible through the SEDAR website
www.sedar.com and the EDGAR website www.sec.gov) describe risks, material assumptions and other factors that could influence actual results and are incorporated herein by reference.
New factors emerge from time to time and it is not possible for management to predict all of such factors and to assess in advance the impact of each such factor on the Company’s business or
the extent to which any factor, or combination of factors, may cause actual results to differ materially from those contained in any forward-looking statement. The impact of any one factor on a
particular forward-looking statement is not determinable with certainty as such factors are dependent upon other factors, and the Company's course of action would depend upon management’s
assessment of the future considering all information available to it at the relevant time. Any forward-looking statement speaks only as of the date on which such statement is made and, except as
required by applicable securities laws, the Company undertakes no obligation to update any forward-looking statement to reflect events or circumstances after the date on which such statement is
made or to reflect the occurrence of unanticipated events.
Non-GAAP Measures
This presentation contains certain terms which do not have any standardized meanings prescribed by IFRS and are therefore unlikely to be comparable to similar measures presented by other
issuers. None of these measures is used to enhance the Company's reported financial performance or position. With the exception of funds from operations and free cash flow, there are no
comparable measures to these non-GAAP measures in accordance with IFRS. The following non-GAAP measures are considered to be useful as complementary measures in assessing Husky's
financial performance, efficiency and liquidity:
• “Netback” is a common non-GAAP measure used in the oil and gas industry. This measure assists management and investors to evaluate the specific operating performance by product at the
oil and gas lease level. Netback is calculated as realized price less royalties, operating costs and transportation costs on a per unit basis.
• “Gross margin” is a non-GAAP measure that is calculated as revenue net royalties less purchases of crude oil and product. This measure assists the Company’s investors to evaluate the
operating performance of the Integrated Corridor.
Husky Energy Inc. 19
Advisories
• “Cash flow break-even” reflects the estimated WTI oil price per barrel priced in US dollars required to generate funds flow from operations equal to the Company’s sustaining capital
requirements and dividends paid to common shareholders in Canadian dollars over a 12-month period ending December 31. This assumption is based on holding several variables constant
throughout the period, including: foreign exchange rate, light-heavy oil differentials, realized refining margins, forecast utilization of downstream facilities, estimated production levels, and other
factors consistent with normal oil and gas company operations. Cash flow break-even is used to assess the impact of changes in WTI oil prices on the net earnings of the Company and could
impact future investment decisions.
• “Free cash flow” or “FCF” is a non-GAAP measure which should not be considered an alternative to, or more meaningful than, cash flow – operating activities as determined in accordance with
IFRS, as an indicator of financial performance. FCF is presented to assist management and investors in analyzing operating performance by the business in the stated period. FCF equals funds
from operations less capital expenditures.
• “Funds from operations” or “FFO” is a non-GAAP measure which should not be considered an alternative to, or more meaningful than, “cash flow – operating activities” as determined in
accordance with IFRS, as an indicator of financial performance. FFO is presented to assist management and investors in analyzing operating performance of the Company in the stated period.
FFO equals cash flow – operating activities plus change in non-cash working capital.
• “Sustaining capital” is a non-GAAP measure that represents the capital that is required by the business to maintain production and operations at existing levels. This includes the cost to drill,
complete, equip and tie-in wells to existing infrastructure and maintenance for Downstream assets. Sustaining capital does not have any standardized meaning and therefore should not be used
to make comparisons to similar measures presented by other issuers.
• “Growth capital” is a non-GAAP measure that represents expenditures which incrementally increase cash flow or earnings potential of assets, expand the capacity of current operations or
significantly extend the life of existing assets. This measure is used by the investment community to assess the extent of discretionary capital spending. For clarity, growth capital is equal to total
capital less sustaining capital.
All currency is expressed in Canadian dollars unless otherwise directed.
Disclosure of Oil and Gas Information
Unless otherwise indicated: (i) projected and historical production volumes provided are gross, which represents the total or the Company’s working interest share, as applicable, before deduction
of royalties; (ii) all Husky working interest production volumes quoted are before deduction of royalties; and (iii) historical production volumes provided are for the year ended December 31, 2018.
The Company uses the term “barrels of oil equivalent” (or “boe”), which is consistent with other oil and gas companies’ disclosures, and is calculated on an energy equivalence basis applicable at
the burner tip whereby one barrel of crude oil is equivalent to six thousand cubic feet of natural gas. The term boe is used to express the sum of the total company products in one unit that can be
used for comparisons. Readers are cautioned that the term boe may be misleading, particularly if used in isolation. This measure is used for consistency with other oil and gas companies and
does not represent value equivalency at the wellhead.