Peter C. Muller SELECTE - apps.dtic.mil · nut ism a lmuimm powderliqud oxygen woch vexipmarin a...
87
AD-A284 182 (17I! ARMY RESE.ARCH LAORATORY • Rebuilding and Modeling of a Thennal Radiation Source Richard B. Loucks Peter C. Muller Richard L. Thane ARL-TR-501 August 1994 DTIC SELECTE SEP 0 8 1994 F 4 ,•'P\94- 29052 9L9IC Q uz 3 94906C 142
Transcript of Peter C. Muller SELECTE - apps.dtic.mil · nut ism a lmuimm powderliqud oxygen woch vexipmarin a...

AD-A284 182 (17I!
ARMY RESE.ARCH LAORATORY •
Rebuilding and Modeling ofa Thennal Radiation Source
Richard B. LoucksPeter C. Muller
Richard L. Thane
ARL-TR-501 August 1994
DTICSELECTESEP 0 8 1994
F
4
,•'P\94- 29052
9L9IC Q uz 3
94906C 142

Best,AvailIable
Copy

NOTICES
Destroy Otis report when it is no longer needed. DO NOT return it to the originator.
Additional copies of ti6s report may be obtained from the National Technical InformationService. U.S. Department of Commerce, 5285 Port Royal Road, Springfield, VA 22161.
The findings of this report are not to be construed as an official Department of the Armyposition, unless so designated by other authorized documents.
The use of trade names or manufacturers' names In this report does not constituteindorsement of any commercial product.

REPORT DOCUMENTATION PAGE O o nI#~~6,~l IV Omdnf its Ni sc saof mou WA ,eWMma to Ivag "a Mw prQW0. owwvi~ e -qm 8w" r Waew WWO Iilctlwm merdw 0 "0tm itew tmi
1. ANCY USE ONLY (LeaveW* 2. REPOT OAT[ 3. REPORT Pt AND DAOES COVEREDI M 194 MAL988 - Doeomube IM9
4. TILE AND SUBTITE 5. FUNDING NUMBERS
Rebuilding ud, Modeuing of a Therma Radiation 5mww4"01-405-U2
G. AUTHOR(S)
Riched 13. LAacka Pow C. Muafr. adl Rkchd L Tbmu
7. PERFORMING ORGANIZATION NAME($) AND ADDRESS(ES) 8. PERFORMING ORGANIZATION
U..A yIs bLinx REPORT NUMBER
ATMN AMSLWT~-NCAbenhu Proving 0,osmd MD 21005-S066
t. SPONSORING/ MONITORING AGENCY NAME(S) AND ADDRESS(ES) 10. SPONSORING/ MONITORINGAGENCY REPORT NUMBER
U.S. Amny Rmcum LidwraryAMIN AMSRL-Q-AP4L ARL.-TR-501Aberdme Proving ChourmLd MD 21005-506
11. SUPPLEMENTARY NOTES
120. DISTRIBUTION/AVAILARIUTY STATEMENT 12b. DISTRIBUTION CODE
Approved for public Irleu dowfllmuio is utlimitd.
13. ABSTRACT (Maximum 200 wordr)
UhS ispWr dowIbe 9npWovemi to a U.S. Army Reseaxda LidaM&ry Themal Radiation Sowce (FIS). 7bs WSnut ism a lmuimm powderliqud oxygen woch vexipmarin a twknod combustio chamber to flatten dbe flame and iskftobd to be bot~idW in die ARL 2.44.. sbock Wkb. he combinaton of a IM wi"i a aback tube will proide theAmy a hfacty for modelin a luge faclty, conductng bblasheua ynmergim ewxprmena Bad wafti maclee1W~vivabilhs of m&tiy eqpapmneMg componcef. sad mamereuil Mfodifiaton made to the origina US uckudadinamaaishn ofia -w divas valve chuop ms doe ahunmism tink presrimaio and aention symem, sot pnaeumatic actmru.Thus ch4ies1i1tficautly tulud doe radiion Levl and st~abiy. A cnijor opertomul chang wa compow cttowl overthe iRS 9equenCO Oimer 210d dugn aquistio syslm. Part of doe 7RS have bees mathmatically modeled. Methds 10c I clz p th tadtion ouiput we dimcribed.
DTIC QEJAUT iNSPLICTED 3
14. SUWECT TERMS 15. NUMBER OF PAGES
mache euwimou unmum "Ohon &mI radiation heAt Bransfer. heat condutvity, thernal 7--wvy =wday 16. PRICE CODE
17. SECURITY CLASSIFICATION 1B. SECURITY CLASSIFICATION 19. SECURITY CLASSIFICATION 20. LIMITATION OF ABSTRACTOF REPORT OF T"IlS PAGE Of ABSTRACT
UNCLASSIIE I NCLASSIFIE I INCAssIFI SARISN ?540-01 -280-5500 Standard Form 298 (Rev 2-89)
249-102

IntentkoaaIy kcit blank

ACKNOWLEDGMENTS
71e author wishes to express his gratitude for the advice and work of Dr. John Polk at the U. S. Army
PResmrch Laboratory (ARL). He was essential in correcting the calorimetric data. Appendix C contains his
contribution. Another contributor is Dr. Pat Kingrman of ARL who provided extensive micrographs and analysis of
the aluminum powder, and her work is in Appendix D. The author also appreciates the technical review of Mr.
John Sullivan, whose efforts were not only beneficial to the paper, but an education for the author.
Acce,-ion For
NTIS CRA&JDTIC TAB
UUnaanoou cedJustificit:o; ........... .
By .................................
Distribution I
Availability Codes
Avail a~idl orDist Special
iii

Inftntionally Left Blank
iv

TA3LE OF CONTENTS
A C (N O W LEDGM EN TS ........................................................................................................ iii
LIST OF FIGURES .................................................................................................................. vii
i. INTRODU CTION .................................................................................................................... 1
2. ORIGINAL THERMAL RADIATION SOURCE ..................................................................... 2
2.1 A lum inum Powder and LOX System .............................................................................. 32.1.1 -The Alum inum Powder ...................................................................................... 52.1.2 LOX ............................................................................................................ 62.2 D ivert Valve .................................................................................................................... G
3. MODIFICATIONS AND UPGRADES ................................................................................ 7
3.1 Com bustion Cham ber ...................................................................................................... 83.2 New D ivert Valve ........................................................................................................ 113.3 Control and Instrum entation ....................................................................................... 123.4 W asteRecoveryBin ................................................................................................... 133.5 TRS Control M odification ......................................................................................... 143.6 aon ............................................................................................................... 153.6.1 Calorim eters ...................................................................................................... 153.6.2 Data Recording. ................................................................................................. 183.7 Alum inum Tank Pressure and Fluidization ................................................................. 193.8 Cha acte ization M ethods .......................................................................................... 223.8.1 Full W idth M ethod ..................................................................................... 223.8.2 Full Width at Half Maximum Method ........................................................... 233.8.3 M om ents M atching M ethod ......................................................................... 243.8.4 Fourier Averaging M ethod. ........................................................................... 243.9 TRS Analysis Program . .............................................................................................. 25
4. SAFETY .................................................................................................................................. 27
4.1 Personnel Im pact. ..................................................................................................... 274.2 Environm ental Im pact .............................................................................................. 274.3 Fire H azards .................................................................................................................... 28
S. SUM M ARY ............................................................................................................................. 29
6. REFERENCES ......................................................................................................................... 30
APPENDIX A: TRS OPERATION CHECKLIST AND EXPERIMENT SHEET ................. 31
APPENDIX B: METHOD FPR CORRECTING CALORIMETRIC DATA ......................... 43
APPENDIX C: PROCESS OF SIMULATION OF DRIVERJAERATION MODEL ............. 47
APPENDIX D: MICROGRAPH DATA OF ALUMINUM POWDER ................................. 59
D ISTRIBUTION LIST ........................................................................................................ 65
v

Intentionally left blank
vi

LIST OF FIGURES
1. Nuclear thermal pulse profile, relative scale ............................................................. 1
2. Three-nozzle T ..................................................................................................... 33. Aluminum powder in venturi mixing chamber ......................................................... 4
4. Grade 120 aluminum powder heterogeneous region at SOOX ................................... 5
5. Plunger divert valve ................................................................................................. 7
6. Mixing chamber and LOX/aluminum mixing. .......................................................... 8
7. Contour plot of thermal mapping of TRS, 100 cm from TRS center .................... 8
8. TI S output with clean combustion chamber ........................................................ 10
9. TRS output during 2nd and 3rd t ................................................................ 10
10. TRS output during 4th and 5th events ................................................................. 10
11. Tiee-portba vave ratio ........................................................................ .11
12. TIM flux record with three-poit ball valve ........................................................... 11
13. Improved waste recovery bin .............................................................................. 13
14. TRS controller and PC ........................................................................................ 14
15. Gardon-type gauge for flux measurement ........................................................... 15
16. ARL calorimeter calibration technology .............................................................. 16
17. Flux istowy corrected for slow response time of sensor ........................................ 16
18. Calorimeter response experiment shutter setup ................................................... 17
19. Response experiment data ................................................................................... 17
20. Controller and MEGADAC ................................................................................ 19
21. Modification of fluidizer/driver system ............................................................. 20
22. TRS flux record after modification of aeration/driver system ............................... 21
23. TRS flux record after modification of aluminum powder transport line ................ 22
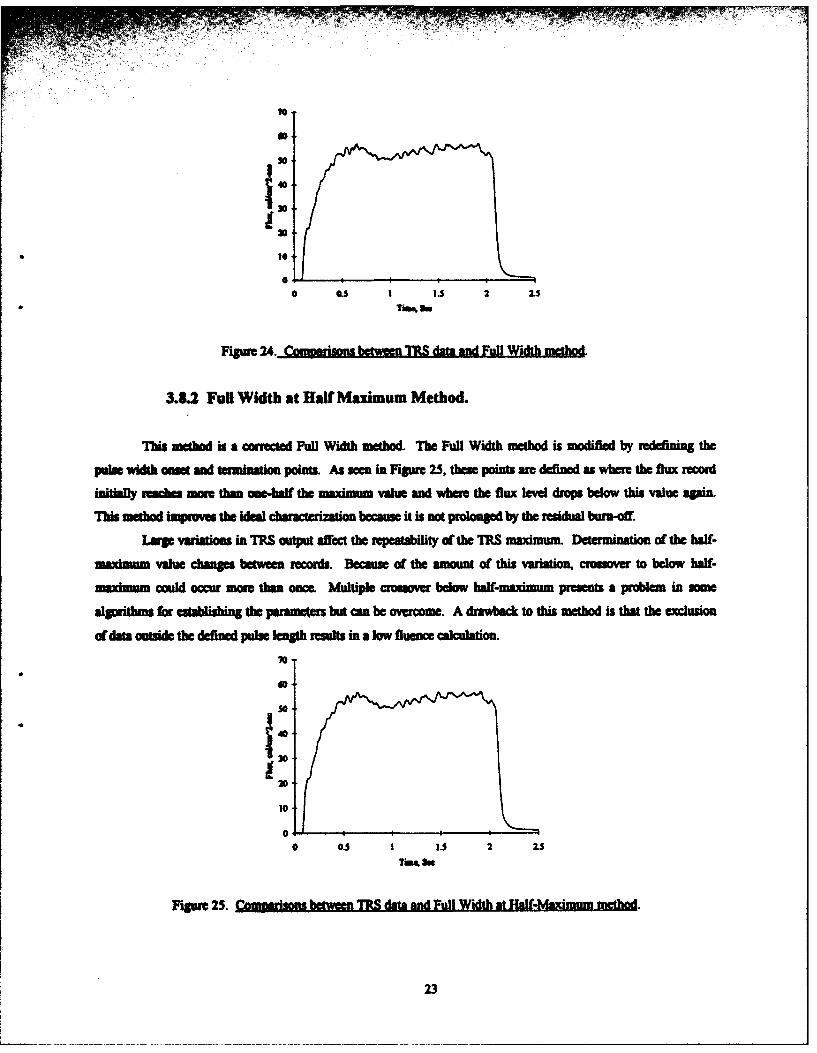
24. Comparisons between TRS data and Full Width method. .................................... 23
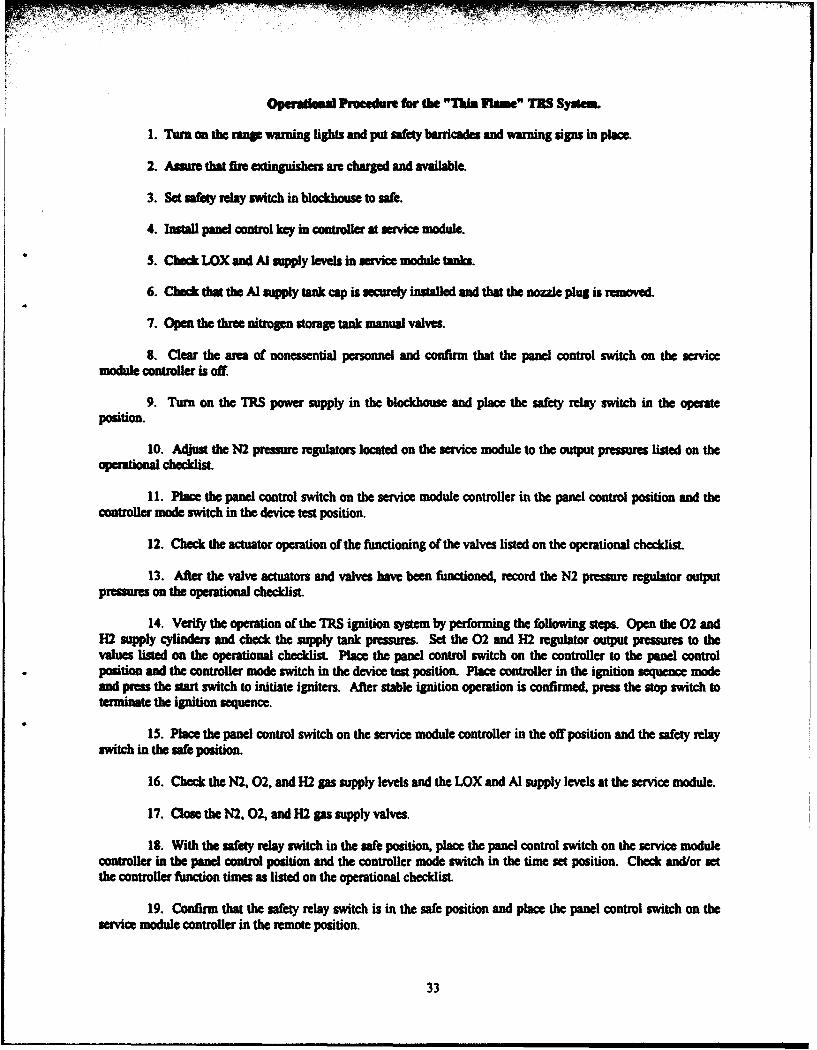
25. Comparisons between TRS data and Full Width at Hl-ff-Maximum method ........ 23
26. DANTE analysis sheet infonnation ...................................................................... 26
27. TRS facility layout .............................................................................................. 28
C-I. Aluminum containment vessel ........................................................................... 49
C-2. "Descending disk" configuration ....................................................................... 52
C-3. Control volume during At ................................................................................... 4
D-I. Grade 120 aluminum powder mount at 25X ......................................................... 62
D-2. Aluminum powder heterogeneous region at 1000X .................... 62
D-3. Aluminum powder fine region at 100X .............................................................. 63
D-4. Aluminum powder fine region at 50X ................................................................ 63
vii

D-5. Aluminum powder fin region at IOOOX ............................................ . 4
D-6. Aluminum powder fine region at 150OX .................................................................. 64
viii

1. INTRODUCTION
With the ban of aboveground nuclear testin& it has been impossible to accomplish performance testing on
military equipment in a nuclear environment. Within the past 30 yr, several nuclear simulators have been
constructed to accomplish this testing. Recently, technology has made feasible the construction of a simulator of
nuclear air blast and thermal loading called the Large Blast/Thermal Simulator (LBaTS).
To support the design of this facility, the Blast/Thermal Effects Branch of the U.S. Army Research
Laboratory (ARL) has been working with an aluminum powder/liquid oxygen Thermal Radiation Source (TRS)
system. Once it was optimized, the TRS unit was to be installed in the ARL 2.44-m shock tube. In this fashion,
problems arising with the LB/TS could be studied on a smaller, less expensive scale.
The current TRS incorporates numerous modifications from its original state. It uses aluminum powder
reacting with liquid oxygen (LOX) in a combustion chamber to create a large fan-like flame. The flame acts as a
large thermally radiant wall, which simulates the nuclear thermal radiation pulse delivered to a target. The flame
is so shaped to give a more uniform radiating area in the confined area of the shock tube.
In the original TRS, the thermal output of the flame oscillated with large amplitude relative to the mean
yield. It was speculated that a fluctuating mass flow rate of aluminum powder in the system caused the unstable
output. There was no control over the thermal output relative with time except for initiation and termination of the
source. The rise and fall rate of thermal output was slow and inconsistent. All of these factors led to poor
prediction of the output, rendering the TRS an ineffective simulator.
An attempt was made to control the thermal output to match a true nuclear thermal pulse. A true nuclear
thermal pulse has a rapid rise with a slower tail-offW as shown in Figure 1. Control of the TRS output was tried
with a computer-controlled aluminum divert valve. The effort failed due to aluminum powder clogging the
moving parts of the valve and slowing or stopping the motion.
tO
J'Ii'
' a3 4 3 6 7 a0
Figure 1. Nuclear thermal pulse profile. relative scale.

Modifications were made to the original TRS unit to improve its performance. The modifications
included: changing the divert valve to a three-port ball valve, adding a custom-built combustion chamber,
improving LOX and aluminum mixing, and making changes to the pneumatic and transport process. The
combustion chamber improved the LOX/aluminum mixing as well as spreading the flame over -, greater area. The
divert valve operation was changed to produce a "rectangular" thermal pulse. The ball valve was selected to divert
aluminum to and from the combustion chamber for faster rise and fall times on the flux record. There still existed
a large fluctuation in the thermal output.
An engineering model of the aluminum powder pressure vessel was constructed in the hope that it would
show the cause of the large thermal fluctuations. The actual output of the model was mass flow rate of aluminum
from the exit given the inlet gas pressures. The model did reveal the source of mass flow fluctuations was not
directly due to the existing pneumatic setup. The fluctuations were shown when assumed to be caused by forces
outside the pressure vessl. Once the outside disturbance was eliminated, the model demonstrated a low transient
flow rate of aluminum powder. The results were applied to the TRS, and the thermal output was stabilized.
Modifying the system delivering aluminum to the nozzle created smoother and higher flux records. These
changes significantly improved the system's output and performance. These technology upgrades could also be
applied to the TRS system designated for the LB/TS to assure favorable operation.
2. ORIGINAL THERMAL RADIATION SOURCE
In 1976, the branch (then the Blast Dynamics Branch of the Ballistic Rescarc), Laboratory) purchased an
aluminum powder/liquid oxygen TRS. This unit, along with a set of three combustion products ejectors, was to be
integrated into the ARL 2.44-m shock tube. For evaluation, both systems were installed in a 2.44-m pipe section.
The TRS unit was composed of two puts, the module or "fuel skid," and the three nozzles, as shown in
Figure 2. The module contained the pressure vessels that held the aluminum powder and LOX. It stored the high
pressure nitrogen used to operate the TRS. It contained all regulators and pressure gauges and was also the
electrical junction for the valve actuators. The nozzles were a separate body placed 10 m from the module. At the
nozzles, aluminum powder and LOX were mixed and ejected into the air vertically. The nozzle exit was a small
steel combustion chamber lined with 3 cm of graphite. A propane/oxygen cross flame covered the nozzle exit into
the chamber and ignited the passing aluminum/LOX mixture.
2

Divert Valve
Nozzle Purge
Aluminum Powder
Figure 2. Thiee-nozzlT
The TRS failed on its first trial, destroying one of the nozzles. The problem encountered with the three-
nozzle unit was a faulty seal between the ignition ports and the combustion chamber. The seal failure allowed
hydrogen and oxygen gas to jet out the side of the nozzle. The ignited flame acted as a blow torch, melting many
of the middle nozzle components. The process of the degrading nozzle and the continued combustion of aluminum
powder and LOX caused the complete di" -uction of the middle nozzle and the right nozzle. The left nozzle was
left without damage, later to be salvaged into an improved TRS unit. This event severely hampered the TRS
program at ARL. Aluminum/oxygen TRS work was considered to be difficult to control and unsafe.
2.1 Aluminum Powder and LOX System.
The aluminum powder and oxygen ar jetted into the air at an initial velocity of about I1 m/s. The
majority of the thermal radiation generated from the aluminumtLOX TRS is from the condensing particles of
aluminum oxide (Rehmann 1983). The ignition flame serves as a catalyst to cause a rapid reaction between the
aluminm powder and oxygen-rich environment The ignition flame melts off a very thin aluminum oxide sheln
which exist on all aluminum particles. The melting temperature for aluminum oxide, 600 K, is much higher than
3

that of puen aluminum. When the aluminum oxide shell is melted, the aluminum is quickly melted and reacts
strongly with the oxygen-rich environment. The reaction itself generates heat and becomes self propagating.
When the reaction is complete, the resulting aluminum oxide is in the vapor phase. Convective heat transfer
causes the aluminum oxide vapor to cool and condense at about 3,000 K. The latent heat released form the phase
change and the resulting radiant heat released from the aluminum oxide molten mist account for the majority of
the heat radiation. Eventually, the molten aluminum oxide radiates enough heat and cools to the solid phase. At
this point, there is little radiant energy coming form the particles, and the heat transfer mechanism is mostly
convective. This process creates a large flame radiating at a high temperature.
In the original TRS, control of the aluminum powder and LOX flow to the nozzles was accomplished with
pressurized nitrogen gas. The aluminum powder tank and LOX tank pressures were ptezsct by their respective
nitrogen regulators. When a ball valve at the bottom of the aluminum powder tank opened, the aluminum powder
was injected into a nitrogen gas high-speed line. A divert valve in the nozzle switched the aluminum flow either to
the waste recovery bin or to the combustion chamber. LOX was driven by pressurized nitrogen gas to the nozzle.
Both LOX and aluminum powder would flow during the entire operation.
The aluminum was contained under pressure in a steel cylinder that has a two-way ball valve on the
bottom. The bottom part of the valve injected into a Venturi chamber and was mixed with passing high-speed
nitrogen, as depicted in Figure 3. This was where the high-pressure nitrogen expanded at high speed. The static
pressure was less than the pressure in the aluminum tank. When the valve opened, aluminum was forced into the
high-speed line by the nitrogen pressure and aluminum weight. It was entrained with the high-speed nitrogen and
accelerated towards the nozzle.
Aluminum Powder
Ventui Mi Chamer High-Speed
Nitrogen
Figure 3. Aluminum powder in venturi mixing chamber.
The aluminum powder and LOX were transported 10 m to the nozzle. The LOX would flow directly to a
mixing chamber and out the combustion chamber. When the divert valve changed the aluminum flow from the
waste recovery bin, alumnum met LOX in the mixing chamber. The mixture was ejected into the combustion
chamber past the propane/oxygen cross flame. The valves were operated by gas driven actuators that responded to
4

a 24-V signal form a sequence timer. The voltage would energize the slenoid that would open a gas valve within
the ptuator piston chamber. The gas would displace the piston, mechanically moving the valve by a rack and
I•- linkage.
2.1.1 The Aluminum Powder.
The aluminum powder used at ARL is Reynolds Aluminum grade 120. As seen in Figure 4. the particles
range in size from less than 1 pm to 100 I=n. The average particle size is about 18 orm, using the Fisher method
(Reynolds Aluminum 1990). The particles are not spherical due to the manufacturing process. A spherical grade
can be used, but this granular form is probably msperor due to the increased surface-o-volume ratio for reaction.
Figure 4. Grade 120 aluminum nowder heteroeneous remon at 50OX.
To assess the average particle size, several micrographs using a scanning electron microscope were taken
at different magnifications. In evaluating the micrographs, no quantitative conclusion could be drawn as to the
size distribution. The sample drawn from the lot could be made to vary, since the distribution of powder within the
lot was not homogeneous. Futrthermore, the method of removing a small sample could bias the final distribution.
In addition, the sample handling method strongly influenced the particle distribution in the final amount. The
micrographs did provide an undemanding of the range in particle sizes. For more details, refer to Appendix D.
The Reynolds Aluminum grade 120 is the only type of aluminum powder currently used at ARL. In
September 1989, the same grade was used by Science Applications International Corporation (SAIW) when

performing the acceptance tests on a four-nozzle TRS called "SATAN" for the Centre d'Etudes de Gramat (CEG)
in Gramat, France. The test, performed at SAIC Laguna Test Site, New Mexico, yielded acceptable results. When
the TRS system was reassembled in Gramat, France, the output of the TRS was obviously different (Mergnat
1990). Without immediate access to Reynolds Aluminum grade 120, the CEG used a local supplier of aluminum
powder. Based on what SAIC had specified for aluminum size, the CEG purchased aluminum powder with an
average particle size of 20 t^n. Apparently, the European supplied aluminum powder had a much tighter
distribution of particle size. The thermal output of SATAN was much lower than expected, with the flux level
i a with time.
The CEG changed the aluminum to a much larger particle size, 80 tpm. The effect was the complete
opposite, with a high initial flux but decreasing with time. The members at CEG combined equal amounts of the
two grades and were able to achieve the same results at the SAIC Laguna Test Site. Since it is evident that the
grade of aluminum will affect the thermal output, Reynolds grade 120 was selected as the control fuel for TRS
experiments.
2.1.2 LOX.
The LOX was pressurized in an insulated container with nitrogen gas to drive it through the nozzle
piping. The 50-gal LOX tank was insulated to maintain the cryogenic temperiatures necessary and inimi
losses. Initially, the LOX flow was started as soon as the sequence count began. The lead time let the flow cool
the nozzle plumbing& thereby minimizing LOX evaporation during the event. When the LOX arrived at the three
nozzles, it evaporated while mixing with the aluminum particles. The oxygen-rich mixture was ejected past the
propaneloxygen flame and began burning within the combustion chamber.
2.2 Divert Valve.
A divert valve in line with each nozzle controlled the direction of aluminum flow. The aluminum would
flow either to the waste recovery bin or to the nozzle. At the start of TRS operation, the aluminum powder flowed
to the waste recovery bin for a few seconds, then would divert into the nozzle, then back to the waste recovery bin.
The divert valve, depicted in Figure 5, was a dual-plunger assembly. The aluminum powder would be
transported into the chamber where a nylon wedge would divert the flow of aluminum to the open exit port facing
the vertical. Depending on which plunger was up or down determined which path the aluminum would take. The
plungers were actuated by a computer-controlled stepper motor. The stepper motor was used to try to control the
aluminum mass flow such that the TRS would simulate the flux history of a nuclear event as shown before in
Figure 1.
6
FM (now Ill 1000
Figure 5 PluniM divetalv
This valve design• was the primary cause of• theIR failure. As aluminum powder entered into the valve~,
many of the moving parts were impeded by the aluminum dust. The valve of one nozzle stopped functioning in the
middle of a test, leaving the aluminum and LOX mixture to flow and burn w~ithout control. The steel and graphite
combustion chamber eventually melted, damaging several component,' of the nozzle. Alumirum slag from the
unrestrie burn contributed to the damage of the nozzle. The actuators, nitrogen gas lines,, divert valve, and thestrctur framework were damaged beyond salvage.
3. MODIFICATIONS AND UPGRADES
To improve the simulator, ARL personnel generated a set of objectives for an improved TRS. The needfor the TRS to reprodce the nuclear thermal pulse of Figure 1 was relaxed. A nulear event radiates at an
equivalent black body temperature of about 6,000 K, where the combustion products of the IRS radiate at about3,000 K. Since the color spectim was incorrect, there was no need to emulate the time profile ofa true nuclear
thermal pulse. An easily controlled trectangular thermal pulse was chosen for the TRS, matching the total
radiant energy, or fluev e, on the target. For maximum control, the new .IS would emit at its peak rate of
ctheral output within 100 e s fulm initiation. The flux, or tmhoer radiant intensity, would not vay by a standard
deviation greater than 10% of the average output. The output was to be teniinated within 100 d s after a des red
flsunce was achieved. The source was to be integrated with the 2.44-. shock tube, which has mince been reamed
the ipm prbive tube.w Operation of the TRs was to be safe and repeatable.
The TRS program was continued with the least damaged of the remaining ARS nozzles and the module.
A single unit would be simpler to study than three at once. It would be modified, upgraded. and tested. Onemodification would be to change the combustion chamber to spread the flame. If the reshaped flame emitted
moinly in nce diretion, it would give the same cover of uniform irradiaece as three tiRS nozzles
thrml use A eslycotoled'rcanulr teralpls wschse frth TS mtcin het7a

3.1 Combustion Chamber.
Three combustion chambers were used in the original three-nozzle TRS. The resulting TRS tent
demonssrated the evscuator were WmcPable Of removiDg All the combustion products in time for a blast teat Asingl TRS uMi would reduce the combustion products to be handled. In contrast, one of the orgnalu combustion
cham~bes woii, be too small to gwewate a uniform thernal field within the 2.44-rn probative tub~e. A large
combustion, chamber that would -pea the flame across the shock ofbe crost section was hMricated and instilled.
The now combustion chamber mixed the LOX and alumnumu powder differently than the orignal. The
original method was to fill an outer sleeve with LOX and mix it with the aluminum =s it passed by, as sewn in
Figure 6. The mixture would enate the combustion chamber, ignite, and jet upward. The LOX sleve was not a
vood design since the aluminum. would sometimes enter the sleeve and would burn afte the event was over.
Burning in the sleev was part of the reason the original TRS was damaged.
Figure 6. Mixiag chamber and LOX/alumium mixvi~n
Figure 7. Contour gnit of themM al iDSDI of TRS, 100 cmu frmM MU center.
B
Tie new method of mixing injected the LOX into the aluminum powder stream at an upward angle. To
aid in the mixing and to prevent aluminum from entering the chamber, a nozzle purge system was insalled.
Nitrogen gas at high pressure was introduced into the aluminum powder flow, just before the aluminum mixed
with the LOX. When the aluminum stopped flowing, the nitrogen would purge the area of any residual particles
out into the chamber. The purge nitrogen helped propel the LOX-aluminum mixture through the igniters. It also
prvented any molten residue from flowing back into the high-speed line.
The propanceoxygen ignition cross flame was replaced with a hydrogen/oxygen ignition system. The
hydrogen and oxygen mixed in a small chamber, then ignited by an automotive spark plug. The flame was injected
ito the combustion chamber. The spark plug ignition method proved to be much more reliable than the furnace
spark rods, and the hydmgen/oxygen burned hotter than the propane/oxygen ignition system.
The resulting flunce of the combustion chamber is shown in Figure 7. This thermal mapping shows a
flaw in the combustion chamber output The plane area of iradiation at I m from the nozzle center is not very
uniform. There is a distinct high gradient flux region at the center lower part Fortunately, the size of the targets
in the probative tube are limited due to blockage effects. The typical target to be tested will be small with respect
to this region, and will be affected in a fairly uniform manner. The small circles show Ie location of the
calorimeters used during the test.
The resulting isotherm contours in Figure 7 were generated by using a matrix of fitted third-order
polynomials and using a French curve to connect the grid intersections. A polynomial was fitted to the top three
horizontal calorimeter values, corresponding to a line running through the calorimeter centers. Percent values in
increments of ten, of the maximum calorimeter reading, were indicated along the curve. This procedure was
repeated vertically, horizontally, and diagonally for all lines connecting three calorimetef. The resulting overap
of decade values were never apart by more than 5 cm, mostly no more than 2 cm. The result was a group of points
representing the polynomial estimate of decade percentile values. A French curve was used to smoothly connect
the isotherm points. The resultant contours yield an estimate of the energy distribution within the shock tube area.
The largest drawback of the combustion chamber is the accumulation of slag on the walls of the
combustion chamber aftr each test. If the slag is not cleaned off after each test, the buildup of material will
interfere with the flame, causing higher transient, less predictable output Figures 8, 9, and 10 show in sequence
the deterioratim of TRS output with an unclean combustion chamber.
9

45C4
30,15
010 0.5 1 1.5 2 2.5 3 3.5
Figure 8. TRS OWmwth clean ombuw lmdm
40 40
y 30 ,f 30
20. 20II9: 10o 10"
0. 0.0 0.5 1 1.5 2 2.5 3 3.5 0 0.5 1 1.5 2 2.5 3 3.5
Tim, s Time, s
Figure 9. MRS ontut durim f 2nd and 3rd evnnt
40 40
30 y 30.
20 2010 lo
0 00 0.5 1 1.5 2 2.3 3 3.5 0 0.5 1 1.5 2 2.5 3 3.5
Tme, s Time, s
Figurm 10. ThS outut durin 4th and 5Mh eves.
10

3.2 New Divert Valve.
A three-port, bronze ball v!dve was selected for the modification of one of the remaining nozzles. Th
initial flow of aluminum would be turned at 900 in the ball valve and transported to a waste recovery bun At the
desired moment, the banl valve would turn 900, diverting the aluminum flow into the combustion chamber. After a
g time, the ball valve would be turned back to its original position, cutting off the TRS flame and allowing
auminum to flow back into the catch benn. This sequene is shown in Figure 11.
usu
No Rotation 45 Rotation 90 Rotation
Figure 11. Three-aort ball valve operation.
The dt-port ball valve was installed in the retained nozzle, just behind the larger combustion chamber.
A pipe with constant circular cross section in the 900 bend was added to smooth the flow of aluminum from a
horizontal direction to the vertical direction. The trial test produced a thermal pulse of moderate rise time but
sharp fall time, aseea in Figure 12. This result was progress toward the objective of a rectangular pulse. The
high amplitude fluctuations are discussed in section 3.7.
* 35
30
te4 25
10
00 0.5 1 1.5 2 2.5
Time, s
Figure 12. TRS flux record with three-nort ball valve.
11
Residual aluminum powder not eliminated by post-test cleaning reacts over a period of time with the
moisture in the atmosphere. The result is an extremely stiff, thick aluminum oxide buildup. The original divert
valve was ruined by the effects of aluminum oxide buildup. There was concern that an oxide coating on the ball
valve's moving parts would impede the rotation motion.
The valve was spot checked after each test. The ball valve actuator was tested with increments of pressure
to determine the minimum pressure necessary to turn the ball. It was expected that as more TRS events occiurrd,
aluminum oxide would build up, and the mininum actuator pressure would need to increase. However, after
twenty events, there was no change in resistance; after forty events, the resistance was reduced.
The valve was disassembled for inspection and lubrication. The interior showed little residual aluminum
powder. Most was captured by the valve lubricant. The ball surface showed little to no abrasion. The white nylon
seals had turned gray in areas and actually reflected as polished aluminum in spots. It was concluded that the bail
valve was working properly.
The apparent absence of aluminum was explained by the nature of how the valve operated. As the ball
rotated, the nylon seals would clean the ball. The imperfections of the seals were filled with aluminum powder and
were eventually compacted and polished with each event. As each event occurred, the ball experienced slight
wear, accounting for the slight decrease in rotation resistance.
The basic advantage of the ball valve over the plunger valve system was that the ball valve had fewer
moving pans. In the abrasive environment of aluminum powder and the possibility of buildup areas, decreasing
the number of active parts was essential. A further advantage was that the ball valve had no spaces where
aluminum could accumulate.
3.3 Control and Instrumentation.
One of the problems with the three-nozzle TRS was the lack of active control when the system was
running. A programmed sequence timer took over operation after the TRS was started. It would run the entire
event by energizing solenoids which in turn opened and closed pressure-actuated valves. With the uncertainty of
the TRS operation, at least an abort mode needed to be added.
The TRS required improvements in the control and instrumentation. The primary sensor for the TRS
flame was the Gardon-type flux sensor. The gauge output was recorded on an instrumentation quality tape
recorder. The data from the tape would later be digitized on an analog-to-digital converter and processed on a
computer to give fluence and an ink plot flux histoty. The data were stored in ASCII format on a data cartridge.
Becmm the recording system was off-line and did no automatic processing, results and analysis were slow in
12

3.4 Waste Recovery Bin.
The onginal waste recovery bin was designed to contain the diverted aluminum from three nozzles. Thebin was designed to hold 60 kg of aluminum. The bin was simply a 55-gal drum with a modified lid. The lid was
constructed with one entry port for the diverted aluminum and three 2.5-in pipes welded to the lid that ran
vertically in the center of the barrel. The pipes were about 4 in from the bottom of the barrel and were about 2 in
above the barrel lid. The "lips" of the pipes were used to attach commercial grade vacuum cleaner bags.
This system was etremely difficult to handle. Cleaning the barrel was difficult sincm the top had to be
lifted with a hoist and the aluminum scooped out with a shovel. The pipes would get clogged with aluminum and
retard flow through the bin. The obstruction caused the preflow of aluminum to be slow, sometimes causing slow
rise times in thermal output.
The bin was improved by replacing the 55-gal drum with a smaller 10-gal container, as shown in Figure
13. The lid was changed to accept the aluminum divert and had one filtered exit port without any pipes. The
incoming powder was directed against the wall and downward by a small sheet of aluminum just inside the
entrance port. The filter was nothing more than a cloth rag stretched over the exit opening. This method is easier
to handle, mainly because one man can lift the can with aluminum in it after each shot The aluminum powder
can be dumped back into the aluminum powder container at the TRS or be dumped back into the aluminum can for
storage.
N2Heavy Fiow (2 kh)
Mihi Cidd Baab
Figure 13. Imuroved Wase recovery bin.
13

3.5 TRS Control Modification.
The sequence timer ws replaced by a computer programmable controller. Initially, from a nearby station,
a personal computer (PC) transmitted a basic time table to the on-site controller, as depicted in Figure 14. During
the sequence run, the computer and controller would communicate. If certain key functions failed to occur, the
controller would alert the computer and the operator, and either one could abort the run.
Noo n* To
P~ eeX..... LisTo Now&
Unsw Cad (ncy
Timn T"I
Figure 14. TRS controller and PC.
This new system allowed the experimenter to change the valve operation sequence and times with little
effort Its ease of programming and flexibility helped troubleshoot some major problems and helped eliminate
misfre. For instance, improperly operating valves or actuators could be revealed by the controller feedback. Safe
manutal operation from the controller at the module could identify a problem component needing replacement
The control system was instrumental in helping generate an operation checklist as detailed in Appendix
A. With the reliability of the TRS control system improved, a standing operating procedure (SOP) for each TRS
experiment was established. The SOP created a funidamental continuity of experimental procedure that was
missing in past experiments.
The controller is made up of four integrated circuit cards - a power card, a CPU card, an analog card,
and a transistor card. The power card distributes electrical power to the controller components. The CPU card
exchanges data with the personal computer, reads the time tables from memory, and controls the TRS. The
transistor card is the memory that holds the time table and the valve operation sequence. The analog card converts
the digital CPU controller output into current for the proper actuator relays. The TRS controller is easy to repair.
T1he four cards are easily removed and replaced. Controller to PC communication is attained by an RS-232
interface. The PC requires no additional special hardware. The controller is somewhat self-diagnostic. If one of
the feedback sensors fails, the controller will not work and will indicate which sensor failed.
14

3.6 Instrumentation.
The Gardon-type gauge continued to be the principal calorimeter during the TRS testing. This was done
to remove sensor influence and allow direct comparisons of new data to past data The data acquisition system was
modernized with a compact sequential digital recorder that allowed up to 110 channels more than the tape
recorder.
3.6.1 Calorimeters.
The Gardon type gauge is the primary transducer used to measure the flux output of the TRS. As
sketched in Figure 15, the gauge is basically a constantan diaphragm welded to a copper wire and body. This
particular construction generates two thermocouple junctions. The diaphragm acts as the heat transfer sensor
while the main copper body acts as a heat sink.
- hwu cmqbat1
Car-- O-Y -d Copp W-
3eAWM H"g "______* me
NetbViMWp t T,
RM•b in T.muSesO Diffuadal
Dipwancrouea. cammoriug
Figure 15. Gardon-tye maue for flux measurement.
The Gardon-type gauge, or calorimeter, produces a measurable voltage as a difference of temperature is
produced between the two thermocouple junctions. This voltage can be represented as
v. = CC(TD T)
where
Vm is the voltage produced from calorimeter
CTC is a proportionality constant
TD is the diaphragm center temperature
TB is the diaphragm edge temperature.
15

This voltage signal, Vm, is recorded during the TRS event. A calibration constant is multiplied by the
signal data to convert the data into engineering units. The calibration constant for each gauge is supplied by the
manufacturer but is always checked at ARL against a National Bureau of Standards second-generation calibrated
Gardon Gauge. The thermal radiation source for calibration is a graphite element heated by high voltage and
current. The calibration is shown in Figure 16. The units of flux used at ARL are calories per cm2-second,
Caome togerbe =xcargd
Stmd,, Voae Elenmu Cumnwe Vo OU
Figure 16. ARL calorimeter calibration technology.
One of the main concerns about these particular calorimetric data is the response time of the Gardon-type
gauges (Loucks 1993). One manudacturer of this gauge claims an exponential response time of 68.2% within
50 ms. In other -Atds, if the calorimeter experienced a discontinuity, it would respond to the signal as (I-e'S),
where Ct is the time constant and is equivalent to the reciprocal of the response time. If the TRS data traces are
corrected using this number, there is an obvious difference in the flux trace, as seen in Figure 17. Details on this
procedure can be found in Appendix B.
70 7060 60
S50 A¢ 50)
40 u 40
30 30
S20 20
10 100 0
0 1 2 3 0 1 2 3
Time, s Time, s
Original Data Corrected Data
Figure 17. Flux history corrected for slow resuonse time of sensor.
16

The flux history of Figure 17 shows the original measured trace and the flux history with a calculated
correction for slow response time. The response time was determined from an experiment as sketched in
Figure 18. Two calorimeters were placed side by side at the same levation I m from the TRS center. One of the
calorimeters had an aluminum plate covering the face so that all thermal energy from the TRS would be blocked.
The plate was attached by a black thread. The TRS would bum the thread, allowing the aluminum plate to fall
away from the calorimeter face. An approximate calculation shows the shutter time to full exposure to be about
1 ms, which is negligible when considering a response time of about 50 ms. The actual data generated from this
experiment are shown in Figure 19.
10, Black Thrad
Fatting PI&W
Figure 18. Calorimeter res-nse e-xpriment shutter setuM.
70
S60 ShOtter t
so
E 40
30 ,
20.
tot
100 0.5 1 1.5 2
Time, &
Figure 19. ResIonse exueriment data.
17

The two calorimetric data sets were compared using a data analysis program (DSP Development
Corporation 1991). The shuttered set data were divided by the fully exposed set which yielded an exponential rise-
tim curve, Several curves of the response equation (1.-e't) were created to be compared to the rise-time curve.
The best fit of Ct was used to generate the corrected flux profile in Figure 17.
The response time would not affect the fluence dat since the net difference of the measured and corrected
fluencc diminishes with time. The most profound effect is when the TRS output has to fall within specific
performance requirements. If the TRS were to perform as prescribed, the sensor must respond at least five times
faster. The rise and fall times appeared to improve with the correction. The standard deviation (Baumeister,
Avallone, and Baumeister 1978), calculated as
Average: X ,
n
Stndard Deviation:
would result in D well over 10% of the average flux. Further studies of the calorimeter response times need to be
pursued to determine if the TRS would meet the parameters established and be ready to be introduced into the
probative tube.
3.6.2 Data Recording.
The new data acquisition system was a product by OPTIM Electronics, Germantown, MD. It is a
MEGADAC 2200C. This small system was controlled by a PC (the same one communicating with the controller
and the TRS) and could record up to 126 channels of data.
The system operated sequentially, sampling the data from each channel in a stacked fashion. The data
were stored digitally in the MEGADAC 2200C and retrieved by the PC when convenient. Figure 20 shows the
schematic setup of the controller and data acquisition system and the way they were linked together through the
PC.
is

Thm~d SOW ilk CMV"l~I~tpl.6 V"
03 Ro Tim Daft
js T omu om (Mwe
mum TOW"ai
Figure 20. otlrd GD
PC programming of the MEGADAC was accomplished through a custom-written program (Muller 1991).
The program had a libray containing all relevant information for each calorimeter use~d and produced data sets for
each channel specifically tailored for ARL use. The program could be used to generate an "Epeimn Table."
This table would contain all pertinent facts such as experiment date, title, transduce~r type, sensitivity, location,
triglgering level s, sample rate, test duration, and other information. The tables are easily changed and are printed
to maintain a permanent record. The turn around time for test results was reduced significantly. The data are
already in digitized format so any analysi can he immediatel started from the PC.
3.7 Aluminum Tank Pressure and Fluidization.
After the TRS was modified by adding the larger combustion chamber, the ball divert valve,, and the new
control system, TRS testing began. As evident from the TRS records, there was a distinct 6-Hz oscillation in the
output, as seen in Figure 12. The amplitude was modulated to about 75% of the mean output, which was
unacceptable. Preummably, the modulation was caused by a fluctuation in the aluminum powder mass flow rate
from the aluminum tank. This mass flow fluctuation shows up in the thermal output as the oxygen-aluminum
cobsto process shifted between rich and lean mixtures.
The pressure and aeration system for the aluminum tank was suspected to he the cause of the problem.
The system used a single pressure regulator. The regulated nitrogen gas traveled to a T-fltting. One end, with low
volumetric flow, went into the tank to agitate the aluminum powder. This line was called the "fluidizer."
Fluidization was necessay to make the aluminum flow like a liquid. The other end, of high volumtrc flow,
passed a check valve with a crack limit pressure of 90 psi, or pressure required to open the valve in the flow
19

direction, before entering the tank. This was termed the 'driver." Te driver was needed to pressurtze the tank
above the static pressure of the high-speed nitrogen line so the aluminum could be "driven" into the high-speed
nitrogen from the tank.
To enhance the fluidzation, the check valv was used to limit the pressure into the driver, allowing the
fluidizer to remain at a higher pressure. The check valve was installed in line with the driver after the T-flning.
This prevented flow into the high volumetric flow line until the differential pressure reached the valve crack limit.
The check valve would open, allowing the driver gas to enter the tank. The idea was higher pressure fluidizer gas
would constantly flow, agitating the alumnum powder. Eventually the tank pressure dropped below a cumin level
due to being open to the high-speed ine. The check val" would crack open and flow enough gas to make up for
the flow deficiency of the fluidizer.
Te check valve is designed to behave as an underdamped mass-spring system. When itrogen flowed
through the valve, it would cause the poppet and spring to chatter at approximately the same frequency as the
thermal output oscillations. The only damping was coulomb friction and viscous effects on the poppet and spring.
The valve also limited the volumetric flow.
The pressure regulator, T-fitting, and check valve were replaced with separate regulators for the fluidizer
line and the driver line as shown by Figure 21. The fluidizer line remained low volumetrically, but was set at
higher pressure. The driver line was high volumetrically, but remained set 68.9 kPa lower in pressure to establish
the pressure gradient within the aluminum tank for powder agitation. This balance of pressure setting and
volumetric flow difference provided stable pressurizing and fluidizing of the aluminum powder, eliminating the
oscillating pneumatic effects.
Figure 22 demonstrates the =cce of these modifications in damping the flux oscillations. Not only was
the depth of modulation decreased, but the average thermal output increased by a factor of two. The distinct 6-Hz
oscillation was removed, but a small amplitude fluctuation of about 8 Hz to 10 Hz still existed. The fluctuation
suggested that further modification of the TRS was needed.
N~2 SowmM..
VIM
Figure 21. Modification of fluidizer/driver system.
20
45
b30
15
010 0.5 1 1.5 2 2.5 3 3.5
Time, 2
Figure 22. 'RS flux reord ater modifimtion of ae tim/ rista
The thrve-s k TIRS system was provided with a flexible line for high-speed transport of the aluminum
powder fiom Ihe module to the azle 10 m distant When the MIS was modified to a single nozze coof1urationu
as nuc of the original equipment as poible was used, and the flexible high-speed line was retained.
After the driver/fluidizer system was improved, there sill pesisted an S-Elz to 10-Hz fluctuation in the
thermal output, but of a much lesser magnitude than the former check-valve-induced oscillation. An engineering
model of the aluminum tank pneumatics and the high-speed nitrogen line was developed. The model was an
attmpt to reproduce the oscillating mass flow.
The mathematical model of the pressurued aluminum tank revealed that the tank'gh-speed line
interface did not se up a resonance condition. If the pressure outside the exit of the tank wre constant, then the
mass flow rate of aluminum would be steady after an initial burst of powder. If the exit pressare of the aluminum
powder tank wer oscillatory, then the mass flow rate would be directly influenced For a moae detailed
explanation of the mathematical model, see Appendix C.
The fl•ble high-speed line was investigated. It was found that some of the line was blocked. Aluminum
powder had sttled in some slight dips and curves and hardened. The line gave adequate passag when the
aluminum was initially injected into the high-Sped flow, but when the aluminum arrived at the blodaW, the
blockage would lower the mass flow until the initial aluminum ma- passed through. Blockags combined with
the lins abiity to n in length, created pockets of aluminum powder concentration.
The flealine was eliminated, and a smooth-walled, rigid copper tube of equal inside diameter was
insalled. The result, as evident in Figure 23, is a relatively smooth and level thermal output with fas rie and fall
times. By the changes described, ARL was able to create a TRS that has fairly precise output with a good
approximation of a rectangular thermal putl.
21

70T 60N 5
40
302010
0 1 2 3
rime, s
Figure 23. TRS flu rd ater modifadon o alumim gofd U lM
3.8 Characterization Methods.
To evalufte the canges mad to the TRS. a method to analyze the data was neded. Since the RS
output is nearly rectangular, four schemes that dusrb the output as a strictly rectangular pulse with definedamplitude and duraion have been developed. 7U amplitude can be described as the average flux, and the duration
is the time of thermal owtput a the defined average flux. Thes four schemes are the Full Width method. Full
Width at Half Maximum method, Moments Matching method, and the presently pra, Fourier Avraging
method (LOucks 1990).
3.&1 FuM Width Method.
TIe Full Width method defines the pulse width of the flux record as the time from the initiation of the
TRS until the flux level has dropped below some minimum point coe to the baseline. Te amplitude is then
determined by dividing the fluence, or the integrated flux record, by the pulse width. 7Te beginning of a flux
re= is ordinarily wel-deflned, but the termination point is vague due to the hot cloud of residue still proximate
to the targt aft shut-down The still coolng aluminum oxide particles leave a decaying trail on the calorimeter
dafa and prolongs the termination point. As seen in Figure 24, the determination of the pulse width usualy leads
to low mpoude lees, poorly characterizing the "RS data.
22
30
120
a 0.3 I US 2 2.3* Tim.. Sm
3.&2 Full Width at Half Maximum Method.
M&i method is a conreced Full Width method. The Fall Width method is modified by redefining the
pus width ouset and teamination points. As see in Figre 25, these points are defined as where the flux record
iniaily reaches more than oen-half the naxaizum value and where the flux level drops below this value spin.
This method imoproves the ideal -cIaract-erI ation because it is not prolongedl by the residual buma-off.
Large variations in TRS outpu affect the repeatability tfithe TRS maximum. Determination of the half-
maximumn value changes between records. Becaue of the amount of this variation, crossover to below half-
inxlmuun could occur more than once. Multiple crossovr below half-ma~ximum presents a problem in soem
algorithms for establishing the parameoers but can be overcome. A drawback to this method is tha the exclusion
of data outside the defined pulse length results insa low fluence calculation
70.
30.
20.
0 0.3 1 1.5 2 2.5
Rpre ~ ~ ~ ~ ~ ~ T 253.d ewe R aaan W it tHl-ldu
23

3.83 Moments Matching Method.
The Moments Matching Method can establish the parameters of the rectangular pulse fromi an arbitraiypul in terms of its zeroth, fiM and second moments. The equation is a time transformation of the data. The nth
moment is defined as
M& = f'f(x)t'dt.
The rectangle that is parameteized is the one which nmot clsely muches the -me moments. The
amplitude A and the pulse width, pw, can be found conered about a point in time, tc, from the followingequatio:
t, = M1 pw=2 A = MoMe 'Me 'pw
The zeroth moment, t4 is the fluence of the record, and determining pw is rigorous. The limitation of
this scheme is that pw is dependent on the second moment, M2. The second moment is extremely
sensitive to the range of data being observed. As the range of data points is inre d the instrumentation line
noise will quickly affect the second moment value because of the t2 term. The consequence is uncertainty
regarding the calculated pulse width. The TRS data set must be camMfully bounded to eliminate line noise outside
what is considered pertinent data before analysis can be performed.
3.8.4 Fourier Averaging Method.
The Fourier Averaging Method (Loucks 199Ia) is a reliable, rigorous method of characterizing a TRS
data set, requiring no estimation or manual work. The idea is much the same as the Moments Matching method in
that the data set is subjected to a transformation, then compared to a rectangular pulse subjected to the same
process. The rectangular pulse that most closely matches that data defines the characterization parameters.The Fourier tranform of a time-dependent equation into the frequency domain is defined as such
1G(f) = fF(t)e"''dt, G(fo)= O, pw= T
The Fourier tramom, of a TRS data set will yield approximately the same transform results. By simply
finding the first minimum point of the transformed record, the pulse width is established. The TRS data set is then
fll characterized The transform is relatively insensitive to the range of data used. Because of the insensitivity,
data points an be bypassed or data sets decimated to increase the speed of characterization.
24

TIe Fourier uaform will break into two pars, rad and imaginary. The magnitude is the positive square
root ofthe m mofithe squares of the two put. At 01Hz, the energy density will be at a maximum. This is also the
fluence of the TRS record. As the frequency increases, the resulting integration will decrease until eventually a
minimum is reached. Since the magnitude is the positive square root of the sum of the squares, its value will never
be negative. For a tnre rectangular pulse, this first minimum will be zero. Since TRS is a distortion of the
rectangle, the minimum may not be zero, but the minimum is still clearly defined. TI pulse width is defined as
the reciprocal of the frequency where the magnitude of the transform is a minimum.
The minimum fo is unknown. Finding it is done by iteration since the solution requires a transformation
from the time domain to the frequency domain. Fortunately, few iterations are require The proncss can be made
more rapid by first estimating the pulse width and concentrating the method in that area, but that is not nesry.
The result is a method of characterizing the TRS thermal pulse without any estimations or manual woak. The
technique is rigorous and the result repeatable with precision.
3.9 TRS Analysis Program.
A TRS data reduction and analysis program called DANTE (Loucks 1991b) was written and placed on the
same PC as the TRS controller and the data acquisition system to expedite the process of data analysis. Also with
the ability of the MEGADAC 2200C to record several channels, a quick metwd to reduce, analyze, and review the
TRS data on-site was needed.
All four characterization methods are used in DANTE. Each TRS calorimeter record is dipped of
baseline data and run through the four characterization schemes. Each record is run through a statistical
subroutine, which calculates an average flux, standard deviation, and nominal deviation.
For thermal mapping, the calorimetric data was also compared to a calorimeter placed in the same spatial
reference point, called the standard, resulting in a normalized output. A resulting data record is shown in Figure
26. The data array produced from each calorimeter channel was divided by the same time-array element from the
standard data set. This resulted in a "Percent* normalized result.
Ft)PO dii(.) 100%.
F (t.)
The standard varies between buns. The data ar more representative of the test series if a particular TRS
burn wer to deteriorate or exceed its average flux. Also, the normalized values could be easily adusted to reflect
any deviation of the reference to the average output of the TRS.
The result of DANTE is an information set for each channel. The development of DANTE has been very
ueful in finding and eliminating complications with the TRS output, performing tests for other projects and doing
thermal mapping (Loucks 1991).
25

The Analysis Shee information provided input for a database for comparisons against other data sets of
the same test. Each calorimeter was compared against the standard and other events. The normaliing was to
evaluate the thermal radion incident to an array member calorimeter relative to the standard. When the arrmy
seup was altered, the standard would reflm the normalized output when making compaisons. The first pan of
the sheet is TRS event identification and calorimeter data (location. channel). The ideal arame trz2ton
compared the four methods. The statistical analysis provided a way to measure the performance. The standard
deviation and nominal deviation gave a measure of the amount of variation in the output during the steady-state
phase. The normalized comparisons are the output divided by the standard.
TEST: Totat AIuemm
SiOT: TRS-4-92STATION: -60/-10/72EGINNING TIME: 0 sec
TINE INTERVAL: .004 sec
ARRAY SIZE: 2125 date pointsTINE OF ARRIVAL: 3.362023E-03 secPEAK LEVEL: 107.1847 cat/cm'2-sec
IDEAL PARANETERIZATION
NETHOD FLUENCE PULSE VIOTH AVERAGE FLUX
cat/ca2 sac Cat/cm'2-secFULL VIOTH 426.281 6.068 70.74506FULL WIDTN NALF MAX 401.9008 5.272 76.23461
UW1ENTS MATCMING 429.281 5.618311 76.40749
FOURIER AVERAGING 429.2989 5.535471 77.55418
STATISTICAL ANALYSISNEAN a 72.6503 Cal/c.'2-secSTANDARD DEVIATION = 18.45188 Cat/co'2-sec
NOMINAL DEVIATION - 25.39822 ZTINE RANGE a 5.72 sac.
STATISTICAL CLIP STARTED AT .A sec AND ENDED AT 6.608 see
NORMALIZED COMPARISONS
COPARISOl AGAINST TRS-4-92 -60/-10/72
NORMAL NEAN a 100.0699 XNORMAL STAMDMD DEVIATION x 6.992616E-02 %
TINE RANGE a 5.724 SEC.
NORMALIZED CLIP STARTED AT .856 sec ANM ENDED AT 6.58 sec
Figure 26. DANTE analyuis sheet information.
26

4. SAFETY
The original TRS was not very safe to operate-the technology and mechanisms were untried, and the
materials were considered hazardous. After the failure of the three nozzle source, the ARL program stipulated that
the TRS must be safe to operate. An SOP was needed, and it had to consider the TRS's effects on personnel and
the environment.
4.1 Personnel Impact.
Personnel operating the TRS must be protected from accidental thermal radiation, flames, cryogenics,
electrical current, and aluminum powder. An SOP was written based on knowledge gained by experiments.
Individuals also received proper clothing and training in the materials they were handling.
There are three substances used that require a Material Safety Data Sheet (MSDS). They are aluminum
powder, LOX, and liquid nitrogen (LN2). All three substances are relatively harmless to the personnel except in
special conditions. Careless handling of the cryogenic liquids could result in freezing injuries. Additionally, two
individuals are needed for LN2 handling. One technician handles the equipment while the other observes the
nitrogen transfer process from a distance. This precaution is taken in case the operator is accidentally overcome by
an abundance of nitrogen, which could possibly displace oxygen for breathing.
The aluminum powder can prc.,ent some hazard to the individual handling it. It is a combustible
material. The handler must take care not to allow flames or sparks in his vicinity. Proper grounding must be
ensured. A respirator and face slueld is required. Exposure to high concentrations of aluminum powder can cause
eye and respiratory system irritation (Reynolds Metals Company 1988). There are no known carcinogenic or
reproductive effects.
4.2 Environmental Impact.
The TRS produces aluminum oxide and heat. The waste recovery bin catches at least 99% of the unused
aluminum powder. The powder is recycled with some loss when transferring from the waste recovery bin to the
aluminum powder tank or storage container. The wasted LOX and LN2 go back into the atmosphere. The
aluminum oxide powder produced from the burn falls back to the ground and is dispersed onto the soil.The area within a 30-m radius of the TRS is considered the "buffer" area, as seen in Figure 27. Any
severe effects are realized within a 5-m radius, the "danger" area. Special care is needed when there is a target
present. The thermal radiation effects on some coatings can cause chemical changes. Some of these coatings can
become carcinogenic or poisonous. The toxic materials must be contained and disposed of properly.
27

CotrlTrilr Undergound Ihtunetton
F ogure an. Power ... y
A-ILO uW LN2
Aluinm Powder",Storage Magazine " TRS, Nozzle
30-m /iu
Figure 27. TRS Wlity I&=.
4.3 Fire Hazrds.
At present, the greatest danger is that some of the larger condensed particles of aluminum oxide are stillabove the ignition temperature of the material on which they fall. The danger is when these particles land in
flammable arm or material (eg., grassy areas, wood, or tar paper). The SOP dictates that no TRS operation will
be conducted near any flammable materials. To ensure that hot particles do not get carried by wind outside the
danger radius, the TRS is never fired in winds higher than 5 m/s.
The module is well within the 30-m buffer radius but is well protected from the TRS effects. The
aluminum powder is contained in a heavy steel, airtight tank that is pressurized by nitrogen gas. The hydrogen
and oxygen gas bottles arm equipped with explosion-proof valves and are themselves immune to any hot particles.
The LOX container is well-insulated and has a steel covering. The controller is enclosed in a steel container and is
sealed before each test as directed by the SOP.
Four different fire extinguishers are available during a test. Two of these are class A and B extinguishers.
One class C dry chemical extinguisher is available for fires involving energized electrical equipment, and a class D
(Metakx) is available for any fires directly involving the aluminum powder (National Fire Protection Agency
1969). Sand is also available to contain aluminum powder fires and is the recommended method of fighting a
metal dust fire (Aluminum Association 1915).
It is important to understand the use of the different extinguishers. By the MSDS for aluminum powder,
the A-B-C exinguishers are not for use against the aluminum powder in the event of a fire. Pressurized systems
28

that could stir or react with burning aluminum will spread the aluminum powder. The agitation could cause the
aluminum powder to form a cloud, increasing the oxygen-to-fuel ratio to dangerous levels The sand is used to
build a ring dam around the burning aluminum to contain the flames. The class D extinguisher, when released,
sinks down onto the burning powder and smothers the fire.
The likeliest means of accidental ignition of aluminum powder is generation of a static electrical spark
while the aluminum powder is being transferred. To ensure this does not happen, the TRS and accessories are
grounded. The aluminum powder is stored in a vented, dry, and grounded shed 45 m from the TRS. The shed is
made of wood, but the floor is covered with a wire mesh that is attached to a buried 1-m-long copper grounding
rod. All the equipment used to handle the aluminum powder is nonsparking, conductive material. The TRS
module is also connected to a 1-m copper grounding rod. A detachable grounding strap is attached to the TRS
module and is clipped to the aluminum container during loading of aluminum powder into the aluminum powder
tank. The grounding also helps prevent accidental ignition by lightning strikes.
5. SUMMARY
The performance guidelines for the ARL TRS Program have not yet been met. A repeatable, consistent,
and uniform radiant field that can be inserted into the 2.44-m probative tube is not yet a realization. The
modifications of the formerly damaged unit has resulted in a unit that was state-of-the-art. The rise and fall times
of the flux record are no more than 100 ms and are probably better. The average variation during maximum
thermal output is believed not to exceed 10%. Currently, fluence is predictable to within ±2%. More work needs
to be performed to learn of the possible deficiencies of the calorimeter.
The addition of the large combustion chamber, three-way ball valve, and changes in the aluminum
fluidization and transport were the most significant mechanical improvements to the TRS. Changing the control
and data acquisition systems were the additional measures necessary for operation. The computer simulation of the
aluminum pressure vessel was the beginning of modeling the entire system. The experiments resulted in learning
that the TRS flame cannot be spread as predicted. The aluminum powder loses too much energy before it is past
1 m above the combustion chamber. There is a need to develop an advanced TRS that incorporates all lessons
learned from this effort.
Three years of experimentation have provided experience in safely handling aluminum powder,
cryogenics, and targets. An SOP to ensure the safety of personnel and protection of the environment has worked
very well. The facility created for this type of experimentation has enabled ARL to continue this type of work. It is
feasible to design improved TRS systems.
29

6. REFERENCES
Aluminum Association, Inc. "Recommendations for Storage and Handling of Aluminum Powders andPaste." TR-2, Washington, DC, July 1985.
Baumeister, T., E. A. Avallonn, and T. Baumeister MI. Marks' Standard Handbook for MechanicalE jine. Eighth Edition, New York: McGraw-Hill Book Company, 1978.
DSP Development Corporation. DADiSP Version 3.0. Cambridge, MA, September 1991.
Loucks, . B. "Thermal Radiation Simulator Characterization Methods for the Rectangular Pulse." BRL-TR-3148, U.S. Army Ballistic Research Laboratory, Aberdeen Proving Ground, MD, September 1990.
Loucks, R. B. "Optimization and Modification of a Thin Flame Thermal Radiation Source." Paperpresented at the 12th International Symposium on Military Applications of Blast Simulation, Perpignon, France,September 1991a.
Loucks, R. B. DANTE.BAS Version 1.3, U.S. Army Ballistic Research Laboratory, Aberdeen ProvingGround, MD, March 199 1bk
Loucks, R. B. "The Effect of Transducer Response Rate on Thermal Radiation Data." Paper presented atthe 13th International Symposium on Military Applications of Blast Simulation, The Hague, The Netherlands,September 1993.
Mergnat, D. Conversation with author. Centre d!Etudes de Gramat, Gramat, France, 27 February 1990.
Muller, P. C. MEGA.BAS Version 1.0. U.S. Army Ballistic Research Laboratory, Aberdeen ProvingGround, MD, January 1991.
National Fire Protection Agency. Fire Protection Handbook. 13th Edition, Edited by G. IR Tryon andG. P. McKinnon, Boston, MA, 1969.
Polk, J. F. Conversation with author. U.S. Army Ballistic Research Laboratory, Aberdeen ProvingGround, MD, November 1991.
Rehmann, W. "Characterization of the Thermal Radiation Field Generated by a One-Nozzle Torch."BRL-TR-02529, U.S. Army Ballistic Research Laboratory, Aberdeen Proving Ground, MD, October 1983.
Reynolds Metals Company. "Material Safety Data Sheet." Form OSHA-174 for Grade 120 AluminumPowder, Richmond, VA, November 1988.
Reynolds Metal Company. "Reynolds Aluminum Atomized Powder." Advertisement Number730-1-7(5-189), Louisville, KY, 1990.
Van Wylen, G. J. and K E. Sonntag. Fundamentals of Classical Thermodynamic. SI Version, SecondEdition, New York: John Wiley and Sons, Inc., 1978.
30

APPENDiX A: TRS OPERATION CHECKLIST AND EXPERIMENT SHEET
31

Intentionally Left Blank
32
Opuusteesal Praedure for the "Th"e Tlame" TRS System.
1. Turn oa the rang warning lights and put safety barricades and warning signs in place.
2. Assure that fire extinguishers are charged and available.
3. Set safety relay switch in blockhouse to safe.
4. Install panel control key in commller at service module.
S. Check LOX and Al supply levels in service module tanks.
6. Check that the A supply tank cap is securely installed and that the nozzle plug is removed
7. Open the three nitrogen stora tank manual valves.
S. Clear the area of nonessential personnel and confirm that the panel control switch on the servicemodule controller is off.
9. Turn on the TRS power supply in the blockhouse and place the safety relay switch in the operateposition.
10. Adjust the N2 pressure regulators located on the service module to the output pressures listed on theoperational checklist.
11. Place the panel control switch on the service module controller in the panel control position and thecontroller mode switch in the device test position.
12. Check the actuator operation of the functioning of the valves listed on the operational checklist.
13. After the valve actuators and valves have been functioned, record the N2 pressure regulator outputpressures on the operational checklist.
14. Verify the operation of the TRS ignition system by performing the following steps. Open the 02 andM2 supply cylinders and check the supply tank pressures. Set the 02 and M2 regulator output pressures to thevalues listed on the operational checklist Place the panel control switch on the controller to the panel controlposition and the controller mode switch in the device test position. Place controller in the ignition sequence modeand press the start switch to initiate igniters. After stable ignition operation is confirmed, press the stp switch toterminate the ignition sequence.
15. Place the panel control switch on the service module controller in the off position and the safety relayswitch in the safe position.
16. Check the N2, 02, and H2 gas supply levels and the LOX and Al supply levels at the service module.
17. Close the N2, 02, and H2 gas supply valves.
18. With the safety relay switch in the safe position, place the panel control switch on the service modulecontroller in the panel control position and the controller mode switch in the time set position. Check and/or setthe controller function times as listed on the operational checklist.
19. Confirm that the safety relay switch is in the safe position and place the panel control switch on theservice module controller in the remote position.
33

20. Load the control program (brlop.bas) into the control computer in the blockhouse and run the controlpogram. Initiate test start from the blockhouse computer and verify the start of the service module controller.AMt verifying the service module controller start, abort the test from the blockhouse computer.
21. Place the panel control switch on the service module controller in the off position and confirm thatthe blockhouse personnel art ready to conduct the test.
22. Open the N2, 02, and H2 supply tank valves. Record the N2, 02, and H2 supply tank pressures andthe 02 and 112 regulator output pressures on the operational checklist.
23. Place the panel control switch on the service module controller in the remote position and secure thecontroller door.
24. Confirm that the area is clear of personnel and record the weather conditions on the operational
checklist.
25. Sound the range warning siren.
26. Place the safety relay switch in the operate position and initiate a reset from the blockhouse computer.
27. Verify instrumentation recorders are on and initiate the test start from the blockhouse computer.
28. Following the test, confirm that the blockhouse computer has timed out and the clock has stopped at74.9s.
29. Initiate a reset from the blockhouse computer and confirm that the Al and LOX tanks have vented.
30. Record the test identification data on the operational checklist.
31. Place the safety relay switch in the safe position and proceed to the service module. Place the panelcontrol switch on the service module controller in the off position.
32. Check the area for fires and extinguish as required.
33. Close the 02 and H2 supply tank valves.
34. Sound the all clear on the range warning siren.
35. Place the safety relay switch in the operate position, place the panel control switch on the servicemodule controller in the panel control position, and place the controller mode switch in the device test position.
36. Verify the nozzle area is clear of personnel and initiate the high-speed N2 flow. Initiate the Al pulsestart and verify that the Al delivery line is purged.
37. Press the controller stop switch.
38. Close the three N2 supply tank manual valves.
39. Place the panel control switch on the service module controller in the off position and remove theswitch key. Place the safety relay switch in the safe position and turn off the TRS power supply.
40. Return the panel control switch key to the blockhouse and turn off the range warning lights.41. Remove the safety barricades and warning signs.
34

42. Insall the =2ki phug and, fsneth servic module control panel, the service module, and the
nozzle moue
Operationl Procedures for the Trailer Mounted High Presmure Cryogenic Pump/Vaporizer.
NOTE: Cryogenic liquids will cause severe freeze burns on contact with skin. Protective clothing andequipment must be used when operating this system
1. Position LN2 dewars and cryogenic pump/vaporizer unit near the TRS service module to bepressurized so that a dlear and unobstrnied path of movement is provided between the units.
2. Connect the 1/2-in stainless steel flexible hose between the LN2 dewar and the cryogenic pump.
* 3. Connect the 1/4-in high-pressure hose from the vaporizer outlet to the input of the service modulenitrogen manifold.
4. Check tightness of the connections of the stainless steel hose from the cryogenic pump to the
vaporizer.
5. Close the manual input valve on the service module nitrogen manifold.
6. Open the three manual valves on the individual nitrogen cylinders and note the pressure on thenitrogen supply gauge (this will be needed when nitrogen transfer between the cryogenic pump/vaporizer and thenitrogen supply cylinders takes place).
7. Close the cryogenic pump bleed valve.
S. Check that the flow/vent valve on the vaporizer outlet is in the vent position.
9. Open the outlet valve on the LN2 dewar 1/4 to 1/2 turn (a loud hissing should be heard from thevaporizer vent line).
10. Check all connections for liquid or pressure leaks and tighten if required.
11. Fully open outlet valve on the LN2 dmwar. Frost should form on the 1/2-in stainless steel flexiblehose and the head of the cryogenic pump. (Chock for leaks around the pump head gasket and tighten head bolts ifrequired. Head bolts should be tightened carefully and only enough to stop leaking. Do not overtighten.)
12. Press the start button on the pump control unit.
13. Open the cryogenic pump bleed valve two full turns.
14. Turn the flow/vent valve on the vaporizer outlet from vent to flow position (the sound of N2 ventingfrom the vaporizer should stop, and venting should be heard from the pump bleed valve).
15. Slowly close the cryogenic pump bleed valve to about 1/4-turn open until pump is primed (a deepthrobbing sound indicates the pump has primed). (N2 vapor and a small trickle of LN2 will be coming from thebleed valve. This is necessary to prevent vapor lock and loss of prime in the pump.)
16. Check the pressure gauge on the cryogenic pump control box. (The green indicator indicates theautomatic preset cut-off pressure of the pump control, and the black indicator is the system output pressure.)
35

17. When the sysem output pressure equals the pressure in the nitrogen supply cylinders Open thenitrogen manifold, valve to fill the supply cylnders (Unless system output pressure and a iroWe suppty pmiesre,a equal when manifold valve is opened, blow back can occur, which can cause the cryogewc pump to lose pioear damp the oystem.)
18. When automatic preset cut-off prssure is reached (2100 psi at the pump), the pump will cut off-
a. dose the three manual nitrogen supply cylinder valves;
b. close the manual nitrogen manifold valve;
c. turn the flowivet valve oan the vaporizer outlet from flow to vent;
d. puh stop button on the pump control unit;
e. lose the outlet valve on the LN2 dewar (venting will continue from the vaporizer vent line and thepump bleed valve until all pressure has been relieved).
Operational Procedures for the Transfer of Liquid Oxygen from Bulk Storage to the TRS.
NOTE: Cryogenic liquids will cause severe freeze burns on contact with skin. Protective clothing andequipment FREE OF PETROLEUM-BASED CONTAMINANTS must be used when operating this system.
I. Confirm that the safety relay control switch is off.
2. Erec safety barricades and warning signs.
3. Install the panel control key in the controller and confirm that the panel control switch is in the offposition.
4. Check and record the LOX level in the bulk storage tank. A minimum of 12 in of LOX is required tofill the service module tank
5. Clear the area around the bulk storage tank and the service module of nonessential personnel to a
distance of 30 ft.
6. Turn on the range warning flasher lights.
7. Open the manual LOX fill valve on the service module LOX tank.
8. Close the LOX transfer line vent valve at the LOX bulk storage tank.
9. Open the LOX transfer fine valve at the LOX bulk storage tank.
10. Open the LOX supply valve at the LOX bulk storage tank to initiate the flow of LOX to the servicemodule tank.
11. Confirm that gas is flowing from the service module LOX tank vent line.
12. Continue the transfer of LOX until a thin stream of LOX is seen flowing from the service moduleLOX tank vent line.
13. Close the LOX supply valve at the LOX bulk storage tank.
36

14. Opea the LOX undw li vat vamve a the LOX bulk so=sW tank.
15. Cloos the memal LOX fill vave om the sevice module LOX tank.
16. Check and rc, nd the LOX level maining in the bulk s tank.
17. PMae the service module pmel control switch in the panel Control position ad check aind ecord theLOX leW in the service module LOX tank.
it. Place the p-W control sMitch in the offposition and remove the switch key.
19. Turn off an warning flasher ights.
37

OperationaI Checklat for TRS Opera"li
Operational Checklist for " Thin Flame " TRS System . Page 11. RECORD test data:
a. Test identification number ___b. Teat date /c. Time
2. Range warning lights ON3. Safety barricades & warning sign* PLACED4. Fire extinguishers AVAILABLE & PLACED5. Coipressor for water pressure ON6. TRS power ON Check Voltage level 32 V7. Safety relay switch SAFE8. CHECK supply levels:
a. LOX supplyb. AL supply inches from top
9. Al tank cap INSTALLED10. Nozzle plug REMOVED11. Area CLEAR of non-essential personnel12. Power ON Panel, control key INSTALLED in controller13. Panel control switch PANEL CONTROL14. Controller mode TIME SET15. SET/CHECK controller function times:
a. Cycle start secb. Ignition sequence start secc. Quit ignition, 02 on secd. LOX tank pressurization sece. Al tank pressurization secf. Nozzle purge seeg. Vent tanks, end run saech. no function seci. LOX flow on secJ. LOX Divert aeck. Device A sec1. Stop LOX & HS N2 flow secm. HS N2 flow start secn. Device B seco. Aluminum flow start secp. Aluminum flow stop sacq. Aluminum pulse start secr. Aluminum pulse stop sec
16. Panel control switch RPM0TE17. LOAD & RUN brlopr.bas on control computer18. Initiate test START from control computer19. VERIFY controller start20. ABORT test from control computer21. Controller Mode DEVICE TEST22. Panel control switch PANEL CONTROL23. Safety Relay switch ON24. OPEN N2 tank valves & CHECK pressure psi__p25. Actuators regulator output pressure SET to psi
38

Operational Checklist for Thin Flame TRS System . . . . Page 226. CHECK operation of valves:
a. LOX tank pressurizationb. AL tank pressurizationC. Nozzle Purged. LOX flowe. LOX to Nozzlef. Device Ag. High speed flowh. Al pulse start
27. VERIFY operation of TRS ignition system:a. OPEN 02 cylinderb. C 02 supply/output pressure / psi. OPEN H2 cylinder
d. CHECK H2 supply/output pressure / psie. Personnel CLEAR of nozzle area 30 ft minimum **f. Controller-io IGNITION SEQUENCE & START **g. CONFIRM stable ignition operationh. STOP to turn off ignitors
28. Regulator output pressures SET to listed pressures:a. LOX tank pressure psib. High speed nitrogen psic. Aluminum tank driver pressure psid. Aluminum tank fluidizer pressure psi pse. Nozzle purge psi
29. Control Panel switch REMOTE30. Control Panel SECURE31. Area CLEAR32. SOUND warning siren33. Safety relay switch OPERATE34. Blockhouse READY for text35. Initiate RESET from control computer36. Initiate test START from control computer37. Recorder ON **38. RECORD weather conditions:
a. Temperature Fb. Barometric pressure in Hgc. Wind directiond. Wind speed - mph
39. CONFIRM controller clock STOPPED at 74.9 sec40. Confim LOX and AL tank vents OPEN41. Safety relay switch SAFE42. CHECK area for fires7TINGUISH if required43. Panel control switch OFF44. EXTRACT Panel control key from controller45. H2 cylinder valve CLOSED **46. 02 cylinder valve CLOSED47. CLOSE Nitrogen tank valves48. TURN DOWN all output regulators and let bleed49. SOUND warning siren all clear
NOTE: ** Delete item when conducting "Cold Flow" Test
39
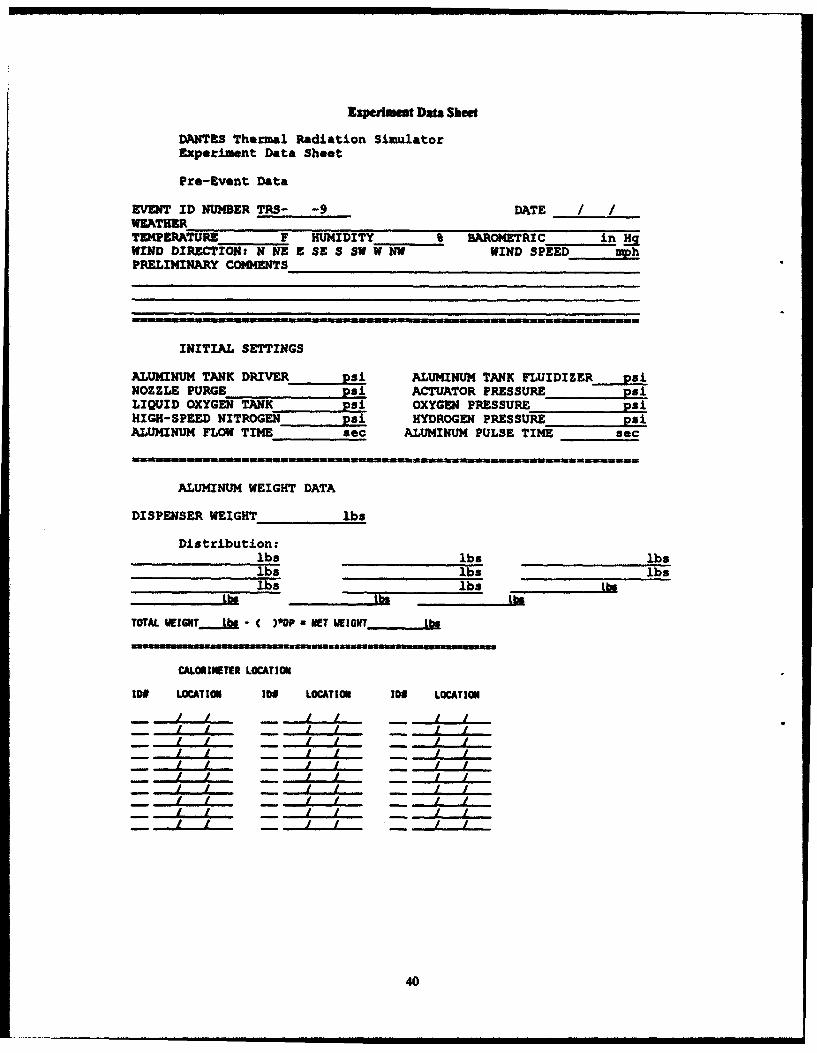
Ziperimat Date Sbeet
DANTES Thermal Radiation SimulatorExperiment Data Sheet
Pre-Event Data
EVENT ID NUMBER TRS- -9 DATE / /WEATHERTE(PERATURE F HUMIDITY BAROMETRIC in HjWIND DIRECTION: N NE E SE S SW N NW WIND SPEED uphPRELIMINARY COHN ENTS
INITIAL SETTINGS
ALUMINUM TANK DRIVER psi ALUMINUM TANK FLUIDIZER _siNOZZLE PURGE psi ACTUATOR PRESSURE psiLIQUID OXYGEN TANK psi OXYGEN PRESSURE psiHIGH-SPEED NITROGEN psi HYDROGEN PRESSURE psiALUMINUM FLOW TIME sec ALUMINUM PULSE TIME sec
mm~~mummma=m i m nm m m m
ALUMINUM WEIGHT DATA
DISPENSER WEIGHT lbs
Distribution:lbs lbs lbslbs lbs lbslbs lbs lb.
Lbs Lbs tb
TOTAL WEIGHT - ( )0OP a NET WEIGHT , Lb
CALONINETER LOCATION
1Df LOCATION i0# LOCATION ID# LOCATION
.. 14
40

Pst-EVWn gets
ALLUINUN LEVEL
ALUNREM TANK1 INITIAL LEVEL FiGS TOP_.........JnALUNIOM TANK FINAL LEVEL FRON TCP_____..,.,,JMYT CNANGE IN LEVEL Ii
CALORINTER REULTS
CALURINMI to PEAK FLUX FLUENCE NEAN FLUXI ________ ________ _______
2 _____ _____
3 _____
4 _____
6 s___
76_____ _____
10
12______ __________
13
16_____ _____
17_____ _____
19 _____
20__ ___ _
21 _____
23__ ___ ___ _
25__ ___ ___ _
2627______ __________
28__ ___ ___ _
29__ ___ ___ _
30__ ___ ___ _
41

Intentionally Left Blank
42

S' , -. )- a - -' -' ' -..
APPENDIX B: METHOD FOR CORRECTING CALORIMETRIC DATA
43

Intentionally Left Blank
44

Thi work in this appendix is an expansion of the contribution of Dr. John Polk.
The Gardon-type gauge, depicted in the text in Figure 17, is not an instantaneous measurement device. It
has a response unique to its physical design. The supplier of the gauge used at ARL has reported the response rate
in very specific terms. If the gauge were subjected to a step input, the result is an exponential rise of (I-e-sCy.
The response specification is that 68.2% of the input would be registered in the output by a certain time. This time
is the first time constant, C,. By knowing the time constant, one can 'correct" the output from the Gardon gauge.
Given the followvng definitions:
V. is voltage wroduced from calorimeter
CTC is proportio.iality constant
TD is the diaphragm center temperature
T5 is the diaphragm edge temperature and is assumed constant with time
Cvw is a proportionality constant converting voltage to flux
Cvr is the product CvFCrC
Fn is the measured flux in cal/cm2
F, is the incident flux in cal/cm 2
C1 is the specific heat of the material
m is the diaphragm mass
The output of the Gardon-type gauge can be written as:
V- =CTC(TV-TO B-I
The measured flux can then be written using equation B-1:
F== CwV-= CVr[TD -TB] B-2
For a transient analysis, the change in internal energy of the sensing element can be written as:
AE = CPm(TD - TB). B-3
The rate of change in the internal energy can be written as:
dAE d(CPmTD)-- = B-4dt dt
The rate of change of the internal energy of the diaphragm is assumed to equal the net exchange of energy
between the radiant flux into the surface and the energy conducted away at the edge. That could be written as:
dE=F, - F. F, - Cv(T - TB). B-5
dt
45

This sets up a differential equation:
dT. = F, +CT _dt CPm CPm
The solution of this differential equation can be found several ways. The method of using an integration
factor is used. In general for any differential equation in the form:
-d+yP(x) = G(x) ,3-7
the solution can be vqprssd as:
Y = ()[lA (s)G(s)ds+C_. B]S
where
I(X) = exp[f P(s)ds] B-9
By substituting the terms of equation B-6 into equation B-8 and equation B-9, and simplification, the
result is a solution for TD in the form of F. and Fi.This solution is:
C,mi dFI
As it turns out, the constant Cm is equivalent to time constant Ci in the response rate equation, (1-e-6ct).Cw
46

APPENDIX C: PROCESS OF SIMULATION OF DRIVER/AERATION MODEL
47

Intentionally Left Blank
48

C.1 Aluminum Vssel Model.
An original mathematical model of the aluminum containment vessel was constructed to simulate the
interaction of pneumatic forces with the dynamic forces of the powdered aluminum. The first approximation of the
vessel dynamics did not take into account the possibility of variation in back pressure. It was assumed that the
aluminum would be discharged into a constant pressure environment. The vessel included an aeration system to
"fluff* the aluminum powder during an event so the aluminum would behave as a liquid.
As illustrated in Figure C-I, the dynamic model was represented by the following equations.
PI
T2 Al.2A2i
Yo
P3T3m3A3
Figure C-1. Aluminum containment vessel.
Bernoulli's Equation,
P-Pg V2 P2-P5 V.3-(C-1)
By continuity and conservation of mass,
m = pALVA = pALV 3A3,
and
A•V=VA (C-2)
49
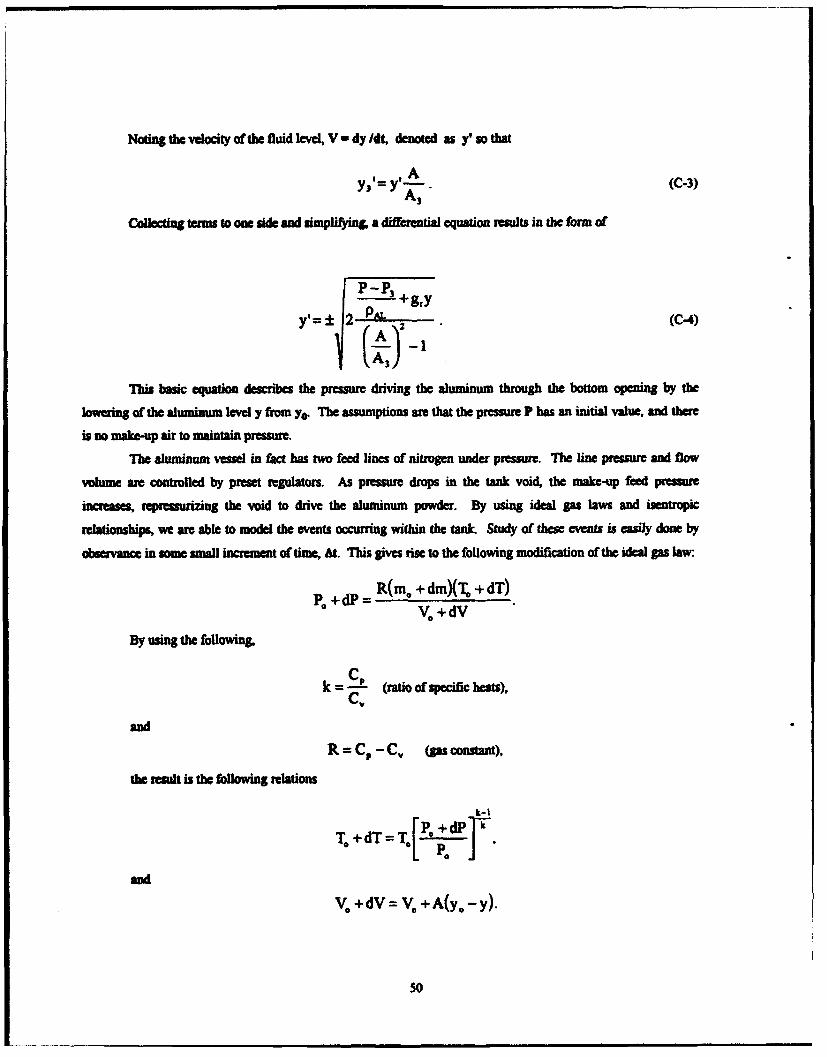
Noting the velocity of the fluid leve, V - dy /dt, denoted as y' so that
y3,= yY .A(C-3)A3
Collecting terms to one di and simplifying a differential equation results in the form of
2P-P3
y'=± 2 PAL (C-4)
F(A)
This basic equation des•ibes the pressure driving the aluminum through the bottom opening by the
lowering of the aluminum level y from yo. The assumptions ar that the pressure P has an initial value, and there
is no nuke-up air to maintain pressure.
The aluminum vese in fact has two feed lines of nitrogen under pressure. The line pressure and flow
volume are controlled by preset regulators. As pressure drops in the tank void, the make-up feed pressure
increases repressurizng the void to drive the aluminum powder. By using ideal gas laws and isentropic
relationships, we are able to model the events occurring within the tank. Study of these events is easily done by
observance in some small increment of time, At. This gives rise to the following modification of the ideal gas law.
R(mo + dmXT. +dT)PO +dP V, +dV
By using the following,
k = -- (ratio of specific heats),C',
and
R=CP-CV (gas constant),
the result is the following relations
k-I
T. + dT= TIP. I
amd
Vo +dV= V .+A(yo-y).
50

SAghitatm Yields a new preismre incremensed byAt
Pe +dP = R T.(m. +dm__) k. : (IIV. + A(y. - y)]P"
lhe value of d. is the amount of mas being introduced back into the volume for dim during
time iarcment AL Keeping in mind ter are uevra inputs of gas into the volume,
~~ (C-.6)
Where
Sk-I
2kP-ace-A81RT 3(k -1)
Substitution of equation C-6 into C-5 gives
ri/k-I 1 )A
RT, Mo+L as P[ P IjP E-P (P)]At)P*= _' (C-S)
[V. +A(yo - Y)]Po
L5
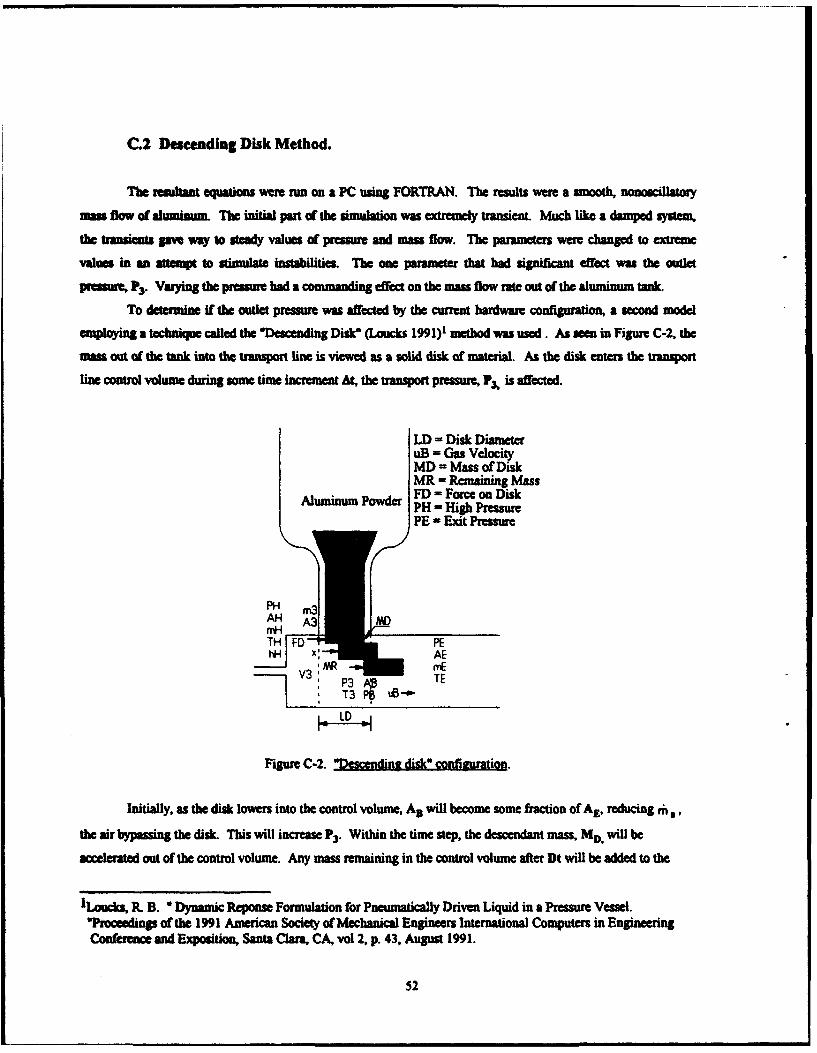
C2 Descending Disk Method.
The remdtant equations were run on a PC using FORTRAN. ThU results were a smooth, nonoscillatory
mas flow of alumium. The initial part of the siamulation was extremely trasentL Much like a damped system.
the transients gave way to steady values of pressure and mass flow. T parameters were changed to etrme
values in an attempt to stimdult instabilities. The oc parameter that had significant effect was t outlet
pmrae, P3. Varying the pressure had a commanding effect on th maw flow rat out of ft aluminum tank
To determine if th outlet pressure was affected by the current hardware configuration, a second model
employing a technique called the *Descending Disk (LAucks 1991)1 method was used. As see in Figure C-2, the
mas out of the tank into the transport line is viewed as a solid disk of material. As the disk enters the transport
line control volume during some time increment At, the transport pressare, P is affected.
LD - Disk DiameteruB = Gas VelocityMD = Mass of DiskMR Remaining Mass
Aluminum Powdr IFD = Force on DiskAluinu PoderPH =-ig Pressure
PE - Exit Pressure
PH MAH A3 MWDmH _ __
TI-4FD P~ ~: AE3 V : TE
P,"3 M• B.-
Figure C-2. "Descending disk" configration.
Initially, as the disk lowers into the control volume, An will become some fraction of A,, reducing rh,
the air bypassing the disk. This will increase P3. Within the time step, the descendant mass, MD, will be
accelerated out of the control volume. Any mass remaining in the control volume after Dt will be added to the
ILoucks, R, B. "Dynamic Reponse Formulation for Pneumatically Driven Liquid in a Preumre Vessel."Prmceedings of the 1991 American Society of Mechanical Engineers International Computers in EngineeringConfeence and Exposition, Santa Clara, CA, vol 2, p. 43, August 1991.
52

I me& -u Thein Mihsa us ed
MO A3& (diskmaus),
= 4LO (disk density),
b-& (densityratio),rs
A = A,(I-b) (bypassrma),
Fp - PbA, = Mpg (for•e moving disk downstream).
MD
2MD
The mass remaining within the control volume is
MR =M (D ) (ifx 2 LD, no mass remains).
The remaining mass is important. It determines the amount of blockage in the control volume for the
evaluation of change in P3. To further evaluate what P3 is, the control volume is treated as a vessel with given
entrance and eoit pressures and mass flows during some increment of time, At, as depicted in Figure C-3.
53

PHAH Control Volume
mHTH !FDAE
Pe :, AB
hB
Control Surface
Figure C-3. Control volume during At.
To describe the change in internal energy of the control volume, we use the First Law of Thermodynamics
(Van Wylen and Sonntag 1978)1:
dQ = E2 -E, +dWdt dt dt
where the following are defined:
E, -E, +eidmn,
E, - E, + AE•+ c.dm,,
dQ = 0. (adiabatic systom).dW - dWD + (P.v.dm, - P~v~dm,),
dWD - F,(x-L.)At
By substitution and combination and using the following relations,
U2e+Pv=i+?v+-+g~z,
2where e is described as the total specific energy of the working fluid Th specific enthalpy is defined as h - i + N.
The result is the following for the total net change in internal energy:
Van Wylen, G. J. and R. E. Sonntag. Fundmentals of Classic Thermodynamis. SI Version, Second Edition,New York: John Wiley and Sons, Inc., 1978.
54

AE l h..HJ(- ha + lha At + FD(LD - x) (C-9)
L~L[zkm -~IB -2)m J At
This equation describes the change of state of the working fluid, nitrogen, for the increment of time Dt.Several of the variables are yet to be defined. By use of the ideal gas law, and assuming the process is nearly
isentropic and adiabatic, values for the unknowns can be found as follows. The mass flows of the inlet at H andthe bypass at B are equated the same as equation C-6.
k-I 1rh A= P) k 2kRTH 3_
P I k k-Il
rnD-ABPB P i2FPo P I'kIP,, k-I [ TB)]
By use of the First Law
2
and
h3 -hB-- UB- =C ,[T3 - TO]-2
By use of the isentropic relationship P1 - Constant,
k-I
the kinetic energy term can be found to be
k-I
u.2 ;---1- (P 3 ]
2 k-I
The enthalpy of state B can be approximated by
hB CpTs,
55

Since the exit pressure for surface B is the inlet prcssure for surface E,
ha a Ps
The values for FD ae found from P3 acting on A1 such that the work on the disk is expnded to
FD(LD - x) PI3AL, (P43AE)2At
At At 2MD
By sumtituting these values back into equation C-9, and knowing the value for hH (found in gas tables),
AE is folly detennined.
We redefine the net change in energy of the control volume by the time increment. Previously AE was
defined by the change in state of control surface. It is also defined by the change in state of the control volume
itself over some tme At. By use of the equations of state before and after At, using a constant volume analysis,
Again, using the Ideal Gas Law,
AE = Pv3 -PIv,,k-i
where the specific volume (reciprocal of the density)
+_V =VV3; M ' +3 M3'
and
M =M3 +(rhH -mrh)At= M + AM.
56

By suotnalon and rmunemeant th predicted preaure P3 is shown to be
P3+P3[Ekl }M +AM). (C-10)
"The results of P+ can be inserted back into equation C-4 for determination of the pneumatic effects of the
transport clamber at the foot of the aluminum tank. The entire process can occur and is advanced one time
Assuming the model was not in error, and the output was believable, then the instabilities in the
aluminum mass flow must be due to some other outside influence on this system. After some research of the
hardware, it was found that the line transporting the aluminum powder was flexible and had severa bends. These
were hypothesized as to be the cause of the fluctuations, and a new straight, rigid pipe should replace the existing
flex line.
A FORTRAN program was run on a PC to simulate the model. With given constants and initial values
for variables, the program was able to simulate the mass flow of aluminum powder out of the aluminum powder
tank, •Uh. The results of this simulation exhibited a steady mass flow rate. Attempts were made to cause the flow
to oscillate. The oscillations were quickly damped and the flow stabilized. This led to the assumption that the
ource of the TRS output fluctuations was induced elsewhere.
It was found that the flexible transport line that carried the aluminum powder from the aluminum powder
tank to the nozzle could be the source of a pressure undulation. A steady sinusoidal forcing function was applied at
the pressure at the nitrogen pressurizer. The effect was to directly influence the mass flow rate. This indicated
that the mass flow rate could be disrupted by an exterior influence. The flexible transport line was replaced by a
rigid copper tube. The resultant TRS output demonstrated a sharp attenuation in the thermal output oscillations.
57

Intentionally Left Blank
58

APPENDIX D: MICROGRAPH DATA OF ALUMINUM POWDER
59

Intentionally Left Blank
60

The mounted stub with an aluminum powder sample for microscopic viewing consisted of two regions, as
seen in Figure D-i. One pan of the stub was painted with carbon adhesive and the remainder left untouched. A
small sample of powder was shaken over the stub. After the adhesive dried, loose particles were shaken off and the
entire mount was sputtered with a thin film of gold. The gold enhanced the topographic contrast and also
improved the adhesion of the particles to the stub.
In the carbon adhesive areas, particles adhered in a dense heterogeneous army. This region, shown in
Figure D-2, provides a sampling of the complete particle size but is probably biased toward larger particles. The
low-magnification micrographs provided a general impression of the range of sizes present in the sample.
In the remaining region, Figures D-3 and D-4, particles of about 10-20 pin in size adhere to the mount by
electrostatic attraction in a fairly uniform dispersion array. This. region provided a better view of the finer
components of the total distibution. Particles larger than about 20 pim did not appear since they will not adhere
this way. However, it is considered that the total array is probably at least qualitatively representative of the
particle distribution below about 20 pm.
The higher magnification micrographs in the nonadhesive region, Figures D-5 and D-6, provided an idea
of the size distribution, shape, and general appearance of the particles. Higher magnifications of both regions
show particle aspect and topography. In general, the fines are not strongly aggregated, but there is some tendency
for the fines to be aggregated to the larger particles. The topography of the large particles show them to be
primarily distinct entities rather than loose aggregations of smaller particles.
61

Figure D-1. Grade 120 aluminum powder mount a, 25X.
Figure D-2. Aluminum powder hetcrogencous region at WOOL(.
62

Fil igr D-.Aumnmvwdrfnerg a OX
Figure D-3. Aluminum pgowder fine region at 100X
63

Figure D-5. Aluminum tvoudcr fine region at I OOOX.
Figure D-6. Aluminum powder fine region at 1500X.
64

N( a( No. of
2 Admiasraor 1 CommanderDefense Technical Info Center U.S. Army Missile CommandATT: DTIC-DDA ATTN: AMSMI-RD-CS-R (DOC)Cameron Staion Redstone Arsenal, AL 35898-5010Alexandia, VA 22304-6145
1 CommanderCommander U.S. Army Tank-Automotive CommandU.S. Army Materiel Command ATTN: AMSTA-JSK (Armor Eng. Br.)ATIN: AMCAM Warren, MI 48397-50005001 Mienhower Ave.Alexandkia, VA 22333-0001 1 Director
U.S. Army TRADOC Analysis CommandDirechor ATTN: ATRC-WSRU.S. Army Research Laboratory White Sands Missile Range, NM 88002-5502ATIN: AMSRL-OP-CI-AD,
Tech aPubhing (0- ',y) I Commandant2800 Powder Mill Rd. U.S. Army Infantry SchoolAdeiphi, MI) 20783-1145 ATMI4: ATSH-CD (Security Mgr.)
Fort Benning, GA 31905-5660DirectorU.S. Army Research Labortory w aly) I CommandantATTN: AMSRL-OP-CI-AD, U.S. Army Infantry School
Records Managemnt ATTN: ATSH-WCB-O2800 Powder Mill Rd. Fort Benning, GA 31905-5000Adelphi, MD 20783-1145
2 Commander Aberdeen Proving GroundU.S. Army Armament Research,Devey pmen, and Engineering Center 2 Dir, USAMSAAATTN: SMCAR-TDC ATTN: AMXSY-DPicatinny Arsenal, NJ 07806-5000 AMXSY-MP, H. Cohen
Director I Cdr, USATECOMBet Weapons Laboraoy ATTN: AMSTE-TCU.S. Army Armament Research,
Development, and Engineering Center 1 Dir, USAERDECATTN.- SMCAR-CCB-TL ATTN: SCBRD-RTWatervliet, NY 12189-4050
1 Cdr, USACBDCOMI Director ATTN: AMSCB-CIIU.S. Army Advanced Systems Research
and Analysis Office (ATCOM) 1 Dir, USARLATTN: AMSAT-R-NR, M/S 219-1 ATTN: AMSRL-SL-IAmes Research CenterMoffett Field, CA 94035-1000 5 Dir, USARL
ATTN: AMSRL-OP-AP-L
65

2 Under Secretary of Defense for Reseach 2 Commanderand Engineering U.S. Army Training & Doctrine Command
ATTN: TWP/OM ATN: Technical LibraryT. Hitchcock ATCD-G, Ni Pastel
Washington, DC 20301-3100 Fort Monroe, VA 23651
2 Director 3 CommanderDefense Advanced Research Projects U.S. Army Armament RD&E Center
Agency ATFN: SMCAR-AEE-WWATTN: Technical Library Pai Lu
T. Hafer N. SlIgg3701 North Fairfax Drive J. PearsonArlington, VA 22203-1714 Picatinny Arsenal, NJ 07806-5000
Director 10 CommanderDefense Intelligence Agency U.S. Army Belvoir RD&E CenterATMN: Technical Library AMTN: Technical LibraryWashington, DC 20301 STRBE-N, Heberein
STRBE-NA, Weaver6 Commander STRBE-BLORE
Defense Y clear Agency STRBE-CFLOATFN: ;. Kennedy STRBE-NE (3 cys)
C. McFarland STRBE-ND, SpitzerC. Gallaway STRBE-NDM, DillonE. Patnaik Fort Belvoir, VA 22060-5606R. RohrG. Ullrich 18 DirectorK Holm U.S. Army Research Laboratory
Washington, DC 20305-1000 ATTN: AMSRL-SS-FF,J. Gerber
HQDA (DAEN-RDZ-A) T. PhamWashington, DC 20310-1000 hi Fong
K. TranHQDA (DAEN-RDM) AMSRL-WT-N,Washington, DC 20310-1000 J. Gwaltney
L. IngramHQDA (SARD-TR/Ms. K. Kimonos) J. McGarnityWashington, DC 20310-0103 AMSRL-WT-NA, R. Kehs
AMSRL-Wr-NB, M. AbeHQDA (SARD-TR/Dr. R. Chait) AMSRL-Wr-ND, J. MilettaWashington, DC 20310-1030 AMSRL-WT-NF, L. Jasper
AMSRL-WT-NG, T. OldhamHQDA (SARD-TT/Ms. C. Nash) AMSRL-Wr-NH, J. CorrriganWashington, DC 20310-0103 AMSRL-SL-C, J. Hughes
AMSRL-SL-CN,HQDA (SARD-TF/Dr. F. Milton) S. ShareWashington, DC 20310-1030 E. Fioravante
R. LingebechNatick RD&E Center 2800 Powder Mill RoadATFN: F. Bissett Adelphi, MD 20783-1145PSD/SATDSTRNC-YSKansas StreetNatick, MA 01760-5020
66

3 Director 2 U.S. Army Cops ofEntmemU.S. Army Research Laboratory Construction Engiering RiesearchATT: Technical Library Laboratory
AMSRL-MA.PA, AMTN: Technica LibnuyW. Haskell C. HerringE. Rips P.O. Box 9005
Watertown, MA 02172-0001 Champaign, IL 61826-9005
Commander II U.S. Army Engineer WaterwaysU.S. Army White Sands Missile Range Experiment StationATTN: STEW-NED, J. Meason ATTN: Technical LibraryWhite Sands Missile Range, NM 88002 k. Ford
I. Davis2 Commander D. Rickman
U.S. Army Tank Automotive Command I. StoutATTN: Technical Library J. Ingram
AMFTA-RSA, T. Mcitzler R. DinanWarren, bl 49397-5000 G. McMahon
P. KingCommander C. JoachimU.S. Army Nuclear and Chemical Agency B. ArmstrongATTN: Technical Library P.O. Box 631
G. Long Vicksburg, MS 39180-0631D. Bach
7150 Heller Loop, Suite 101 1 CommandantSpringfield, VA 22150-3198 U.S. Army Engineer School
ATTN: Technical Library2 Commander Fort Leonard Wood, MO 65473
U.S. Army Concepts Analysis AgencyATTN: Technical Library 1 Commander
M. Ogorzalek U.S. Army Cold Regions R & E Lab8120 Woodmont Ave. ATFN: Technical LibraryBethesda, MD 20814 P.O. Box 282
Hanover, NM 03755CommanderU.S. Army Research Office I U.S. Army Corps of EngineersATTN: Technical Library Omaha DistrictP.O. Box 12211 ATTN: D. NebudaResearch Triangle Park, NC 27709 Mail Code CEMRO-ED-SH
215 N. 17th Street3 Commander Omaha, NE 68102-4971
U.S. Army Foreign Science andTechnology Center 7 Officer In ChargeATTN: T. Reeder Dahlgren Division, Detachment White Oak
G. Goodwin Naval Surface Warfre CenterTechnical Library ATTN: Technical Library
220 7th St., NE F. WarnockCharlotesville, VA 22901-5396 R. Ferguson
K. ChienI Comnmnder J. Collins
U.S. Army DWVay Proving Ground R. PersATTN: Technical Library M. RuppaltDugway, UT 14022 10901 New Hampshire Rd.
Silver Spring, MD 20903-5640
67

3 Commander 2 CommanderDahlgren Division Marine Corps RD&E CommandNaval Surface Warfare Center ATTN: D. VaughnATTN: Technical Library Technical Library
L. Fontenot Quantico, VA 22134-5080J. Brown
17320 Dahigren Road 1 USAF Systems CommandDahlgren, VA 22448-5000 ATIN: Technical Library
Andrews AFB, MD 203342 Commander
Naval Surface Warfare Center 2 USIAWorld NetCarnerock Division ATIN: Technical LibraryATTN: Technical Library J. Ryan
M. Orr Rm. 2410 Patrick Henry BuildingCode 1101 601 D St. NWPhiladelphia, PA 19112-5083 Washington, DC 20547
2 Commander 1 Phillips LaboratoryNaval Research Laboratory ATTN: Technical LibraryATTlN: Technical Library Kirtland AFB, NM 87118-6008
William A. SchmidtWashington, DC 20375 4 Field Command, DNA
ATTN: LCDR Z. MyersCommander CPTM. ScottNaval Surface Warfare Center J. RenickATTN: Technical Library E. Martinez (2 cys)Silver Spring, MD 20903-5000 Kirtland AFB, NM 87115-5000
Commander 1 AFOSRNaval Weapons Center ATTN: Technical LibraryATTN: Technical Library Boiling AFB, DC 20332China Lake, CA 93555-6001
3 WIMNvIMEOfficer-In-Charge ATTN: G. ParsonsNaval EOD Facility J. FosterATIrN: Technical Library Technical LibraryIndian Head, MD 20640 Eglin AFB, FL 32542-5000
4 Commanider 1 DirectorNaval Coastal Systems Center NASA-Science Technical InternationalATFN: XL Demon Facility
C. Wicke P.O. Box 8754MAJ Cutchall BWI Airport, MD 21240Technical Library
Panama City, FL 32407 1 NOAA, Oceanic and Atmospheric ResearchATTN: CPT Smart
2 Director W. CallenderNuclear Effects Directorate 1335 East-West HwyATTN: Technical Library SSMC3, Mailcode R/PDC
J. Briones Silver Spring, MD 20910White Sands Missile Range NM 88002
68

OIE/CSDICRB 3 Allied Contracters, Inc.ATTN: A. NE Jones ATMN: Technical LibraryRm 1413, OHB T. CrawfordWashington, DC 20505 A. Simpson
204 East Preston StreetDirector Baltimore, MD 21202Idaho National LaboratoryATTN: Technical Library 1 The Aluminum Association, Inc.P.O. Box 1625 ATrN: Technical LibraryIdaho Falls, ID, 83415 818 Connecticut Ave. N.W.
Washington, DC 20006DirectorLos Alamos National Laboratory I Aluminum Company of AmericaATTN: Technical Library ATTN: Technical LibraryP.O. Box 1663 1501 Alcoa BuildingLos Alamos, NM 87545 Pittsburg, PA 15219
4 Director 1 ATPALSandia National Laboratories ATTN: Technical LibraryATTN: Technical Library P.O. Box 31
R. Ostensen Flemington, NJ 08822S. SnyderM. Sagartz 2 Anser, Missile Division
P.O. Box 5800 ATTN: Technical LibraryAlbuquerque, NM 87185 R. Leginus
Crystal Gateway 3Director 1215 Jefferson Davis HighwayLawrence Livermore National Laboratory Arlington, VA 22202ATMN: Technical Library
A. Kuhl 1 Applied Research Associates, Inc.P.O. Box 808 ATMN: I. FloreyLivermore, CA 94550 2750 Eisenhower Ave., Suite 104
Alexandria, VA 223142 Aberdeen Research Center
ATfN: J. Keefer 2 Applied Research Associates, Inc.N. Ethridge ATTN: I. Guicm
P.O. Box 548 I. HeymanAberdeen, MD 21001 5941 S. Middlefield Road
Littleton, CO 801232 Advanced Technology and Research Inc.
ATMN: Technical Library I Applied Research Associates, Inc.J. Gott ATTN: J. Drake
14900 Swietzer Lane 3202 Wisconson Ave.Laurel, MD 20707 Vicksburg, MS 39180
Aerospace Corporation 1 Atlantic Research CorporationATrN: Technical Library ATTN: Technical LibraryP.O. Box 92957 5390 Cherokee Ave.Los Angeles, CA 90009 Alexandria, VA 22314
1 Aan Powders and Chemicals I Atomized Metal Powders Inc.ATTN: Technical Library ATMN: Technical LibraryP.O. Box 290 25 East 39th StreetElizabeth, NJ 07207 New York, NY 10016
69

Battelle I FMC CorporationTWSTIAC ATIN: Technical Library505 King Ave. 1105 Coleman Ave.Columbus, OH 43202-2093 San Jose, CA 95108
IBDM Corporation 1 Franklin Research CenterATTN: Technical Library ATI'N: Technical Library7915 Jones Branch Drive Benjamin Franklin ParkwayMcoean, VA 22102 Philadelphia, PA 19103
2 Boeing Helicopters 2 General Sciences, Inc.ATTN: Technical Library ATTN: Technical Library
J. Cosgre M. RileyP.O. Box 16855, MS P30-07 655 S. Gravers RoadPhiladelphia, PA 19142-0858 Plymouth Meeting, PA 19462
2 Boeing Military Airplane Comany 3 IRT CorporationATTN: Technical Library ATTN: Technical Library
R. Lorenz V. DePengerP.O. Box 7730 C. SchuckWichita, KS 67277-7730 101 S. Kreamer Blvd.
Suite 132Booz-Allen & Hamilton Inc. Placentia, CA 92670ATrN- Technical LibraryCrystal Square 2, Suite 1100 1 ITT Research Institute1725 Jefferson Davis Hwy ATTN: Technical LibraryArlington, VA 22202-4158 10 West 35th Street
Chicago, IL 606162 Denver Research Institute
ATI'N: Technical Library 2 IT Aerospace/Optical DivisionL. Brown ATTN: Technical Library
P.O. Box 10127 K. RusterDenver. CO 80210 3700 East Pontiac Street
2 Dynamic Science, Inc. P.O. Box 3700ATTN: S. Zardas Fort Wayne, IN 46803
P. NeumanP.O. Box N 3 The Johns Hopkins UniversityAberdeen, MD 21001 Applied Physics Laboratory
ATTN: Technical Library2 Electrospace Systems, Inc. T. Coughlin
ATTN: Technical Library J. KouroupisS. Parekh Johns Hopkins Road
P.O. Box 831359 Laurel, MD 20707Richardson, TX 75083-1359
1 Kaman Sciences CorporationEMTEC Systems, Inc. ATTN: F. McMullanATTN: J. Lattery 6400 Uptown Blvd, Suite 300E4500 Anaheim Ave, NE B-6 Albuquerque, NM 87110Albuquerque, NM 87113
1 The Kaempfer CompanyEthyl Corporation AITN: W. HermanATTN: Technical Library 1150 18th Street, N.W.Houston Plant, Box 472 Suite 1000Pamdeaa, TX 77501 Washington, D.C. 20036
70

2 Martin Marietta Aerospace 2 Science Applications Internamonal Corp.ATTN: Technical Library ATTN: Technical Library
M. Bauer J. BryarsP.O. Box 179 11526 Sorrento Valley RoadDenver, CO 80201 Suite A
San Diego, CA 921212 McDonnell Douglas Corp.
ATTN: Technical Library 4 Science Applications International Corp.C. Corey ATTN: J. Simmons
Ballistic Missile Defense J. Guest5301 Bolsa Avenue J. DishonHunington Beach, CA 92647 P. Versteegan
P.O. Box 1303Medtherm Corporation 1710 Goodrich Dr.ATTN: Larry Jones McLean, VA 22102P.O. Box 412Huntsville, AL 35804 1 Science Applications International Corp.
ATTN: S. Doerr2 New Mexico Engineering Research Institute 2109 Air Park Rd., SE
ATTN: Technical Library Albuquerque, NM 87106R. Robey
University of New Mexico I Silberline Manufacturing Company, Inc.Albuquerque, NM 87131-1376 ATTN: Technical Library
P.O. Box A2 Olin Ordnance Lansford, PA 18232
ATTN: Technical LibraryJ. Kibiger 2 Simula Government Products Inc.
Product/Material Control ATrN: Technical Library10101-9th Street North W. PerciballiSt. Petersburg, FL 33716 10016 S. 51 st Street
Phoenix, AZ 85044-5299PCIATTN: V. Schmidt 1 Southwest Research Institute900 19th St NW ATTN: Technical LibrarySuite 600 P.O. Drawer 28510Washington D.C. 20006 San Antonio, TX 78284
2 Reynolds Metals Company I SRI InternationalATTN: Technical Library ATTN: Technical Library
N. Koopman 333 Ravenswood Ave.Plant #3, 4101 Camp Ground Rd. Menlo Park, CA 94025Louisville, KY 40211
2 Tech Reps., Inc.3 S-CUBED, Maxwell Laboratories ATTN: F. McMullen
ATTN: Technical Library B. CollinsC. Needham 5000 Marble, N.E., Suite 222K. Schnieder Albuquerque, NM 87110
Albuquerque, NM 871311 Teledyne McCormick Selph
SI/Division of Spectrum 39 ATrN: C. GarrisonATrN: W. Schuman P.O. Box 68831 Satyr Hill Rd, Suite 312 Hollister, CA 95023-0006Baltimore, MD 21234
71

TERA 9 Dir, USAMSAANew Mexico Institute of Technology ATTN: AMSXB-GB, AbelATTN: Technical Library AMXSY-S, CarrollSocorro, NM 87801 AMXSY-GC,
B. Bramwell'ibermogae, Inc C. EissnerATTN: Charles Brookly L. Meredith330 Alleghany St. W. WiedermanFrostburg, MD 21532 A. Wong
LTC HassellTransmet Corporation JTCG-ME, LaGrangeATrN: Technical Library4290 Perimeter Dr. 2 Cmd, USACSTAColumbus, OH 43228 ATTN: STECS-AE-TL, Bindel
STECS-AE-TW, WileyU.S. Bronz Powders. Inc.ATTN: Technical Library 7 Dir, ERDECP.O. Box 31 ATTN: SCDRB-RTT,Route 202 L. BickfordFlemington, NJ 008822 K. Fritz
S. Funk2 University of Maryland at College Park G. Goldsmith
Department of Mechanical Engineering I. MileckiATTN: ENME, I. Swann
. Duncan A. TuretskyJ. Wallace
Rm. 2168 1 Cmdr, USAOC&SEngineering Classroom Building ATTN: Technical LibraryCollege Park, MD 20742-5121
6 Cmdr, USATECOMValimet, Inc. ATTN: AMSTE-SI-FATTN: Technical Library AMSTE-CL431 East Sperry Road AMSTE-EV-OStockton, CA 95206 AMSTE-TA-F
AMSTE-ML4 Walcoff and Associates, Inc. AMSTE-TE-V
ATTN: T. ToysC. Paquette 73 Dir, U.S. Army Research LaboratoryC. Walcoff ATTN: AMSRL-C[-S, A. MarkR. Walden AMSRL-CP-TI, J. Polk
635 Slaters Lane AMSRL-WT-TD, P. KingmanAlexandria, VA 22314 AMSRL-WT-NC,
R. LotteroR. Loucks (40 cys)
Aberdeen Proving Gmund P. Muller (10 cys)R. Thane (10 cys)
CCmd, AMCCOM 3. SullivanATTN: SMCAR-ACW R. RaleyWeapons Systems Concept Team W. WrightBldg. E3516 G. Fergeson
S. SchramelK. OpeakaC. Mermagen
AMSRL-WT-WG, L. Puckett
72

2 Bundesamt/lr Webrtechnik and 2 Ministere de ITEquipmentBeschdffrg Laboratoire d'Essais d.Equipements d'AbrisATFN: K. Kohler ATTN: Technical Library
Technical Library D. FauPostfach 7360 Base de Viroulou - Alvignac5400 Kolenz, Germany 46500 Gramet, France
2 Defense Research Establishment Suffield 2 National Defense Research InstituteATTN: D. Ritzel Weapons Technology Department
Technical Library ATTN: H. AxelssonP.O. Box 4000 Technical LibraryMedicine Hat P.O. Box 98Alberta, TIA 8K6 Canada S-147 00 TUMBA, Sweden
4 DSTO, Materials Research Laboratory 3 Norwegian Defense Construction ServiceATTN: N. Burman Test and Development Section
D. Saunders ATTN: Technical LibraryM. liuckland A. JenssenTechnical Library Oslo mil/Akershus
P.O. Box 50 Oslo, NorwayAscot ValeVictoria, Australia 3032 1 Stores and Clothing Research and
Development Establishment2 Fraunhofer-Institut far Kurzzeitdynamik ATTN: S. Elton
Ernst Mach Institut S. CrossATTN: H. Amann Technical Library
Technical Library Flagstaff Rd.7800 Freiburg, Germany Essex, C02 7SS, UK
2 lndustrieanlagen-Betriebsgesgellschaft mbH 2 Wehrwissenschafliche Dienstselle furATMN Technical Library Sprengmittel und Sondertechnik
H. Diekhoff AMT.: M. KlausAbteilung Finite Berechnungsverfahren L. KlubertEinsteinstralle 20, D-8012 Ottobrunn Technical Library
Oberjettenbcrg7 Ministry of Defense 8230 Schneizlreuth, Germany
Atomic Weapons EstablishmentATTN: M. German 2 Wehrwissenschafiliche Dienstselle der
I. Threadgold Bundeswehr far ABC-SchutzW. Babbage ATTN: W. RehmannB. Bogartz Technical LibraryI. Smith Humboltstrale/Postfach 1142I. Tate 3042 MOnster, GermanyM. KingTechnical Library I Dewey McMillan & Associates, Ltd.
Foulws, Essex, SS3 9XE, UK AMTN: I. Dewey1741 Feltham Road
4 Ministre de la Defense Victoria, BC V8N 2A4, CanadaCentre d'Etude de GramatATTN: S. Gratias
E. CantonD. MergnatTechnical Library
46500 Grnmat, France
73

INTENTONALLY LEFF BLALNK.
74

USER EVALUATION SHEET/CHANGE OF ADDRESS
This Laboratory undertakes a continuing effort to improve the quality of the reports it publishes. Yourcomnents/answers to the items/questions below will aid us in our efforts.
1. ARLReportNumber ARL-TR-501 Date of Report Augat 19QQ9
2. Date ReportReceived
3. Does this report satisfy a need? (Comment on purpose, related project, or other area of interest forwhich the report will be used.)_
4. Specifically, how is the report being used? (Information source, design data, procedure, source ofideas, etc.)
5. Has the infornation in this report led to any quantitative savings as far as man-hours or dollars saved,operating costs avoided, or efficiencies achieved, etc? If so, please elaborate.
6. General Comments. What do you think should be changed to improve future reports? (Indicatechanges to organization, technical content, format, etc.)
Organization
CURRENT NameADDRESS
Street or P.O. Box No.
City, State, Zip Code
7. If indicating a Change of Address or Address Correction, please provide the Current or Correct addressabove and the Old or Incorrect address below.
Organization
OLD NameADDRESS
Street or P.O. Box No.
City, State, Zip Code
(Remove this sheet, fold as indicated, tape closed, and mail.)(DO NOT STAPLE)

DEPARTMENT OF THE ARMY NO POSTAGE
NECESSARYF MAILEDOFFICIAL BUSIESS INATHE
UNITED STATES
BUSINESS REPLY MAILFIRST CLASS PERMIT NO 0001, APG, MD
Poatsge w•i be paid by Wdide
DirectorU.S. Army Research LaboratoryATTN: AMSRL-OP-AP-LAberdeen Proving Ground, MD 21005-5066
; i i