Pertamina at a Glance
18
3Q2015 (Unaudited) Highlight CONFIDENTIAL AND PROPRIETARY This material is prepared solely for this session and not for distribution. Any use of this material without specific permission of PERTAMINA is strictly prohibited. Pertamina Securing energy for Indonesia’s growth
Transcript of Pertamina at a Glance

PRINTING INSTRUCTIONS
CHECK TOC BEFORE PRINTING
Color/grayscale: Color (regardless of printing in b/w)
Scale to fit paper: OFF
Print hidden slides: OFF
POWERPOINT OPTIONS > ADVANCED > PRINT
Print in background: OFF
3Q2015 (Unaudited) Highlight
CONFIDENTIAL AND PROPRIETARY
This material is prepared solely for this session and not for distribution.
Any use of this material without specific permission of PERTAMINA is strictly prohibited.
Pertamina
Secur ing energy fo r Indonesia ’s g rowth

FINAL DRAFT
Pertamina at a Glance
1
Key Highlights
3Q2015 EBITDA: USD3.55bn
28,104 employees
2014 financial performance
− Revenue: USD70.65bn
− EBITDA: USD5.83bn
− Net income: USD1.53bn
3Q2015 financial performance
− Revenue: USD32.00bn
− EBITDA: USD3.55bn
− Net income: USD0.92bn
3Q2015 cash balance of USD4.15bn
3Q2015 undrawn credit lines of USD6.66bn
Pertamina has a critical role in Indonesia’s energy sector
Downstream
Summary of Pertamina Operations
Upstream
Estimated 2P reserves of 5,125 mmboe
− 74% proven
− 49% oil
− 86% domestic operation
International presence with six working areas in three countries
− Malaysia, Iraq and Algeria
Oil production of 276.77mboe/d, gas production of 1.73 bcf/d (298.6mboe/d)
Dominant Indonesia refiner with 6 refineries and total capacity of 1,031mbbls/d
Average Nelson Complexity Index of 5.4
Refined products slate cater to 66% of domestic demand (2014)
Leading provider in subsidized and non-subsidized fuel, industrial fuel, LPG and lubricants
Unmatched distribution network in Indonesia including
− 5,283 retail fuel stations
− 591 LPG filling plants
Other infrastructure including
− 206 vessels
− 199 fuel terminals, aviation fuel units, LPG terminals & depots and lubricant oil blending plants
Geothermal
14 geothermal working areas
Total installed capacity of 437MW (own operation) from 4 operating areas
Estimated 2P reserves of 1,550MW
Oil and Gas
Note: List of assets is not exhaustive. All figures as of 3Q15 unless stated otherwise
Gas, New & Renewable Energy
Extensive gas transmission and distribution pipelines totaling 1,624km
Six LNG/regas plants across Indonesia
Evaluating opportunities to expand into renewables and green fuels
Refining and Marketing
Others
Oil field and drilling services
Source: Pertamina
Down-stream 27%
Upstream 73%

FINAL DRAFT
Pertamina’s Operations Across the Value Chain
2
PT Pertamina Hulu Energi (“PHE”)
PT Pertamina Geothermal Energy (“PGE”)
PT Pertamina Internasional Eksplorasi &
Produksi
PT Elnusa Tbk
Trading/export
Gas trading/transmission
LNG plants
Distribution through fuel depots
and stations: Kerosene,
Gasoline, Diesel, HSD, LPG
Upstream
Refining Marketing & Trading
Marketing and trading
Exports to other countries
Electricity distributor
Power plants
Process
LNG
trading
Exploration,
development
and production
domestically
and overseas
Drilling
services
Transmission lines
Production facilities Steam
Production facilities
Refined products
Crude oil
Petrochemical
products
LPG
LNG
LNG shipping
Electricity
Crude oil
Geothermal
Refineries
Petrochemical
facilities
LPG plants
Key operating companies
Upstream Gas, New and Renewable Energy Downstream
PT Geothermal Energy (PGE)
PT Pertamina Drilling Services
Indonesia (PDSI)
PT Pertamina Gas
PT Nusantara Regas
PT Pertamina Trans
Kontinental
PT Pertamina Retail
PT Pertamina Lubricants
PT Pertamina Patra Niaga
Crude oil and refined product imports
Natural
gas
Downstream
PT Pertamina EP (“PEP”)
PT Pertamina EP Cepu (“PEPC”)
PT Pertamina Hulu Energy (PHE)
PT Pertamina International EP (“PIEP”)
Pertamina is the only energy company in Indonesia that operates across the entire energy value chain with operations
that are continually enhanced with development of reserves and refinery capacity expansions and upgrades
Note: Illustration of activities not comprehensive and does not reflect Pertamina’s organizational structure Source: Pertamina

FINAL DRAFT
Indonesia oil and gas balance going forward
Indonesia domestic assets not sufficient to fulfil domestic demand
3
Indonesia crude oil production and oil demand (kb/d)
0
500
1000
1500
2000
2500
2000 2005 2010 2015 2020 2025
Crude exports Refining - domestic Oil demand
Turned net oil importer
Left OPEC
Domestic production
Source: Wood Mackenzie
FINAL DRAFT
10,360
2,067
889
374 327 308 186
1,364 1,267
253 67 30 5 91
mn p
ax
US
Dbn
GDP Population
1,172 1,327
1,563 1,563 1,729
2,008
2000 2005 2014 2015E 2020E 2025E
4
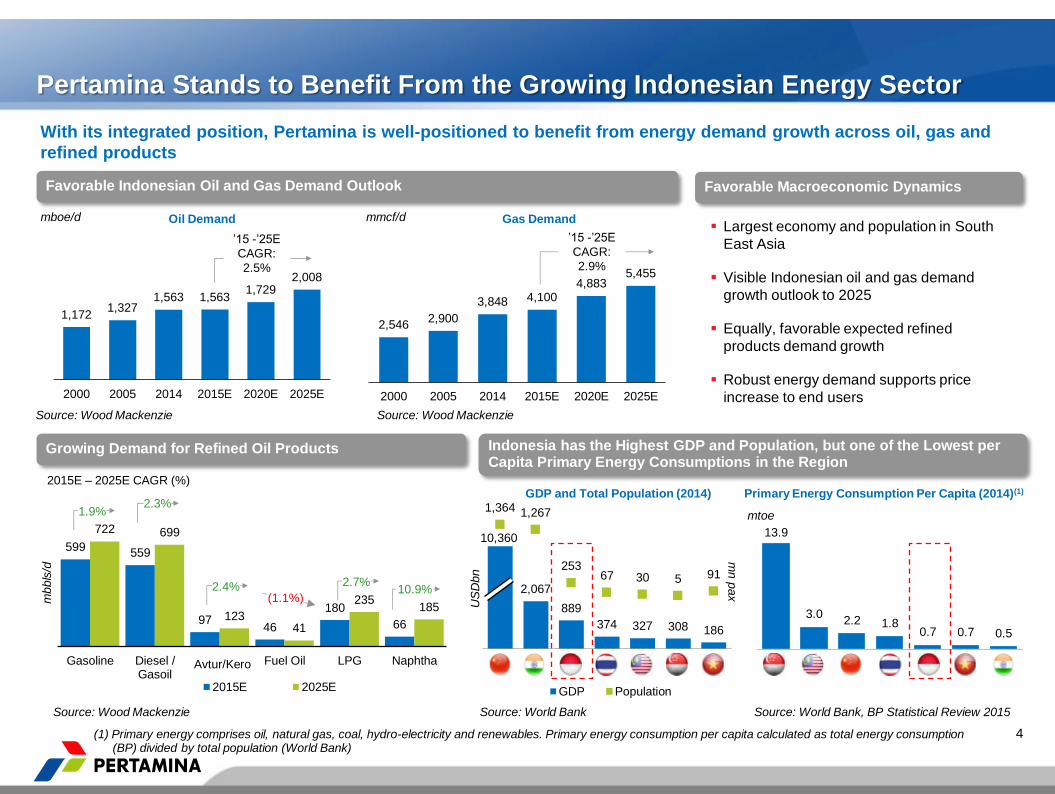
With its integrated position, Pertamina is well-positioned to benefit from energy demand growth across oil, gas and
refined products
Favorable Indonesian Oil and Gas Demand Outlook
mboe/d mmcf/d Oil Demand Gas Demand
’15 -’25E
CAGR:
2.5%
’15 -’25E
CAGR:
2.9%
mbbls
/d
2,546 2,900
3,848 4,100 4,883
5,455
2000 2005 2014 2015E 2020E 2025E
599 559
97 46
180
66
722 699
123 41
235 185
Gasoline Diesel /Gasoil
Jet / Kero Fuel Oil LPG Naphtha
2015E 2025E
Favorable Macroeconomic Dynamics
Largest economy and population in South
East Asia
Visible Indonesian oil and gas demand
growth outlook to 2025
Equally, favorable expected refined
products demand growth
Robust energy demand supports price
increase to end users
Pertamina Stands to Benefit From the Growing Indonesian Energy Sector
2015E – 2025E CAGR (%)
Source: Wood Mackenzie
Source: Wood Mackenzie
Indonesia has the Highest GDP and Population, but one of the Lowest per Capita Primary Energy Consumptions in the Region
GDP and Total Population (2014)
Source: Wood Mackenzie
Source: World Bank
Primary Energy Consumption Per Capita (2014)(1)
Source: World Bank, BP Statistical Review 2015
(1) Primary energy comprises oil, natural gas, coal, hydro-electricity and renewables. Primary energy consumption per capita calculated as total energy consumption (BP) divided by total population (World Bank)
Growing Demand for Refined Oil Products
1.9% 2.3%
2.4% 2.7% 10.9%
(1.1%)
13.9
3.0 2.2 1.8
0.7 0.7 0.5
mtoe
Avtur/Kero
FINAL DRAFT
299
34
173 130 122
277
272 48
31 21
575
306
220
161 143
mboe/d
Gas Oil
Domestic 496 86%
Overseas 79
14%
Sumatra 2,120 41%
Java 1,824 36%
East Indonesia
767 15%
Overseas 413 8%
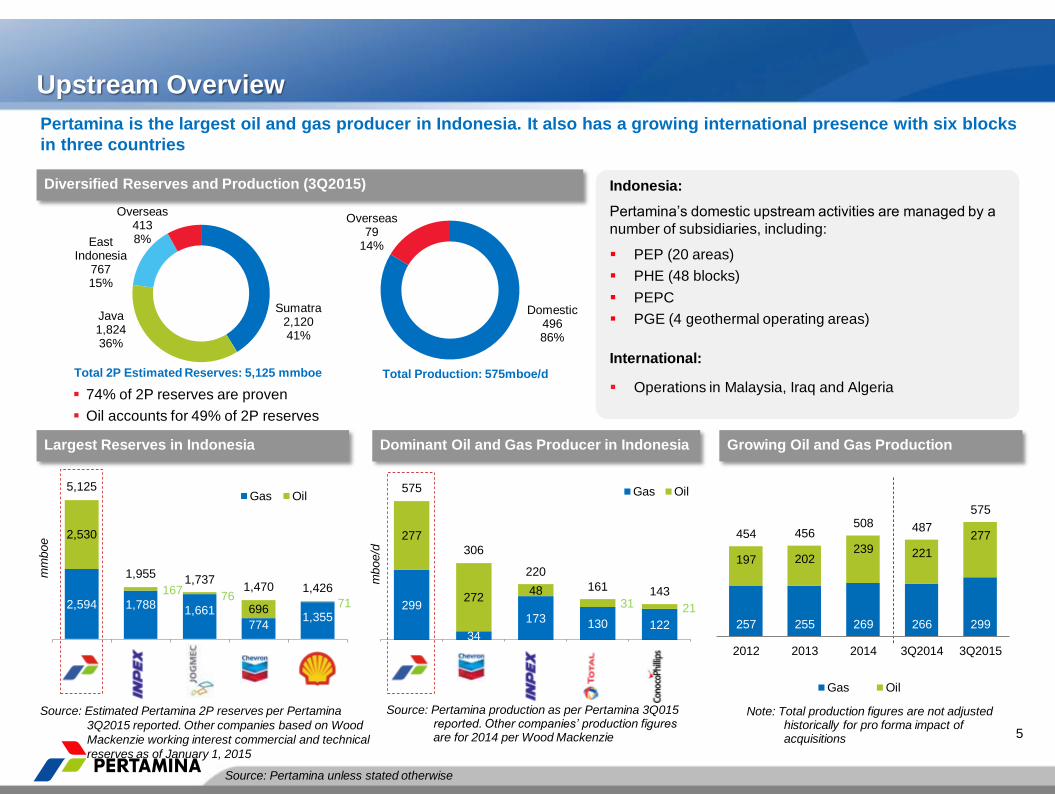
Largest Reserves in Indonesia
5
Growing Oil and Gas Production
Upstream Overview
74% of 2P reserves are proven
Oil accounts for 49% of 2P reserves
Diversified Reserves and Production (3Q2015)
Source: Estimated Pertamina 2P reserves per Pertamina
3Q2015 reported. Other companies based on Wood
Mackenzie working interest commercial and technical
reserves as of January 1, 2015
Total 2P Estimated Reserves: 5,125 mmboe Total Production: 575mboe/d
Pertamina is the largest oil and gas producer in Indonesia. It also has a growing international presence with six blocks
in three countries
Indonesia:
Pertamina’s domestic upstream activities are managed by a
number of subsidiaries, including:
PEP (20 areas)
PHE (48 blocks)
PEPC
PGE (4 geothermal operating areas)
International:
Operations in Malaysia, Iraq and Algeria
Dominant Oil and Gas Producer in Indonesia
Source: Pertamina production as per Pertamina 3Q015 reported. Other companies’ production figures are for 2014 per Wood Mackenzie
Source: Pertamina unless stated otherwise
Note: Total production figures are not adjusted historically for pro forma impact of acquisitions
2,594 1,788 1,661
774 1,355
2,530
167 76
696 71
5,125
1,955 1,737
1,470 1,426
mm
boe
Gas Oil
257 255 269 266 299
197 202 239 221
277 454 456 508 487
575
2012 2013 2014 3Q2014 3Q2015
Gas Oil

FINAL DRAFT
6
Global Upstream Expansion
Pertamina is expanding across the globe to secure assets in areas where it can compete
FINAL DRAFT
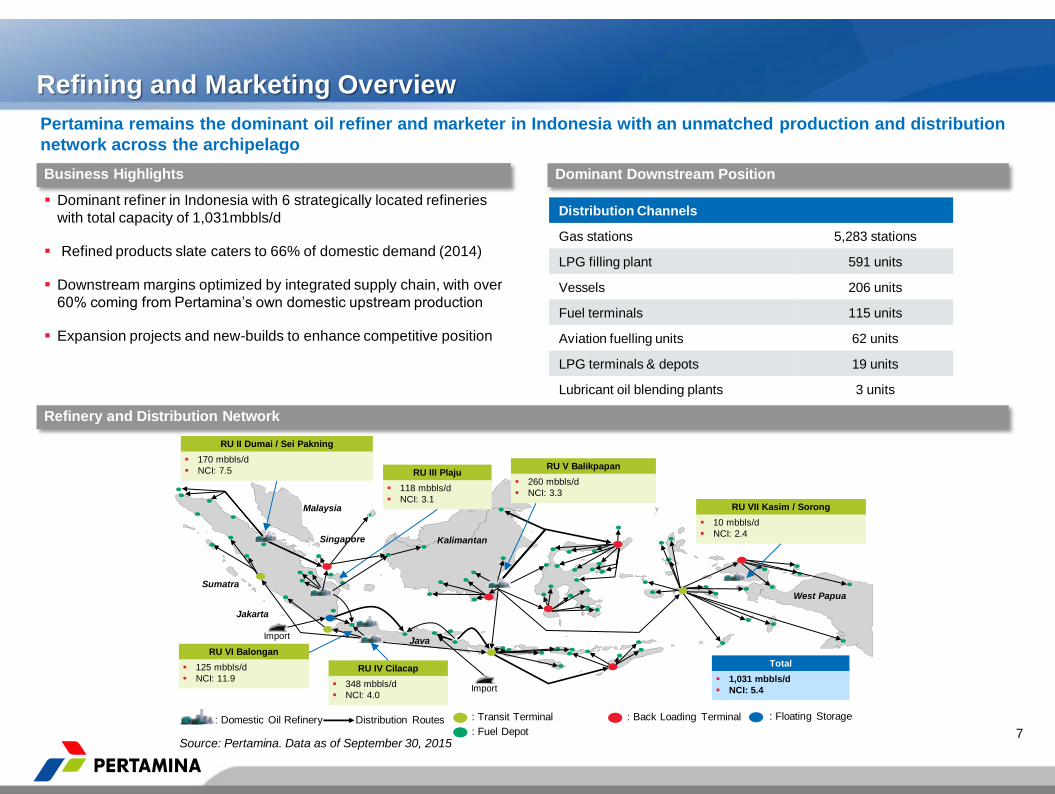
Refining and Marketing Overview
7
Business Highlights Dominant Downstream Position
Refinery and Distribution Network
Dominant refiner in Indonesia with 6 strategically located refineries
with total capacity of 1,031mbbls/d
Refined products slate caters to 66% of domestic demand (2014)
Downstream margins optimized by integrated supply chain, with over
60% coming from Pertamina’s own domestic upstream production
Expansion projects and new-builds to enhance competitive position
Distribution Channels
Gas stations 5,283 stations
LPG filling plant 591 units
Vessels 206 units
Fuel terminals 115 units
Aviation fuelling units 62 units
LPG terminals & depots 19 units
Lubricant oil blending plants 3 units
Source: Pertamina. Data as of September 30, 2015
Pertamina remains the dominant oil refiner and marketer in Indonesia with an unmatched production and distribution
network across the archipelago
: Domestic Oil Refinery Distribution Routes : Transit Terminal
: Fuel Depot
: Back Loading Terminal
RU VI Balongan
125 mbbls/d
NCI: 11.9 RU IV Cilacap
348 mbbls/d
NCI: 4.0
RU V Balikpapan
260 mbbls/d
NCI: 3.3
RU VII Kasim / Sorong
10 mbbls/d
NCI: 2.4
RU II Dumai / Sei Pakning
170 mbbls/d
NCI: 7.5 RU III Plaju
118 mbbls/d
NCI: 3.1
Total
1,031 mbbls/d
NCI: 5.4
Sumatra
Malaysia
Kalimantan
West Papua
Java
Jakarta
Singapore
v
Import
Import
: Floating Storage

FINAL DRAFT
Gas, New & Renewable Energy Overview
8
Pertamina has a comprehensive presence across the gas value chain (production, sourcing domestically and
internationally, infrastructure development and commercialization) and is developing new & renewable energy
Sourcing and
trading
Transmission
and
distribution
Processing LNG
Infrastructure Marketing
Gas, New &
Renewable
Energy
Source: Pertamina
Pertamina Gas
Trading, storage and
transportation of natural gas
through pipeline network
1,624 km of gas pipelines
PT Badak (Bontang) (17mmtpa)
LNG provider Kalimantan
Donggi Senoro (DS) LNG (2mmtpa)
LNG provider Sulawesi
PT Perta Daya Gas
LNG provider Indonesia Timur
Mini LNG storage and regas
Future plans
Evaluating
opportunities to expand
into gas-fired and
renewable power
generation as well as
implementing green
fuel / diesel technology
PT Nusantara Regas (3mmtpa)
Operation and development of
storage facilities and regas
terminals
PT Perta Arun Gas
LNG receiving terminal and regas
PT Perta Samtan Gas
LPG plant
Gas Business

FINAL DRAFT
9
Focused On Strong Corporate Governance and Transparency
Pertamina applies the principle of Good Corporate Governance (“GCG”) throughout its functions, such as Board of
Commissioners, Board of Directors, Internal Audit, Legal Counsel and Compliance and other relevant functions
Transparency
Accountability
Responsibility Independency
Fairness Pertamina’s
GCG Principles
Awarded Best SOE in Controlling Gratification,
Reflective of Healthy GCG Assessment Score(2)
Independently Managed Whistle Blowing
System (“WBS”)
Implementation of a Gratification Control
Program under Compliance
Follow Up Completed
36
Under Investigation
23 59 Reports
Received
(2014)
Resolved by Company
141
Sent to KPK(1)
Authority 75
216
Reports
Received
(2014) 83.56
86.79
91.85
93.51 94.27 94.43
2009 2010 2011 2012 2013 2014
(1) Corruption Eradication Commission
(2) Awarded by the Corruption Eradication Commission
Source: Pertamina
Implementation of GCG as Part of Pertamina’s Transformation
1,706 LHKPN
(Wealth Report of State Official)
Compulsory report related to the
Board of Directors, Board of
Commissioners and managerial
level
95.2% of the 1,792 total
compulsory reports target in
2014 (63.2% in 2013)
71.62
ASEAN SCORE CARD 2014
Assessment by the Indonesian Institute
for Corporate Directorship, comparing
GCG implementation in Pertamina with
public companies in ASEAN, based on
instruction from Board of
Commissioners
%
FINAL DRAFT
5-p
ron
ge
d s
tra
teg
y
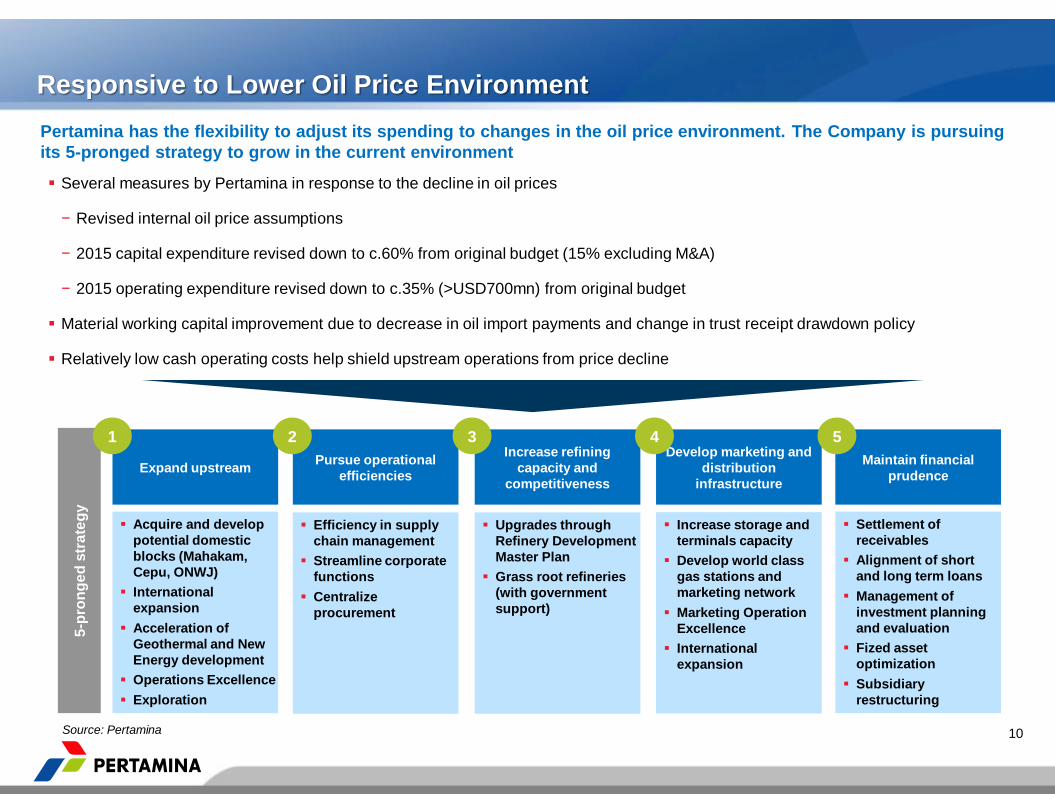
Responsive to Lower Oil Price Environment
10
Pertamina has the flexibility to adjust its spending to changes in the oil price environment. The Company is pursuing
its 5-pronged strategy to grow in the current environment
Several measures by Pertamina in response to the decline in oil prices
− Revised internal oil price assumptions
− 2015 capital expenditure revised down to c.60% from original budget (15% excluding M&A)
− 2015 operating expenditure revised down to c.35% (>USD700mn) from original budget
Material working capital improvement due to decrease in oil import payments and change in trust receipt drawdown policy
Relatively low cash operating costs help shield upstream operations from price decline
Expand upstream Maintain financial
prudence
Acquire and develop
potential domestic
blocks (Mahakam,
Cepu, ONWJ)
International
expansion
Acceleration of
Geothermal and New
Energy development
Operations Excellence
Exploration
Settlement of
receivables
Alignment of short
and long term loans
Management of
investment planning
and evaluation
Fized asset
optimization
Subsidiary
restructuring
1
Pursue operational
efficiencies
Efficiency in supply
chain management
Streamline corporate
functions
Centralize
procurement
2 Increase refining
capacity and
competitiveness
Upgrades through
Refinery Development
Master Plan
Grass root refineries
(with government
support)
3 Develop marketing and
distribution
infrastructure
Increase storage and
terminals capacity
Develop world class
gas stations and
marketing network
Marketing Operation
Excellence
International
expansion
4 5
Source: Pertamina
FINAL DRAFT
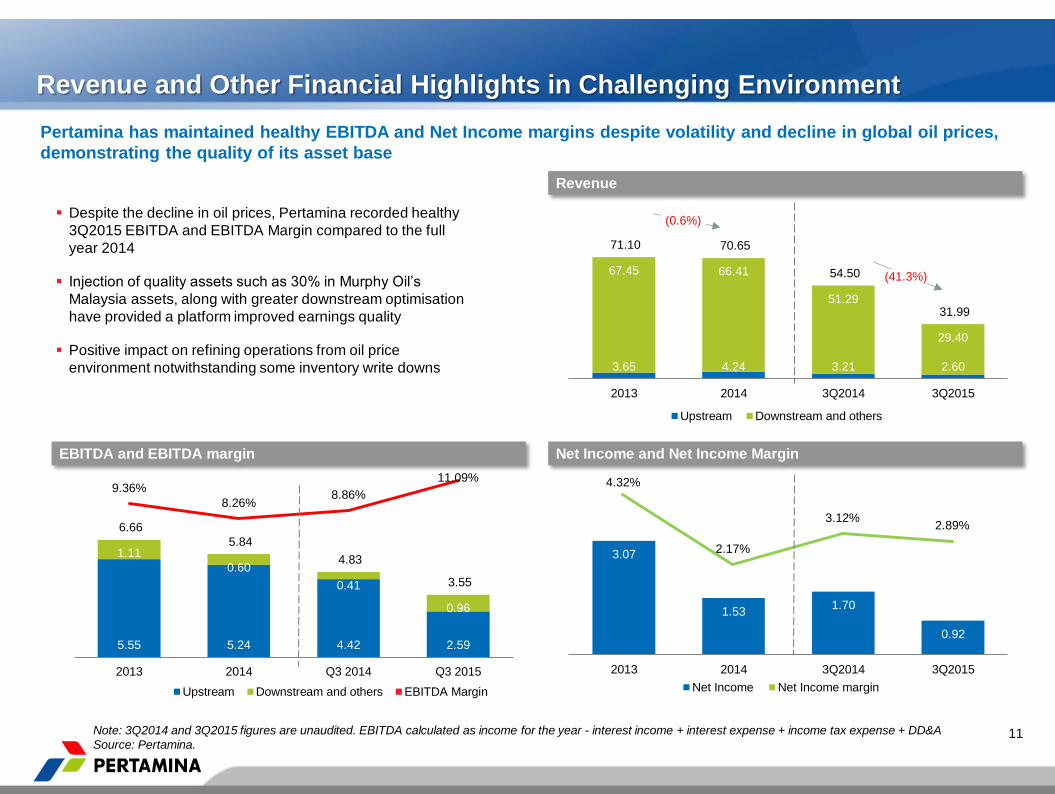
5.55 5.24 4.42 2.59
1.11
0.60
0.41
0.96
6.66
5.84
4.83
3.55
2013 2014 Q3 2014 Q3 2015
Upstream Downstream and others EBITDA Margin
3.07
1.53 1.70
0.92
2013 2014 3Q2014 3Q2015
Net Income Net Income margin
4.32%
2.17%
3.12% 2.89%
3.65 4.24 3.21 2.60
67.45 66.41
51.29
29.40
71.10 70.65
54.50
31.99
2013 2014 3Q2014 3Q2015
Upstream Downstream and others
Revenue and Other Financial Highlights in Challenging Environment
Revenue
EBITDA and EBITDA margin Net Income and Net Income Margin
Note: 3Q2014 and 3Q2015 figures are unaudited. EBITDA calculated as income for the year - interest income + interest expense + income tax expense + DD&A
Source: Pertamina. 11
Despite the decline in oil prices, Pertamina recorded healthy
3Q2015 EBITDA and EBITDA Margin compared to the full
year 2014
Injection of quality assets such as 30% in Murphy Oil’s
Malaysia assets, along with greater downstream optimisation
have provided a platform improved earnings quality
Positive impact on refining operations from oil price
environment notwithstanding some inventory write downs
Pertamina has maintained healthy EBITDA and Net Income margins despite volatility and decline in global oil prices,
demonstrating the quality of its asset base
(0.6%)
(41.3%)
9.36%
8.26% 8.86%
11.09%
FINAL DRAFT
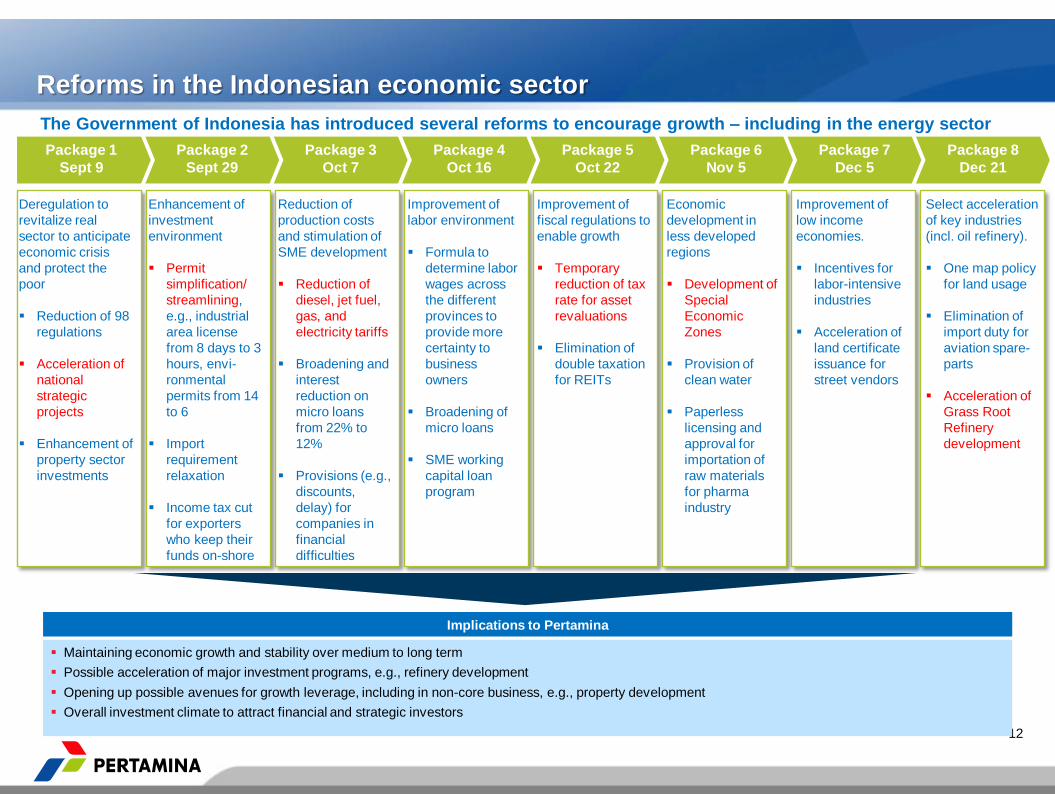
Reforms in the Indonesian economic sector
The Government of Indonesia has introduced several reforms to encourage growth – including in the energy sector
12
Implications to Pertamina
Maintaining economic growth and stability over medium to long term
Possible acceleration of major investment programs, e.g., refinery development
Opening up possible avenues for growth leverage, including in non-core business, e.g., property development
Overall investment climate to attract financial and strategic investors
Package 1
Sept 9
Deregulation to
revitalize real
sector to anticipate
economic crisis
and protect the
poor
Reduction of 98
regulations
Acceleration of
national
strategic
projects
Enhancement of
property sector
investments
Enhancement of
investment
environment
Permit
simplification/
streamlining,
e.g., industrial
area license
from 8 days to 3
hours, envi-
ronmental
permits from 14
to 6
Import
requirement
relaxation
Income tax cut
for exporters
who keep their
funds on-shore
Reduction of
production costs
and stimulation of
SME development
Reduction of
diesel, jet fuel,
gas, and
electricity tariffs
Broadening and
interest
reduction on
micro loans
from 22% to
12%
Provisions (e.g.,
discounts,
delay) for
companies in
financial
difficulties
Improvement of
labor environment
Formula to
determine labor
wages across
the different
provinces to
provide more
certainty to
business
owners
Broadening of
micro loans
SME working
capital loan
program
Improvement of
fiscal regulations to
enable growth
Temporary
reduction of tax
rate for asset
revaluations
Elimination of
double taxation
for REITs
Economic
development in
less developed
regions
Development of
Special
Economic
Zones
Provision of
clean water
Paperless
licensing and
approval for
importation of
raw materials
for pharma
industry
Improvement of
low income
economies.
Incentives for
labor-intensive
industries
Acceleration of
land certificate
issuance for
street vendors
Select acceleration
of key industries
(incl. oil refinery).
One map policy
for land usage
Elimination of
import duty for
aviation spare-
parts
Acceleration of
Grass Root
Refinery
development
Package 8
Dec 21
Package 7
Dec 5
Package 6
Nov 5
Package 5
Oct 22
Package 4
Oct 16
Package 3
Oct 7
Package 2
Sept 29
FINAL DRAFT
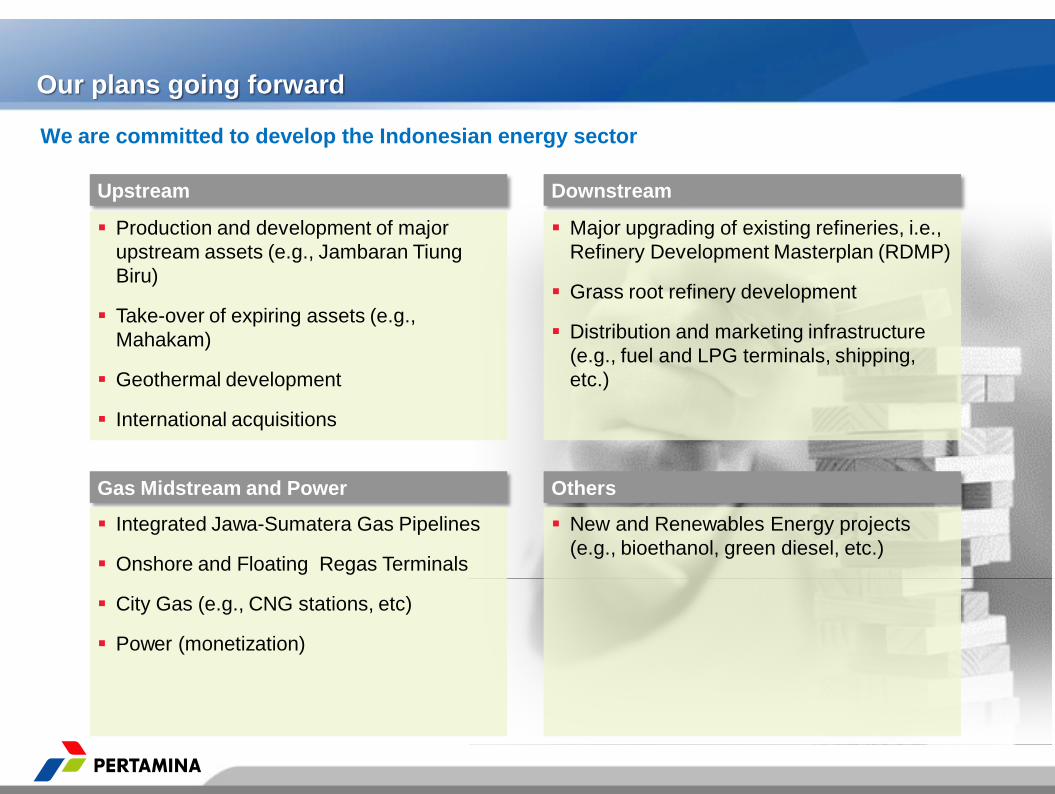
Our plans going forward
We are committed to develop the Indonesian energy sector
Upstream Downstream
Gas Midstream and Power Others
Production and development of major
upstream assets (e.g., Jambaran Tiung
Biru)
Take-over of expiring assets (e.g.,
Mahakam)
Geothermal development
International acquisitions
Major upgrading of existing refineries, i.e.,
Refinery Development Masterplan (RDMP)
Grass root refinery development
Distribution and marketing infrastructure
(e.g., fuel and LPG terminals, shipping,
etc.)
Integrated Jawa-Sumatera Gas Pipelines
Onshore and Floating Regas Terminals
City Gas (e.g., CNG stations, etc)
Power (monetization)
New and Renewables Energy projects
(e.g., bioethanol, green diesel, etc.)

FINAL DRAFT
Peer
Median:
Asian E&P
Peer
Median:
Asian R&M
Note: The information presented is based solely on publicly available data and may not be accurate or comprehensive as any new issuances or retirements registered between now
and the last filing date may not be captured.
Source: Bloomberg. Data as of April 15, 2015.
Our historical financing strategy
Currently Pertamina has a balanced financing profile – primarily tapping corporate loan and bond investors
52%
100%
85%
79%
23% 23%
100% 99%
91% 90%
84% 82%
64% 64%
48%
59%
48%
48% 15% 21% 77% 77%
1%
9% 10% 16% 18% 36% 36% 52% 41% 52%
Integrated Oils – Asia Integrated Oils – Global
While Pertamina’s debt portfolio is well diversified, refinancing upcoming loan maturities with bonds could help better align the debt-to-
bond mix with peers.
Pertamina’s Debt Portfolio is Well Diversified
Bond and Loan Mix
Peer Average (Integrated Oils – Asia): 62% 38%
Peer Average (Integrated Oils – Global: 80% 20%
Bond Loan
14
Pertamina

FINAL DRAFT
Our financing gesture going forward
Diversification of financing sources and matching the right financing with the different needs of our businesses
1970’s Outlook 1980’s 1990’s 2000’s
today
Global
Bond
Project
Financing
Corporate
Loan
Historical Financing Schemes Selection of Financing Scheme Going Forward
Continuing diversification of financing base while continuing to
maintain the commitment to existing lender and investor base
Matching of financing with different project profiles (recently
amended covenant to enable them), e.g.,
− Long maturity instruments for long-tenured investments (e.g.,
upstream investments)
− Project/structured financing for large downstream projects
based on respective assets (e.g., refinery upgrades, grass
root refineries)
Exploring different sources of financing as it permits
− Asset based financing, e..g, Reserve Based Lending
− Joint venture equity participation for large scale projects
− Possible equity financing for select subsidiaries, e.g., non
core subsidiaries
Initially resorting to project finance
In the past decade moved towards corporate loan and global
bond leveraging overall corporate balance sheet
15
FINAL DRAFT
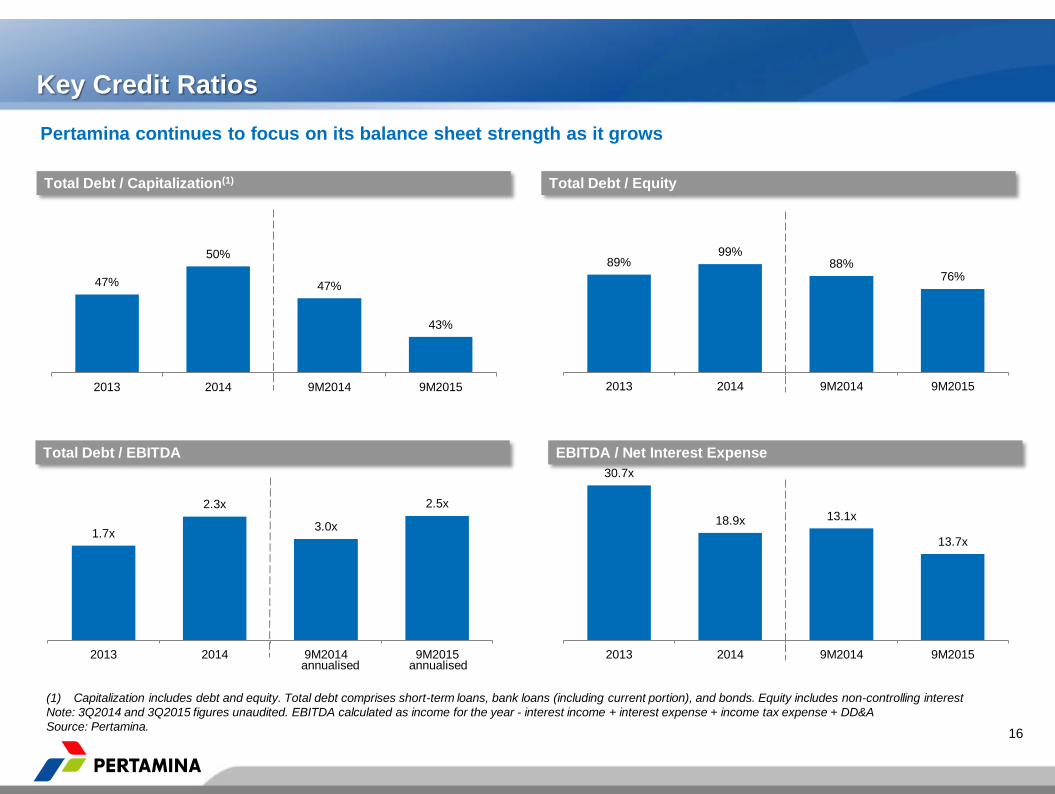
89% 99%
88% 76%
2013 2014 9M2014 9M2015
Key Credit Ratios
Total Debt / Capitalization(1)
Total Debt / EBITDA
Total Debt / Equity
EBITDA / Net Interest Expense
16
(1) Capitalization includes debt and equity. Total debt comprises short-term loans, bank loans (including current portion), and bonds. Equity includes non-controlling interest
Note: 3Q2014 and 3Q2015 figures unaudited. EBITDA calculated as income for the year - interest income + interest expense + income tax expense + DD&A
Source: Pertamina.
Pertamina continues to focus on its balance sheet strength as it grows
annualised annualised
47%
50%
47%
43%
2013 2014 9M2014 9M2015
1.7x
2.3x
3.0x
2.5x
2013 2014 9M2014 9M2015
30.7x
18.9x 13.1x
13.7x
2013 2014 9M2014 9M2015
Thank You
Refinery Unit VI Balongan