
Perspectives October 2015 - Research and Perspectives -...
12
Perspectives October 2015 John Vibert Managing Director, Co-Head, Structured Products RMBS—After the Flood Part I: A Second Look at Legacy Assets In the immediate aftermath of the financial crisis, the promise of unlevered double- digit returns precipitated an influx of crossover investors to the legacy non-agency RMBS sector. Over the past seven years, non-agency RMBS have indeed delivered standout performance, but as spreads have tightened, investors have increasingly questioned whether value remains in this opaque and historically tainted asset class. Our response to this question is an emphatic “yes.” The legacy non-agency RMBS market remains a $650+ billion repository of yield and spread in a fixed income landscape that is increasingly devoid of both. While spreads are tighter than they were in the years following the financial crisis, the risks are commensurately lower as well. Part I of this series looks at the legacy RMBS asset class. After providing an overview of key post-crisis developments, including policy and regulatory risks, this paper examines the sector’s favorable fundamental and technical underpinnings and follows with an update on litigation strategies, where recent developments have been adverse. We conclude by highlighting investments, including re-securitization strategies, that we believe offer superior risk/reward for investors willing to stay the course. A Post-Crisis Review of Legacy RMBS As the floodwaters of the financial crisis receded, opportunistic investors waded into the legacy non-agency RMBS sector as security prices plunged in response to the twin challenges of eye-watering fundamentals and relentless market technicals. While non-agency RMBS were perhaps the most dislocated of structured products at that time, similar, albeit less compelling, opportunities also presented themselves in CMBS and, to a lesser extent, in ABS. As markets emerged from the financial crisis, spreads tightened massively across all risk assets, but RMBS stand out as the best performer since the nadir of 2009. While other markets, notably CLOs and CMBS, have rebounded in recent years and again enjoy a robust primary issuance marketplace, the RMBS market remains a legacy market. This dichotomy is frustrating to some, and perplexing to policy makers who fail to appreciate the depth of investor grievances, yet we believe that investors are well justified in drawing a distinction between RMBS and other asset-backed markets.
Transcript of Perspectives October 2015 - Research and Perspectives -...

Perspectives October 2015
John Vibert
Managing Director,
Co-Head, Structured Products
RMBS—After the Flood Part I: A Second Look at Legacy Assets
In the immediate aftermath of the financial crisis, the promise of unlevered double-
digit returns precipitated an influx of crossover investors to the legacy non-agency
RMBS sector. Over the past seven years, non-agency RMBS have indeed delivered
standout performance, but as spreads have tightened, investors have increasingly
questioned whether value remains in this opaque and historically tainted asset
class. Our response to this question is an emphatic “yes.”
The legacy non-agency RMBS market remains a $650+ billion repository of yield
and spread in a fixed income landscape that is increasingly devoid of both. While
spreads are tighter than they were in the years following the financial crisis, the risks
are commensurately lower as well.
Part I of this series looks at the legacy RMBS asset class. After providing an
overview of key post-crisis developments, including policy and regulatory risks, this
paper examines the sector’s favorable fundamental and technical underpinnings
and follows with an update on litigation strategies, where recent developments have
been adverse. We conclude by highlighting investments, including re-securitization
strategies, that we believe offer superior risk/reward for investors willing to stay the
course.
A Post-Crisis Review of Legacy RMBS
As the floodwaters of the financial crisis receded, opportunistic investors waded into the
legacy non-agency RMBS sector as security prices plunged in response to the twin
challenges of eye-watering fundamentals and relentless market technicals. While non-agency
RMBS were perhaps the most dislocated of structured products at that time, similar, albeit
less compelling, opportunities also presented themselves in CMBS and, to a lesser extent, in
ABS. As markets emerged from the financial crisis, spreads tightened massively across all
risk assets, but RMBS stand out as the best performer since the nadir of 2009.
While other markets, notably CLOs and CMBS, have rebounded in recent years and again
enjoy a robust primary issuance marketplace, the RMBS market remains a legacy market.
This dichotomy is frustrating to some, and perplexing to policy makers who fail to appreciate
the depth of investor grievances, yet we believe that investors are well justified in drawing a
distinction between RMBS and other asset-backed markets.

Perspectives—2015
Page 2
THE RESURGENT PERFORMANCE OF LEGACY NON-AGENCY RMBS
Source: Amherst Pierpont Securities, Citigroup as of August 2015
Although a topic for another paper, we believe the tepid
reincarnation of the private label RMBS market (RMBS 2.0 as it
is sometimes termed) remains fundamentally flawed, as
detailed in the accompanying catalogue of risks. Prudential
Fixed Income is an active participant in efforts to address the
structural shortcomings of this nascent recovery, but in its
current state, the new issue RMBS 2.0 market offers little
fundamental value, a host of structural flaws, and unique public
policy risks.
While the aforementioned public policy and structural risks also
remain an issue for legacy assets, we believe the legacy
market can offer investors far better compensation for
assuming these risks. Additionally, investors can mitigate the
impact of such risks via thoughtful re-securitization strategies,
as we detail in the latter part of this paper.
The wave of regulation engendered by the financial crisis has
been another challenge for the fixed income markets, but has
also created opportunities. In particular, changes to capital and
leverage requirements for investment and commercial banks
has made the repo financing business less viable, raised the
cost of financing, and made leveraged investors wary of the
stability and reliability of such leverage. Europe’s largest
wholesale banks will likely reduce their repo balance sheet by
another 10-15% in coming years, according to research from
Morgan Stanley and Oliver Wyman, and U.S. banks are likely
to pull back as well.1
1 Wholesale and Investment Banking Outlook, van Steenis et al, Morgan Stanley & Oliver Wyman, March 19th, 2015
-20
0
20
40
60
80
100
120
140
160
Cumulative Return %
Non-Agency MBS High Yield
BBB Corp. Corp.
Agency Mortgage Treasury
Agency
Structural and Policy Risks in RMBS
Distrust of Key Deal Agents:
Trustee – Remain passive participants with unacknowledged
fiduciary respons ibili ties. Indemnificat ion language remains a
sticking point in governing documents.
Servicer – Ongoing litigation with Ocwen and other servicers,
despite well-documented failures to perform duties adequately,
highlights the difficulty in removing servicers, and RMBS 2.0
documents remain unhelpful in this regard.
Representations and Warrantees (R&W) – RMBS 2.0
documents have made strides in addressing enforceability
shortcomings, but lack of R&W standardizat ion remains an issue
and key concepts including the meaning of “material and
adverse” remain poorly defined.
Public policy risks:
• Ambiguity regarding 1st lien priority versus 2nd lien priority
• Regulators ’ cooption of servicers to achieve public policy
agenda including use of trust assets to settle servicer
liability (National Mortgage Settlement)
• Use of eminent domain to seize collateral from trusts
• Consumer Financial Protection Bureau oversight of servicers
and originators
• Changes to state laws and policies that increase investor
losses by making it more difficult for servicers to liquidate
seriously delinquent loans. Examples include California
Homeowner’s Bill of Rights and changes to NY and NJ
foreclosure processes.
Perspectives—2015
Page 3
THE CONTRACTION IN U.S. AND EUROPEAN BANK BALANCE SHEETS
Approximate Balance Sheet
Changes: 2010-2014 Further Reduction Potential
Rates & Repo -30% -15% to -25%
FX, EM, and Commodities -25% -5% to 0
Credit and Securitized -30% -5% to -15%
Equities 0 -5% to 0
Total` -20% -10% to -15%
Source: Morgan Stanley, Oliver Wyman Wholesale & Investment Banking Outlook (March 19th, 2015)
This retrenchment, coupled with investors’ vivid memories of the crisis-era perils of short-term mark-to-market leverage, has
consequently increased the number of market participants seeking term, non-recourse leverage or structures that implicitly offer
the same. This financing squeeze has precipitated new opportunities, including what we view as the superior Sharpe ratio trades
of single-CUSIP and multi-CUSIP re-securitizations (re-REMICs).
Legacy RMBS: Fundamentals Remain Supportive
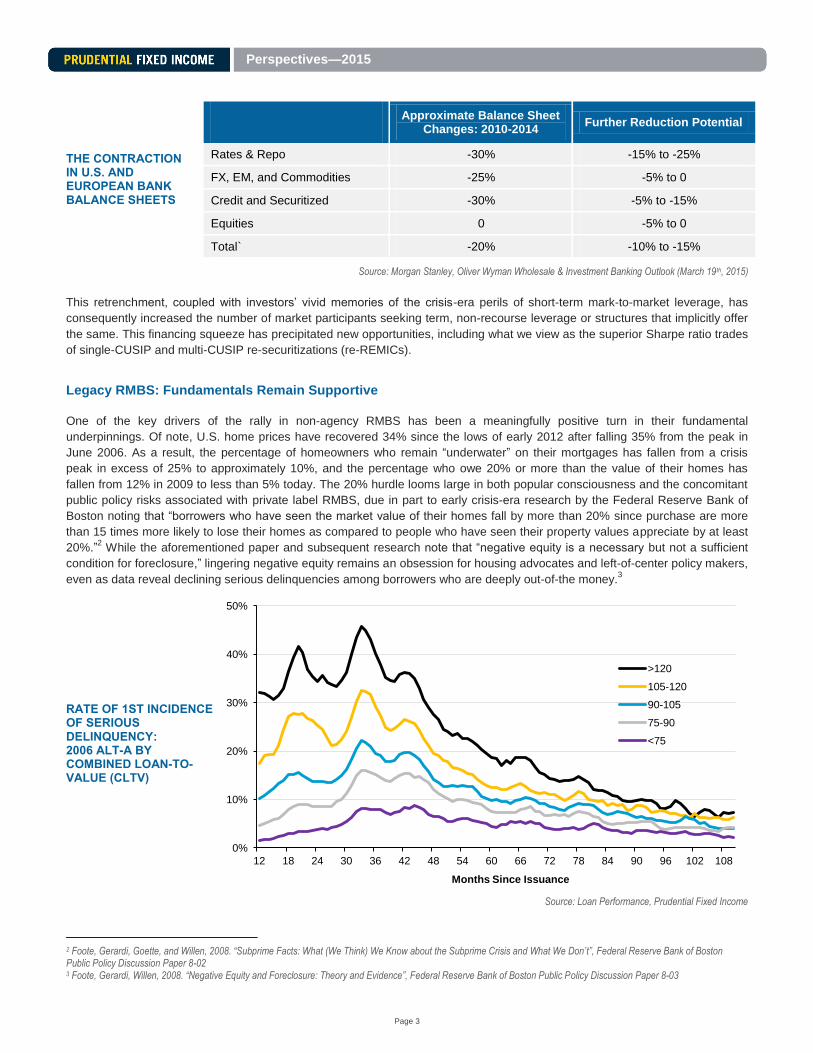
One of the key drivers of the rally in non-agency RMBS has been a meaningfully positive turn in their fundamental
underpinnings. Of note, U.S. home prices have recovered 34% since the lows of early 2012 after falling 35% from the peak in
June 2006. As a result, the percentage of homeowners who remain “underwater” on their mortgages has fallen from a crisis
peak in excess of 25% to approximately 10%, and the percentage who owe 20% or more than the value of their homes has
fallen from 12% in 2009 to less than 5% today. The 20% hurdle looms large in both popular consciousness and the concomitant
public policy risks associated with private label RMBS, due in part to early crisis-era research by the Federal Reserve Bank of
Boston noting that “borrowers who have seen the market value of their homes fall by more than 20% since purchase are more
than 15 times more likely to lose their homes as compared to people who have seen their property values appreciate by at least
20%.”2 While the aforementioned paper and subsequent research note that “negative equity is a necessary but not a sufficient
condition for foreclosure,” lingering negative equity remains an obsession for housing advocates and left-of-center policy makers,
even as data reveal declining serious delinquencies among borrowers who are deeply out-of-the money.3
RATE OF 1ST INCIDENCE OF SERIOUS DELINQUENCY: 2006 ALT-A BY COMBINED LOAN-TO-VALUE (CLTV)
Source: Loan Performance, Prudential Fixed Income
2 Foote, Gerardi, Goette, and Willen, 2008. “Subprime Facts: What (We Think) We Know about the Subprime Crisis and What We Don’t”, Federal Reserve Bank of Boston Public Policy Discussion Paper 8-02 3 Foote, Gerardi, Willen, 2008. “Negative Equity and Foreclosure: Theory and Evidence”, Federal Reserve Bank of Boston Public Policy Discussion Paper 8-03
0%
10%
20%
30%
40%
50%
12 18 24 30 36 42 48 54 60 66 72 78 84 90 96 102 108
Months Since Issuance
>120
105-120
90-105
75-90
<75

Perspectives—2015
Page 4
As discussed below, we currently expect further price gains for U.S. housing at both a national and regional level, with the
exception of potential oil patch weakness. In particular, we believe the uneven nature of the recovery across price tiers and
regions will likely diminish as U.S. economic activity remains comparatively healthy. A key factor in our expectation for broader
price gains going forward is improvement in mortgage credit availability. The most commonly cited measure of credit availability
is the Federal Reserve Senior Loan Officer Opinion Survey, which shows an ongoing increase in the percentage of loan officers
reporting loosening underwriting standards and reporting higher demand for residential loans, as illustrated in the following
charts.
FRB SR LOAN OFFICER SURVEY
4:
THE DOWNTREND REVEALS LOOSENING UNDERWRITING STANDARDS...
...WHILE THE UPTREND INDICATES RISING MORTAGE DEMAND.
Source: Federal Reserve Board Senior Loan Officer Opinion Survey
While the Fed’s Senior Loan Officer Opinion survey shows the direction of underwriting standards, data on mortgage origination
by FICO score more clearly illustrate the magnitude of underwriting shifts. From that perspective, one can see that although
mortgage credit availability is improving, current standards remain highly stringent, even compared to the relatively prudent 2003
era. When coupled with rebounding demand from borrowers, we view the potential for further expansion of mortgage availability
as a potential catalyst for further broad-based gains in home prices.
4 Federal Reserve Board Senior Loan Officer Opinion Survey reports the percentage of loan officers reporting tighter/looser underwriting standards and higher/lower borrower demand.
-20
0
20
40
60
80
100
120 All Residential Mortgage Loans
Prime
Nontraditional
Subprime
Looser
Tig
hte
r (S
tandard
s)
-35
-25
-15
-5
5
15
25
Q1 2015 Q2 2015 Q3 2015
GSE-eligible Government QM non-jumbo, non-GSE-eligible QM jumbo Non-QM jumbo Non-QM non-jumbo Subprime
-100
-80
-60
-40
-20
0
20
40
60
80
100 All Prime Nontraditional Subprime
Weaker
Str
onger
(Dem
and)
-50
-40
-30
-20
-10
0
10
20
30
40
50
Q1 2015 Q2 2015 Q3 2015
GSE-eligible
Government
QM non-jumbo, non-GSE-eligible
QM jumbo
Non-QM jumbo
Non-QM non-jumbo
Subprime

Perspectives—2015
Page 5
MORTGAGE ORIGINATIONS BY FICO SCORE
Source: Black Knight Financial Services, Morgan Stanley Research
Another contributor to our continuing housing optimism is the improvement in the supply dynamic. According to U.S. Census
data, the monthly supply of houses for sale in the U.S. is currently half of the peak level from 2009 and below the long-term
average of 6.1 months. In the near-term, we would not be surprised to see this figure increase modestly as there is likely a
backlog of supply from sellers trapped with low or no equity. On the other hand, the supply of homes from foreclosure and real
estate owned (REO) is still poised to decline going forward as distressed inventory remains a fraction of its crisis peak and
continues to improve.
MONTHS SUPPLY OF HOUSING FOR SALE IN THE UNITED STATES
Source: Federal Reserve Economic Data
Uniquely Supportive Technicals
Beyond the positive fundamental tailwind of improving economic activity, rising home prices, and diminishing distressed supply,
we also view the technical underpinnings for the non-agency RMBS market as being very favorable. From a peak in excess of
$2.3 trillion in 2007, the outstanding non-agency RMBS market is roughly $650 billion today and declining at 10% to 15% per
year.
This stands in sharp contrast to the deluge of supply in other spread sectors, notably investment grade corporates, and is a key
factor in the diminishing correlation between legacy RMBS and traditional credit sectors. While the decline in private label float
has led some participants to express concern as to the long-term viability of these investments, it is worth keeping in mind that at
0%
10%
20%
30%
40%
50%
60%
70%
80%
Jan-03 Jan-05 Jan-07 Jan-09 Jan-11 Jan-13 Jan-15
% < FICO 750
% < FICO 700
% < FICO 620
% Non-Government Mortgage Originations
3
4
5
6
7
8
9
10
11
12
13
2005 2006 2007 2008 2009 2010 2011 2012 2013 2014 2015
Month
s s
upply

Perspectives—2015
Page 6
roughly $650 billion, the legacy non-agency RMBS market remains larger than the private label CMBS market. Additionally,
TRACE data show that the turnover rate of the non-agency market has remained remarkably resilient despite the regulatory
challenges faced by the broker/dealer industry.
A FAVORABLE TECHNICAL AS OUTSTANDING PRIVATE POOLS/ TRUSTS DECLINE
TECHNICALS IN THE CORPORATE BOND MARKET DIFFER MATERIALLY FROM THOSE IN STRUCTURED PRODUCTS
Source top chart: Federal Reserve. Source bottom chart: Haver Analytics
Litigation Strategies Fade In Importance
Another factor in the RMBS price recovery has been successful litigation against RMBS sponsors for breaches of
representations and warranties (R&W). The following table shows significant landmarks in the private litigation actions against
securitization sponsors. However, litigation strategies have faded in importance in recent months largely due to two factors. First,
several landmark settlements that have either been approved, or are likely to be approved, have reduced the uncertainty
regarding the amount and timing of the respective settlements. Secondly, the New York Court of Appeals’ upholding of the
Appellate Division’s ruling in ACE Securities Corp v. DB Structured Products Inc., while wrongly decided in the opinion of many
investors, strongly indicates that securities that are not subject to tolling agreements are unlikely to derive any incremental value
from R&W putbacks.5 This clarity has not only reduced the valuation challenge posed by private label securities by eliminating or
diminishing the element of probabilistic litigation analysis, but, more importantly, has also repriced bonds that had their prices
inflated due to highly speculative litigation assumptions. While important litigation activities continue, namely action against the
5 Tolling agreements pertain to the expiration of the statute of limitations, and “putbacks” refer to those made to originators and securitizers.
0
500
1000
1500
2000
2500
USD bln
0
50
100
150
200
250
300
350
2.0
2.5
3.0
3.5
4.0
4.5
5.0
USD bln USD trn
Total stock of U.S. corporate bonds outstanding
Primary dealer inventory of corporate bonds (RHS)

Perspectives—2015
Page 7
securitization trustees and servicers (notably Ocwen), we believe recoveries are unlikely to approach the $8.5 billion standard
established by the Countrywide/Bank of America settlement.
Landmark Recoveries Pertinent to the RMBS Sector
Deal Responsible party Payout/Estimated loss reversal to date % of past and future losses
SVHE 2006-WF1 Wells Fargo $83mn cumulative ($55mn of cash payout; $28mn of loan-level putbacks have occurred earlier)
32%
ZUNI 2006-OA1 Countrywide $40mn of loan repuchases 32%
CWALT 2007-OA10 Countrywide $36mn of loan repurchases 16%
MLMI 2007-MLN1 BoA/ML $86mn of loan repurchases 16% for group 2 loans
BSMF 2007-AR2 JPM $30mn 14% (Including the payout from the JPM settlement)
MSAC 2006-HE3 Either of Decision One, WMC
$16.5mn payout 14% for Decision One loans; or 5% for WMC loans
CMLTI 2006-WF2 Wells Fargo $28mn of loan repurchases 14%
FGIC wrapped CWHEL deals
Countrywide $355mn payout to trustees; $584mn payout to FGIC 12% (14% based on past losses and D30+balance)
RAMP 2006-RS3 RFC $30mn of loan repurchases 12%
SAMI 2007-AR6 JPM $65mn of loan repurchases 12%
DBALT 2006-OA1 DB $29mn 11%
DBALT 2007-OA4 DB $91mn 11%
DBALT 2007-OA3 DB $53mn 10%
FFML 2006-FFB BoA/ML $51mn of loan repurchases 10%
MABS 2007-WMC1 WMC $52.2mn 12% for Group 2; 2% for Group 1
MABS 2006-HE3 WMC $13.8mn 9% for WMC loans
FFML 2006-FFA BoA/ML $48mn of loan repurchases 8%
STACS 2007-1 SunTrust $19mn settlement payout 8%
CWALT 2005-62 CW $28mn of loan repuchases 7%
CMLTI 2006-WF1 Wells Fargo $13mn of loan repurchases 7%
Gibbs & Bruns settlements
ResCap $7.3bn liability claim; ~$800mn payout Payout: 1-2% for RFC; 4.5-6% for GMACM shelves
Countrywide $8.5bn 10%
Citigroup $1.125bn 7.6%
JP Morgan ~$4.5bn 7%
Source: Nomura
Public Policy Risk Recedes
Also contributing to declining risk in the RMBS sector is the receding spectre of public policy risk. Investor concerns are well
justified, having previously found themselves on the short end of a host of policy initiatives by local, state, and federal agencies
that benefitted homeowners at investors’ expense (refer to page 2 box on RMBS 2.0 for more detail). One of the best examples
of policy risk is the push for principal forgiveness modifications by well-intentioned housing advocates. Although principal
forgiveness has been a cornerstone of private label modifications under the Home Affordable Modification Program (HAMP) for
several years, there is no solid empirical evidence that such modifications are superior to forbearance modifications. In fact, at
least one highly regarded servicer has categorically stated that principal forgiveness plans are suboptimal modifications, yet the
servicer is obligated to offer them under HAMP. Still more telling is the fact that the Federal Housing Finance Agency (FHFA)
has steadfastly concluded, under both Acting Director DeMarco and Director Watt, that principal forgiveness modifications are
not in the best interest of conserving the assets of the GSEs.
Despite this dismal track record, policy risks for legacy assets have receded over the past few years. In the first quarter of 2015,
the percentage of HAMP modifications declined 19% QOQ, according to U.S. Treasury data. As an earlier exhibit showed, the
percentage of borrowers that are materially underwater has diminished substantially since 2010, reducing the justification for
further principal forgiveness modifications. Furthermore, the most recent investigation of the servicing industry, led by the New
York State Department of Financial Services, appears to be more sensitive to investor interests than past regulatory

Perspectives—2015
Page 8
investigations.6 Lastly, the U.S. Treasury’s efforts to create a new private label benchmark security have focused policymakers’
attention on investor distrust of key deal agents and the politicization of investors’ contractual rights.
TRENDING OF TOTAL COMPLETED LOAN MODIFICATIONS AND % OF LOANS 60+ DAYS DELINQUENT
Source: Black Knight Financial Services, www.hopenow.com, Prudential Fixed Income
Is the Party Over?
A common concern among investors considering additional RMBS investments is the extent to which spreads have already
tightened. While legacy RMBS have been one of the best, if not the best, performing asset classes since 2009, they have also
been among the most volatile during that time period. Despite this volatility, the high returns generated by legacy RMBS have
resulted in a compelling history of ex-post information ratios since the worst of the financial crisis. With volatility for the asset
class having diminished dramatically in recent years, we believe ex-post information ratios will remain compelling despite tighter
spreads. Importantly, we regard the decline in volatility as secular rather than cyclical, fueled in part by the same factors that
caused the rally in asset prices—namely diminishing float and declining valuation challenges associated with more robust data
on borrower performance and reduced litigation uncertainty. Moreover, the legacy non-agency RMBS sector benefits from
borrowers who are now seasoned eight or more years. These borrowers, having shown a willingness and ability to stay in their
homes throughout a severely stressed economic environment, will likely prove to be highly resilient credits throughout future
economic and housing cycles.
SUBPRIME PRICE VOLATILITY SETS NEW POST-CRISIS LOWS
Source: Prudential Fixed Income
6 New York State Department of Financial Services In the Matter of Ocwen Financial Corporation, Ocwen Loan Servicing, LLC.
0%
2%
4%
6%
8%
10%
12%
14%
16%
0
20,000
40,000
60,000
80,000
100,000
120,000
140,000
160,000
180,000
200,000 Proprietary Modifications
HAMP Modifications
Seriously Delinquent % (60+ & FC) (rhs)
0%
5%
10%
15%
20%
25%
30% 12-Month Trailing Price Volatility
Seasoned Subprime
2006 Subprime

Perspectives—2015
Page 9
While legacy non-agency RMBS are unlikely to generate double-digit returns going forward, they are likely to generate attractive
risk-adjusted returns that are increasingly less correlated to other fixed income investments. We currently see spreads on legacy
RMBS assets in the 200 bps to 300 bps range with outliers on either side. Additionally, the increasing shortage of financing for
levered participants has afforded investors the opportunity to create high-quality investments by providing structured financing,
rather than owning the assets outright, as we discuss in the following section.
Re-securitization Alternatives to Repo Leverage
One of the by-products of the financial crisis was an avalanche of financial regulation, including restrictions on how banks use
their balance sheet (e.g. The Volker Rule, Basel III, Liquidity Coverage Ratio) and the capital charges associated with doing so.
As a result, it has become increasingly uneconomic for leveraged participants to obtain financing for private label securities.
Additionally, many investors have limitations, either self-imposed or external, with respect to the use of repo leverage. Given
these considerations, it is quite common for investors to use re-securitization as a mechanism to lever private label exposures
without being subject to the mark-to-market risk of traditional leverage and its associated recourse to other portfolio assets.
THE STRUCTURAL ENHANCEMENT OF THE RE-REMIC STRUCTURE
Source: Prudential Fixed Income. For illustrative purposes only.
There are several common approaches to conceptualizing re-securitization. One is that Class A (Senior) holders are providing
financing on the underlying bond to Class B holders. Another is that Class B represents being long the collateral and short the
Class A. With respect to re-securitzations of legacy RMBS, our preferred description is that re-securitization is a mechanism of
decomposing a multifaceted investment in the underlying bond into a credit component (Class B) and an illiquidity/complexity
component with greatly diminished credit risk (Class A). Not only is this conceptualization helpful in determining the fair
economics of a re-securitization, but it is also a helpful discipline in evaluating our purchases of the underlying bonds. In
instances where the mezzanine looks attractive from a risk/reward perspective, we generally prefer to own the mezzanine
implicitly by owning the underlying bond (i.e. the Class A and the Class B). In most cases, however, we find that the demand for
term, non-recourse funding is such that the Class A looks like a much better Sharpe ratio proposition than the mezzanine.
From a structuring perspective, there are two considerations of paramount importance—the attachment point (level of
enhancement provided by the Class B) and the cashflow prioritization of payments between Class A and Class B. First, with
regard to the senior attachment point, our goal in re-securitizations is to create a bond that remains loss remote across a wide
array of possible stress scenarios. It is worth pointing out, however, that an ancillary benefit to investors from re-securitizations is
the ability to structure exchangeable certificates, or the ability to exchange one note for a combination of other notes. This
embeds the capability of restructuring bonds in the future, in response to changing fundamental, regulatory or capital markets
dynamics, without the time and expense of another (re)-re-securitization.
The second consideration for investors in re-securitizations is mitigating interest-rate risk. Although many investors in private
label securities discuss value in loss-adjusted yield terms, rather than loss-adjusted spread terms, we believe the spread metric
is more appropriate. For bonds with fixed-rate structures, the conversion from yield to spread is straight forward. For bonds with
2007 Vintage Sub-prime RMBS Senior Bond (originally AAA rated)
RMBS Security is used to create re-REMIC structure
87%
Senior Bond
13%
Subordination
54% Front
re-REMIC Tranche
Non-Rated
33% Back
re-REMIC Tranche
RMBS re-REMIC
13%
Subordination
46% Total
Credit
Enhancement
Class A
Class B
Legacy 2007
Bond

Perspectives—2015
Page 10
floating-rate structures, particularly excess spread/over-collateralization structures, the traditional use of discount margin masks
the significant duration potential on the bonds due to low available funds caps and depleted/non-existent credit enhancement
levels. In such cases, we endeavor to create a Class A that is senior with respect to both principal and interest, thereby
channeling much of the interest-rate risk, in addition to the credit risk, to the mezzanine.
An additional consideration for investors is whether to invest in rated re-securitizations or non-rated re-securitizations. While both
rated and non-rated securitizations are common, in our experience rated re-securitizations frequently entail a greater embedded
arbitrage for the securitization sponsor than the non-rated structures. The opportunity for greater securitization arbitrage arises
because rated re-securitizations generally trade 25-50 bps tighter than non-rated bonds (depending on the actual rating
achieved) even though the senior attachment point is often not materially different for rated versus non-rated re-securitizations.
This highlights the fact that ratings remain an important motivation for investors, even as regulators have worked to eliminate the
Nationally Recognized Statistical Rating Organizations (NRSROs) from the regulatory construct. While some of the spread
differential between rated and non-rated bonds is attributable to the economic costs of a higher attachment point on the Class A,
we frequently conclude that much of the spread differential is pure securitization arbitrage accruing to the sponsoring
broker/dealer or mezzanine investor. Lastly, it is important to note that purchasers of rated re-securitizations remain vulnerable
to the ongoing unpredictability of the rating agency’s methodologies, as evidenced by the downgrades of several post-crisis re-
securitizations that were originally rated investment grade.
As the table below illustrates, the re-securitization value proposition is material. While the spread of the underlying collateral
deteriorates markedly in our stress scenarios, the loss adjusted spread of the Class A senior bond is remarkably stable across
economic scenarios.
Example Model Results for Single Asset Re-REMIC: Loss Adjusted Spread to Forward LIBOR
Home Price Scenario Optimistic Base Stagnant Retrenchment Housing
Recession
Housing path from March 2015
1st Year: +6%
2nd Year: +6%
Thereafter: +3%
+3% per year
1st Year: +0%
2nd Year: +0%
Thereafter: +3%
1st Year: -5%
2nd Year: -5%
Thereafter: +3%
1st Year: -7%
2nd Year: -13%
3rd Year: -7%
Thereafter: +3%
Class A re-REMIC Senior (discount margin) 236 222 214 203 169
Class B re-REMIC Mezzanine (DM) 326 241 79 -110 -487
Underlying: legacy 2007 RMBS (DM) 289 234 138 33 -137
Projected Collateral Default 34.7% 38.1% 45.2% 51.6% 58.9%
Collateral Loss Severity given Default 73.8% 75.2% 77.2% 79.4% 85.7%
Net Collateral Loss (% current) 25.6% 28.7% 34.9% 41.0% 50.4%
Princ. Loss % for Class A re-REMIC 0.0% 0.0% 0.0% 0.0% 0.0%
Spread Duration for Class A re-REMIC 3.9 4.1 4.3 4.6 5.6
Relatedly, at higher levels of interest rates, the spread of the Class B mezzanine deteriorates much faster than the spread of the
Class A, reflecting the seniority of the Class A interest to the Class B.7
LIBOR Sensitivity
Base Case
Housing Recession
FWD L+0 FWD L+200 FWD L+0 FWD L+200
Class A re-REMIC Senior 222 207 169 98
Class B re-REMIC Mezzanine 241 -128 -487 NA
Underlying: legacy 2007 RMBS 234 27 -137 -345
Source: Prudential Fixed Income
7 Structural nuances will influence the degree to which the senior and mezzanine classes respond to higher interest rates. These include the amount of subordination remaining on the underlying collateral, the principal and interest waterfall of the underlying, and the principal and interest waterfall specifications in the re-REMIC private placement memorandum.

Perspectives—2015
Page 11
A variation on the re-securitization theme is the multi-CUSIP securitization. Thus far, Lone Star Funds has been the biggest
issuer of multi-CUSIP deals under the LSTRZ shelf. While these securitizations share many similarities with the single-CUSIP re-
securitizations, there are important distinctions. Most important is the fact that Loan Star Funds retain control of the collateral
pool in terms of actively managing the disposition of assets. This creates a risk that investors could be adversely affected if more
attractively priced collateral were to be sold out of the pool, potentially leaving the pool undercollateralized at a later point.
Safeguards against such an occurrence include limitations on the percentage of the pool that can be sold without cal ling the
deal, the prices at which securities can be sold from the pool, and the distribution of proceeds between senior holders and
mezzanine holders. Another important distinction is the clean-up call and associated coupon step-up feature. Most multi-CUSIP
deals are callable at par after one year. While the call feature increases the option cost for investors, this cost is significantly
mitigated for senior investors as the Class A senior bond is typically issued at a discount and includes a coupon step-up if the
trust is not called after two years. Moreover, if the trust is not called after five years, a mandatory auction of the underlying
securities is conducted in order to retire the outstanding bonds.
Importantly, while the prospect of multi-CUSIP securitization evokes the scourge of ABS CDOs, our assessment of multi-CUSIP
deals is driven by advance rates on the collateral and other tangible structural features, not model-based abstractions such as
less than perfect correlation on the underlying securities. We believe at current spreads of LIBOR plus 300 bps the senior bonds
provide an attractive opportunity for investors with the resources to navigate the structural nuances and analyze each underlying
security.
Conclusion
• While the legacy non-agency RMBS market generates less focus from hedge funds and private equity than it
did at the height of the crisis, we believe investors are remiss in prematurely overlooking this $650 billion asset
class, particularly in light of the tepid yields and poor technicals found in other fixed income sectors.
• Although the potential for double-digit returns are diminished, we see spreads for senior bonds generally
trading in the 200-300 bps range on a loss-adjusted basis.
• Fundamentals have vastly improved due to a robust housing market recovery. We believe strengthening in the
real economy and widening credit availability will continue to support the improving collateral performance of
legacy RMBS pools.
• Technicals are overwhelmingly favorable as the outstanding supply of legacy non-agency RMBS diminishes
10-15% per year.
• While RMBS spreads are tighter than they have been in recent history, the volatility of the asset class has
declined in sympathy with vastly improved fundamentals and continued strong technicals. We believe this will
result in attractive ex-post information ratios and returns that are relatively uncorrelated with the broader fixed
income market.
• Changes to regulatory standards have made repo financing increasingly scarce, even as lower all-in yields
make leverage more critical for the hedge fund industry. We believe investors are well compensated for
providing term non-recourse financing via single and multi-CUSIP re-securitizations.
.

Perspectives—2015
Page 12
NOTICE
Source(s) of data (unless otherwise noted): Prudential Fixed Income as of October 2015. These materials represent the views, opinions and recommendations of the author(s) regarding the economic conditions, asset c lasses, securities, issuers or financial instruments referenced herein. Certain information contained herein has been obtained from sources that the Firm believes to be reliable as of the date presented; however, the Firm cannot guarantee the accuracy of such information, assure its completeness, or warrant such information will not be changed. The information contained herein is current as of the date of issuance (or such earlier date as referenced herein). The underlying assumptions and our views are subject to change without notice. The Firm has no obligation to update any or all of such information; nor do we make any express or implied warranties or representations as to the completeness or accuracy or accept responsibility for errors. Distribution of this information to any person other than the person to whom it was originally delivered and to such person’s advisers is unauthorized, and any reproduction of these materials, in whole or in part, or the divulgence of any of the contents hereof, without prior consent of Prudential Fixed Income (the “Firm”) is prohibited. These materials are not intended as an offer or solicitation with respect to the purchase or sale of any security or other financial instrument or any investment management services and should not be used as the basis for any investment decision. No investment strategy or risk management technique can guarantee returns or eliminate risk in any market environment. Past performance is not a guarantee or a reliable indicator of future results and an investment could lose value. No liability whatsoever is accepted for any loss (whether direct, indirect, or consequential) that may arise from any use of the information contained in or derived from this report. The Firm and its affiliates may make investment decisions that are inconsistent with the recommendations or views expressed herein, including for proprietary accounts of the Firm or its affiliates.
The opinions and recommendations herein do not take into account individual client circumstances, objectives, or needs and are not intended as recommendations of particular securities, financial instruments or strategies to particular clients or prospects. No determination has been made regarding the suitability of any securities, financial instruments or strategies for particular c lients or prospects. For any securities or financial instruments mentioned herein, the recipient(s) of this report must make its own independent decisions. Any projections or forecasts presented herein are as of the date of this presentation and are subject to change without notice. Actual data will vary and may not be reflected here. Projections and forecasts are subject to high levels of uncertainty. Accordingly, any projections or forecasts should be viewed as merely representative of a broad range of possible outcomes. Projections or forecasts are estimated, based on assumptions, and are subject to significant revision and may change materially as economic and market conditions change. The Firm has no obligation to provide updates or changes to any projections or forecasts. Conflicts of Interest: The Firm and its affiliates may have investment advisory or other business relationships with the issuers of securities referenced herein. The Firm and its affiliates, officers, directors and employees may from time to time have long or short positions in and buy or sell securities or financial instruments referenced herein. The Firm’s affiliates may develop and publish research that is independent of, and different than, the recommendations contained herein. The Firm’s personnel other than the author(s), such as sales, marketing and trading personnel, may provide oral or written market commentary or ideas to the Firm’s clients or prospects or proprietary investment ideas that differ from the views expressed herein. Additional information regarding actual and potential conflicts of interest is available in Part 2A of the Firm’s Form ADV. The Firm operates primarily through Prudential Investment Management, Inc., a registered investment adviser under the Investment Advisers Act of 1940, as amended, and a Prudential Financial, Inc. (“Pramerica Financial”) company. In Europe and certain Asian countries, Prudential Investment Management, Inc. and Prudential Fixed Income operate as Pramerica Investment Management and Pramerica Fixed Income, respectively. Pramerica Financial is not affiliated in any manner with Prudential plc, a company incorporated in the United Kingdom. In Germany, information is presented by Pramerica Real Estate International AG. In the United Kingdom, information is presented by Pramerica Investment Management Limited (“PIML”), an indirect subsidiary of Pramerica Investment Management. PIML is authorised and regulated by the Financial Conduct Authority of the United Kingdom (registration number 193418) and duly passported in various jurisdictions in the European Economic Area. In certain countries in Asia, information is presented by Pramerica Investment Management (Singapore) Pte. Ltd., a Singapore investment manager that is registered with and licensed by the Monetary Authori ty of Singapore. In Japan, information is presented by Prudential Investment Management Japan Co. Ltd., a Japanese registered investment adviser. Pramerica, the Pramerica logo, and the Rock symbol are service marks of Pramerica Financial, and its related entities, registered in many jurisdictions worldwide. © 2015 Prudential Financial, Inc. and its related entities.
2015-2800


![Benign Paroxysmal Positional Vertigo: An Overview€¦ · BPPV, most commonly including canal paresis of the in-volved side. In 2003, Vibert [28] found a correlation be-tween BPPV](https://static.fdocuments.us/doc/165x107/605bebb8e76d74078e269a34/benign-paroxysmal-positional-vertigo-an-overview-bppv-most-commonly-including.jpg)


