Perspectives for Biogas in Europe - Oxford Institute for Energy Studies
54
* Floris van Foreest is an experienced consultant in the field of power and gas market analysis, scenario development and sustainability. Earlier in his career he held various roles in multinational companies. Floris is a Research Fellow of the OIES Natural Gas Research Programme whose research is focused on the role of gas in the energy transition. He studied Business Administration and Political Science at the University of Groningen and Amsterdam. Perspectives for Biogas in Europe Floris van Foreest* NG 70 December 2012
Transcript of Perspectives for Biogas in Europe - Oxford Institute for Energy Studies

* Floris van Foreest is an experienced consultant in the field of power and gas market analysis, scenario
development and sustainability. Earlier in his career he held various roles in multinational companies. Floris is a
Research Fellow of the OIES Natural Gas Research Programme whose research is focused on the role of gas in
the energy transition. He studied Business Administration and Political Science at the University of Groningen
and Amsterdam.
Perspectives for Biogas in Europe
Floris van Foreest*
NG 70
December 2012

The contents of this paper are the author’s sole responsibility. They do not
necessarily represent the views of the Oxford Institute for Energy Studies, of
any of the Institute’s members, and/or of the author’s other affiliations.
Copyright © 2012
Oxford Institute for Energy Studies
(Registered Charity, No. 286084)
This publication may be reproduced in part for educational or non-profit purposes without
special permission from the copyright holder, provided acknowledgment of the source is
made. No use of this publication may be made for resale or for any other commercial purpose
whatsoever without prior permission in writing from the Oxford Institute for Energy Studies.
ISBN 978-1-907555-63-3

Preface
In studies and discussions of future energy sources, the term gas tends to be synonymous with
‘natural gas’ with its attendant issues of upstream exploration and production dynamics, geo-
politics and the ubiquitous speculation around shale gas. Biogas is frequently neglected in
such a context, despite its potential to contribute to decarbonisation of gas supply (or energy
supply in a broader perspective). Indeed when upgraded to biomethane, it can be injected into
existing gas transmission infrastructure.
In this paper, Floris van Foreest describes the present and future conversion processes in
which biomass is converted to biogas, the scale and growth of biogas production in individual
European countries and the outlook to 2020 and beyond. The paper looks at the technical and
economic challenges facing biogas production, its end-use applications and discusses the
regulatory frameworks and supporting subsidy schemes in force.
While the paper questions whether biogas targets for 2020 will be met, given the current pace
of development, it provides the reader with a comprehensive understanding of the subject area
and objectively addresses the challenges facing this renewable energy source.
Howard Rogers

Contents
Introduction ................................................................................................................................ 7
1 Biomass resources ............................................................................................................. 9
1.1 Biomass supply ............................................................................................................ 9
1.1.1 Types of biomass .................................................................................................. 9
1.1.2 Global potential .................................................................................................. 11
1.1.3 EU potential ........................................................................................................ 12
1.1.4 Key factors for future supply ............................................................................. 13
1.2 Biomass demand ........................................................................................................ 14
1.2.1 Biomass markets ................................................................................................ 14
1.2.2 EU demand ......................................................................................................... 15
1.3 Position of biomass in European energy and climate policies .................................. 16
2 Biomass energy conversion technologies ...................................................................... 18
2.1 Thermal conversion ................................................................................................... 18
2.2 Chemical conversion ................................................................................................. 19
2.3 Liquid Bio fuels ......................................................................................................... 19
3 Current status and 2020 perspective for biogas ........................................................... 21
3.1 Current developments ................................................................................................ 21
3.2 Biomass sources for biogas production ..................................................................... 22
3.3 Biogas Production ...................................................................................................... 23
3.3.1 AD plant configuration ....................................................................................... 24
3.3.2 Crop digestion .................................................................................................... 24
3.3.3 Biogas plant concept .......................................................................................... 25
3.4 2020 perspective ........................................................................................................ 25
3.5 Regulatory framework ............................................................................................... 27
3.6 Economics ................................................................................................................. 29
3.6.1 Costs of feedstock .............................................................................................. 32
4 Bio Synthetic Gas ............................................................................................................ 34
5 Downstream biogas markets .......................................................................................... 36
5.1 Combined heat and power ......................................................................................... 36
5.2 Upgrading to bio methane ......................................................................................... 37
5.2.1 Upgrading biogas to biomethane ........................................................................ 37

5.2.2 Gas distribution (grid injection) ......................................................................... 39
5.3 Biomethane as vehicle fuel ........................................................................................ 40
5.4 Feedstock for chemicals ............................................................................................ 41
5.5 Country cases ............................................................................................................. 42
5.5.1 Sweden ............................................................................................................... 42
5.5.2 Germany ............................................................................................................. 42
5.5.3 United Kingdom ................................................................................................. 42
6 Biomethane development and implications for natural gas ........................................ 43
7 Conclusions ...................................................................................................................... 46
APPENDIX ............................................................................................................................. 53
Figures
Figure 1: Biomethane value chain .............................................................................................. 8
Figure 2: Biomass sources ........................................................................................................ 10
Figure 3: Global Biomass demand and potential ..................................................................... 11
Figure 4: Breakdown of current EU biomass potential ............................................................ 12
Figure 5: Overview of 2020 estimates of biomass availability ................................................ 13
Figure 6: EU Biomass Supply-demand for power and heat ..................................................... 16
Figure 7: EU energy mix 2020 ................................................................................................. 17
Figure 8: Biogas production in Europe 2009-2010 .................................................................. 21
Figure 9: Biogas production in Europe 2006-2010 by source ................................................. 21
Figure 10: Historic and projected biogas production ............................................................... 26
Figure 11: Breakdown of biogas production in 2020 by feedstock ......................................... 27
Figure 12: Incentive schemes - Germany, Sweden and UK .................................................... 28
Figure 13: Investment costs for biogas plants .......................................................................... 30
Figure 14: Comparison of three co-digestion plant concepts ................................................... 31
Figure 15: Cost structure for biomethane ................................................................................. 32
Figure 16: Downstream routes for biogas ................................................................................ 36
Figure 17: Process steps for biogas upgrading ......................................................................... 38
Figure 18: Biomethane production costs .................................................................................. 39
Figure 19: Biomethane sourcing and sales price versus natural gas price in Germany ........... 39
Figure 20: Cost of biomethane production versus natural gas price in the Netherlands .......... 40
Figure 21: % of a region that is available for dedicated bioenergy production ....................... 53
Figure 22: Gas content ............................................................................................................. 53
Figure 23: Yield of biogas feedstock ....................................................................................... 54

Abbreviations
AEBIOM European Biomass Association
AD Anaerobic Digestion
Bio SNG Bio Synthetic Natural Gas
CBM Compressed Biomethane
CHP Combined Heat and Power
CNG Compressed Natural Gas
DECC Department of Energy and Climate Change
DENA Deutsche Energie-Agentur
DBFZ Deutsches Biomasseforschungszentrum
ECN Energy Centre Netherlands
GW Gigwatt
IEA International Energy Agency
kWh Kilowatt hour
LBM Liquified Biomethane
LNG Liquified Natural Gas
Mtoe Million tonnes of oils equivalent
NNFCC The National Non-Food Crops Centre
NGVA Natural Gas Vehicle Association
PM Particulate Matter
TWh Terrawatt hour

Introduction
In 2010, EU Member States submitted their action plans to meet the 2020 Renewable Energy
Sources (RES) targets. Wind and (co-firing) biomass were the most prominent renewable
energy sources in these plans. The realization of large scale offshore wind constitutes the
main uncertainty in achieving these plans. The economic downturn, high investment cost (and
financial risks) and potential issues regarding balancing of the grid and unstable subsidy
schemes are likely to cause serious delays in the realization of levels of installed capacity
consistent with the 2020 targets. Against this background, other renewable energy sources are
being emphasized by policymakers and other stakeholders in the energy transition debate.
One example of these energy sources is biomass. Biomass is a generic term for different types
of organic feedstock that can be used in a number of technological conversion processes to
produce direct energy or secondary energy sources such as bio fuels and biogas that are
applied further downstream in the energy supply chain. Sources of biomass are for example
wood pellets, energy crops and agricultural waste.
Biogas is a secondary energy carrier that can be produced from many different kinds of
organic materials via either a chemical process (digestion) or a thermal process (gasification).
The latter is still in the R&D phase, but can potentially accelerate the development of biogas
as it has the potential for larger produced volumes. Biogas is considered as carbon neutral as
the carbon in biogas comes from organic matter (feedstock for biogas production) that
captured this carbon from atmospheric CO2 over a relatively short timescale.
In 2010, 10.9 mtoe of primary biogas was produced in the EU. Estimates of the potential of
biogas vary significantly. The Institute for Energy and Environment in Leipzig calculated a
theoretical potential for Europe of 166 Mtoe (≈200 bcm) in 2020. The European Biomass
Organisation (AEBIOM) estimated a probably more realistic production of 39.5 Mtoe (≈48
bcm) in 2020, which corresponds to approximately 10% of EU natural gas consumption.
Biogas can be used as a fuel to generate heat and electricity. Alternatively, biogas can be
upgraded and injected into the gas grid (biomethane). This option is gaining the interest of
policy makers in traditional gas markets such as the UK, the Netherlands and Germany, but
also of the gas industry. Targets for production are included in some national renewable plans
and biomethane can be attractive for gas companies as a low carbon energy source that can be
integrated in the overall gas portfolio and supplied through existing gas infrastructure.
Although biogas and biomethane are gaining ground in the renewable energy mix, the more
realistically estimated volumes up to 2020 do not suggest a game changer in future gas
supply. The cost and availability of biomass are key uncertainties. The gas industry has to
compete with the food and electricity industry for biomass; and so significant additional
demand increase could drive up prices. Furthermore, the sustainability of biomass production
is subject to debate. The impact on ecosystems and deforestation are issues to be considered
in this context. Finally, business cases are still very much reliant on subsidies. Hence, a stable
regulatory framework with sufficient financial incentives is a key prerequisite.
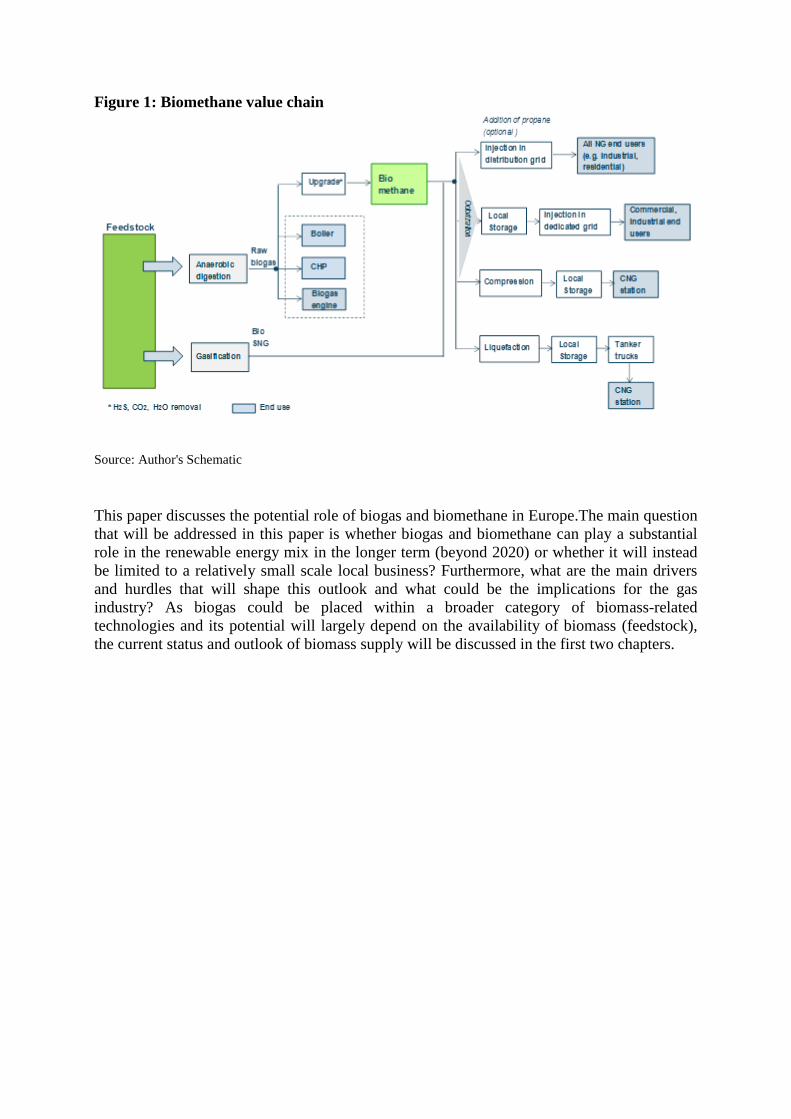
Figure 1: Biomethane value chain
Source: Author's Schematic
This paper discusses the potential role of biogas and biomethane in Europe.The main question
that will be addressed in this paper is whether biogas and biomethane can play a substantial
role in the renewable energy mix in the longer term (beyond 2020) or whether it will instead
be limited to a relatively small scale local business? Furthermore, what are the main drivers
and hurdles that will shape this outlook and what could be the implications for the gas
industry? As biogas could be placed within a broader category of biomass-related
technologies and its potential will largely depend on the availability of biomass (feedstock),
the current status and outlook of biomass supply will be discussed in the first two chapters.

1 Biomass resources
One of the key success factors of a substantial future role for biogas in Europe is the
availability of biomass. The availability depends on a number of economic, technological,
environmental and regulatory factors such as production costs, type of biomass, location
(transport costs) and the applied conversion technology, which in turn determine the required
biomass source, competition with other value chains and markets and government policy with
respect to, for example, waste processing and energy crop production. This chapter provides a
perspective on the current situation around biomass as one of the mainstream renewable
energy sources.
1.1 Biomass supply
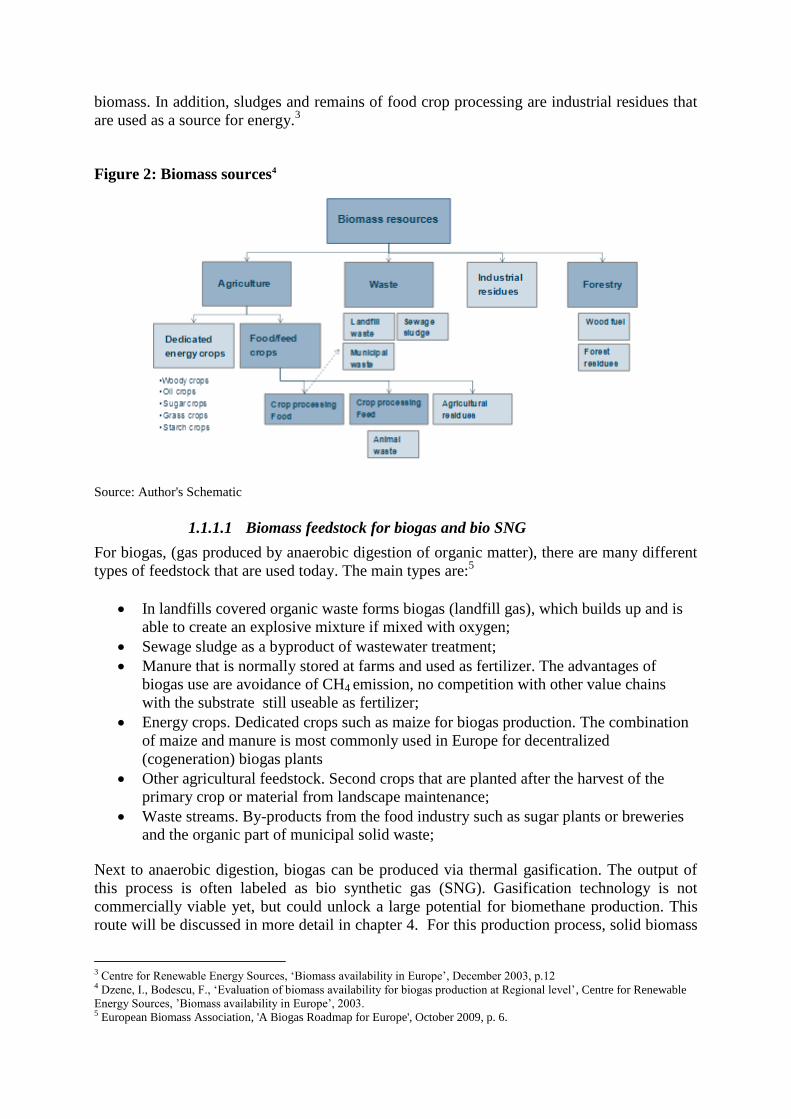
1.1.1 Types of biomass
Many biomass sources can be used for the production of heat and electricity or secondary
energy carriers as biogas or biofuels. The scheme below shows the four main biomass
categories: agriculture, waste, forestry and industrial residues. Most categories consist of
multiple types of feedstock with different physical characteristics, geographical spread and
regulatory regimes that determine their technological and economic viability in a specific
country.
Europe is still one the world’s largest producers of food. Many agricultural crops and
processes generate residues that can potentially be used for energy applications.1 The main
types are:
Residues: from arable crops in the form of for example straw and prunings from
maintenance of permanent crop plantations such as fruit and berry trees
Livestock: a primary source of biogas from anaerobic digestion is manure from animal
production, mainly from cattle and pig farms.
Energy crops: crops cultivated specifically for the production of biofuels, but also
ethanol and biogas. Typical crops are maize, rapeseed and sweet sorghum.
Forestry accounts for the majority of biomass supply. Wood and wood waste is the main
renewable energy source in EU countries such as Finland, Lithuania and Hungary. Unlike
other regions, European forests have been increasing by approximately 0,3% per year in the
past twenty years.2 Round wood and chips are the main wood products. The latter is used for
power and heat production. In addition, forest residues in combination with harvesting also
form a major energy source.
Waste is defined as “any substance or object which the holder disposes of or is required to
dispose of pursuant the provisions of national law in force” (EU, 1975, Article 1). Most
commonly used types of waste for biomass are municipal solid waste, sewage sludge and
landfill. Demolition wood could also be classified under waste biomass.
Finally, waste wood from wood processing industries, including pulping liquor or black
liquor, a waste product from the pulp and paper industry, is the main source for industrial
1 European Biomass Association (AEBIOM), ‘2011 Annual Statistical Report on the contribution of Biomass to the Energy
System in the EU 27’, June 2011, p.34 2 Ibid., p. 40.
biomass. In addition, sludges and remains of food crop processing are industrial residues that
are used as a source for energy.3
Figure 2: Biomass sources4
Source: Author's Schematic
1.1.1.1 Biomass feedstock for biogas and bio SNG
For biogas, (gas produced by anaerobic digestion of organic matter), there are many different
types of feedstock that are used today. The main types are:5
In landfills covered organic waste forms biogas (landfill gas), which builds up and is
able to create an explosive mixture if mixed with oxygen;
Sewage sludge as a byproduct of wastewater treatment;
Manure that is normally stored at farms and used as fertilizer. The advantages of
biogas use are avoidance of CH4 emission, no competition with other value chains
with the substrate still useable as fertilizer;
Energy crops. Dedicated crops such as maize for biogas production. The combination
of maize and manure is most commonly used in Europe for decentralized
(cogeneration) biogas plants
Other agricultural feedstock. Second crops that are planted after the harvest of the
primary crop or material from landscape maintenance;
Waste streams. By-products from the food industry such as sugar plants or breweries
and the organic part of municipal solid waste;
Next to anaerobic digestion, biogas can be produced via thermal gasification. The output of
this process is often labeled as bio synthetic gas (SNG). Gasification technology is not
commercially viable yet, but could unlock a large potential for biomethane production. This
route will be discussed in more detail in chapter 4. For this production process, solid biomass
3 Centre for Renewable Energy Sources, ‘Biomass availability in Europe’, December 2003, p.12 4 Dzene, I., Bodescu, F., ‘Evaluation of biomass availability for biogas production at Regional level’, Centre for Renewable
Energy Sources, ’Biomass availability in Europe’, 2003. 5 European Biomass Association, 'A Biogas Roadmap for Europe', October 2009, p. 6.

(woody biomass) that is currently used for electricity and heat production, can be used as
feedstock and therefore creates a significant expansion of the resource base. Examples of
woody biomass are wood pellets and waste wood such as chips. Wood pellets are compressed
biofuels from chipped solid biomass in the form of short cylindrical units. They are usually
made of industrial wood, wood shavings, woodchips, or sawdust.6
1.1.2 Global potential
An assessment of studies on biomass resources showed a range of global biomass potential
for energy of 50-1,500 EJ.7The range in estimates is the result of differences in scope with
respect to type of biomass and different assumptions on technical, economical and ecological
limitations to biomass supply. A distinction is also made between technical and sustainable
potential. Hall & Rosillo-Calle (1998) for example estimated the potential for sustainable use
at competitive prices at 270 EJ/yr.8 According to IEA estimates, this sustainable potential in
2050 ranges between 200 and 500 EJ/yr. A significant share of the resources will have to
come from energy crop production on surplus agricultural land to unlock this potential (see
Figure 3).
Figure 3: Global Biomass demand and potential
Source: IEA Bioenergy 2009, IEA WEO 2011
Note: 1 Ej (Exajoule) = 1018
joules. 1 Ej ~ 23Mtoe
The potential scale of energy which could be obtained from biomass depends in part on land
availability. Currently, the amount of land devoted to growing energy crops for biomass fuels
is only 0.19% of the world’s total land area and only 0.5-1.7% of global agricultural land.9
The availability is driven by factors such as the development of sustainability criteria for
6 Eurelectric, 'Biomass 2020: Opportunities, Challenges and Solutions', October 2011, p. 51. 7 IEA Bioenergy, Annual Report 2009, p.6 8 Hall D.O. & Rosillo-Calle F., 'Biomass - other than wood'. World Energy Council 1998, Survey of Energy Resources, 18th
Edition, London, pp.227-241. 9 Swedish University of Agricultural Sciences, Global Potential of Sustainable Biomass for Energy, 2009, p.17
biomass production, other regulatory frameworks such as renewable energy targets and waste
policy, population growth and required agricultural land, level of (de)forestation and
feedstock prices. Furthermore, with respect to energy crops, the type of feedstock is important
in relation to the yield. In section 1.1.4, drivers and impediments of biomass supply are
further elaborated.
1.1.3 EU potential
For Europe, a number of reports on biomass potential have been published in the past decade.
The difficulty of estimating this potential is driven by, the issue of reliable data for both
existing and future resources as many biomass residues have no market and therefore no trade
records, and the definition of potential (i.e., technical, economic, sustainable). Furthermore,
the availability of land for energy crops largely depends on the level of (possible) competition
with alternative land use.
The European Environment Agency has estimated that around 235 Mtoe/yr of biomass could
be made available in the EU by 2020 without harming the environment.10
Agriculture (95
Mtoe) and waste (100 Mtoe) are the key suppliers. This could increase to 295 Mtoe/yr in
2030, mainly driven by higher availability of agricultural biomass. For reference, total EU
primary energy consumption in 2010 was 1,760 Mtoe and is estimated at 1,724 by 2030.11
The main drivers of the increase in biomass are an increase in available land potential, higher
crop yields and energy prices.12
Also in Europe, energy crops are expected to make up a major
part of future bioenergy supplies. Estimates of the current (2010) resource range from 18-44
Mtoe/yr, increasing to 95–132 Mtoe/yr in 2030.13
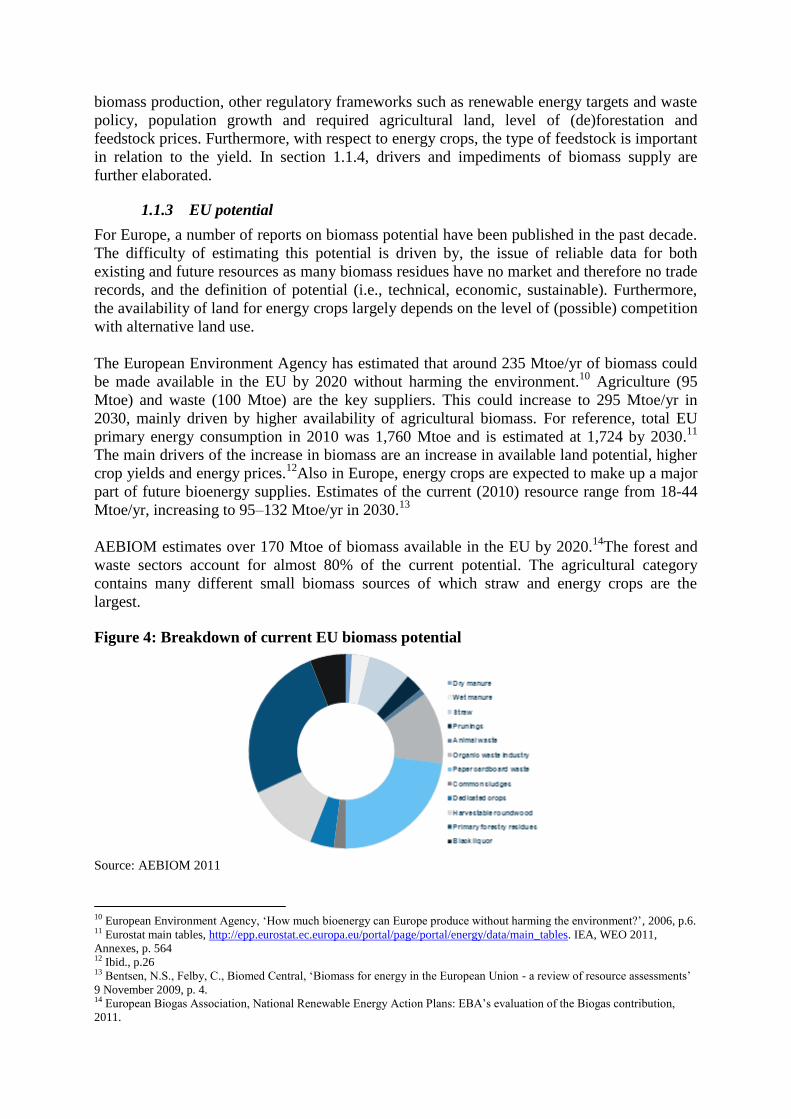
AEBIOM estimates over 170 Mtoe of biomass available in the EU by 2020.14
The forest and
waste sectors account for almost 80% of the current potential. The agricultural category
contains many different small biomass sources of which straw and energy crops are the
largest.
Figure 4: Breakdown of current EU biomass potential
Source: AEBIOM 2011
10 European Environment Agency, ‘How much bioenergy can Europe produce without harming the environment?’, 2006, p.6. 11 Eurostat main tables, http://epp.eurostat.ec.europa.eu/portal/page/portal/energy/data/main_tables. IEA, WEO 2011,
Annexes, p. 564 12 Ibid., p.26 13 Bentsen, N.S., Felby, C., Biomed Central, ‘Biomass for energy in the European Union - a review of resource assessments’
9 November 2009, p. 4. 14 European Biogas Association, National Renewable Energy Action Plans: EBA’s evaluation of the Biogas contribution,
2011.

In a study of biomass imports to Europe and global availability, Pöyry estimates that 82 Mtoe
of European biomass resources (biogas and solid biomass) will be available for electricity and
heat production in 2010 and that supply will increase to 121.7 Mtoe by 2020.15
Figure 5: Overview of 2020 estimates of biomass availability
Source: Author analysis
1.1.4 Key factors for future supply
The availability of biomass is determined by a number of factors. First of all, availability of
land is a prerequisite for increasing the supply of energy crops. Currently, the amount of land
devoted to growing energy crops for biomass fuels is only 0.19% of the world’s total land
area and only 0.5-1.7% of global agricultural land.16
In the EU, the land used in 2006 for short rotation trees and for other energy crops was 33,993
ha and 57,071 ha respectively. This corresponds to only 0.05% of the total agricultural area in
the EU.17
The main potential for dedicated bioenergy production is in East Europe.18
Another key factor concerns the development of regulatory frameworks that either stimulate
or hamper the growth in biomass supply. The development of renewable energy sources is
incentivized by EU Member States to achieve the 2020 targets and more substantial CO2
reduction in the long term. The use of biomass is a key pillar in many renewable action plans
and is subsidized in relation to power and heat generation and biogas and biofuel production.
Furthermore, EU Directives and national regulations for waste water treatment and landfill are
especially relevant for biogas production. For example, government measures to reduce the
amount of waste negatively impact the supply of landfill, which is feedstock for biogas
production.
Sustainability requirements for the production of biomass have been a key topic in recent
years and can form a potential hurdle for the large scale cultivation of energy crops. The
Renewable Energy Directive (2009) includes sustainability criteria for the production of
biomass for biofuels and bioliquids, but not for other biomass markets such as heat and
electricity. In 2010, the European Commission adopted a report on sustainability
requirements.19
This report contains a number of recommendations to be used by the Member
15 Eurolectric, ‘Biomass 2020: opportunities, challenges and solutions, October 2011, p.21 16 Ladanai, S., Vinterbäck, J., ‘Global Potential of Sustainable Biomass for Energy’, Swedish University of Agricultural
Sciences, 2009, p. I 17 ECN, European environmental agency, renewable energy projections as published in the national renewable energy action
plans of the European Member States, November 2011, p. 92. Baldock, D., Institute for European Environmental Policy,
‘Reorienting agricultural domestic support around environmental goals: the experience of the European Union’, 3 August
2012. 18 See appendix figure 21 19 European Commission, ‘on sustainability requirements for the use of solid and gaseous biomass sources in
electricity, heating and cooling, February 2010.

States that wish to introduce a national scheme, but are not mandatory to implement. The
proposed criteria are:
A general prohibition on the use of biomass from land converted from forest, other
high carbon stock areas and highly biodiverse areas;
A standardised greenhouse gas calculation methodology which could be used to
ensure that minimum greenhouse gas savings from biomass are at least 35% (rising to
50% in 2017 and 60% in 2018 for new installations) compared to the EU's fossil
energy mix;
The differentiation of national support schemes in favour of installations that achieve
high energy conversion efficiencies;
Monitoring of the origin of biomass.
In February 2012, the European Commission announced that it will draw-up EU-wide
biomass criteria later this year.20
Supply-demand dynamics can impact the availability of biomass. An increasing use of
biomass in the energy sector can force up feedstock prices, which makes it attractive for land
owners to grow energy crops (including wood harvesting). On the other hand, high prices can
drive users to look for alternative sources, which act as a modifying effect. Furthermore,
shifting supply-demand balances in other sectors such as paper and pulp or the food industry
can impact supply to the energy sector. Finally, changing support schemes can also impact
demand for a specific type of feedstock.
Other factors that can affect biomass supply are the accessibility of biomass resources,
demographic changes and behavioural aspects such as consumer awareness on waste
deposition.
1.2 Biomass demand
1.2.1 Biomass markets
There are a number of end user sectors for the supply of biomass resources that have different
characteristics in terms of application, economic value added, customers, societal benefits and
environmental impact. In their study on biomass usage, CE Delft, a Dutch research and
consultancy company, shows a value-volume pyramid for the different biomass
applications.21
The top of the pyramid is taken by health and lifestyle products (pharmacy and
fine chemicals), which require a relative low volume of biomass that creates a high added
value. The bottom part is represented by the mainstream energy products electricity, gas and
heat. Other key sectors are the paper and pulp industry, the chemical industry and transport.
Next to economic drivers such as production costs (and related subsidies) and the value of
intermediate or end products, CO2 reduction potential and societal value will determine the
future shares of biomass across the different sectors. Considering the projections for biomass
demand to meet renewable energy targets and potentially stricter sustainability requirements,
an increasing competition for sustainable and economically attractive biomass is anticipated.
This intensification of competition will probably also be the case between the different energy
markets. About 90% of bioenergy in the EU is used for heating applications, while the
remainder is used for electricity generation, transportation fuel, and chemical applications.22
In
this paper, the focus will be mainly on demand for biomass for biogas production. 20www.endseurope.com, 27 February 2012. 21 Bergsma, G.C., Kampman, B.E., Croezen, H.J., ‘Good use of biomass’, CE Delft, April 2010, p.21 22 Swedish University of Agricultural Sciences, Global Potential of Sustainable Biomass for Energy, 2009, p. 14
1.2.2 EU demand
Based on the national renewable action plans that have been submitted to the European
Commission by the EU Member States in 2010 in response to the Renewable Energy
Directive, the final demand for biomass will increase from 82 Mtoe in 2010 to 135 Mtoe in
2020 and is most substantial in Belgium, France, Germany, Italy, the Netherlands, Poland and
the UK.23
Final demand is defined as the gross amount of useful energy such as heat or
electricity that is produced from biomass. Heating and cooling is the main end user market,
today and is expected to remain so in 2020. Forestry and woody biomass is used as fuel in
stoves, boilers or co-generation units to produce heat for space and water heating in
residential and commercial buildings, directly or via district heating, or for industrial
processes. In addition, agricultural biomass and organic waste, so-called wet biomass, are
used for anaerobic digestion to produce biogas that can also be used as fuel for boilers and
CHPs for the same applications. Cooling accounts for only a small share and relates to
absorption chillers that often use waste heat from boilers or directly use relatively low
temperatures found in nearby ground, water and air.24
More than 50% of the heat is used in the Built Environment (households and services) and the
remaining share is used in industrial processes.25
By 2020, the share of heating and cooling is estimated at 64% of total biomass demand,
followed by transport (22%) and electricity (14%). The increase towards 2020 is spread
across sectors, but the most considerable increase would be in the transport sector which is
less established with respect to renewable energy and requires a substantial increase of energy
crop production. More than 50% of the biomass will come from forestry, but the increase in
demand will largely have to be accommodated by a more than doubling of agricultural
biomass supply.26
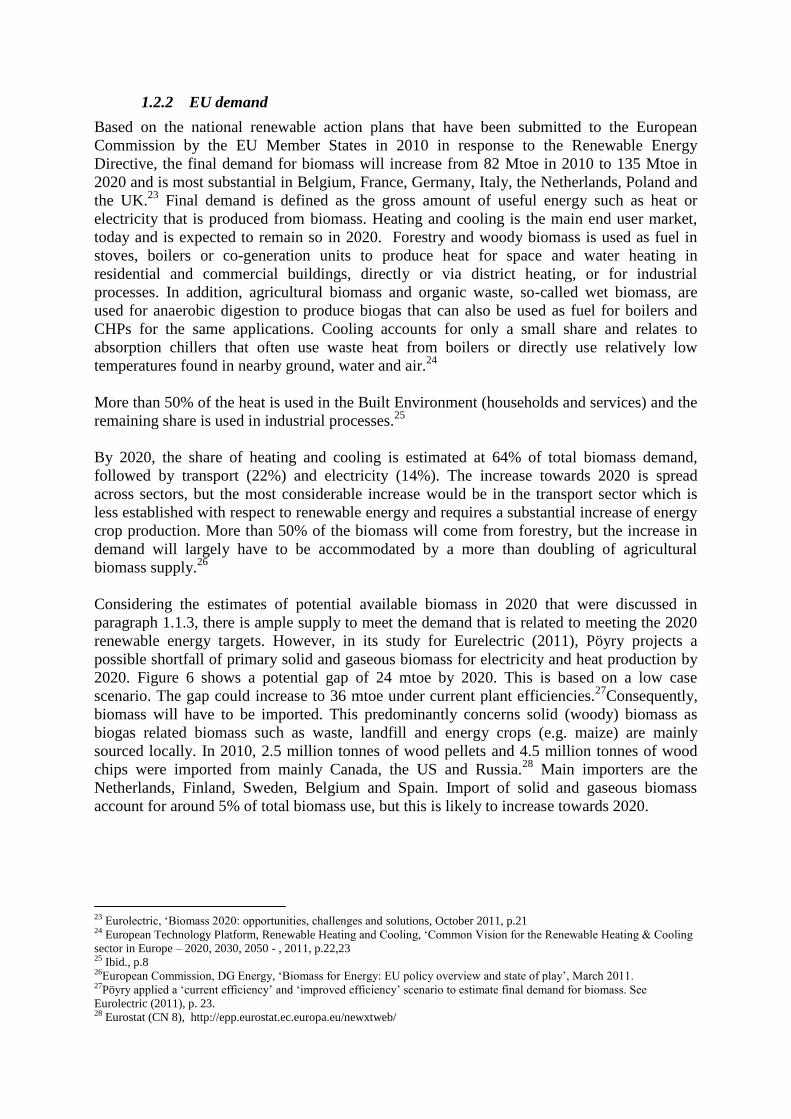
Considering the estimates of potential available biomass in 2020 that were discussed in
paragraph 1.1.3, there is ample supply to meet the demand that is related to meeting the 2020
renewable energy targets. However, in its study for Eurelectric (2011), Pöyry projects a
possible shortfall of primary solid and gaseous biomass for electricity and heat production by
2020. Figure 6 shows a potential gap of 24 mtoe by 2020. This is based on a low case
scenario. The gap could increase to 36 mtoe under current plant efficiencies.27
Consequently,
biomass will have to be imported. This predominantly concerns solid (woody) biomass as
biogas related biomass such as waste, landfill and energy crops (e.g. maize) are mainly
sourced locally. In 2010, 2.5 million tonnes of wood pellets and 4.5 million tonnes of wood
chips were imported from mainly Canada, the US and Russia.28
Main importers are the
Netherlands, Finland, Sweden, Belgium and Spain. Import of solid and gaseous biomass
account for around 5% of total biomass use, but this is likely to increase towards 2020.
23 Eurolectric, ‘Biomass 2020: opportunities, challenges and solutions, October 2011, p.21 24 European Technology Platform, Renewable Heating and Cooling, ‘Common Vision for the Renewable Heating & Cooling
sector in Europe – 2020, 2030, 2050 - , 2011, p.22,23 25 Ibid., p.8 26European Commission, DG Energy, ‘Biomass for Energy: EU policy overview and state of play’, March 2011. 27Pöyry applied a ‘current efficiency’ and ‘improved efficiency’ scenario to estimate final demand for biomass. See
Eurolectric (2011), p. 23. 28 Eurostat (CN 8), http://epp.eurostat.ec.europa.eu/newxtweb/

Figure 6: EU Biomass Supply-demand for power and heat
Source: Eurelectric 2011
The question whether biomass supply can meet demand towards 2020 and 2030, will also
depend on the extent to which supply chains are established to accommodate the downstream
penetration of local sources or imports. Investments in both upstream biomass production and
midstream infrastructure are required preferably based on robust long term demand
projections. Such projections are inevitably subject to a number of uncertainties and therefore
entail a certain risk level for investors. A slow down of renewable energy development due to
changes in the economic and/or political landscape and competition for biomass from other
potential biomass demand regions could change the supply-demand balance for the EU. For
example, a shift to co-firing in large coal-based power sectors such as in China and India can
dramatically alter the global supply outlook and import potential for Europe.
Availability of biomass for biogas production will be further highlighted in chapter 3.
1.3 Position of biomass in European energy and climate policies
In 2009, global demand for biomass (including waste) was 1,230 Mtoe, which corresponds to
10% of total primary energy demand. Estimates of world energy reserves put biomass as the
fourth largest energy resource after coal, oil, and natural gas and as such it represents more
than 75% of total renewable energy.29
In the EU, the role of biomass is less dominant, but still
has a share of 67% in current renewable energy production and around 60% in 2020.30
This
implies that biomass is an important energy source which could significantly contribute to
meeting the EU 20% renewable energy target. However, to meet the 2020 target, additional
measures are necessary to accelerate the use of biomass, especially for heat and electricity
production.
29IEA, World Energy Outlook 2011, p.544 30 Eurostat, main tables energy. http://epp.eurostat.ec.europa.eu/portal/page/portal/energy/data/main_tables. European
Commission, DG Energy, ‘Biomass for Energy: EU policy overview and state of play’, March 2011.

Figure 7: EU energy mix 2020
Source: IEA WEO 2011, European Commission
Solid biomass is the dominant source for the production of heat, cooling and electricity.
Biogas is mainly utilized for electricity production and accounts for around 30% of total
production. The utilization of biomethane is not consolidated on the EU level, but some
countries such as the Netherlands and Germany have defined specific ambitions for upgrading
and injecting biomethane into the gas grid. This illustrates the fact that this renewable energy
source currently plays a marginal role in the EU. The current use and outlook for biogas will
be discussed in chapter 3.

2 Biomass energy conversion technologies
As discussed in the first chapter, there is a wide variety of biomass sources that can be used to
directly generate electricity or heat or to produce secondary energy carriers such as biogas and
biofuels. A number of conversion technologies, established or in the development phase, are
available to capitalize the biomass potential as renewable energy source. A combination of
technological, economic and regulatory factors will determine the scale of renewable energy
from biomass and the relative share of the conversion routes. Some routes will compete for
biomass sources and other sources are linked to one technology. For example, the organic
waste streams are primarily used for anaerobic digestion. This chapter discusses the different
technological options for converting biomass to renewable energy.
2.1 Thermal conversion
This concerns processes in which heat is the dominant mechanism to convert the biomass into
another chemical form. First of all, combustion is the process by which flammable materials
are allowed to burn in the presence of air or oxygen with the release of heat. The generated
heat is used for space heating, water heating in combination with district heating or process
heat, steam production for electricity generation. In the case of biomass, the oxidation is of
predominantly the carbon (C) and hydrogen (H) in the cellulose, hemicellulose, lignin, and
other molecules present to form carbon dioxide (CO2) and water (H2O).31
Solid biomass such
as wood chips and pellets are used for large scale co-combustion in coal-fired plants or mono-
combustion in stand-alone biomass plants.
Biomass co-firing in large-scale power plants can allow higher levels of efficiency to be
achieved than when biomass is used for generating electricity in existing mono-combustion
plants. Biomass co-firing in a hard coal-fired power plant at below 10% of the input fuel, the
thermal output does not produce any noticeable reductions in efficiency.32
Co-firing biomass
with coal is a way to reduce the CO2 footprint of coal-fired generation. With current
technologies, coal can be replaced by biomass up to approximately 30% biomass in
pulverized coal plants. In 2010, the total capacity of biomass power generation in the EU was
approximately 24GW.33
To meet the EU 2020 renewable energy targets, more than 43GW
would have to be installed.
Secondly, thermochemical gasification is a partial oxidation process whereby a carbon source
such as coal, natural gas or biomass, is broken down into carbon monoxide (CO) and
hydrogen (H2), plus carbon dioxide (CO2) and possibly hydrocarbon molecules such as
methane (CH4).34
The characteristics of the gas depend on the gasification parameters such as
temperature and the oxidizer used. Low temperature gasification (700°C - 1,000°C) contains a
relatively high level of hydrocarbons and is burned for electricity and heat generation via a
steam turbine or, after gas cleaning, used as fuel for an internal combustion engine that
generates electricity. High temperature gasification (1,200°C-1,600°C) leads to less
hydrocarbons and more CO and H2. The output is (bio) synthetic gas that can be upgraded to
biomethane or biodiesel. The technologies for (bio) SNG will be further discussed in chapter
4.
31 Biomass Energy Centre, Conversion Technologies, www.biomassenergycentre.org.uk. 32 Eurelectric, p. 19. 33 ECN, European environmental agency, p. 144. 34 Biomass Energy Centre.
2.2 Chemical conversion
Biochemical conversion makes use of the enzymes of bacteria and other micro-organisms to
break down biomass. Anaerobic digestion (for biogas production) refers to the process
whereby microorganisms convert chemical energy in solid biomass material into an energy
carrier, often with high efficiency relative to that of thermochemical conversion. The products
are usually a mixture of methane and CO2 in almost equal proportions. These microorganisms
have the flexibility to process waste streams as well as biomass feedstock from residues and
energy crops.35
Converting organic waste into biogas can be simplified into a four step process. The first step
is called hydrolysis where the complex substances are broken down by enzymes into mostly
soluble compounds that can be taken up by bacteria. Step two, the acidification, involves a
group of anaerobic bacteria, referred to as the acid formers, that produces organic acids as an
intermediate product. In the third step acetate and hydrogen is formed. Finally, a group of
bacteria, so called methane formers, produce methane from acetate or hydrogen.36
Most commonly used feedstocks are organic waste, landfill, sewage, energy crops and
manure.
The second category of chemical conversion is fermentation. This technology involves
conversion of feedstock by microorganisms in a process similar to digestion, but the products
are alcohols, such as ethanol (CH3CH2OH), or organic acids instead of methane.37
Conventional fermentation processes for the production of bioethanol make use of the starch
and sugar components of typically cereal or sugar (beet or cane) crops.
The second generation bioethanol precedes this with acid and/or enzymatic hydrolysis of
hemicellulose and cellulose into fermentable saccharides to make use of a much larger
proportion of available biomass.38
Bioethanol can be added to conventional fuels in concentrations up to 10%, but most
European manufacturers' vehicle warranties only cover up to a 5% bioethanol/95% petrol
blend.39
Ethanol is not only the most widely used alcohol, primarily as a fuel for
transportation or as a fuel additive, but also accounts for the largest share of global biofuel
production. The main feedstocks are sugarcanes, starch plants, maize beets and sweet
sorghum.
2.3 Liquid Bio fuels
Fermentation is one of the technologies that is applied to produce liquid biofuels. Liquid
biofuels include pure plant oil, biodiesel, and bioethanol.40
Firstly, pure plant oil is obtained
from edible oil-producing plants and can be used in modern diesel vehicle engines or in diesel
generators for power generation. Secondly, biodiesel is a raw vegetable oil transformed,
treated, and standardized through chemical processes. Different types of feedstock can be
used for biodiesel production such as oil feedstock (e.g. rapeseed, palm oil), animal fats or
waste vegetable oil.
35 Stanford University, Global Climate & Energy Project, ‘An Assessment of Biomass Feedstock and Conversion Research
Opportunities, 2005, p.15 36 IEA Bioenergy Task 37, frequently asked questions. http://www.sgc.se/biogasfaq 37 Stanford University (2005), p. 16 38 Biomass Energy Centre. http://www.biomassenergycentre.org.uk 39 Ibid. 40 Hub for Rural Development in West and Central Africa, ‘Sustainable Bioenergy Development in UEMOA Member
Countries’ October 2008, p.48

Regarding biofuel conversion technology, there is a distinction made between first and
second-generation biofuels. The former concern the fuels that are produced through
established processes such as cold pressing/extraction, transesterification, hydrolysis and
fermentation, and chemical synthesis.41
Second-generation biofuels are produced through
more advanced processes, including hydro treatment, advanced hydrolysis and fermentation,
and gasification and synthesis. A wide range of feedstocks can be used in the production of
these biofuels, including lignocellulosic sources such as short-rotation woody crops.
The technology advancement regarding biofuel production has opened up a larger biomass
resource base, but also creates more competition with the other biomass related technologies
and end user markets. With respect to biomass availability for biogas production, the use of
energy crops such as maize for the production of bioethanol can impact the economics for co-
digestion (maize + manure), a form of digestion that is applied in Germany on a large scale. If
woody crops are used for second generation biofuels, this route could compete in the longer
term with the production of bio SNG (gasification).
41 Ibid., p. 49.

3 Current status and 2020 perspective for biogas
This chapter focuses on the outlook for biogas in Europe. As mentioned in the introduction,
there are different estimates of this potential. Furthermore, the biogas picture varies
significantly across Europe. Factors such as national renewable energy policy and
corresponding subsidy schemes, the current penetration of natural gas in energy supply and
availability of biomass determine the success of this renewable energy source.
Biogas is probably the most commonly used term in literature and company reports in relation
to gas and renewable energy. Biomethane and bio synthetic gas (bio SNG) are other examples
that fall within the broad category of renewable gas. The former concerns biogas that is
upgraded to natural gas quality and the latter is produced via gasification technology. This
chapter discusses biogas in terms of gas that is produced from different types of bio
feedstocks via anaerobic digestion. Subsequently, the raw biogas can be cleaned and upgraded
for several end user applications. These routes will be discussed in chapter 5. Developments
around bio SNG are separately addressed in chapter 4.
3.1 Current developments
In 2010, primary production of biogas in Europe was 10.9 Mtoe, an increase of 31%
compared to 2009.42
27% of the biogas was produced from landfill,10% from sewage sludge
and the remaining 63% from decentralized agricultural plants, municipal solid waste,
methanisation plants, co-digestion and multi-product plants.43
This growth was mainly driven
by developments in Germany which has favourable support schemes in place. Power
generation accounted for the main share of the energy produced from biogas, which is also
related to government incentives for power generation from renewable energy sources.
Germany clearly leads the way in Europe with a share of 61% of total production. This
corresponded with more than 7,000 biogas plants in 2010. Of these plants, 84% are based on
co-digestion of crops and slurry (animal waste).44
Only 54 plants injected upgraded biogas
into the gas grid (biomethane). This number increased to 82 plants in 2011.45
Figure 8: Biogas production in Europe 2009-2010
Source: EurObserv'ER 2011
42EurObserv’ER, ‘The state of renewable energies in Europe – 2011 edition’, December 2011, p. 56, 43 Ibid., p. 58. 44Linke, B., Leibniz-Institute for Agricultural Engineering, IEA Bioenergy Task 37, Country Report, Germany, September
2011 45 Strauch, S., Fraunhofer UMSICHT, ‘Biogas Upgrading Technologies‘, June 2012.

Figure 9: Biogas production in Europe 2006-2010 by source
Source: EurObserv'ER 2011
Germany is followed by the United Kingdom with 1.8 Mtoe biogas production in 2010.
Landfill is the main feedstock in the UK with a share of 84.6% of total production.46
Since
2008, the number of anaerobic digestion plants based on farm and food waste has shown a
steep increase, but is still at an early stage.
After the United Kingdom, there is a large gap with a group of countries comprising France,
Italy and the Netherlands that produced between 0.3 and 0.5 Mtoe in 2010. A second group of
seven countries produced between 0.1 and 0.2 Mtoe. A special case is Sweden, (production of
0.11 Mtoe in 2010), where already 26% of the biogas is upgraded as vehicle fuel.47
As in the
UK, the majority of the biogas is produced from sewage plants and landfills.
In the remaining countries, biogas plays a very marginal or no role. Overall, one could
conclude that biogas production in Europe is led by only a small number of countries of
which Germany is by far the dominant player. This picture aligns with the fact that within
Europe, Germany is at the forefront of renewable energy development in general.
3.2 Biomass sources for biogas production
As briefly listed in section 1.1.1, biogas can be produced from a wide range of agricultural,
industrial, municipal organic sources. Examples of agricultural feedstocks are manure (e.g.
pig and cow slurry), harvest residues and energy crops. With respect to the latter various
annual and perennial plant species could be used as crops for anaerobic digestion. Maize is
most widely used in the majority of existing co-digestion biogas plants. Industrial waste that
can be used as biomass resources for energy production includes sludges, and remains of the
food industry such as breweries, sugar plants, fruit processing and slaughter houses.
In landfills48
covered organic waste forms biogas. Sewage sludge, (which is a by-product of
wastewater treatment), is also an established source of biogas. Furthermore, other waste
46EurObserv’ER, p. 61. 47Petersson, A., Svenskt Gastekniskt Center AB, Country Report Sweden, 2010. 48 Landfill gas is produced during anaerobic degradation and has a lower methane content than other biogases.
streams from the built environment are food waste, used kitchen oil and the organic fraction
of municipal solid waste.
Apart from anaerobic digestion discussed above, biogas can also be produced from wood or
woody biomass in a thermal gasification process. This will be further discussed in the next
chapter.
The composition of the feedstock is an important factor as the (methane) yield of the biomass
(m3/kg substrate) impacts the energy potential of the biogas.
49 Aspects in relation to this
composition that have to be taken into account are:
- The total solids content (% of water, dry matter content)
- The percentage of volatile solids(portion of solids that are organic or dry and ash
free are related to the methane yield)
- The Carbon:Nitrogen ratio
- Biodegradability. Organic materials which contain inhibitory components such as
pesticides, antibiotics or disinfections are unsuitable feedstock.50
Other factors that determine the yield are the energy left in the feedstock after storage, the
length of time in the digester, the type of digester and the process conditions in the digester.51
The technological and process related aspects will be discussed below.
3.3 Biogas Production
The three main biogas production routes are: direct recovery from landfill, also described as
passive methanisation, sewage water treatment and thirdly dedicated digestion plants that
convert manure, energy crops (or co-generation), waste from the food-processing industry and
household waste into biogas.52
Anaerobic digestion technology is well established. In Europe,
biogas is mainly produced in large scale digesters.
Anaerobic digestion (AD) technology was initially developed for low solids applications,
mainly used for waste water and sewage treatment. In the past decade, there has been a
development towards the use of this technology for commercial (energy crops), industrial and
municipal waste. The mechanism of waste digestion can essentially be divided into two steps:
Hydrolysis and acetogenesis, which converts the bio-degradable waste to glucose and
amino acids. Next, these are converted to fatty acids, hydrogen and acetic acids;
Methanogenesis, which is the conversion of the products of the first step to a gas, rich
in methane (biogas).53
49 See appendix figure 22 50 IEA Bioenergy Task 37, Frequently Asked Questions, http://www.sgc.se/biogasfaq/ 51 The Official Information Portal on Anaerobic Digestion. http://www.biogas-info.co.uk/index.php/biogas-yields-agri.html 52EurObserv’ER, ‘The State of Renewable Energies in Europe, 11th edition’, December 2011, p.57 53 Austermann, S., Archer, E., Whiting, K.J., ‘Anaerobic Digestion Technology for Biomass Projects’, June 2007, p. 10.

3.3.1 AD plant configuration
Plant technology is also an important factor that influences the economic viability of biogas
production. There are five main ways in which anaerobic digestion plants can be configured:54
- Wet versus dry processes. So called wet digesters treat low solid content waste such as
manure and sludges that contain less than 15% dry solids. Dry AD systems are suited
to process high dry solid feedstocks such as energy crops and farm residues. In
practice, two or more waste streams are combined for co-digestion to establish input
consistency. Dry digesters typically produce less wastewater and often depend on
external mixing of the feedstock.
- Plug flow versus fully mixed. Dry digesters are plug flow systems and depend on
external mixing, while mixed systems for wet digestion use in-built mechanical
stirrers.
- Mesophilic versus thermophilic. Temperature is a key factor in the control of digestion
processes and the production rate as the biochemical reaction rate increases up to a
certain limit. In AD systems that operate under a temperature between 25-45°C,
mesophilic bacteria thrive, while in systems that operate at temperatures between 50-
60°C, thermophilic bacteria dominate. Thermophilic systems can realize higher biogas
yields in a shorter timeframe, but also use more energy and require additional
infrastructure.
- Single stage versus multi stage. In single stage processes, the hydrolysis, acetogenesis
and methanogenesis take place in the same reactor. Multi stage processes have been
developed to realize optimization between the different steps, which can increase the
yield, but also have higher capex requirements.
- Batch versus continuous. Batch processes are designed for small applications that have
no continuous supply of feedstock. Continuous system allow for a more stable and
efficient process, which contributes to a more optimal yield.
To summarize, the choice for an AD system depends on the one hand on the type of
feedstock, but is also the result of an economic assessment to optimise between yield and
costs. This optimum is not only influenced by the plant type, but is also driven by its
performance, which relates to process stages such as feedstock preparation, biogas cleaning,
provisions for wastewater treatment, digestate management and biogas utilization.55
3.3.2 Crop digestion
Mainly driven by favorable regulatory frameworks, crop digestion and co-digestion has
increased rapidly. In Germany, 90-95% of all biogas plants use crops such as maize, grass and
cereals, mainly in combination with manure.56
A wide range of crops with different methane
yields can be used for biogas production.57
Actual use will depend on, among other things,
local (land) availability, prices and regulatory framework. Furthermore, the composition of
the crops can differ by country. Ideally the biomass used for ensiling should have a dry solids
content of between 20 and 40 %.58
In a medium sized crop digestion installation, typically up
to 10,000 tons of silage are prepared during harvest time for continuous use as feedstock over
54 Austermann, S., et al. p. 7-11. 55 Ibid., p. 12. 56 Murphy, J., Braun, R., Weiland, P., Wellinger, A., IEA Bioenergy, ‘Biogas from Crop Digestion’ September 2011, p. 4 57 See appendix figure 23 58 Murphy. J., et al., IEA Bioenergy, p. 6

the year. Available surplus heat from a combined heat and power (CHP) unit may also be
used for the drying process.59
Different configurations as discussed in the previous section can be applied to (co) crop
digestion. For example, dilute feedstock is processed in a wet digester with a continuous
mixing tank reactor. Alternatively, the reactor may be of a dry batch type with recirculation of
liquor over the feedstock.60
Approximately 20% by volume of the substrate that is fed into a digester breaks down to
produce biogas and the remainder (the digestate) passes from the digester into the after
storage tank for subsequent use. In most cases the digestate can be directly applied to
nearby agricultural land as a fertilizer.
Due to its relatively high yield per hectare, maize is the most commonly used crop in Europe.
High yield in combination with low energy use for crop production are key drivers for the
economic feasibility of a crop digestion plant. Other important economic drivers are crop
prices, subsidy schemes and the capital and operation costs of the biogas facility. The
economics of biogas production will be discussed in section 3.6.
3.3.3 Biogas plant concept
Factors to take into account before building a biogas plant are the natural and agricultural
conditions in the specific countries, the regulatory framework, economic and social aspects.
The performance of a biogas plant is dependent on the local conditions such as climate, soil
conditions, the substrate for digestion and building material availability. The design must
respond to these conditions.61
Next to the design, the scale and required infrastructure are very
much related to the end use and location (remote versus proximity to built environment or
industrial sites). Examples of concepts for the infrastructure around biogas plants are:62
- Decentralized pants in combination with a combined heat and power unit. Plants are
located on farms or (food) industrial sites that use the energy for their own process;
- Decentralized plants in combination with a pipeline and CHP. The combination of a
CHP with a district heating grid creates an optimal energy concept in energetic and
economic terms;
- Decentralized plant in combination with a pipeline and upgrading unit to produce
biomethane that is injected into the gas grid. The biogas can be collected and upgraded
centrally or at the plant;
- Centralized plant (larger scale) that is located in an area with high feedstock
availability in combination with CHP or upgrading unit for grid injection.
3.4 2020 perspective
As stated in the introduction, estimates of the potential of biogas show large differences. The
Institute for Energy and Environment in Leipzig calculated a theoretical potential for Europe
of 166 Mtoe (≈200 bcm) in 2020.63
AEBIOM has estimated the biogas potential in terms of
59 Ibid., p.7 60 Ibid., p.8 61 Warner Kossmann et al., Information and Advisory Service on Appropriate Technology, Biogas Digest, Volume II,
‘Biogas - Application and Product Development’, February 2012, p.4 62 Eurelectric, p. 48. 63 Institute for Energy and Environment, ‘Possibilities of an European Biogas strategy, January 2007

biomass origin. This potential is more conservatively estimated at almost 40 Mtoe in 2020.64
This would correspond with 8% of EU gas demand under the ‘Current Policies’ scenario.65
The difference between the theoretical calculations versus forecast is in part driven by
economic and regulatory assumptions on the availability of biomass.
The most concrete reference for 2020 estimates are the national renewable action plans, which
contain ambitions for the different renewable energy sources to meet the 20% RES in energy
supply. Biogas production is not separately reported, but is estimated in relation to the end
use. Biogas-related electricity is estimated to be 64TWh (5.5 Mtoe) in 2020.66
The gross
production of heating and cooling from biogas is estimated at 5.1 Mtoe in 2020.67
The share
of biogas in transport is approximately 6TWh (0.5 Mtoe). The total estimate for final energy
consumption sourced from biogas in 2020 is more than 11 Mtoe. Adjusting for conversion
efficiencies, this corresponds with approximately 28 Mtoe of primary biogas production.68
Figure 10: Historic and projected biogas production
Sources: ECN, EEA, National Renewable Action Plans, AEBIOM
As current frontrunner in biogas development in Europe, Germany will consolidate its
position with a forecast 5.3 Mtoe in terms of gross energy production from biogas (electricity,
heat and transport) in 2020.69
The United Kingdom follows as a distant second with 0.8 Mtoe
by 2020.
Agricultural crops are the main supply source for biogas production in 2020, based on the
assumption that 5% of the arable land is available.70
An increasing shift from food to energy
64 European Biomass Association, ‘A Biogas Roadmap for Europe’, October 2009, p.16 65 IEA, World Energy Outlook 2011, Annex A, p. 565. In the current policies scenario, gas demand is estimated at 486 Mtoe
in 2020. 66 Baxter, D., JRC European Commission, September 2011. 67 ECN, EEA, National Renewable Action Plans, p. 22, 24 68 This estimate is based on an assumed electric efficiency of 35% and thermal efficiency of 40%. 69 Ibid., p. 217, 259, 261. 70 This corresponds with 5 million ha. available for biogas energy crops

crop production could further accelerate and amplify the growth of biogas production in
Europe.
Figure 11: Breakdown of biogas production in 2020 by feedstock
Source: AEBIOM, 2009
As highlighted in chapter 3.3.2, co-digestion of energy crops and manure is an increasingly
applied biogas production concept, with especially dramatic growth of plants in Germany in
the past 10 years. In the EU-27 more than 1,500 million tonnes of animal manure is produced
every year, which corresponds with a theoretical biogas output of 17.3 Mtoe.71
In its estimate,
AEBIOM assumes that 35% of this potential will be captured in 2020. This brings the total
share of co-digestion in 2020 to 29.4 Mtoe.
EU countries with a large potential for energy crops, forestry waste, agricultural residues and
waste such as Poland, the Baltic States and Romania have relatively little production today.
Gasification technology, but also better organisation of waste streams could unlock this
potential. However, another important element in this respect is the current penetration of gas
in the power sector and further downstream.
Given current trends, it will be highly challenging to meet the 2020 objectives. The economic
downturn has a negative effect on all renewable energy sources that are dependent on
government support. Other main hurdles with respect to biogas projects are lengthy
administrative and approval procedures, financing of projects where different stakeholders are
involved and changing regulations.
3.5 Regulatory framework
As is the case for most renewable energy sources, biogas production is still dependent on
subsidies to attract investors and establish a substantial scale. On the EU level, there is no
specific policy on biogas, but it is addressed in multiple policy documents and Directives that
are related to renewable energies and bioenergy. Biogas is included in three EU regulatory
frameworks: the Renewable Energy Directive (2009/28/EC)72
, the Directive on Waste
Recycling and Recovery (2008/98/EC) and the Directive on Landfill (1999/31/EC).73
The first
71European Biomass Association, ‘A Biogas Roadmap for Europe’, p. 18 72 ‘The use of agricultural material such as manure, slurry and other animal and organic waste for biogas production has, in
view of the high greenhouse gas emission saving potential, significant environmental advantages in terms of heat and power
production and its use as biofuel’. 73 Eurelectric, p. 46

of these is the result of the well known 20-20-20 targets. The last two can be viewed within
the context of EU organic waste management objectives.
As referred to in the previous paragraph, the National Renewable Action Plan forms the
framework for EU Member States to meet the 2020 targets. Biogas is one of the energy
carriers that is included in relation mainly to renewable electricity and heat production. The
incentive schemes to stimulate the development of biogas-related renewable energy are also
defined on the national level, although there are similar types of subsidies across Member
States. Certification systems, feed-in tariffs and investment support are examples of measures
that are widely applied. However, the actual implementation process differs and is dependent
on, amongst other things, national market conditions (e.g. energy prices), tax regimes and
economic policy. Germany has set an example of implementing robust subsidy systems for
renewable energy, which has led to significant growth of for example solar PV, but also
biogas plants. Figure 12 shows an overview of the main incentives for biogas in Germany, the
UK and Sweden.
Figure 12: Incentive schemes - Germany, Sweden and UK
Source: Author analysis74
The incentives schemes are subject to changes due to changing political climates or
progressive modification by policy makers. Support programs have been closed or changed
following, for example, a change of government or application criteria have been changed to
become stricter. This creates a certain regulatory risk for investors and uncertainty with
respect to the feasibility of renewable energy targets.
Regulation with respect to the biomass production can impact the availability of resources for
biogas and biomethane production. For example, due to the increasing use of energy crops
74 Federal Ministry for the Environment , Nature Conservation and Nuclear safety. RES Legal. http://www.res-
legal.de/en/search-for-countries, Swedish Gas Association, Department of Energy & Climate Change (DECC)
and more specifically maize silage, the German government has put a limit on the proportion
of maize and cereal grains in biogas production.75
Conversely, the use of municipal biowaste
is enforced.
Regulation can also impact the availability of feedstock for biogas production (anaerobic
digestion). For example, further implementation of the EU Waste Directive to reduce the
dumping of biodegradable waste can have a positive effect in this respect. Furthermore,
agricultural policy with respect to land availability for growing energy crops is an important
factor. For example, in 2011, the German Minister of Agriculture stated that the country could
raise the area of land on which it grows crops for use in energy generation to about 3 million
hectares (7.4 million acres) by 2020 from 1.8 million hectares currently.76
Potential further advancement of sustainability criteria as discussed in section 1.1.4 and public
opinion should also be taken into account in the feedstock availability assessment.
Currently, the standards for grid injection of upgraded biogas (biomethane) are defined on the
national level, although the threshold values of the major parameters (carbon dioxide,
hydrogen sulfide, water, heating value) tend to be broadly consistent across the EU.77
Harmonization of biomethane quality standards could facilitate cross-border in future.
Especially when volumes become more substantial, this becomes more relevant in the EU gas
market integration context. The Directorate General of Energy has given the European
Standards Organization (CEN) a mandate to develop standards for grid injection and fuel
quality standards for biomethane use in transport applications.78
3.6 Economics
The economics of a biogas plant today are inextricably linked to regulatory support schemes
that are developed and adjusted by national governments or related agencies. In most
European countries where biogas production is encouraged, the incentive such as the feed-in
tariff varies according to system size and type of feedstock. The level of required support to
realize a profitable investment depends on the capital and operational costs, but also on the
development of fuel prices and the CO2 price. The economic viability of a plant will improve
in a scenario with rising natural gas prices and a more mature CO2 market.
The investment costs of a biogas plant are mainly related to its size and feedstock mix. Both
also depend on local conditions such as distance to existing energy infrastructure and
availability of feedstock and the concept (own use vs. large scale sales of heat or grid
injection). Depending on design, the investment can consist of the following equipment:
feedstock storage, pre-treatment (dehydration), digesters (including machinery and
electrical/control equipment), infrastructure, gas treatment, gas storage, CHP units, heat
exchangers, gas upgrade installation (e.g. CO2 removal). Construction costs are generally
included in the capital expenditure. Figure 13 shows investment cost estimates for co-
digestion biogas plants in the UK, Germany and The Netherlands. For plants with a capacity
75 Strauch, S., Krassowski, J., Fraunhofer Umsicht, ‘Overview of Biomethane market and regulations in partner countries’,
Written within the project GreenGasGrids, supported by the Intelligent Energy Europe Programme, March 2012, p. 19.
76 Bloomberg.com, ‘Germany May Grow More Biofuel Crops for Energy Output, Passauer Reports’, 26 April 2011
77 Huguen, P., Le Saux, G., ‘Perspectives for a European standard on biomethane: a Biogasmax proposal’ December 2010,
p.9.
78 Baxter, D., JRC European Commission, JRC, IEA Bioenery Task 37, September 2011

of around 500m³, estimates of investment costs vary by some €900,000.79
The variation is
mainly driven by differences in the feedstock mix and related storage facilities for storage of
the substrate.
Figure 13: Investment costs for biogas plants
Source: The National Non-Food Crops Centre, Deutsche Energie-Agentur, ECN
Obviously, the investment also correlates with the plant size. DENA estimated the investment
costs of a 1,000 m³ and 2,000m³ plant (10% liquid manure, 90% maize silage) to be €4.4
million and €7.9 million respectively, confirming to a degree the scope for economies of
scale.80
Capital costs are clearly a key factor in the cost of biogas production. Depending on the share
and type of substrate, feedstock is another key cost item (including transport and storage).
Other items are: heat and electricity use, maintenance costs, personnel costs and process costs.
Again, these costs are driven by the feedstock mix, applied technology, site conditions and
plant size.
In a study by German Research Centre for Geosciences (GFZ), three co-digestion biogas plant
concepts in Germany have been assessed.81
The first plant is a biogas plant in combination
with two CHP units processing a combination of biowaste and sewage sludge for electricity
generation. The plant is capital intensive (see Figure 14) due to factors including investments
in substrate pre-treatment equipment and high construction costs. This is reflected in
relatively high capital costs and digestate treatment costs. Despite the fact that feedstock costs
are low, the overall production costs are high. Figure 14 shows the huge gap that has to be
bridged to make this plant profitable. In this case, subsidies on top of the basis feed-in tariff
account for 73% of the revenue. These subsidies are granted in relation to valorization of the
feedstock.
79 Stoddart, H., NNFCC, ‘Anaerobic Digestion: Economics’, 2010. Germany Energy Agency (DENA), ‘Technologies and
Costs of Conditioning Biogas and Feeding into the Natural Gas Network’ September 2010, p.91-94. ECN, KEMA, , ‘Base
rates in the SDE+ scheme 2012’, September 2011, p.24
80 German Energy Agency (DENA), ‘Technologies and Costs of Conditioning Biogas and Feeding into the Natural Gas
Network’ September 2010, p.91-94. 81 Balussou, D., Kleyböcker, A., McKenna, R., Möst, D., Fichtner, W. (2012): ‘An economic analysis of three operational co‐digestion biogas plants in Germany. ‐ Waste and Biomass Valorization, 3, 1, 23‐ 41’ GFZ, Helmholtz -Zentrum Potzdam,
2012.
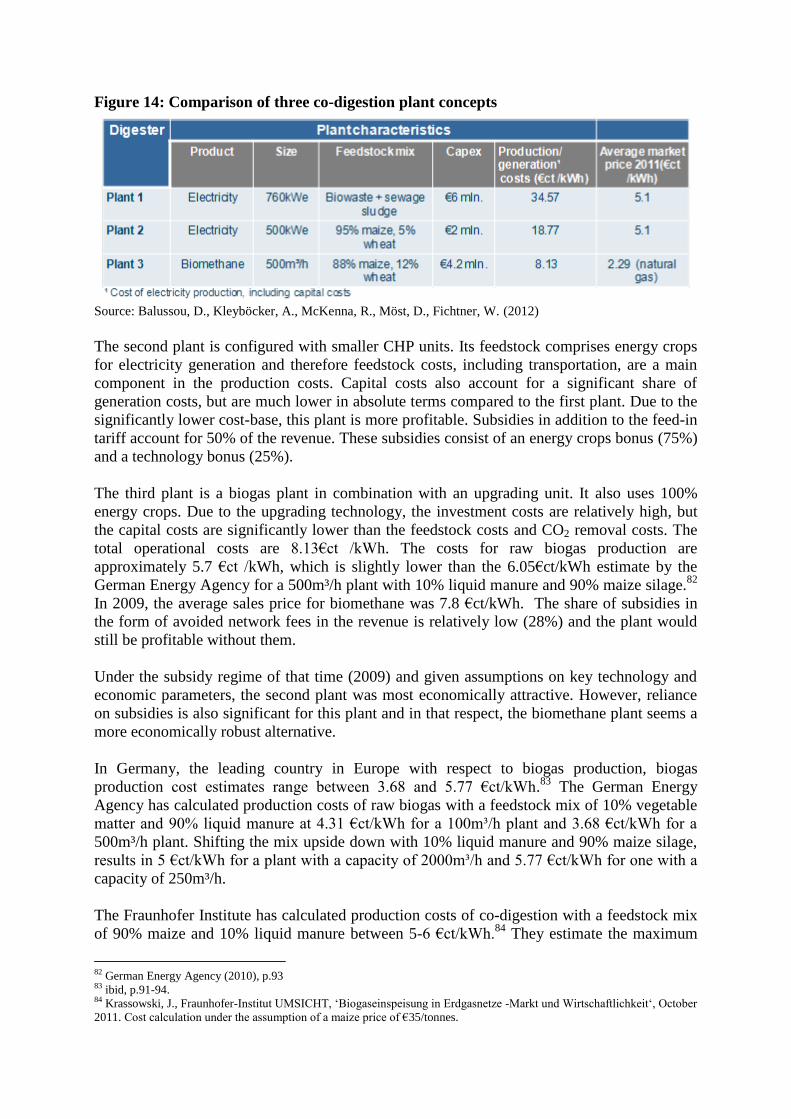
Figure 14: Comparison of three co-digestion plant concepts
Source: Balussou, D., Kleyböcker, A., McKenna, R., Möst, D., Fichtner, W. (2012)
The second plant is configured with smaller CHP units. Its feedstock comprises energy crops
for electricity generation and therefore feedstock costs, including transportation, are a main
component in the production costs. Capital costs also account for a significant share of
generation costs, but are much lower in absolute terms compared to the first plant. Due to the
significantly lower cost-base, this plant is more profitable. Subsidies in addition to the feed-in
tariff account for 50% of the revenue. These subsidies consist of an energy crops bonus (75%)
and a technology bonus (25%).
The third plant is a biogas plant in combination with an upgrading unit. It also uses 100%
energy crops. Due to the upgrading technology, the investment costs are relatively high, but
the capital costs are significantly lower than the feedstock costs and CO2 removal costs. The
total operational costs are 8.13€ct /kWh. The costs for raw biogas production are
approximately 5.7 €ct /kWh, which is slightly lower than the 6.05€ct/kWh estimate by the
German Energy Agency for a 500m³/h plant with 10% liquid manure and 90% maize silage.82
In 2009, the average sales price for biomethane was 7.8 €ct/kWh. The share of subsidies in
the form of avoided network fees in the revenue is relatively low (28%) and the plant would
still be profitable without them.
Under the subsidy regime of that time (2009) and given assumptions on key technology and
economic parameters, the second plant was most economically attractive. However, reliance
on subsidies is also significant for this plant and in that respect, the biomethane plant seems a
more economically robust alternative.
In Germany, the leading country in Europe with respect to biogas production, biogas
production cost estimates range between 3.68 and 5.77 €ct/kWh.83
The German Energy
Agency has calculated production costs of raw biogas with a feedstock mix of 10% vegetable
matter and 90% liquid manure at 4.31 €ct/kWh for a 100m³/h plant and 3.68 €ct/kWh for a
500m³/h plant. Shifting the mix upside down with 10% liquid manure and 90% maize silage,
results in 5 €ct/kWh for a plant with a capacity of 2000m³/h and 5.77 €ct/kWh for one with a
capacity of 250m³/h.
The Fraunhofer Institute has calculated production costs of co-digestion with a feedstock mix
of 90% maize and 10% liquid manure between 5-6 €ct/kWh.84
They estimate the maximum
82 German Energy Agency (2010), p.93 83 ibid, p.91-94. 84 Krassowski, J., Fraunhofer-Institut UMSICHT, ‘Biogaseinspeisung in Erdgasnetze -Markt und Wirtschaftlichkeit‘, October
2011. Cost calculation under the assumption of a maize price of €35/tonnes.

potential scale effect at 1€ct/kWh (500m³/h – 2,000m³/h). The production of raw biogas
accounts for two thirds of the total costs of producing and selling biomethane. Economics of
biomethane will be discussed in chapter 5.
Cost savings can be achieved by, amongst other things, own use of the heat instead of gas
and/or use waste heat from the CHP unit (if applicable). Furthermore, the electricity produced
can replace more expensive grid-based power. Process optimization to minimize heat losses
and increase plant efficiency also improves the economic viability. Another cost saving option
is the own use of the digestate that is used as biofertilizer. The fertilizer value of digestate
depends on the nutrients present in the feedstock.85
The attractiveness will depend on fertilizer
prices.
Figure 15: Cost structure for biomethane
Source: Fraunhofer Umsicht
The revenues of a biogas plant are in most cases related to the associated electricity or heat
production and sales, which are subsidized through for example a feed-in tariff. In addition, in
some European countries, upgraded biogas can be sold to the market via a certification body.
Changes in subsidies lead to shifting economics for the plant types, based on feedstock use
and size. Another source of income is sales of the digestate.
3.6.1 Costs of feedstock
As discussed in the previous section, feedstock costs have a large impact on the economic
viability of a biogas plant. Depending on the type of feedstock, they could account for up to
50% of production costs. Main feedstock cost elements are land costs, labour costs,
transportation costs, fertilizer and capital costs (machinery, maintenance).86
Other costs
include storage and handling.
Waste and manure often have negative or zero costs as they have to be processed in some
manner prior to disposal. This is a factor influencing the business case. Biogas plants that
consume waste get economic compensation for the service, also known as gate fees. In a
85 Lukehurst, C.T., Frost, P., Al Seasi, T., IEA Bioenergy, ‘Utilisation of digestate from biogas plants as biofertiliser’ June
2010, p. 7. 86 De Wit, M.P., Faaij, A.P.C., Refuel work package 3, ‘Biomass resources, potential and related costs’ Copernicus Institute-
University of Utrecht, January 2008, p. 18.

study issued by the DECC, fees for disposal of food waste were estimated between £37/t-
£54/t.87
For energy crops (forestry biomass) it is different. There are multiple markets for these market
resources. For example, the food and energy industry are competitors in the maize market.
The price for energy crops such as maize silage and wheat differ by country and region due to
national and local supply-demand dynamics and regulations. In Germany for example, maize
prices range between 20-50€/t. In the study by GFZ (see previous section), maize prices are
assumed at 30€/t and wheat at 120€/t). In the economic assessment of a manure co-digestion
plant in the Netherlands, ECN has used a five year (2006-2011) average maize price of
€34.8/tonne.88
In the DECC study, energy crop prices, which include grass silage as well as
maize are assumed to range from 16 to £27.5£/t.
87 DECC, ‘analysis of characteristics and growth assumptions regarding ad biogas combustion for heat, electricity and
transport and biomethane production and injection to the grid’, May 2011, p.8 88 ECN, KEMA, ‚Base rates in the SDE+ scheme 2012‘ September 2011, p.17

4 Bio Synthetic Gas
Next to the anaerobic digestion route that has been discussed in the previous chapter, biomass
gasification represents a second route to produce biomethane. Via a thermo-chemical
production process, (see section 2.1) solid (woody) biomass is converted into gas with
relatively high methane content (approximately 95%). The gasification of biomass for the
production of heat and electricity has been successfully demonstrated and is a mature
technology. However, the methanation process step to produce bio synthetic natural gas is still
at the R&D phase. The bio SNG production process can be subdivided into 5 steps89
:
1. Biomass pre-treatment. Adaptation of the biomass size to meet the demands of the
feeding system and of the drying of the biomass to reduce the energetic losses of the
gasification process.
2. Biomass gasification. Thermo-chemical conversion process, where the gasification
media (pretreated fuel) is converted into gaseous fuel (raw gas) with the main
components CO2, CO, H2O, H2 and depending on the gasification parameters certain
amounts of CH4.
3. Gas cleaning.To avoid catalyst poisoning in the subsequent synthesis (e.g. caused by
organic sulphur) and damage to other plant components(e.g. corrosion of heat-
exchanger surfaces) the raw gas has to be cleaned after leaving the gasifier.
4. Methanation. Catalyst-based synthesis with the aim of increasing the methane content
of the cleaned gas.
5. Raw-SNG upgrading. The raw-SNG upgrading includes the separation of carbon
dioxide, water and, depending on the raw-SNG quality, other gas components (e.g.
hydrogen) to fulfill the quality criteria for grid injection.
Gasifiers can be divided into high temperature gasifiers (typicallly 1,300 – 1,500°C), which
produce a syngas, and medium temperature gasifiers (typically 850°C) that produce a
producer gas.90
Syngas does not contain hydrocarbons such as methane, while the producer
gas contains up to 50% of hydrocarbons. The latter obviously is best suited for bio SNG
production and therefore the medium temperature gasifier is the preferred technology.
The medium temperature gasifiers can be divided into fixed bed down-draft gasifiers and
fluidized bed gasifiers.91
The former are widely used to produce gas for gas engines and are
known for their simplicity and relatively low investment cost. The fluidized bed gasifier can
process a wide variety of biomass sources and is mostly preferred for large scale operations
such as potentially the production of biomethane.
There are a number of gasification demonstration projects in Europe:92
SNG Demonstration plant in Güssing, Austria: 1MWSNG demonstration plant,
ambition for upscaling to 20-200MW;
The Gothenburg Biomass Gasification Project: 20MW biomethane production, start
up expected end of 2012 and upscaling to 100MW in 2015;
89 Deutsches BiomasseForschungsZentrum gemeinnützige (DBFZ), ‘Focus on Biomethane, Biomass for Energy‘ 2012, p.7 90 Van der Meijden, C.M., Rabou, L.P.L.M., Van der Drift, A., Vreugdenhil, B.J., Smit, R., ECN, ´Large scale production of
bio methane from wood´, October 2011, p. 8. 91 Van der Meijden, C.M., et al., ECN, p.8 92 European Biofuels Technology Platform, ‘ Bio-SNG (Synthetic Natural Gas) and Gasification Technologies’,
http://www.biofuelstp.eu/bio-sng.html.

The ECN/HVC Project for BioSNG; 1MW pilot plant under commissioning, plans for
building 10MW CHP demo plant. After proven concept, possible second demo plant
of 50MWSNG.;
E.ON Bio2G Project in Sweden: 200 MW gasification plant, construction planned to
commence in 2013.
The feedstock potential for gasification is larger compared to anaerobic digestion as a wider
range of (woody) biomass sources are applicable and also the estimated amount of available
resources is larger (see chapter 1). Because of the use of different types of feedstock, the two
technologies do not compete in that respect. However, as long as biomethane production is
dependent on regulatory support, there could be competition for subsidies.
Because bio SNG production is still in the R&D and demonstration phase, there are very little
data on the economic performance of an integrated installation (from pre-treatment to raw bio
SNG upgrade). As is the case for co-digestion with a large share of energy crops, feedstock
costs are a key driver of the economic viability.
ECN has calculated the biomethane production costs based on biomass cost scenarios ranging
between zero €/GJ (local sources for small scale operation) and 6 €/GJ (global market for
larger plants) and different plant scales (10-1,000MW).93
Production costs range between 24
€/GJ for a small plant (10MW) with biomass costs of 6 €/GJ and 5€/GJ for a 1,000 MW plant
with no feedstock costs. Obviously, these are extreme cases. The costs for a 200MW plant
based on biomass costs of 2 €/GJth or 4€/GJth would be 12 €/GJ and 15€/GJ respectively. With
a current gas price of approximately 7.5 €/GJ (€27/MWh), biomethane production via the
gasification route will have to be subsidized to make a profitable business. Further scale
effects could be realized when increasing the plant to 1,000MW, but this will probably still
not be sufficient to achieve natural gas price parity.
The production of biomethane via the gasification route can potentially lead to a dramatic
increase of the share of biomethane in renewable energy supply. A much larger scale can be
established with a resource base that is global and has a higher potential than anaerobic
digestion-related biomass. However, the technology development is in the demonstration
phase and most likely, it will also depend on subsidies or other incentives to become
economically viable. The coming years will be important: if no serious progress is made, it is
not likely that gasification will play a substantial role up to 2030.
93 Van der Meijden, C.M., et al., ECN, p.11

5 Downstream biogas markets
As briefly addressed in chapter 3, biogas can be used in more or less all the downstream
applications that are developed for natural gas. Today, biogas is largely used as fuel in
combined heat and power plants. Alternatively, biogas can also be upgraded and used as a
vehicle fuel (bio CNG) or injected into the grid as a substitute for natural gas. The methane in
the biogas can also be utilized in industrial processes and as a raw material in industry.
Depending on the end use, different treatments steps are required. The upgrading
opportunities open up a potential large market for biogas as a renewable alternative for natural
gas. The advancement of grid injection has created competition between the biogas
downstream routes. The competitiveness of the different options is driven by a combination of
technological, economic and regulatory factors. Technological advancements, fluctuating
prices of feedstock and equipment and the introduction of new incentives or amendment of
existing subsidies, can impact the viability of each option. This viability especially has a large
impact as its scope is not limited to subsidies, but can affect the availability of waste and
energy crops. In this chapter, three main end user markets are discussed: (combined)
electricity and heat production, transport and grid injection.
Figure 16: Downstream routes for biogas
Source: Author's Schematic
5.1 Combined heat and power
The majority of the biogas is used for heat or combined heat and power production, which is
driven by the subsidy schemes to stimulate renewable energy mentioned earlier. First of all, a
relatively small part of the biogas is used in boilers to produce heat only or in industrial
applications for steam generation. Heat-only installations are mainly linked to small scale ‘on-
farm’ biogas plants. Most of the biogas plants are connected to electricity or combined heat
and power production. The CHP installation is often located close to the digester. Gas engines
are most commonly used and can reach an electrical efficiency of 30-45%, depending on gas
engine type and size. The thermal efficiency rate ranges between 35-60%. The overall
efficiency of combined heat and power production units can reach around 85%. The capital
cost of a CHP (gas engine) unit depends on size: €900/kWelfor a 150kWel unit and
€560kWelfor a 500kWel unit.94
Waste and energy crop-based digesters are commonly used in
these configurations as a minimum scale is required to be viable. In addition, the viability is
also dependent on the proximity to the electricity and / or heat grid.
94 Fachagentur Nachwachsende Rohstoffe e.V. (FNR), ‚Biogas - an introduction, January 2009, p.24.
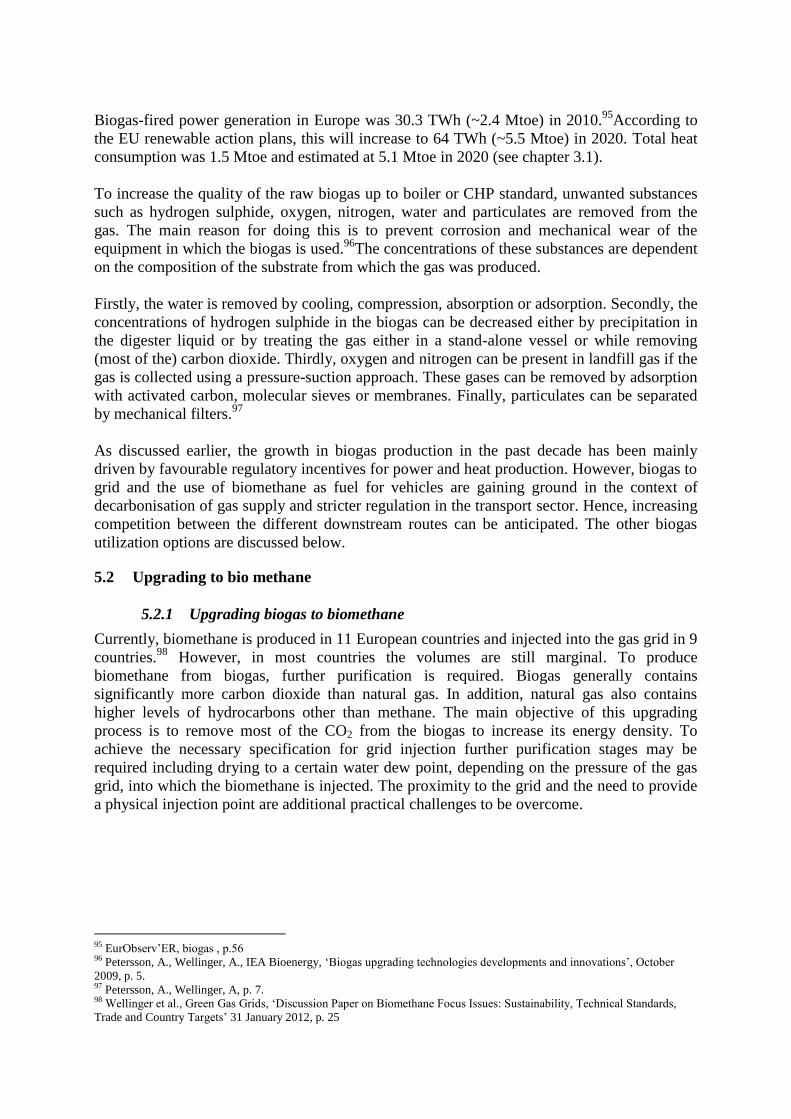
Biogas-fired power generation in Europe was 30.3 TWh (~2.4 Mtoe) in 2010.95
According to
the EU renewable action plans, this will increase to 64 TWh (~5.5 Mtoe) in 2020. Total heat
consumption was 1.5 Mtoe and estimated at 5.1 Mtoe in 2020 (see chapter 3.1).
To increase the quality of the raw biogas up to boiler or CHP standard, unwanted substances
such as hydrogen sulphide, oxygen, nitrogen, water and particulates are removed from the
gas. The main reason for doing this is to prevent corrosion and mechanical wear of the
equipment in which the biogas is used.96
The concentrations of these substances are dependent
on the composition of the substrate from which the gas was produced.
Firstly, the water is removed by cooling, compression, absorption or adsorption. Secondly, the
concentrations of hydrogen sulphide in the biogas can be decreased either by precipitation in
the digester liquid or by treating the gas either in a stand-alone vessel or while removing
(most of the) carbon dioxide. Thirdly, oxygen and nitrogen can be present in landfill gas if the
gas is collected using a pressure-suction approach. These gases can be removed by adsorption
with activated carbon, molecular sieves or membranes. Finally, particulates can be separated
by mechanical filters.97
As discussed earlier, the growth in biogas production in the past decade has been mainly
driven by favourable regulatory incentives for power and heat production. However, biogas to
grid and the use of biomethane as fuel for vehicles are gaining ground in the context of
decarbonisation of gas supply and stricter regulation in the transport sector. Hence, increasing
competition between the different downstream routes can be anticipated. The other biogas
utilization options are discussed below.
5.2 Upgrading to bio methane
5.2.1 Upgrading biogas to biomethane
Currently, biomethane is produced in 11 European countries and injected into the gas grid in 9
countries.98
However, in most countries the volumes are still marginal. To produce
biomethane from biogas, further purification is required. Biogas generally contains
significantly more carbon dioxide than natural gas. In addition, natural gas also contains
higher levels of hydrocarbons other than methane. The main objective of this upgrading
process is to remove most of the CO2 from the biogas to increase its energy density. To
achieve the necessary specification for grid injection further purification stages may be
required including drying to a certain water dew point, depending on the pressure of the gas
grid, into which the biomethane is injected. The proximity to the grid and the need to provide
a physical injection point are additional practical challenges to be overcome.
95 EurObserv’ER, biogas , p.56 96 Petersson, A., Wellinger, A., IEA Bioenergy, ‘Biogas upgrading technologies developments and innovations’, October
2009, p. 5. 97 Petersson, A., Wellinger, A, p. 7. 98 Wellinger et al., Green Gas Grids, ‘Discussion Paper on Biomethane Focus Issues: Sustainability, Technical Standards,
Trade and Country Targets’ 31 January 2012, p. 25
Figure 17: Process steps for biogas upgrading
Source: DBFZ
A number of upgrading technologies are commercially available:99
Pressure Swing Adsorption. The CO2 is separated by adsorption on a surface under
elevated pressure. The usual adsorption material is activated carbon or zeolites.
Absorption. The raw biogas meets a counterflow of liquid in a column which is filled
with plastic packing. The liquid leaving the column will contain increased
concentration of carbon dioxide as the latter is more soluble than methane. Water
scrubbing is the most common upgrading technique and plants are commercially
available from several suppliers in a broad range of capacities. In addition, organic
physical scrubbing and chemical scrubbing based on amine solutions are applied
technologies.
Membranes. Dry membranes for biogas upgrading are made of materials that are
permeable to carbon dioxide, water and ammonia. Usually membranes are in the form
of hollow fibres bundled together. This is a common method for landfill gas
upgrading.
Cryogenic upgrading. This is a relatively new technology. It makes use of the different
boiling/sublimation points of the various gases particularly for the separation of
carbon dioxide and methane.
Before it is fed into the natural gas network, the quality and quantity of the biomethane
produced is metered. A number of EU countries have national standards for injection of
biomethane. As discussed in chapter 3.5, there are initiatives at the EU level to harmonize
grid injection standards for new gases. Fraunhofer Umsicht, a German energy technology
institute, has estimated upgrading costs within a range of 1.4-2.3 €ct/kWh (Figure 18). Scale
effects can be achieved by central upgrading, linking different biogas producers to one
upgrading installation.
99 Ibid., p.9

Figure 18: Biomethane production costs
Source: Fraunhofer Umsicht
5.2.2 Gas distribution (grid injection)
The upgrade to biomethane and injection in the gas grid significantly increases the market
potential for biogas. Traditional natural gas users such as power plants, industries and
households gain access to renewable gas, albeit mixed with conventional gas within the grid.
The biomethane injected into the grid has to meet national quality standards. The energy
density, the Wobbe Index and other components (e.g. micro-organisms) are measured and if
required, the biomethane is enriched with propane. Furthermore, odorant is added and the
pressure is regulated up to the level that is required at the entry point of the respective grid.
Costs for grid injection are estimated to range between 0.1-0.3 €ct.kWh (see Figure 18),
which is a small fraction of total biomethane costs. Biomethane injection in the gas grid is
increasing, especially in Germany, the Netherlands and Sweden. In these countries, grid codes
have been developed to facilitate injection and ensure a constant gas quality in the grid.
Figure 19: Biomethane sourcing and sales price versus natural gas price in Germany
Source: Bundesnetzagentur, ‘Biogas Monitoringsbericht‘

Figure 20: Cost of biomethane production versus natural gas price in the Netherlands
Source: ECN, KEMA, ‘Base rates in the SDE+ scheme 2008-2012’
Although injected volumes of biomethane are increasing, subsidies are still required for it to
be commercially attractive compared to the reference fuel, natural gas. Figure 19 shows the
average sales price of biomethane compared to the average spot price of natural gas in
Germany from 2008 to 2011.100
Prices converge in 2010 and 2011 due to oversupply of
biomethane, but the gap between the sourcing price and the natural price is still more than
3€ct/kWh as the production costs have to be recovered.
In the Netherlands, the gap between TTF prices and costs of biogas produced from landfill
and sewage treatment is relatively small (figure 20).101
This is mainly due to the negative
feedstock costs. However, the potential for growth for both technologies is limited. This
growth is expected to mainly come from co-digestion, which includes the use of more costly
energy crops. A substantial subsidy is required for this technology to compete with
conventional gas. Hence, to establish serious market volumes and meet at least 50% of the
ambitious government targets by 2020 and 2030, in both the Netherlands and Germany, will
require backing by significant financial support from their governments.
5.3 Biomethane as vehicle fuel
Biomethane can also be used as a renewable transport fuel in vehicles designed to run on
compressed natural gas (CNG) or liquefied natural gas (LNG). The biomethane that will
predominantly be supplied to the fuel station through the grid is probably either compressed
(CBM) or liquefied (LBM). In the case of CBM, the biomethane is compressed through a
multiple stage reciprocating compressor to 250-300 bar and stored in a cascade storage system
and finally dispensed to the vehicle.
To produce liquid biomethane, the gas is cooled and stored at -160 °C. Subsequently, vehicles
are refuelled with LBM through a cryogenic liquid transfer pump and metering system in
100
Bundesnetzagentur, ‘Biogas Monitoringsbericht 2011 and 2012, May 2011,2012, p.32, p.27 101 ECN, KEMA, ‘Base rates in the SDE+ scheme 2008-2012’.

much the same way as a conventional petrol or diesel pump but designed to cope with the low
temperature.102
The advantage over CBM is the higher fuel density, which allows for smaller
storage. On the other hand, the fuel is less stable and requires more safety precautions when
filling a vehicle.103
The challenge of providing the infrastructure (refuelling stations) is a key challenge to
growth. Existing gas filling stations could be used to accommodate the penetration of
biomethane in the transport sector. However, this will require proximity to a biogas
production site. Alternatively, the filling station could buy certificates in order to sell the
CNG as CBM. This will have to be facilitated by a regulatory framework that supports a well
functioning certifying system with sufficient market depth.
In 2011, there were more than 1 million natural gas vehicles (NGV) and 2,800 CNG refueling
stations in the EU.104
This represents a very small share of the total EU vehicle market: 0.38%
vehicles, 1.7% buses, 0.09% trucks. The introduction of small scale LNG or LBM could
stimulate the use of natural gas or biomethane in trucking. Italy is the front runner in Europe
with 780,000 NGVs and 860 refuelling stations in 2011. With 903 refueling stations,
Germany has the lead in terms of refuelling stations, but it ‘only’ has 96,000 NGVs. Hence,
Germany has potential for significant growth for NCG and possibly CBM.
Arguments that are used for the promotion of NGVs are the reduction of PM and NOx
emissions and tailpipe CO2 reduction. Furthermore, according to the calculations of the
Natural Gas Vehicle Association, the average CNG price in December 2011 was 0.71€/litre
gasoline equivalent and 0.80€/litre diesel equivalent. Average gasoline and diesel prices in
Europe were 1.47€/litre and 1.42€/litre respectively.105
In a UK case study, the price of CNG
with a blend of 10% biomethane has been estimated at 0.76€/m³, which corresponds with
approximately 0.7 €/litre gasoline equivalent.106
In addition to the cost of production and injection of biomethane, the costs of compression (to
250 bar), storage and service costs at the refuelling station are estimated at 0.11€/m³ ~1.1
ct/kWh).107
The total costs for CBM or LBM depend on earlier discussed factors across the
whole value chain such as type of feedstock, biogas plant size and location.
5.4 Feedstock for chemicals
Biomethane could also be an alternative for natural gas as feedstock to produce bio-based
chemicals. Natural gas based chemical products are used in several end user markets. In
Western Europe, most of the gas is used for the production of ammonia. Uses of ammonia
include fertilizer manufacture, animal nutrition and refrigeration. Other derivatives are
methanol, oxo chemicals, acetylene, hydrogen cyanide and carbon disulfide.108
Methanol is
for example used in the production of plastics, fuel and vitamins. Germany is the largest user
of natural gas as feedstock. As is the case for other biogas or biomethane applications, the
penetration will largely depend on subsidies as long as the natural gas price is significantly
lower than that of biomethane.
102 DECC, May 2011, p. 92-102. 103 Ibid., p. 100. 104 NGVA Europe, ‘European NGVs and stations December 2011’, ‘European Pricing Comparisons 2011’. 105 ibid,. 106 Murphy, J.D., Environmental Research Institute, University College Cork, ‘Task 37 Energy from Biogas’, April 2011. 107 Murphy, J.D., Biofuels Research Group, ERI (University of Cork), ‘Cost of Biomethane’, 15 April 2010 108 Arthur D. Little, ‘Biogas as a feedstock for Chemical Manufacture‘, 2010

5.5 Country cases
5.5.1 Sweden
Sweden has been at the forefront of developing upgrading technologies for biogas. In 2010,
47 upgrading plants were in place of which 7 plants have a grid connection. The main driver
for biomethane production is the renewable target in the transport sector. It is the ambition to
have a fossil fuel free vehicle fleet in 2030. In 2010, approximately 56 mcm of biomethane
was produced.109
94% was sold to the transport sector, which makes Sweden front-runner in
Europe with respect to the introduction of biogas in transport. Sweden has no specific target
for biomethane production.
5.5.2 Germany
As discussed in chapter 3, Germany has more than 7,000 biogas plants in operation. Since
2008, the number of upgrading facilities that also inject the biomethane into the gas grid has
been increasing rapidly. By the end of 2012, it is estimated that there will be around 160
upgrading plants, compared to 15 in 2008.110
This corresponds approximately to total output
capacity of 92,000m³/h. The plant sizes vary between 300m³/h and 10,000m³/h. The ambition
of the German Government is to inject 6 bcm/year of biomethane by 2020 and 10 bcm/year
by 2030. In 2011, 77 biogas upgrading plants fed 275 mcm into the gas grids, an increase of
54% over 2011 (179 mcm).111
However this is only 4.6% of the 2020 target of 6 bcm.
5.5.3 United Kingdom
The United Kingdom has a regulatory framework in place that supports the development of
biogas and biomethane, however the majority of biogas plants are related to sewage treatment.
While anaerobic digestion based on agriculture biomass is increasing, in 2011, only 2
upgrading facilities were in operation.112
The UK has an extensive gas infrastructure, which
offers significant market potential for biomethane. The government has communicated an
unofficial target of 650 mcm/year production by 2015 in relation to renewable heat, but it is
not likely that this will be met.
109 Strauch, S., Krassowski, J., Fraunhofer Umsicht, p. 41. 110 Ibid., p. 19. 111 Germany Energy Blog, ‘Biogas Still Far Away from 2020 Target – Potential to Balance Fluctuating Renewable Energy’,
June 12, 2012. http://www.germanenergyblog.de. 112 Strauch, S., Krassowski, J., Fraunhofer Umsicht, p. 49.

6 Biomethane development and implications for natural gas
As discussed in previous chapters, the majority of current biogas production is utilized for
renewable heat and power generation. In counties such as the UK and the Netherlands where
natural gas dominates distributed generation, further growth of biogas-fired CHPs can be at
the cost of the share of natural gas, but will probably first replace coal-fired power and heat
generation, assuming an increasing carbon constraint. In the assessment of possible
implications for natural gas, it is more obvious to focus on upgraded biogas (biomethane) that
is either injected into the grid for supply to traditional end users or compressed or liquefied to
serve the transport sector. Grid injection is currently the most viable route, with the largest
potential impact on natural gas supply. This predominantly applies to the mature European
gas markets with a well-developed infrastructure such as the UK, the Netherlands and
Germany.
Natural gas vehicles, a potential downstream growth gas market is still at a relative early stage
(see chapter 5.3) and may not represent huge potential in the traditional gas countries. Sweden
is an example of a non-traditional gas market that is one of the frontrunners in Europe, also
with respect to the penetration of CBM. Therefore, the impact of biomethane as a vehicle fuel
on the natural gas business is rather limited, at least in the short term, due to the small size of
the market, but could on the other hand be viewed as a lever for growth of total gas demand in
transport.
Estimates of the potential size of the biomethane-to-grid market differ and in many European
countries it is virtually non-existent as the core focus is on power and heat production and/or
the overall role of gas in the energy system is relatively small. Germany is most advanced
with setting targets. The government has communicated the ambition to inject 6bcm/year by
2020 and 10 bcm/year by 2030. These numbers correspond with a share of 7% and 11% of
total gas consumption in the respective years.113
The Netherlands has adopted a target of 700 mcm by 2020 in the context of the EU 2020
policy, but there is no official ambition for 2030.114
The 2020 target corresponds with a share
of approximately 2% of estimated natural gas demand. The organisations promoting
biomethane development have communicated an ambition of 3 bcm/year by 2030. Looking at
current grid injection volumes, it will be highly challenging to meet these 2020 targets. In the
Netherlands, 15 mcm was injected in 2011, which is only a very small fraction of the
envisaged 700 mcm.115
Germany injected only 5% (~300mcm) of the 2020 target in 2011,
which corresponds with around 80 biomethane plants.116
To realize the 2020 objective, 1,000
plants would be required.
The UK has no official target for grid injection, but the DECC has set a target of 7TWh (~650
mcm) renewable heat from biomethane by 2020.117
Looking at the projections and current developments, it is reasonable to assume that
biomethane will not reach substantial volumes in Europe by 2020 and will therefore have
limited effect on the natural gas business. However, the coming 8 years are important in the
113 CERA, ‘Long Term Demand Outlook Europe, June 2011. 114 National Renewable Action Plan for the Netherlands, submitted by the Dutch Government to the European Commission in
June 2010, p. 106 115 Central Bureau for Statistics, ‘Renewable Energy in the Netherlands 2011’ p.89 116 Intelligent Energy Europe, ‘Overview of biomethane markets and regulations in partner countries’, March 2012, p.20. 117 http://www.nationalgrid.com/uk/Gas/SustainableGasGroup.

sense that a critical mass could be realized to embed biomethane in gas supply and to
establish a mature market with sufficient liquidity and depth.
After 2020, the potential of anaerobic digestion can be further enhanced, especially if large
scale production of energy crops is permitted for this purpose. A real leap forward in volumes
will largely depend on the large scale introduction of gasification technology. As discussed in
chapter 4, the production of bio synthetic gas offers much larger potential than anaerobic
digestion due to the wider range of globally available feedstock and hence potentially larger
scale production. There are a number of pilot plants in Europe, but the step to large scale
commercial operation is subject to many uncertainties. As with most renewable energy
technologies, development is dependent on regulatory support, but could also be driven by
obligations for gas suppliers to supply a certain share of renewable gas. Furthermore, the
rationale for investors is also linked to, for example, the development of gas prices and
strategic considerations to include renewable gas in the portfolio to promote a sustainable
image.
In addition, the establishment of a European cross border trade system of issuing, registration,
handling and off-setting trade-able biomethane certificates, could accommodate transfer of
biomethane from countries with high feedstock potential to more mature gas markets such as
the Netherlands and the UK that are more constrained in the production of energy crops on a
large scale. Consequently, yearly sold volumes could further increase. This trade could for
example be incorporated in the existing European Energy Certificate System (EECS)
framework. The green gas grid initiative, a project within the framework of Intelligent Energy
Europe to promote the production of biomethane and injection into the natural gas grid
allowing international trade, includes a work stream to develop a European trading scheme.
Realization of such a schema can further stimulate biomethane market development.
If there is a successful introduction of gasification, optimal use of anaerobic digestion
potential and options for cross border trade, the volumes of injected biomethane could reach
material proportions; i.e. up to 10-20% of national gas consumption. This can be a 1 on 1
replacement of natural gas in mature gas markets such as the UK, Germany and the
Netherlands. In such a scenario, the traditional natural gas business would clearly lose market
volume. This loss will probably come on top of already decreasing demand due to further
efficiency improvements in the residential and commercial sector and increasing penetration
of renewable technologies in the power sector. However, decarbonisation of a substantial
share of gas consumption can also enhance the credibility for gas as long term fuel in a carbon
constrained world.
The feasibility of such a scenario is not high given the current pace of biomethane grid
injection development and the level of subsidy required. It also differs by country. Germany
seems to be taking the next step to scale up injection although the 2020 targets will probably
not be met. The outlook in the UK is on the other hand more questionable and injection still in
a early stage.
Although at present unlikely, the high market penetration scenario should be re-evaluated in
five years’ time when there is more clarity on whether the promise of biomethane is
substantiated by a dramatic growth in digesters and upgrading plants and forecasts on
gasification are further backed by more field experience.

In the meantime, biomethane is one of the renewable options and as mentioned above can be a
lever for growth of gas in transport and also serve as a pillar of a decarbonisation strategy for
gas.118
118 Van Foreest, F., Oxford Institute for Energy Studies, ‘Does natural gas need a decarbonisation strategy?’ May 2011

7 Conclusions
Estimates of future biomass potential vary significantly due to different assumptions on the
type of biomass and technical, economical and ecological limitations to biomass supply.
Globally, the potential ranges between 1,150-34,500 Mtoe in 2050. Projections of the
European potential in 2020 range between 120-235 Mtoe. The main biomass sources today
are forestry residues and waste from the paper and pulp industry. Growth of the available
biomass will be largely driven by the increased cultivation of energy crops. The main sources
of feedstock for biogas production are landfill, sewage treatment, manure, energy crops and
waste (residential and industrial).
Both globally and on the EU level, biomass plays a prominent role in renewable energy plans.
In the EU, biomass is projected to account for around 60% of total renewable energy and 10%
of total energy demand in 2020. This corresponds to a demand for biomass of approximately
135 mtoe, an increase of 50 mtoe compared to 2010. The main end user sector is heating and
cooling (64%), followed by transport (22%) and electricity (14%).
Demand could in theory be met based on biomass availability projections by amongst others
AEBIOM and EEA that range between 170 and 235mtoe. However, supply-demand dynamics
can also hamper biomass supply. Changing regulatory frameworks can either stimulate or
limit supply. Incentive schemes are in most cases still required to make biomass energy
projects economically viable. Furthermore, policies on waste management, possible
introduction of sustainability criteria and land allocation for energy crops determine the actual
biomass availability. Other factors are demand in other markets, prices of feedstock,
infrastructure costs, demographic changes and consumer awareness.
There are a number of conversion technologies available to capture the potential of biomass
for production of renewable energy. First of all, thermal gasification is used for stand-alone
biomass or co-firing (coal and biomass) for power and heat generation. Secondly,
thermochemical gasification is applied to produce bio synthetic natural gas that can be further
upgraded to biomethane. Both technologies use woody biomass as feedstock and could
compete for resources in the future if the latter becomes a mainstream technology. Finally, the
chemical conversion processes of anaerobic digestion and fermentation/hydrolysis are applied
to produce biogas and bio liquids such as bio ethanol and biodiesel. For both processes,
energy crops such as maize and grass are used and increasing competition for resources can
be anticipated in case of large scale production on the longer term.
Today, biogas is being produced via anaerobic digestion. In 2010, primary production of
biogas was 10.9 Mtoe (~ 13 bcm). Germany is by far the leading country in Europe with 7.7
Mtoe, which corresponds with more than 7,000 plants. Second is the UK with a production of
1.8 Mtoe of which 85% is produced from landfill. Crop digestion is increasing, especially in
Germany. Projections of future biogas production also assume a significant increase of crop
and co-digestion (mainly manure and crops). AEBIOM estimates a production of 40 Mtoe by
2020. Consolidation of the EU Member states’ national renewable action plans shows targets
for the production of heat from biogas of 5.1 Mtoe and of electricity of 5.5 Mtoe in 2020.
Furthermore, 0.5 Mtoe of biogas is expected in the transport sector. The 11 Mtoe of biogas-
related energy output corresponds with 25-30 Mtoe of primary biogas production.
Theoretically, probably much more could be produced. The Institute for Energy and
Environment in Leipzig has even calculated potential of 166 Mtoe in 2020. Actual production
will likely be much lower and is dependent on the political and regulatory climate, economic

considerations and the development of end user markets. In the current context, regulation
plays a pivotal role. Further evolution of the EU Renewable Energy Directive and of related
legislation in the field of for example waste and land use that affect the availability of biomass
and grid injection standards, provide the framework for biogas development in Europe.
However, national policies in terms of subsidy schemes and agriculture policy will probably
be more decisive for actual biogas production towards 2020. The ambitions for the
contribution of biogas to renewable energy targets differ across Member States and are in
some countries non–existent.
Regulation also is a key driver for the economic viability of a biogas plant. Subsidies for the
production of electricity and heat and also the grid injection of biomethane are required to
realize a positive business case. Furthermore, the feedstock mix is a key consideration. The
cost of energy crops such as maize and wheat can account for up to 50% of the production
costs. Feedstock prices of energy crops depend on national and local supply-demand
dynamics, but a range of 20-50 €/t is often applied. On the other hand, feedstock such as
landfill and manure can have a negative cost and therefore can be viewed as a revenue stream
for a production facility. Other factors are plant size (economies of scale), type of technology
and the proximity to energy infrastructure. As front runner in Europe, Germany is also most
advanced in cost calculations for biogas plants. Production cost estimates range between 3.7-
6€ct/kWh. Cost savings can be realized through scale effects, use of own (waste) heat and
electricity, reduction of heat losses and improving plant efficiency. On the revenue side, sales
of power, heat and biomethane to grid and sales of digestate are main sources of income. The
development of energy commodity prices is also relevant in this respect.
Next to anaerobic digestion, biogas can be produced through the thermo chemical route
(biomass gasification). The bio SNG that is produced can also be upgraded and injected into
the grid. This technological route offers a much larger production potential and the resource
base (woody biomass) is global. Commercialization of this technology could significantly
increase the production of biomethane and bring government ambitions closer to reality.
Today, it is still in the R&D phase. There are a number of pilot plants in Europe, but the
outlook is uncertain as technological and economic hurdles have to be overcome.
The development of end user markets is also critical for meeting the biogas ambitions that
have been set by number of EU countries. The main downstream routes for biogas are heat
and power generation, grid injection and the vehicle fuel market. Fourthly, upgraded biogas
can also used as feedstock in the chemical industry as an alternative for natural gas, but no
significant developments are expected towards 2020. Today, the majority of biogas goes to
the power and heat sector due to favorable subsidies. Upgrading of biogas to biomethane is
also incentivized in, for example, Germany and the Netherlands and is expected to grow
significantly. Biomethane is relatively small today and the regulatory focus depends on the
structure of the national gas market and availability of infrastructure. Sweden for example has
a small gas market, but is very supportive for the use of biomethane for transport.
According to estimates of German biomethane production facilities, production costs range
between 6.5 and 8.6 €ct/kWh and correlate with plant size. Biogas production accounts for
around 75% of biomethane costs and upgrading, including grid injection, for 25%. The share
of grid injection is only 3%.
The use of biomethane as vehicle fuel is the third main route. CNG is already competitive
with gasoline and diesel due to high oil prices and development of this market can be a lever
for CBM growth. However, the share of CNG in the European vehicle fuel market is very
small and growth will have to be accommodated by investment in filling stations. On top of
this, the penetration of CBM or LBM will also depend on support schemes, at least as long as
natural gas prices are more competitive.
Biogas and the upgrade to biomethane is one route to decarbonizing natural gas consumption.
In a very optimistic scenario, its share will most likely not be more than 10-20% of gas
consumption in Europe’s key gas markets, at least up to 2030 and given no dramatic reduction
of gas demand in general. Such a scenario is supported by sufficient availability of energy
crops, introduction of large scale gasification (bio SNG) and national and cross border trade
schemes. In absolute terms, 10-20% is still quite significant: Germany 8-16 bcm/year, NL 4-8
bcm/year, UK 7-14 bcm/year. These are levels which represent a significant share of gas
consumption and would therefore affect the natural gas business. However, the penetration of
substantial biomethane volumes can also be a pillar for a long term role for natural gas in an
energy system that is carbon constrained.
Looking at the current pace of, especially, the development of biomethane, it is reasonable to
assume that ambitions for 2020 in EU countries (Germany 6bcm, the Netherlands 700mcm) in
which this renewable energy source plays an actual role, will not be met. The outlook for
biogas as fuel for renewable electricity and heat production is more optimistic, but most
likely, 2020 targets will also not be met. This an issue that is applicable to the whole
renewable energy sector in Europe.

Bibliography
Arthur D. Little, ‘Biogas as a feedstock for Chemical Manufacture‘, 2010
Austermann, S., Archer, E., Whiting, K.J., ‘Anaerobic Digestion Technology for Biomass
Projects’, June 2007.
Baldock, D., Institute for European Environmental Policy, ‘Reorienting agricultural domestic
support around environmental goals: the experience of the European Union’, 3 August 2012.
Balussou, D., Kleyböcker, A., McKenna, R., Möst, D., Fichtner, W. (2012): ‘An economic
analysis of three operational co‐digestion biogas plants in Germany. ‐ Waste and Biomass
Valorization, 3, 1, 23‐ 41’ GFZ, Helmholtz -Zentrum Potzdam, 2012.
Baxter, D., JRC European Commission, JRC, IEA Bioenery Task 37, September 2011.
Bentsen, N.S., Felby, C., Biomed Central, ‘Biomass for energy in the European Union - a
review of resource assessments’ 9 November 2009.
Bergsma, G.C., Kampman, B.E., Croezen, H.J., ‘Good use of biomass’, CE Delft, April 2010.
Biomass Energy Centre. www.biomassenergycentre.org.uk/portal
Bloomberg.com, ‘Germany May Grow More Biofuel Crops for Energy Output, Passauer
Reports’, 26 April 2011
Bundesnetzagentur, ‘Biogas Monitoringsbericht 2011 and 2012, May 2011, 2012
Central Bureau for Statistics, ‘Renewable Energy in the Netherlands 2011’
Centre for Renewable Energy Sources, ‘Biomass availability in Europe’, December 2003.
DECC, ‘analysis of characteristics and growth assumptions regarding ad biogas combustion
for heat, electricity and transport and biomethane production and injection to the grid’
Deutsches BiomasseForschungsZentrum gemeinnützige (DBFZ), ‘Focus on Biomethane,
Biomass for Energy‘ 2012.
Dzene, I., Bodescu, F., ‘Evaluation of biomass availability for biogas production at Regional
level', Centre for Renewable Energy Sources, 2003.
ECN, European environmental agency, renewable energy projections as published in the
national renewable energy action plans of the European Member States, November 2011.
ECN, KEMA, , ‘Base rates in the SDE+ scheme 2012’, September 2011.
Eurelectric, 'Biomass 2020: Opportunities, Challenges and Solutions', October 2011.
EurObserv’ER, ‘The state of renewable energies in Europe – 2011 edition’, December 2011.

European Biofuels Technology Platform, ‘ Bio-SNG (Synthetic Natural Gas) and Gasification
Technologies’, http://www.biofuelstp.eu/bio-sng.html.
European Biogas Association, National Renewable Energy Action Plans: EBA’s evaluation of
the Biogas contribution, 2011.
European Biomass Association, ‘A Biogas Roadmap for Europe’, October 2009
European Biomass Association, ‘2011 Annual Statistical Report on the contribution of
Biomass to the Energy System in the EU 27’, June 2011.
European Commission, ‘on sustainability requirements for the use of solid and gaseous
biomass sources in electricity, heating and cooling, February 2010
European Commission, DG Energy, ‘Biomass for Energy: EU policy overview and state of
play’, March 2011
European Environment Agency, ‘How much bioenergy can Europe produce without harming
the environment?’, 2006.
European Technology Platform, Renewable Heating and Cooling, ‘Common Vision for the
Renewable Heating & Cooling sector in Europe – 2020, 2030, 2050’, 2011
Fachagentur Nachwachsende Rohstoffe e.V. (FNR), ‚Biogas - an introduction, January 2009.
Eurostat, Energy, Main tables.
Federal Ministry for the Environment, Nature Conservation and Nuclear safety.
http://www.res-legal.de/en/search-for-countries
Van Foreest, F., Oxford Institute for Energy Studies, ‘Does natural gas need a decarbonisation
strategy?’ May 2011
Germany Energy Agency (DENA), ‘Technologies and Costs of Conditioning Biogas and
Feeding into the Natural Gas Network’ September 2010.
Germany Energy Blog, ‘Biogas Still Far Away from 2020 Target – Potential to Balance
Fluctuating Renewable Energy’, June 12, 2012.
Hall D.O. & Rosillo-Calle F., 'Biomass - other than wood'. World Energy Council 1998,
Survey of Energy Resources, 18th Edition, London.
Hub for Rural Development in West and Central Africa, ‘Sustainable Bioenergy Development
in UEMOA Member Countries’ October 2008.
Huguen, P., Le Saux, G., ‘Perspectives for a European standard on biomethane: a Biogasmax
proposal’ December 2010.
IEA Bioenergy, Annual Report 2009

IEA Bioenergy Task 37, frequently asked questions. http://www.sgc.se/biogasfaq
IEA, World Energy outlook 2011
IHS CERA, ‘Long Term Demand Outlook Europe, June 2011
Institute for Energy and Environment, ‘Possibilities of an European Biogas strategy, Jan. 2007
Intelligent Energy Europe, ‘Overview of biomethane markets and regulations in partner
countries’, March 2012
Krassowski, J., Fraunhofer-Institut UMSICHT, ‘Biogaseinspeisung in Erdgasnetze -Markt
und Wirtschaftlichkeit‘, October 2011.
Ladanai, S., Vinterbäck, J., ‘Global Potential of Sustainable Biomass for Energy’, Swedish
University of Agricultural Sciences, 2009, p. I
Linke, B., Leibniz-Institute for Agricultural Engineering, IEA Bioenergy Task 37, Country
Report, Germany, September 2011
Lukehurst, C.T., Frost, P., Al Seasi, T., IEA Bioenergy, ‘Utilisation of digestate from biogas
plants as biofertiliser’ Juen 2010.
Murphy, J., Braun, R., Weiland, P., Wellinger, A., IEA Bioenergy, ‘Biogas from Crop
Digestion’ September 2011.
Murphy, J.D., Environmental Research Institute, University College Cork, ‘Task 37 Energy
from Biogas’, April 2011.
Murphy, J.D., Biofuels Research Group, ERI (University of Cork), ‘Cost of Biomethane’, 15
April 2010.
http://www.nationalgrid.com/uk/Gas/SustainableGasGroup
National Renewable Action Plan for the Netherlands, June 2010.
NGVA Europe, ‘European NGVs and stations December 2011’, ‘European Pricing
Comparisons 2011’, http://www.ngvaeurope.eu/european-ngv-statistics.
Petersson, A., Svenskt Gastekniskt Center AB, Country Report Sweden, 2010.
Petersson, A., Wellinger, A., IEA Bioenergy, ‘Biogas upgrading technologies developments
and innovations’, October 2009.
Stanford University, Global Climate & Energy Project, ‘An Assessment of Biomass
Feedstock and Conversion Research Opportunities, 2005.
Stoddart, H., NNFCC, ‘Anaerobic Digestion: Economics’, 2010.
Strauch, S., Fraunhofer UMSICHT, ‘Biogas Upgrading Technologies‘, June 2012.

Strauch, S., Krassowski, J., Fraunhofer Umsicht, ‘Overview of Biomethane market and
regulations in partner countries’, Written within the project GreenGasGrids, March 2012
Swedish University of Agricultural Sciences, Global Potential of Sustainable Biomass for
Energy, 2009.
The Official Information Portal on Anaerobic Digestion. http://www.biogas-
info.co.uk/index.php/biogas-yields-agri.html.
Van der Meijden, C.M., Rabou, L.P.L.M., Van der Drift, A., Vreugdenhil, B.J., Smit, R.,
ECN, ´Large scale production of bio methane from wood´, October 2011.
Warner Kossmann et al., Information and Advisory Service on Appropriate Technology,
Biogas Digest, Volume II, ‘Biogas - Application and Product Development’, February 2012.
De Wit, M.P., Faaij, A.P.C., Refuel work package 3, ‘Biomass resources, potential and related
costs’ Copernicus Institute-University of Utrecht, January 2008.
Wellinger et al., Green Gas Grids, ‘Discussion Paper on Biomethane Focus Issues:
Sustainability, Technical Standards, Trade and Country Targets’ 31 January 2012

APPENDIX
Figure 21: % of a region that is available for dedicated bioenergy production
Source: University of Utrecht (2008)
Figure 22: Gas content
Source: Biogas Renewable Energy (http://www.biogas-renewable-energy.info)
0%-6.5%
6.5%-12%
12%-17%
17%-31%
>31%
Component Landfill gas Biogas Natural gas
Methane (vol%) 35-65 60-70 89
Other hydrocarbons
(vol%)0 0 9.4
Hydrogen (vol%) 0-3 0 0
Nitrogen (vol%) 5-40 0.2 0.28
Oxygen (vol%) 0-5 0 0
Hydrogen sulphide
(ppm)0-100 0-4000 2.9
Ammonia (ppm) 5 100 0

Figure 23: Yield of biogas feedstock
Source: Rakičan, 2007
0 100 200 300 400 500 600 700 800 900
Pig manure
Cattle manure
Pultry manure
Fruit and vegetables
Dairy
Sewage
Vegetable oil
Fatty waste
Used fats
Mangel
Grasses
Maize
Crops
Waste
Manure
Biogas yield, m³/t