PERSPECTIVE ON WARM CLIMATE INTERVALS AND THEIR …
24
PERSPECTIVE ON WARM CLIMATE INTERVALS AND THEIR HISTORY: HOW MIGHT COASTAL CANADA ADAPT TO AN OCEAN-RELATED AND POTENTIALLY NEGATIVE IMPACT OF PREDICTED WARMER CONDITIONS? CHARLES T. SCHAFER Bedford Institute of Oceanography Dartmouth, Nova Scotia B2Y 4A2 ABSTRACT Past warm intervals lasting from decades to centuries can be observed throughout the late Holocene geologic record using various proxy physical, chemical and fossil indices, in conjunction with seasonal information such as the timing of the first flowers of the spring season, or by the dates of first freezing and thaws of fresh water bodies, that have been recorded in various journals. Three important warm intervals that have been identified over the past 3500 years include the Late Bronze Age Optimum (BAO) (~1350 to ~1200 BC), the Iron/Roman Age Optimum (I/RAO)(~250 BC to ~400 AD) and the Medieval Warm Period (MWP)(~950 to ~1250 AD). The early phase of the BAO featured maximum development of the Hittite Empire and the evolution of the palace economy. The timing and duration of the later I/RAO show considerable variation from place to place in the Northern Hemisphere. MWP proxy records from several regions indicate that, like the I/RAO pattern, peak warmth occurred at different times in different places included in the Period’s overall footprint. Paleo-temperatures, both slightly cooler and warmer than present, have been reported. The WMP occurred during the Middle Ages at a time of the expansion of major commercial routes along the Mediterranean Sea coast and during an interval when Vikings explored and settled in some areas of the North Atlantic region. Sea level rise is among the suite of important ocean-related negative impacts that are often associated with contemporary global warming scenarios. Both early and modern societies have developed effective adaptation strategies and mitigation techniques to resist rising sea levels and flooding. Many of these have utility for Canada in both inland and especially in coastal areas of the Maritime Provinces. Early sea level rise and tidal flow mitigation measures include the construction of dykes around low-lying areas, sand dune stabilization and shoreline armoring using large Proceedings of the Nova Scotian Institute of Science (2018) Volume 49, Part 2, pp. 205-228 * Author to whom correspondence should be addressed: [email protected]
Transcript of PERSPECTIVE ON WARM CLIMATE INTERVALS AND THEIR …

PERSPECTIVE ON WARM CLIMATE INTERVALS AND THEIR HISTORY:
HOW MIGHT COASTAL CANADA ADAPT TO AN OCEAN-RELATED AND POTENTIALLY
NEGATIVE IMPACT OF PREDICTED WARMER CONDITIONS?
CHARLES T. SCHAFERBedford Institute of OceanographyDartmouth, Nova Scotia B2Y 4A2
ABSTRACT
Past warm intervals lasting from decades to centuries can be observed throughout the late Holocene geologic record using various proxy physical, chemical and fossil indices, in conjunction with seasonal information such as the timing of the first flowers of the spring season, or by the dates of first freezing and thaws of fresh water bodies, that have been recorded in various journals. Three important warm intervals that have been identified over the past 3500 years include the Late Bronze Age Optimum (BAO)(~1350 to ~1200 BC), the Iron/Roman Age Optimum (I/RAO)(~250 BC to ~400 AD) and the Medieval Warm Period (MWP)(~950 to ~1250 AD). The early phase of the BAO featured maximum development of the Hittite Empire and the evolution of the palace economy. The timing and duration of the later I/RAO show considerable variation from place to place in the Northern Hemisphere. MWP proxy records from several regions indicate that, like the I/RAO pattern, peak warmth occurred at different times in different places included in the Period’s overall footprint. Paleo-temperatures, both slightly cooler and warmer than present, have been reported. The WMP occurred during the Middle Ages at a time of the expansion of major commercial routes along the Mediterranean Sea coast and during an interval when Vikings explored and settled in some areas of the North Atlantic region.
Sea level rise is among the suite of important ocean-related negative impacts that are often associated with contemporary global warming scenarios. Both early and modern societies have developed effective adaptation strategies and mitigation techniques to resist rising sea levels and flooding. Many of these have utility for Canada in both inland and especially in coastal areas of the Maritime Provinces. Early sea level rise and tidal flow mitigation measures include the construction of dykes around low-lying areas, sand dune stabilization and shoreline armoring using large
Proceedings of the Nova Scotian Institute of Science (2018)Volume 49, Part 2, pp. 205-228
* Author to whom correspondence should be addressed: [email protected]

SCHAFER206
boulders in concert with breakwaters and groynes. Today, there is also opportunity for the application of beach nourishment and artificial dune construction to resist erosion by storm waves and alongshore currents but these typically require annual maintenance to remain effective. Last resort mechanisms range from stilt home construction to abandonment (managed retreat) of previously impacted coastal areas. It is very likely that, when needed, Canadians will be able to apply a broad range of modern and ancient effective technologies and to engage engineering expertise to develop new (e.g., hybrid) approaches for combating specific negative coastal impacts than were available to BAO, I/RAO and MWP societies.
INTRODUCTION
Natural climate variation is an ever present condition that must be addressed by all societies, some more effectively than others. A book published in 1981 by Cambridge University Press entitled Climate and History focused the attention of the scientific community of that time on the evidence for linkages between past climates and their impact on man (e.g., Rosa and Dietz, 1998). It comprises 21 papers that were delivered at a Conference on Climate and History held in England at the University of East Anglia in 1979. In their introductory chapter, the book’s editors (T.M. Wigley, M.J. Ingram and G. Farmer) emphasized the need for a precautionary approach in researching climate/history relationships that considers deficien-cies in proxy and documentary records, and in scientific data aimed specifically at extending the climate record back in time, which they concluded is often inadequate for demonstrating past climate-history interactions. They go on to point out that a review of then available (1979) well-dated proxy data showed “considerable” differences in the timing of both warmer and cooler intervals from place-to-place and that the effects of climate change documented by earth scientists and archaeologists typically demonstrated pronounced regional varia-tion (Rahman et al., 2015). It is in the context of those constraints that the following sections of this article attempt to portray a general picture of key historical events during three well-defined relatively warm climate intervals that have occurred over about the past 3500 years and then proceed to describe how some European and North American societies have been adapting to warmer conditions and to important negative impacts such as rising sea level over the past several hundred years.

207PERSPECTIVE ON WARM CLIMATE INTERVALS AND THEIR HISTORY
ANCIENT CLIMATES RESEARCH METHOD
Earth scientists working with various kinds of proxy indicators that are preserved in geologic, isotopic and paleobiologic archives have been able to describe the temperature and timing characteristics of ancient warm and cool climate intervals (e.g., Kobashi et al., 2011). Some of the more commonly used archives include tree rings, ice cores, sediment cores from lakes and oceans, cave deposits (speleo-thems), and fossil remains. Collectively, proxy indices extracted from these source materials, such as the oxygen 18 graphs shown in Fig 1, complement and/or extend climate information derived from histori-cal documentary data (e.g., Ogilvie, 1992). Past climate conditions and their regional variation have been inferred from studies of proxy indicators such as the isotopes of carbon and oxygen, pollen grains and from fossil remains of tiny phytoplanktic species such as diatoms and dinoflagellates preserved in unbioturbated lake sediments (e.g., Briffa et al., 1992). Marine sediment archives offer additional proxy indicators of fundamental ocean water parameters such as sea surface and bottom water temperatures that control the distribution, species diversity and abundance of small fossil-forming organisms (e.g., planktic and benthic Foraminifera). Some of the earliest documentary records of changing climate conditions in Canada have often been expressed through seasonally-controlled biological phenomena such as trends of the dates of the first appearance of cherry blossoms in the spring, or by physical events such as long-term variations in the dates of river and lake freeze-ups and thaws. A substantial amount of these kinds of phenological data covering the 19th and early 20th centuries have been documented in Hudson Bay Company journals (e.g., Ball, 1992).
SOME RECOGNIZED OLDER WARM CLIMATE INTERVALS
The Late Bronze Age Optimum (BAO), Iron/Roman Age Optimum (I/RAO) and the Medieval Warm Period (MWP) comprise three prominent century-scale warm intervals that have been described in the scientific literature using both proxy indices and historical written accounts. Dates, durations and geographical expression of these events vary somewhat from place to place but the footprint of all three indicates that they were very likely at least of inter-regional

SCHAFER208
geographical extent i.e., similar to what is currently being witnessed for the post 1960’s Northern Hemisphere warming trend, although long-term predictions of the duration and maximum intensity of present-day warm conditions remain essentially speculative.
The Late Bronze Age OptimumThe Late Bronze Age Optimum (BAO) warm interval lasted for
about 200 years and was relatively well developed between 1350 BC and 1200 BC (e.g., Dickinson, 1994). It was followed by the Hekla event at about 1159 BC, a relatively cool interval that is said to have severely impacted agriculture production in parts of Europe for about 20 years. During the main phase of the BAO, the extent of the foot of the Great Aletsch Glacier (located in the European Alps) was reported to be approximately 1000 m shorter than it is today. However, despite current relatively warm conditions, there has still not been enough melting to move the leading edge of the foot of the Aletsch Glacier back to the position that it occupied during the BAO (Prats-Iraola et al., 2009). In general, European glaciers show nearly synchronous
Fig 1 Oxygen 18 isotope graphs of data collected from several Greenland ice core samples (Modified from T. Kobashi et al., 2011). The graphs show the timing, duration and relative magnitude of the three warm intervals (upper graph) discussed in this article. During relatively warm intervals, Oxygen 18 is found in greater concentrations compared to the lighter Oxygen 16 molecule because the latter evaporates more easily than its heavier coun-terpart.

209PERSPECTIVE ON WARM CLIMATE INTERVALS AND THEIR HISTORY
advances that coincide with carbon 14 (C14) peaks measured in various physical (e.g., ice), geologic and paleobiologic archives. C14 peaks are indicative of weaker solar activity that is typically as-sociated with cooler temperatures and a reduced rate of melting of glaciers (Bray, 1967; Hufbauer, K., 1991). When sun activity is weak, it causes a weakening of the heliosphere (i.e., the region of space through which the solar wind extends) that reduces its shielding effect with respect to cosmic rays. Penetration of the Earth’s upper atmosphere by larger numbers of cosmic rays produces greater amounts of C14 that is eventually sequestered in various natural archives. Consequently, relatively high C14 values are typically interpreted as reflecting relatively cooler climate conditions while relatively low values of C14 point to relatively warmer times.
The very early part of the BAO is marked by the maximum develop-ment of the Hittite Empire around 1350 BC (Dickinson, 1994; Genz and Mielke, 2011). It is also the time during which Tutankhamun reigned over Egypt (1332-1323 BC). He is said to have been affected by the most severe strain of malaria on several occasions during his life, a condition typically associated with warm environments. The main part of the BAO witnessed the development of the palace economy (or redistribution economy) in which a substantial share of the wealth falls under the control of a central administration (the palace) and from there outward to the general population (Halstead, 1994). During the second millennium BC, Mycenae was one of the major centers of Greek civilization. It reached its peak during the BAO and, at that time, the Acropolis was surrounded by massive cyclopean walls (massive limestone boulders fitted together with minimum clearance) that were built in stages around 1350, 1250 and 1225 BC. Bronze Age civilizations flourished before the Urnfielders arrived around 1250 BC (Pearce, 1998). They are believed to have moved south as the result of a pronounced climate deterioration that heralded the end of the BAO. This time is often referred to as the Late Bronze Age Collapse or Crisis. It coincides generally with the onset of a 300 years long drought that began in about 1200 BC. This was also a time of transition in the Aegean Region, SW Asia and in the eastern Mediterranean. The drought caused widespread famines and, eventually, the political and economic collapse of eastern Mediter-ranean civilizations that many historians believe was sudden, violent and culturally disruptive (www.scienceheathen.com).

SCHAFER210
The Iron/Roman Age OptimumThe Iron/Roman Age Optimum (I/RAO) (aka the Roman Warm
Period) occurred generally between 250 BC and 400 AD although its timing and duration show considerable variation from place to place (McDermott et al., 2001). For example, oxygen isotope data observed in mollusk shells retrieved from a sediment core raised from an Icelandic inlet indicate relatively warm conditions between 230 BC and 40 AD (Patterson et al., 2010). Although the peak of the I/RAO is generally considered to fall between 90 BC and 50 AD, some deep ocean sediment core data suggest an I/RAO peak at about 150 AD (Bianchi and McCave, 1999; Esper et al., 2012). During the I/RAO, the foot of the Great Aletsch Glacier is said to have retreated to its present extent or was perhaps even somewhat shorter. Tree ring data from Italy covering the late 3rd century BC interval describe a period of mild conditions at the time that Hanni-bal crossed the Alps with elephants (Oliver, 2005; Kullman, 2013). Sea surface temperature (SST) proxy reconstructions for the Gulf of Taranto at a location near the distal end of the Po River discharge plume reflect warm and stable temperatures between 60 BC and 90 AD followed by a gradual decrease between 90 and 200 AD indi-cating that the Roman Classical Period spanned both warmer and somewhat cooler climates. For areas near the ocean, warmer climates are often associated with greater ocean water evaporation that pro-duces higher amounts of precipitation over land areas (e.g., Greece during the I/RAO; Scheidel et al., 2012). The relatively warm and stable conditions that existed between the first and second centuries AD correspond to the time of the Pax Romana i.e., to a long period of relative peace and minimal expansion by military force in the Roman Empire. Evidence continues to accumulate suggesting that, for the most part, relatively warm historical times have been more peaceful times (www.britannica.com).
During the I/RAO, there is proxy evidence of a strong 11-year cycle (Tinner et al., 2003). A pronounced visual correlation of proxy SST data and river discharge records in relation to the variation in D 18O
anomalies leads to the contention that solar activity variation might have been an important climate-forcing factor during this time ( Pat-terson et al., 2010; Lamb, 1977). Some key historical events during the I/RAO are listed in Table 1.

211PERSPECTIVE ON WARM CLIMATE INTERVALS AND THEIR HISTORY
The Medieval Warm PeriodThe warm interval that preceded the present day (late 19th century
to 21st century) warming is known as the Medieval Warm Period (MWP). It is evident in proxy data between 800 and 1300 AD and was apparently fully developed between 950 and 1250 AD (Wigley et al., 1981). Proxy records from several regions show peak warmth of the MWP occurring at different times. Global temperature records extracted from ice core, tree ring and lake sediment archives indicate that the Earth may have been about 0.030 C cooler during the MWP than has been reported for the later decades of the 20th century (Hiller et al., 2001). In contrast, proxy SST data for the Sargasso Sea area show values from almost 1000 years ago that are about 10 C warmer than today (Keigwin, 1996).
The MWP occurred during the European Middle Ages at a time that witnessed the establishment of major commercial routes along the coast of the Mediterranean Sea and the flourishing of Feudalism between the 9th and 15th centuries. Norse colonization of the Ameri-cas started as early as the 10th century when Vikings explored and settled North Atlantic areas including SE Greenland and the fringes of North America (Pallson, 1965). Some other noteworthy historical events during the MWP are listed in Table 2.
Table 1 Some Key Events During the Iron/Roman Age Optimum.
• 200-100 BC: Construction of the Roman Aqueduct system.• 91-88 BC and 49-45 BC: The Civil wars.• 63 BC: Romans take control of Judea.• 54 BC: Julius Caesar stabbed to death by the Republicans.• 45 BC: Rome bans all vehicles from within the city because of traffic jams.• 45 BC: The Julian calendar is introduced.• 44 BC-14 AD: Establishment of the Roman Empire; Rome is largest city in the world
with between 450,000 and 2 million residents. • 42 BC: Construction of second (stone) temple of Saturn.• 41 BC: Emperor Caligula assassinated.• 31 BC-14 AD: Construction of many triumphal arches to commemorate victorious• Campaigns.• 27 BC: First treatise on architecture (“De Architectura”) is completed.• 20 BC: King Herod begins construction of the great temple in Jerusalem.• 19 BC: Roman poet Virgil completes the Aeneid.• 6 AD: Judea becomes a Roman province.• 30 AD: Crucifixion of Jesus.• 34-60 AD: Missionary Journeys of Paul the Apostle.• 43 AD: First London Bridge (a temporary pontoon bridge) is built by the Romans.• 53 AD: Parthians annihilate an army of 40,000 Romans.

SCHAFER212
Table 2 Noteworthy Historical Events During the MWP.
• 10th century: Magyars ceased their expansion.• 1000 AD: Kingdom of Hungary recognized in central Europe.• 11th century: Populations north of the Alps began to settle new lands – some of
which had reverted to wilderness following the end of the Roman Empire. There was a rapid increase in the populations of Europe reaching levels not seen again in the same areas until the 19th century.
• 1096 AD: “Progroms” featured the destruction of Jewish communities in Speyer, Worms and Mainz – said to have been triggered by an epidemic of the plague.
• 1096-1099 AD: First Crusade begins and, coincidentally, it was also the first major step towards the reopening of international trade in western Europe since the fall of the Western Roman Empire.
• 1099 AD: Recapture of Jerusalem.• 13 century: Major nomadic incursions into Europe ceased – except for the Mongol
invasions.• 1215 AD: Magna Carta proclaimed.• 1001-1300 AD: Papacy reaches the height of its power.
Warming Impact Mitigation MeasuresIn a paper published in the proceedings of a 1990 international
symposium on Climate Change – Implications for Water and Eco-logical Resources, Geoffrey Wall (Dept. of Geography, University of Waterloo) attempted to summarize potential climate impacts for some key economic sectors of Canada (Wall, 1990). His findings recognize important sea level negative impacts with respect to de-veloped coastal areas (Table 3).
Not surprisingly, there are already a respectable number of tried and proven adaptation techniques that address the impacts of warmer climate that Wall identified. Many of them are “win-win” or “no regrets” programs initiated by various levels of government over the past three decades (e.g., the federal government’s R2000 insulation retrofit program for older homes and commercial buildings). Others reflect the direct action of individuals. In some large urban settings of the United States that feature summer climates that are gener-ally comparable to cities such as Toronto and Montreal, residents are using existing technologies such as insulation and reflective window panes along with air conditioning to mitigate the impact of anomalously high summer temperatures. In a paper published by Petkova et al. (2014), the authors show that there was a greater risk of heat-related mortality for New York City residents 65 years and older in the first five decades of the 20th century compared to the 1973 – 2006 period that they argue as being primarily due to “the rapid spread and widespread availability of air conditioning.”

213PERSPECTIVE ON WARM CLIMATE INTERVALS AND THEIR HISTORY
In the remainder of this paper, I offer some specific comments about negative impacts of predicted global warming in Canada’s coastal environments with respect to sea level and storm surges and how some Maritime Provinces, individuals and foreign nations have adapted to them. However, before launching into that part of the story, it is helpful to understand the history of some of the research that has set the framework for managing and protecting coastal environments in the Maritime Provinces that may be particularly sensitive to rising sea level and storm surge impacts. That part of my Maritimes marine geology education begins with an October, 1971 Conference on Envi-ronmental Change in the Maritimes hosted by Dalhousie University and sponsored by the National Research Council. The proceedings of the meeting were published in 1975 by the Nova Scotian Institute of Science. That conference produced one report by D. Grant (1975) that is particularly relevant to this article. He begins by reminding us that it has been known for more than a century that coastal areas of the Maritimes have been submerging as a consequence of post-glacial crustal adjustments which vary regionally and that this sub-mergence process is still continuing today (1971) at an average rate of about 30 centimetres per century. For Halifax, he estimated total
Table 3 Canadian Economic Sectors: Potential negative effects from higher temperatures (Modified from Wall, 1990).
Economic Sector Possible Climate Warming Effects
Potential Negative Impacts
Great Lakes Basin Lower lake levels Increased dredging (ports and shipping channels).
Marine coasts Rising sea level Increased height and pen-etration of storm surges.Coastal flooding (roads, residential and commercial waterfront developments and industrial facilities).
The Prairies Higher temperatures and drier conditions.
Less favorable conditions for barley and oats pro-duction.
Increased energy require-ments for air conditioning.
Northward displacement of fauna and flora includ-ing some disease-bearing species.

SCHAFER214
subsidence at about 20 centimetres between about 1910 and 1960 while the average trend of the world-wide rise in sea level between 1925 and 1965 (based on tidal records) added about 4.3 centimetres per century. He goes on to mention that measurements of the eleva-tion of mooring rings mounted on a seawall built in the early 18th century at Fortress Lewisburg in Cape Breton indicate an average rise in relative sea level (i.e., crustal subsidence plus world-wide sea level rise) of about 32 centimetres per century along that part of the Nova Scotia coast. Jumping ahead two decades to November 19, 1991 finds me at a one day symposium held at the Bedford Institute of Oceanog-raphy (BIO). The Climate of Nova Scotia meeting was sponsored by the Nova Scotia Climate Advisory Committee and featured a paper by a team of BIO coastal geologists entitled Impact of Accelerated Sea-level rise on the East Coast of Nova Scotia (Shaw et al., 1992). The opening line of the paper’s abstract states that The current high rates of relative sea-level rise in Nova Scotia may increase further if ocean volume increases as a result of global warming and then goes on to present a comprehensive summary of Nova Scotia coastal settings that are particularly at risk from the intensified wave action of storms and the estimated long-term rise of relative sea level of about 20 centimetres per century. Their review of comparatively recent tide data (1896 – 1988) for Halifax indicated that sea level had risen by about 32 centimetres per century for the 1920-1988 interval but that the rate of relative sea level rise had slackened during the 1980’s. August 19, 2001 witnessed my return to Dalhousie University for the 1st International Conference on Global Warming and the Next Ice Age. From a global perspective, this was an especially unique meeting because the organizers seem to have made a deliberate effort to bring together members of both the pro and anti-global warming scientific communities to debate the issue of man-made versus natural warm-ing. Curiously, of the 89 presentations (talks and posters) recorded in the proceedings, none of them have the words sea level in their title. A new science research band wagon, with both political and economic underpinnings, was under way to stoke up the enthusiasm and energy of both global warming proponents and skeptics (e.g., Medioli and Schafer, 2011) that, indirectly, raised new questions about sea level trends in a cooling world.
Despite all of the dire predictions, there is ample evidence of suc-cessful adaptations to rising sea levels and coastal flooding from storms in Canada and throughout the world that have often been
215PERSPECTIVE ON WARM CLIMATE INTERVALS AND THEIR HISTORY
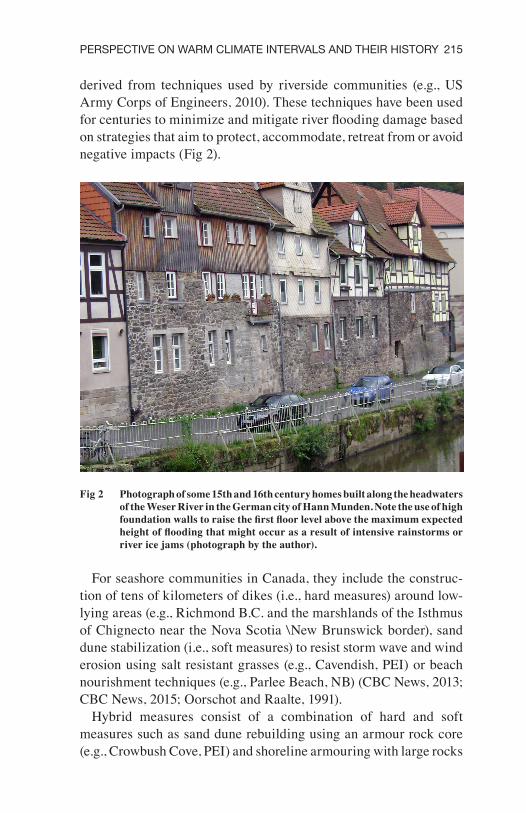
derived from techniques used by riverside communities (e.g., US Army Corps of Engineers, 2010). These techniques have been used for centuries to minimize and mitigate river flooding damage based on strategies that aim to protect, accommodate, retreat from or avoid negative impacts (Fig 2).
Fig 2 Photograph of some 15th and 16th century homes built along the headwaters of the Weser River in the German city of Hann Munden. Note the use of high foundation walls to raise the first floor level above the maximum expected height of flooding that might occur as a result of intensive rainstorms or river ice jams (photograph by the author).
For seashore communities in Canada, they include the construc-tion of tens of kilometers of dikes (i.e., hard measures) around low-lying areas (e.g., Richmond B.C. and the marshlands of the Isthmus of Chignecto near the Nova Scotia \New Brunswick border), sand dune stabilization (i.e., soft measures) to resist storm wave and wind erosion using salt resistant grasses (e.g., Cavendish, PEI) or beach nourishment techniques (e.g., Parlee Beach, NB) (CBC News, 2013; CBC News, 2015; Oorschot and Raalte, 1991).
Hybrid measures consist of a combination of hard and soft measures such as sand dune rebuilding using an armour rock core (e.g., Crowbush Cove, PEI) and shoreline armouring with large rocks

SCHAFER216
to resist the undercutting of sea walls and soft sediment slopes to protect, for example, seaside boardwalks in Charlottetown and Sum-merside, PEI and coastal roads at various locations in the Maritime provinces (www.gov.pei.ca; CSRPA, 2011). Shoreline erosion issues have also been addressed in other parts of the world using seawalls or structures installed a short distance offshore parallel to the coast or perpendicular to the shore such as breakwaters and groynes to trap sediment and dampen wave erosion effects. However, these types of hard structures, although very effective locally, can cause erosion in adjacent areas (Fig 3).
Fig 3 Section of an armoured seawall at the foot of a steep hillside that faces the Mediterranean Sea in the lower city area of Monaco. The rock armour apron is intended to prevent the seawall’s foundation from being undermined by wave erosion during intense storms (Photograph by author).
At some low-lying seashore areas of the U.S., there are examples of other adaptation techniques that could perhaps be applied more widely in coastal parts of the Maritime Provinces if necessary. They include beach nourishment projects using outer continental shelf sands to increase the resiliency of the coast to wave erosion (e.g., the work of the U.S. Bureau of Ocean Energy Management in partnership with local organizations such as the Central Atlantic Sand Management Working Group; Coburn, 2012); building artificial

217PERSPECTIVE ON WARM CLIMATE INTERVALS AND THEIR HISTORY
dunes on the landward side of eroded shorelines (e.g., Cape Canav-eral Florida; Williams, 2007); managed retreat (i.e., abandonment) programs aimed at demolishing damaged residential housing in flood prone areas and converting the cleared areas to parkland (e.g., Oakwood Beach, New York, Rush, 2015); construction of stilt (raised foundation) homes and commercial buildings (Fig 4 and 5) in high risk flood zones (e.g., low lying coastal cities in the Maritimes and southeastern U.S. states); and complex flood control systems of dikes, locks and spillways (e.g., New Orleans, Louisiana; Marshall, 2014).
Fig 4 Stilt homes featuring ground level storage and 2nd floor living areas are becoming more common in coastal and flood prone areas of many southern states (e.g., Florida) (Photograph by author).
DISCUSSION
In an attempt to place the current warming interval in perspec-tive, some scientists argue that, although the rate of warming from the 19th to the 20th century is clearly the greatest between any two consecutive centuries during the last 1200 years, this should come as no surprise since conditions during the preceding 500 years-long Little Ice Age are recognized as having been the coldest multi-century interval since the retreat of the Wisconsinan glaciers about 14,000 years ago (Wantanabe et al. 2014). Studies of climate oscillations have identified cycles having periods of 9.1, 10-10.5, 20-21, and

SCHAFER218
60-62 years that may explain a large part of the climate variation observed between 1850 and the present day. Other investigations of 80 and 160-year oscillations indicate that they appear to account for a significant portion of the warming trend observed in instrumental records between the 1850s and 1970s (Scafetta, 2012). When proxy and documentary records of past warm intervals are considered together, ever-increasing numbers of scientists have come to believe that there is nothing unusual, unnatural or unprecedented about the Earth’s current level of warmth (C02 Science, 2017). This view seems to be generally consistent with the apparent business as usual social, demographic and political dynamics of the three older warm intervals described earlier. Conclusions from some of the latest scientific studies continue to auger increasingly for a solar-induced millennial-scale cycling of the Earth’s global climate that is totally independent of anthropogenic CO2 emissions (Lenton, 2000).
Diverse scientific results regarding the forces that drive climate change (both internal and extra-terrestrial) appear to explain why the issue of the major causes of global warming at decadal and century time-scales remains so controversial. Nevertheless, the controversy does not in any way lessen the need to explore new adaptive technolo-gies and government policies that will facilitate economic stability and the safety of all the planet’s inhabitants regardless of whether
Fig 5 Architectural concept drawing of the south building of the Queens Marque development that is presently under construction on the Halifax Harbour waterfront. Note the stilt design of the ground floor (source: https://my-waterfront.ca/development/queens-marque).

219PERSPECTIVE ON WARM CLIMATE INTERVALS AND THEIR HISTORY
future climate trends produce long periods of unusual warming or cooling with characteristics comparable or more intense than those observed in proxy and historical documentary records. In their introductory chapter, the editors of the 1981 Climate and History book offer a realistic perspective on climate adaptation (Wigley et al., 1981). On page 36 they note that:
“Man is a highly adaptive animal, capable of deploying a wide range of technologies and social strategies to cope with a vari-ety of environmental conditions. In view of this fact, and given the comparatively small range of climatic variations in historic times, it maybe assumed that past human societies have to a considerable extent had the potential to adapt successfully to changes in climate. In the future, the scope of such potential may be increased by the development of sophisticated climate modification technologies.”
In general, adaptation has operated along two pathways; proactive actions that are undertaken at a time scale of decades to centuries and crisis-management initiatives developed at a time scale of weeks to years. The two approaches reflect economic and safety considerations by both individuals and various levels of government. An example of the former is the extensive construction of dikes for land recla-mation to expand farmland capacity over the past several hundred years in the Netherlands, some of the Maritime Provinces and along some coastal areas of China (Warren and Lemmen, 2014a, Krystek, 2011, Zhang, 2006). The Dutch Deltaworks Project, built more than 20 years ago between 1950 and 1997, is a prime example of the for-mer. It includes a number of storm surge barriers of which perhaps the most impressive is the Oosterschelde or Eastern Scheidt storm surge barrier that that was built at the seaward end of a canal called the New Waterway that connects the Rhine River to the North Sea (Fig 6). Its gates are each 210 metres long. Examples of the crisis management approach include work initiated after Hurricane Sandy flooded the Rockaway, Queens’s area of New York City in 2012. Following that event, the U.S. Government replenished more than 3.0 million cubic metres of beach sand and New York City planted 9.6 kilometres of sand dunes and built a new concrete and steel reinforced 8.8 kilometre long boardwalk to replace the one destroyed by the storm. New York City also plans to spend $120 million dollars to finance

SCHAFER220
the construction of seven parks designed to be more resilient to storm surges than those destroyed during Hurricane Sandy.
Fast-forward to 2014 to a federal government report entitled Canada in a Changing Climate: Perspectives on Impacts and Adaptation. It presents a bar graph showing the number of climate change adaptation articles published by Canadian researchers in 13 eco-nomic sectors between 2000 and 2012 (Warren and Lemmen, 2014b). The graph shows that agriculture, the forest sector, water management, and health have received the most attention while coastal manage-ment; energy, transport and mining seem to have been of much lesser concern. However, the apparent lower levels of scientific interest in the latter four categories are not necessarily a true reflection of the level of adaptation attention that is being paid to them in coastal parts of Canada.
A primary concern of coastal managers revolves around the ef-fects of sea level rise and flooding from storms. On Canada’s east coast, for example, James et al. (2004) note that crustal subsidence combined with dynamic oceanographic changes generates relative
Fig 6 The Oosterschelde storm surge barrier is closed when a storm surge 3 metres above normal is expected. Once closed, the doors are flooded causing them to sink and turning them into a massive barrier. By way of comparison, during hurricane Juan, which made landfall in Halifax on September 29, 2003, the associated storm surge in Halifax Harbour was, at one point, recorded as 1.5 metres above normal high tide levels (source: www.deltawerken.com/Maeslant-barrier/330.html).

221PERSPECTIVE ON WARM CLIMATE INTERVALS AND THEIR HISTORY
sea level projections that are similar to, or larger than, the global mean projections for large parts of Atlantic Canada and New Eng-land. A January, 2015 report published in the journal Nature notes that global mean sea level (GMSL) has risen at an average rate of 3.0 +/- 0.7 millimeters per year or about 30 cm per century between 1901 and 1990 (Hay et al., 2015). If their results are verified, then the ranked importance of rising sea level in relation to other identified negative impacts of predicted global warming noted in the Warren and Lemmen (2014b) government report may need to be revisited. For example, an article in the September 2014 issue of the Canadian Climate Forum notes that, for Nova Scotia, sea level is predicted to rise between 70 and 140 cm by 2100 (~ 82-~164 cm per century) and that, in general, roughly 7 million people live in coastal areas of Canada that may be impacted in one way or another (Canadian Climate Forum, 2014). Historical data for the Nova Scotia Atlantic coast tells us that this predicted rate of rise, if realized, will likely not be a linear one and could, at times, be extreme. For example, the Goddard et al. (2015) long-term analysis of tide gauge records show that within a two-year period (2009-2010), coastal sea level north of New York City “jumped” by 128 mm. This rise equates to 640 cm per century, which is about 27 times greater than the average rise of 23 cm per century that has been estimated in many research papers for the Halifax Nova Scotia coastal area. Goddard et al. linked their findings to a combined effect of a 30% downturn of Atlantic meridi-onal overturning circulation during the two-year rapid rise period and to the concurrent presence of a significant negative North Atlantic Oscillation index (NAO) at that time. The NAO is an atmospheric pressure phenomenon that modulates the direction and strength of storm tracks and westerly winds across North America. During its negative phase, the U.S. east coast typically experiences more cold air outbreaks (southeasterly flows) and hence more snowy weather conditions. However, not all relevant natural forces result in a positive effect on sea level dynamics. For example, Greenberg et al. (2012) have indicated that certain tidal effects can promote a reduction in the rate of sea level rise in the Bay of Fundy and adjacent coastal areas.
Some of the other 12 Canadian economic sectors noted in the fed-eral government’s 2014 report have likely received similar or perhaps greater levels of proactive attention with respect to adaptation to both the direct and indirect impacts of warmer temperatures. However, in general, Canadians can expect that most future initiatives will

SCHAFER222
likely remain crisis-management-driven as opposed to the long-term planning-focused flavour. Nevertheless, there appears to be an ever increasing understanding of the long-run cost benefit of proactive adaptation policies for low lying and economically valuable coastal areas that are reflected by the activities of both Canadian government departments at all levels (e.g., Environment Canada’s Ecological Gifts Program) and by federal/provincial partnerships such as the Atlantic Canada’s Regional Adaptation Collaborative which is administered by the Atlantic Climate Solutions Association. Their establishment was provoked by natural disasters, by a general recognition of the need for long-horizon adaptation and mitigation planning strategies, and perhaps by the reluctance of Canadian insurance underwriters to offer coverage to private homeowners that have elected to occupy flood-prone areas for various personal reasons (e.g., ocean views and proximity to the seaside). Flood insurance coverage varies from one country to another. For example, the U.S. government-subsidized National Flood Insurance Program, created through the National Flood Insurance Act of 1968, issued 5.5 million policies in 2010 (www.floodsmart.gov). In contrast, Germany has only offered in-surance for natural disasters since 1991 but its policies do not cover flooding from storm surges. The widespread availability of flood insurance for private homeowners in Canada will likely depend on a broadening of the risk pool by bundling flood insurance with other forms of coverage such as fire and theft. That approach may meet with considerable resistance from homeowners that have elected to occupy higher ground i.e., low risk areas. In the U.K., there are about 2.2 million homes at risk because of their exposure to poten-tial coastal or inland flooding. British insurance underwriters have elected to use the bundling approach to allow them to offer coverage to high-risk homeowners (www.abi.org.uk). This decision has been complemented by various government policies to insure that flooding risks are taken into account at all stages of the planning process to force development away from high-risk areas.
SUMMARY AND CONCLUSIONS
Canadian provincial efforts to date seem to indicate that, for the foreseeable future, adaptation to predicted sea level rise and to coastal storm hazard conditions will likely continue to be mostly dependent
223PERSPECTIVE ON WARM CLIMATE INTERVALS AND THEIR HISTORY
on vulnerabilities dictated by local geological, oceanographic and extreme weather conditions. However, for some areas, there seems to be a keen awareness by local governments of the economic benefits of proactive adaptation infrastructure development, and for the ongo-ing upgrading of existing projects such as that witnessed for the 49 kilometers of dikes surrounding Richmond BC. Nevertheless, these proactive initiatives will not come cheap. For example, An ambitious long-term project to harden the Rockaway area of New Yok City that includes flood walls and levees, estimated to be worth about four bil-lion U.S. dollars, is scheduled to begin in 2020. It involves building 13 new jetties (groynes) on the beach side of the peninsula to trap sand and to extend five existing groynes to slow coastal erosion. It is anticipated that these proactive initiatives will be complemented by a suite of increasingly restrictive zoning regulations (i.e., setbacks, building codes etc.) for future coastal zone development. However, the change from crisis-management to more proactive planning initiatives will depend, to a large degree, on the availability of more accurate and verifiable predictions of climate change and local relative sea level rise rates, and on impacts that can justify the high cost of larger multi-year or multi-decadal undertakings such as the Dutch Deltaworks Project. Some of the relatively recent flood zone development regulations evident in Canada and throughout the world involve the restriction of new buildings to designs that are able to withstand seawater inundation (e.g., stilt homes and stilt-designed commercial buildings), or the conversion of flood prone areas for use only as vegetated buffer zones or community parks (e.g., the Ocean Breeze neighborhood of Staten Island, New York). Although there is a consensus among one group of scientists and politicians that current climate conditions have been modulated by a human element, tabulated historical highlights for the three warm intervals depicted earlier in Fig 1 seem to imply that coastal-living Canadians can probably expect a business as usual dynamic to prevail during the current warm interval unless future climate predictions can demonstrate unequivocally the potential for dangerous, widespread and economically-unacceptable levels of impact. There is a second group of scientists that argue that, to date, those predictions are based on the speculations of climate modelers and that they have not been established by physical evidence i.e., hard data (www.sepp.org).
For non-catastrophic flooding by ocean water storm surges and rainstorms (e.g., relatively weak hurricanes), many individual

SCHAFER224
homeowners have installed basement sump pumps, sewage backup valves and portable generators in concert with shoreline armoring to mitigate or eliminate costly impacts such as those witnessed in low lying areas on both the Dartmouth and Halifax shores of Halifax Harbour during hurricane Juan in September, 2003. These private citizen adaptive actions, along with “no-regrets” larger complex regionally-focused projects managed by governments (e.g., the Nova Scotia Regional Adaptation Collaborative Program) suggest that 21st century Canadians will be able to successfully apply a broad range of modern technologies and engineering expertise to address negative climate impact issues such as rising sea levels and storm surges compared to those that were available for BAO, IRAO and MWP societies. In addition, there is also mounting evidence of several potentially positive climate impacts for Canada associated with the change from historical (Little Ice Age) cooler conditions to current and predicted relatively warmer temperatures (e.g., reduced winter heating costs). Advances are being made in more efficient transportation technologies, such as the driverless busses that are currently being road-tested in Finland, along with practical energy conservation options (e.g., LED lighting, electric cars, heat pumps for residential heating and cooling, more effective and energy-efficient public transportation systems, and energy-saving recycling programs). These are just some of the devices and programs that will lead the charge back to a more environmentally-sustainable world, but one in which its resident population will still have to cope with the negative impacts of naturally-driven climate variation.
REFERENCES
Associated Press. (2015). Sea level rises faster than previously thought. Tampa Bay Times, January 15th, p. 5.
Ball, T. (1992). Historical and Instrumental Evidence of Climate. In: Climate Since AD 1500. R. Bradley and P.D. Jones (eds.), Routledge, London, p. 40-73.
Bianchi, G. & McCave, I. (1999). Holocene periodicity in North Atlan-tic climate and deep ocean flow south of Iceland. Nature 397 (6719): 515-517.
Bray, R. (1967). Variation in atmospheric carbon – 14 activity relative to a sunspot- auroral solar index. Science 156: 640-642.

225PERSPECTIVE ON WARM CLIMATE INTERVALS AND THEIR HISTORY
Briffa, K., Jones, P.D. & Schweingruber, F. (1992). Tree-ring density reconstructions of summer temperature patterns across Western North America since 1600. Jour. Climate 7: 735-754.
British Columbia Ministry of Environment. (2013). Sea Level Rise Adaptation Primer: A Tool Kit to Build Adaptive Capacity on Canada’s South Coasts. 8 p.
Canadian Climate Forum. (2014). Forecasting a Sea of Change: Lessons From Atlantic Canada 2 (1), p. 1-8. www.climateforum.ca/wp-content/uploads/2014//10/CCF-issues-SeaOfChange_web.pdf.
Chen, L. et al. (2011). Short-term climate variability during the “Roman Classical Period” in the Eastern Mediterranean. Quaternary Science Reviews 30: 3880-3891.
Coburn, A. (2012). Beach Nourishment in the United States. In: Pitfalls of Shoreline Stabilization, Coastal Research Library 3, Cooper, J. and Pilkey, O. (eds.), Springer, Dordrecht, p. 105-119.
CO2 Science. (2017). Carbon Dioxide and Earth’s Future: Pursuing the Prudent Path. CO2 Science, Center for the Study of Carbon Dioxide and Global Change. www.CO2science.org/education/reports/prudentpath/ch1.php.
CBC News. (2013). www.CBC.Ca/News/Canada/Nova-Scotia/Wolfville-dikes-built-up-to-weather-climate-change-/.2129542.
CBC News. (2015). Cavendish Dunes Restored With Marram Grass. www.CBC.Ca/News/Canada/Prince-Edward-Island/upei=students-plant-marram-grass-dunes-/.3263059.
CSPRA. (2011). www.cspra.ca/sites/default/files/fichiers/climate_change_and_shoreline_protection_in_atlantic_Canada_0_pdf.
Dickinson, O. (1994). The Aegean Bronze Age. Cambridge University Press, Cambridge, United Kingdom. 342 p.
Esper, J., Buntgen, U., Timonen, M., & Frank, D. (2012). Variability and extremes of northern Scandinavian summer temperatures over the past two millennia. Global and Planetary Change 88-89: 1-9.
Grant, D. (1975). Recent coastal submergence of the Maritime Provinces. Proceedings of the Nova Scotian Institute of Science 27, Supp. 3: 83-102.
Goddard, P. et al. (2015). An extreme event of sea-level rise along the northeast coast of North America. Nature Communications 6, Article 6346, 1 p.
Genz, H. & Mielke, D. (eds.) (2011). Insights into Hittite History and Archaeology. Peeters, Walpole, Mass., 338 p.
Greenberg, D., Blanchard, W., Smith, B., & Borrow, E. (2012). Climate change, mean sea level and high tide in the Bay of Fundy. Atmosphere-Ocean 50 (3): 261-276.
Halstead, P. (1992). The Mycenaean palatial economy: Making the most of the gaps in the evidence. Proceedings of the Cambridge Philological Society 38: 57-86.
Hay, C. et al. (2015). Probabilistic reanalysis of 20th - century sea-level rise. Nature (Letter) 517: 481-484.

SCHAFER226
Hiller, A., Boettger, T. & Kremenetski, C. (2001). Medieval climate warming recorded by radiocarbon-dated Pine Tree-line Shift on the Kola Peninsula, Russia. The Holocene 11: 491-497.
Holzhauser, H. Magny, M. & Zumbuhl, H., 2005. Glacier and lake-level variations in west-Central Europe over the last 3500 years. The Holocene 15: 789-801.
Hufbauer, K. (1991). Exploring the Sun: Solar Science Since Galileo. Johns Hopkins Press Baltimore, MD., p. 278-280.
James, T., Henton, J., Darlington, A., Forbes, D., & Craymer, M. (2014). Relative Sea-level Projections in canada and the Adjacent Main-land United States. Geological Survey of Canada Open File 7737, 72 p.
Keigwin, L. (1996). The Little Ice Age and the Medieval Warm Period in the Sargasso Sea. Science 274 (5292): 1504-1508.
Kobashi, T., Kawamura, K., Severinghaus, J., Barnola, J-M., Nakae-gawa, T., Vinther, B., Johnsen, S., & Box, J. (2011). High variability of Greenland surface temperature over the past 4000 years estimated from trapped air in an ice core. Geophysical Research Letters 38: 6.
Krystek, L. (2011). The Zuiderzee and Delta Works of the Netherlands. www.unmuseum.org/7wonders/Zunderzee.htm.
Kullman, L. (2013). Ecological tree line history and paleoclimate review of megafossil evidence from the Swedish Scandes. Boreas 42, (3): 555-567.
Lamb, H. (1977). Solar Forcing During the Roman Warm Period. In: Climate: Past, Present and Future V. 2, Climate History and the Future, Methuen, London, 837 p.
Lau, M. (2005). Adaptation to Sea-Level Rise in the Peoples Republic of China – Assessing the Institutional Dimension of Alternative Organi-zational Frameworks. Research Unit Sustainability and Global Change, Center for marine and Atmospheric Science, Hamburg University (sub-mitted). Working Paper FNU-94, 4 5p.
Lenton, T. (2000). Land and ocean carbon cycle feedback effects on global warming in a simple earth system model. Telus 52 (B): 1159-1188.
Ljungqvist, F. et al. (2012). Northern Hemisphere temperature patterns in the last 12 centuries. Climate of the Past 8: 227-249.
Marshall, R. (2014). New Orleans Flood Protection System: Stronger Than Ever, Weaker Than it was Supposed to be. www.thelensnola.org/2014/05/15/New-Orleans-flood-protection-system-stronger-than-ever-weaker-than-it-was-supposed-to-be.
McDermott, F., Mattey, D. & Hawkesworth, C. (2001). Centennial-Scale Holocene climate variability revealed by a high resolution Speleothem 18O record from Southwestern Ireland. Science 294: 1328-1331.
Medioli, F. & Schafer, C. (2011). Global Warming and Alternate Agendas: Where are we and where might we be? Proceedings of the First Inter-national Conference on Global Warming and the Next Ice Age, August 19-24, 2001, Dalhousie University, p. 134.
Natesan, M. et al. (1997). Low-frequency oscillations in temperature – proxy records and implications for recent climate change. Geophysical Research Letters 24(5): 563-566.

227PERSPECTIVE ON WARM CLIMATE INTERVALS AND THEIR HISTORY
Ogden, J. (1981). There’s a chill in the air. In: Syllogeus, No. 33, Climate Change in Canada 2 (C. Harrington ed.), National Museum of Natural Sciences, Ottawa, Ontario, p. 10-18.
Ogilvie, A. (1992). Documentary Evidence for Changes in the Climate of Iceland AD 1500 to 1800. In: Climate Since AD 1500. R. Bradley and P.D. Jones (eds.), Routledge, London, p. 92-117.
Oliver, J. (ed) (2005). The Encyclopedia of World Climatology. Springer Science and Business Media, p. 259.
Oorschot, J. & van Raalte, G. (1991). Beach nourishment, execution meth-ods and developments in technology. Coastal Engineering 16 (1): 23-42.
Orr, R. & Brown, W. (2014). Building Coastal Resilience With OCS Sand Resources. Sea Technology 55 (8): 15-22.
Pallson, H. (1965). The Vineland Sagas: The Norse Discovery of North America. Penguin Classics, United Kingdom, p. 28
Patterson, W., Deitrich, K., Holmden, C., & Andrews, J. (2010). Two millennia of North Atlantic seasonality and implications for Norse colonies. Proceedings of the US National Academy of Sciences 107 (12): 5306-5310.
Pearce, M. (1998). New research on the terramare of Northern Italy. Antiquity 72 [278]: 743-746.
Prats-Iraola, P., Scheiber, R., Reigber, A., & Horn, R. (2009). Estimation of the surface velocity field of the Aletsch Glacier using multi-baseline airborne SAR interferometry. Trans. on Geoscience and Remote Sens-ing 47: 419-430.
Pak, D. et al. (2012). Millennial scale changes in sea surface temperature and ocean circulation in the northeast Pacific, 10-60 Kyr BP. Paleocean-ography 27 (10): 1029.
Petkova, E. et al. (2014). Heat and Mortality in New York City since the beginning of the 20th century. Epidemiology 25: 554-560.
Rahman, A., Jiban, M. & Munaa, S. (2015). Regional variation of tem-perature and Rainfall in Bangladesh: Estimation of Trend. Open Journal of Statistics 5: 652-657.
Rosa, E. & Dietz, T., 1998. Climate change and society: Speculation, construction and scientific investigation. International Sociology 13: 421-450.
Rush, E. (2015). As the Sea Rises: Managing Retreat Along New York City’s Coasts. Https://newrepublic.com/article/123182/managing-retreat-along-New-York-City’s-coasts.
Scafetta, N. (2012). Multi-scale harmonic model for solar and climate cyclical variation throughout the Holocene based on Jupiter-Saturn tidal frequencies plus the 11-year solar dynamo cycle. Jour. of Atmospheric and Solar-Terrestrial Physics 80: 296-311.
Scheidel, W., Morris, I. & Saller, R. (2012). The Cambridge Economic History of the Greco-Roman World. Cambridge University Press, Cam-bridge, UK, 942 p.

SCHAFER228
Shaw, J., Taylor, R. & Forbes, D. (1992). Impact of accelerated sea-level rise on the east coast of Nova Scotia. In Proceedings of the Symposium on The Climate of Nova Scotia, Atmospheric and Environment Service, Environment Canada, p. 119-143.
Tinner, W., Lotter, A., Ammann, B., Condera, M., Hubschmied, P., van Leeuwan, J., & Wehrli, M. (2003). Climate change and contemporane-ous land use phases north and south of the Alps 2300 BC to 800 AD. Quaternary Science Reviews 22: 1447-1460.
US Army Corps of Engineers. (2010). After Action Report, May 2010 Flood Event Cumberland River Basin. Http://www.lrn.usace.army.mil/ LRN_pdf/AAR_May_2010_Flood_Cumberland_Draft_V_7_21.pdf.
Wall, G. (1990). Socio-Economic Implications of climate change: Cana- dian climate impacts program study results. In: Climate Change – Implications for Water and Ecological Resources. University of Waterloo, Department of Geography Publication Series, Occasional Paper No. 11, p. 69-75.
Wantanabe, M. Shiogama, H., Hiroaki, T., Michiya, H., Masaoshi, I., & Masahide, K. (2014). Contribution of natural Decadal Variability to global warming accelerations and hiatus. Nature Climate Change 4: 893-897.
Warren, F. & Lemmen, D. (2014a). Synthesis. In: Canada in a Changing Climate: Sector Perspectives on Impacts and Adaptation (F. Warren and D. Lemmen (eds). Government of Canada, Ottawa, Ontario, p. 1-18.
_________________ (2014b). Introduction. In: Canada in a Changing Climate: Sector Perspectives on Impacts and Adaptation (F.Warren and D. Lemmen (eds), Government of Canada, Ottawa, Ontario, p. 19-22.
Wigley, T., Ingram, M. & Farmer, G. (1981). Past Climates and Their Impact on Man: A Review. In: Climate and History T. Wigley, M. Ingram and G. Farmer (Eds), Cambridge University Press, New York, p. 3-50.
Williams, M. (2007). Native Plants for Coastal Restoration: What, When and How for Florida. USDA, NRCS, Brooksville Plant Materials Center, Brooksville, Florida, 51 p. Http://www.fl.nrcs.usda.gov/programs/pmc/Flplantmaterials.html.
Zhang, J. (2006). Water calamities and dike management. in the Jianghan Plain in the Quing and the Republic. Late Imperial China 27 (1): 66-108.
www.britannica.com/event/Pax-Romana/www.floodsmart.gov/floodsmart/pages/about/nfip+overview.jsp.www.abi.org.uk/insurance-and-savings/topics-and-issues/flood-re.www.gov.pei.ca/photos/original/de_shoreProtec.pdf.www.scienceheathen.com/2015/02/11/late-bronze-age-collapse-mycenae-an-civilazation-collapse-witnessed-3400-3000-years-ago/

![A NEW PERSPECTIVE WITH EXAMPLES arXiv:1310.5604v2 … · 2016-10-28 · arXiv:1310.5604v2 [math.GM] 27 Oct 2016 ARITHMETIC OF FUZZY NUMBERS AND INTERVALS - A NEW PERSPECTIVE WITH](https://static.fdocuments.us/doc/165x107/5e64e6e9de47c857c27edcda/a-new-perspective-with-examples-arxiv13105604v2-2016-10-28-arxiv13105604v2.jpg)