Perspective of Nuclear Power Industry on the Global...
12
Perspective of Nuclear Power Industry on the Global Market AtomExpo, Moscow, Russia June 10, 2014 CONFIDENTIAL AND PROPRIETARY Any use of this material without specific permission of McKinsey & Company is strictly prohibited
Transcript of Perspective of Nuclear Power Industry on the Global...
Perspective of Nuclear Power Industry on the Global Market
AtomExpo, Moscow, RussiaJune 10, 2014
CONFIDENTIAL AND PROPRIETARYAny use of this material without specific permission of McKinsey & Company is strictly prohibited
McKinsey & Company | 1
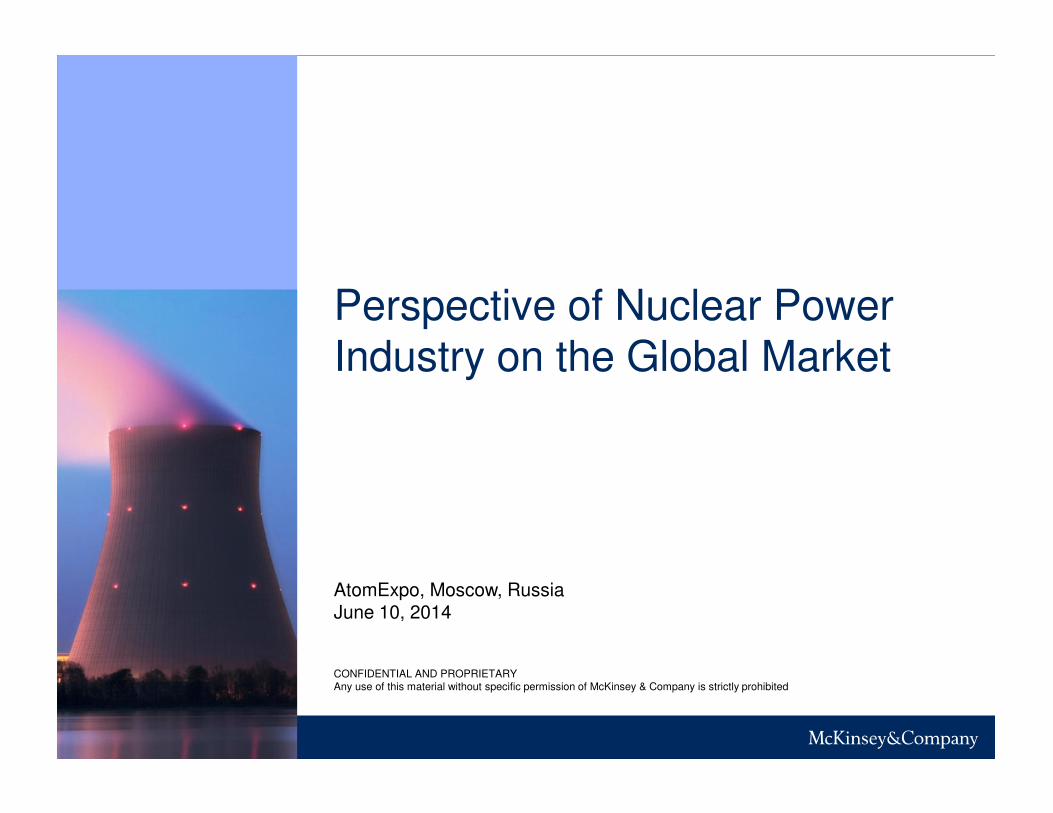
Many countries are showing interest in nuclear energy Operating (29)
Considering / Building (43)
Expressing interest (24)
SOURCE: McKinsey analysis
McKinsey & Company | 2
012
43
1445
68
127
(China)
195
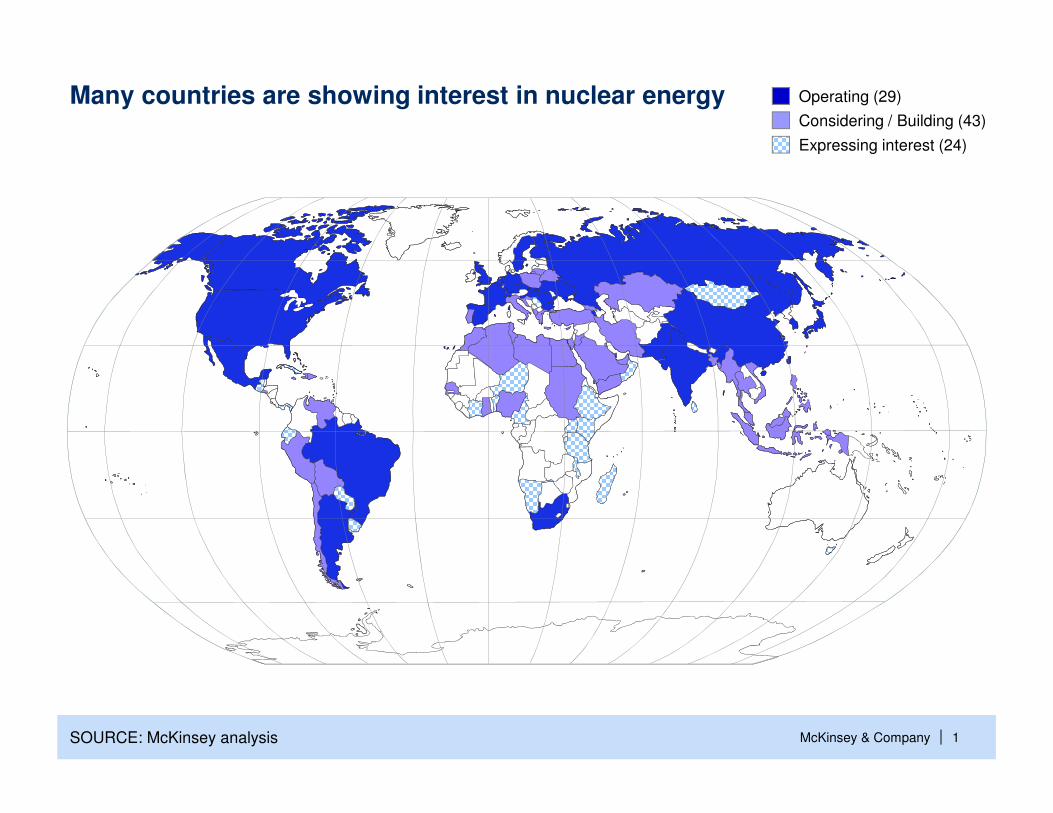
Future growth is uneven among geographies with Asia accounting for the majority stake
NorthAmerica
Western Europe
Latin America, mainly Brazil
Africa Russia, CIS, and Eastern Europe
AsiaMiddle East
GW (new capacity till 2030)
5
4
43
195
14
12
0
SOURCE: McKinsey analysis

McKinsey & Company | 3
Nuclear suppliers▪ A number of countries are building NPPs at home to strengthen
their position as world nuclear suppliers and to prove latest technology references to increase or protect their presence in
the industry
• Russia
• China
• S. Korea
• France
There are key driving factors driving development of nuclear power in different regions
Comments
SOURCE: McKinsey analysis
Examples of geographies
Decarbonization
▪ Production of nuclear energy doesn't contribute to carbon emissions
▪ It does not produce smoke particles to pollute the atmosphere
▪ Still despite trend on decarbonization, nuclear energy faces difficulties because of safety concerns
• Western
Europe
• Canada
Stable and reliable growth
▪ Production energy from NPP does not depend on the
weather and is not subject to the price volatility associated
with gas-fired plants
▪ It is relatively easy to forecast the output
• India
• Turkey
• China
Competing technologies
▪ Shale gas development in USA drives average gas prices down and reduces the economic incentive of building new
NPP's
▪ In some countries renewable energy sources are
developing rapidly and begin to compete with all types of
energy, including nuclear power
• USA
• Brazil
• Denmark
▪ Ultimately, economics should be right to compete in any region
Energy diversification
▪ Countries which significantly dependent on prices for
traditional energy sources are willing to diversify
▪ Nuclear energy can be considered as a good substitute for
traditional energy supply, but need to compete with other types
of energy
• China
• USA
McKinsey & Company | 4
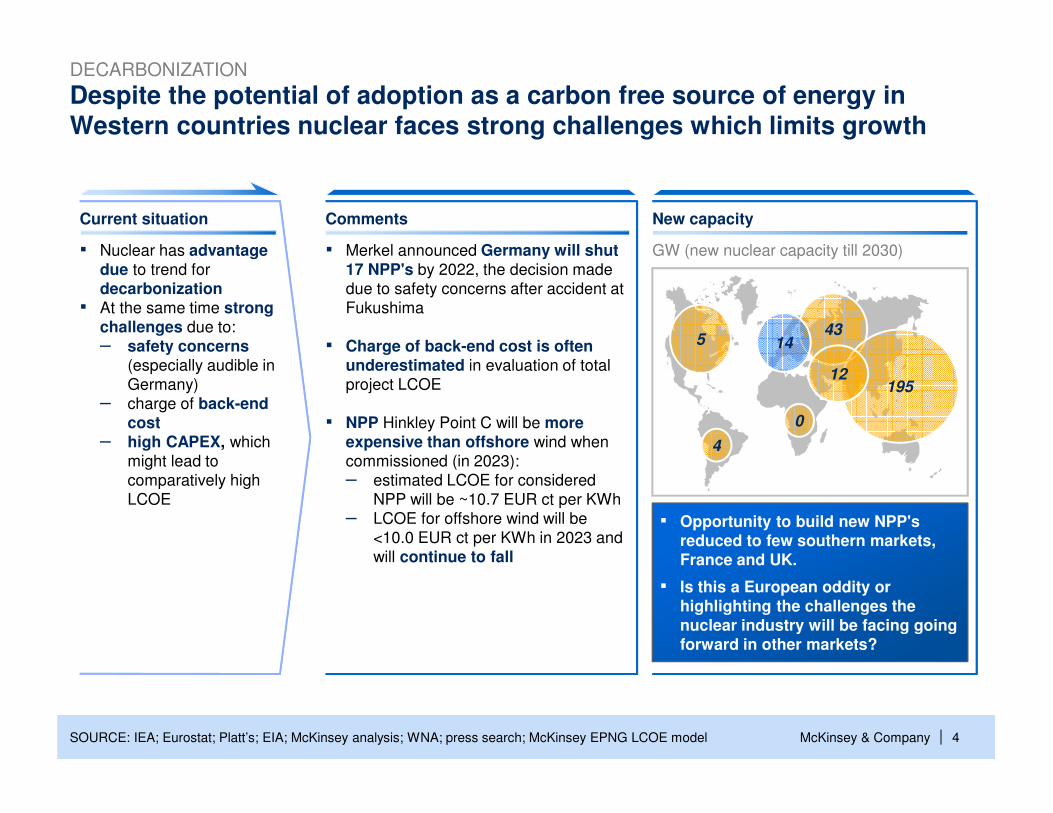
Despite the potential of adoption as a carbon free source of energy in Western countries nuclear faces strong challenges which limits growth
SOURCE: IEA; Eurostat; Platt’s; EIA; McKinsey analysis; WNA; press search; McKinsey EPNG LCOE model
DECARBONIZATION
▪ Opportunity to build new NPP'sreduced to few southern markets, France and UK.
▪ Is this a European oddity or highlighting the challenges the nuclear industry will be facing going forward in other markets?
5
4
43
195
14
12
0
GW (new nuclear capacity till 2030)
New capacityComments
▪ Merkel announced Germany will shut 17 NPP's by 2022, the decision made
due to safety concerns after accident at
Fukushima
▪ Charge of back-end cost is often underestimated in evaluation of total
project LCOE
▪ NPP Hinkley Point C will be more expensive than offshore wind when
commissioned (in 2023):
– estimated LCOE for considered
NPP will be ~10.7 EUR ct per KWh
– LCOE for offshore wind will be
<10.0 EUR ct per KWh in 2023 and
will continue to fall
Current situation
▪ Nuclear has advantage due to trend for
decarbonization▪ At the same time strong
challenges due to:
– safety concerns (especially audible in
Germany)
– charge of back-end cost
– high CAPEX, which
might lead to
comparatively high
LCOE

McKinsey & Company | 5
US is dominated by shale agenda and nuclear energy has verylimited potential
SOURCE: McKinsey Global Energy Perspective, McKinsey analysis
▪ Opportunity to build new NPP'sdepends greatly on macroeconomic environment (ex. gas price), which now creates negative trends
▪ At the same time nuclear has to compete against energy efficiency and demand management programs, which also add tension to future nuclear growth in NA region
▪ Very low gas prices
▪ Limitedappetite to
finance and
guarantee large
nuclear projects
▪ Modest increase in
demand for
energy
Current situation Comments
▪ Shale gas development in US drives
average gas prices down and makes
construction of new merchant nuclear power
plants in competitive markets uneconomical
now and in the nearest future
▪ LCOE of new power generation on natural
gas is ~ 4 EUR ct per KWh, which is lower than for nuclear energy
▪ Recent world financial crisis and problems
with debt make it more difficult to finance NPP projects, which requires big CAPEX
▪ Share of nuclear energy in overall power
production in US is expected to decreasefrom 19% in 2010 to 13% in 2030
▪ Overall demand for energy in US is
expected to rise significantly slower compared to rest of the world: by ~20%
in 2030 compared to 2010, while average
demand for energy in the world is expected
to rise by almost 60% in the same period
Perspective for nuclear energy
1 Carbon-Capture-and-Storage (CCS)
COMPETING TECHNOLOGIES
EXAMPLE 1
McKinsey & Company | 6
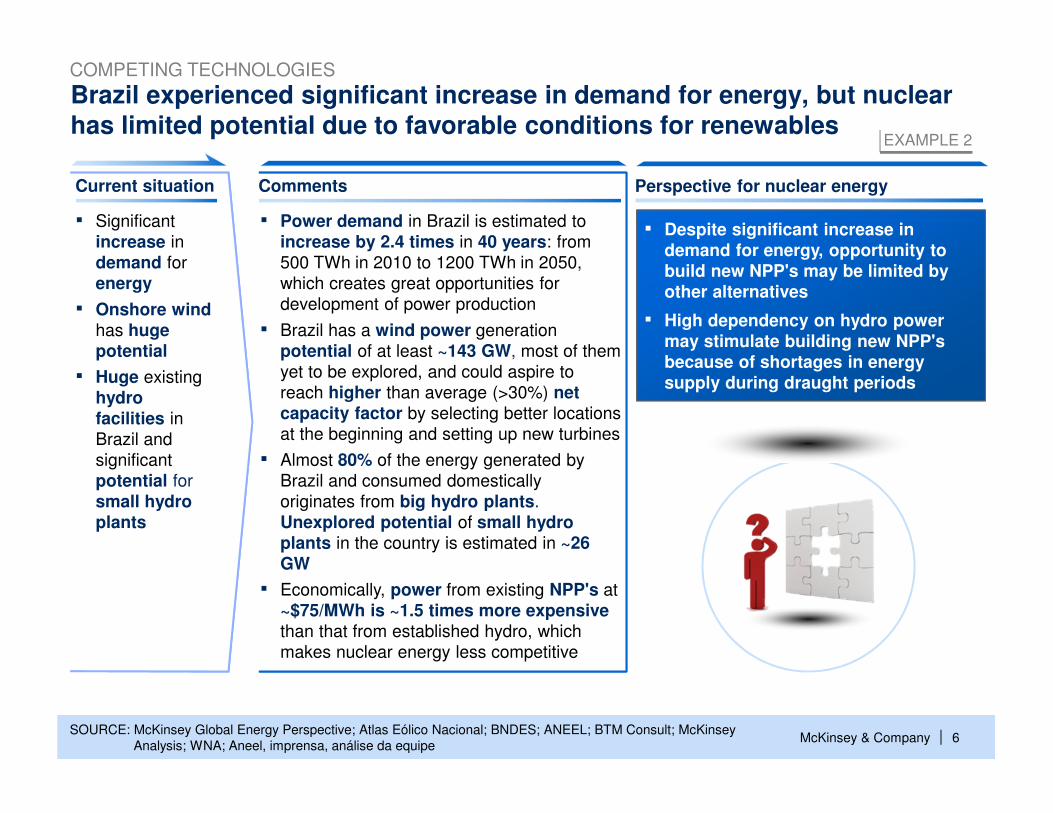
Current situation Comments Perspective for nuclear energy
Brazil experienced significant increase in demand for energy, but nuclear has limited potential due to favorable conditions for renewables
▪ Significant
increase in
demand for
energy
▪ Onshore wind has huge potential
▪ Huge existing
hydro facilities in
Brazil and
significant
potential for
small hydro plants
SOURCE: McKinsey Global Energy Perspective; Atlas Eólico Nacional; BNDES; ANEEL; BTM Consult; McKinsey
Analysis; WNA; Aneel, imprensa, análise da equipe
▪ Power demand in Brazil is estimated to
increase by 2.4 times in 40 years: from
500 TWh in 2010 to 1200 TWh in 2050,
which creates great opportunities for
development of power production
▪ Brazil has a wind power generation
potential of at least ~143 GW, most of them
yet to be explored, and could aspire to
reach higher than average (>30%) net capacity factor by selecting better locations
at the beginning and setting up new turbines
▪ Almost 80% of the energy generated by
Brazil and consumed domestically
originates from big hydro plants.
Unexplored potential of small hydro plants in the country is estimated in ~26 GW
▪ Economically, power from existing NPP's at
~$75/MWh is ~1.5 times more expensive than that from established hydro, which
makes nuclear energy less competitive
▪ Despite significant increase in demand for energy, opportunity to build new NPP's may be limited by other alternatives
▪ High dependency on hydro power may stimulate building new NPP'sbecause of shortages in energy supply during draught periods
COMPETING TECHNOLOGIES
EXAMPLE 2
McKinsey & Company | 7
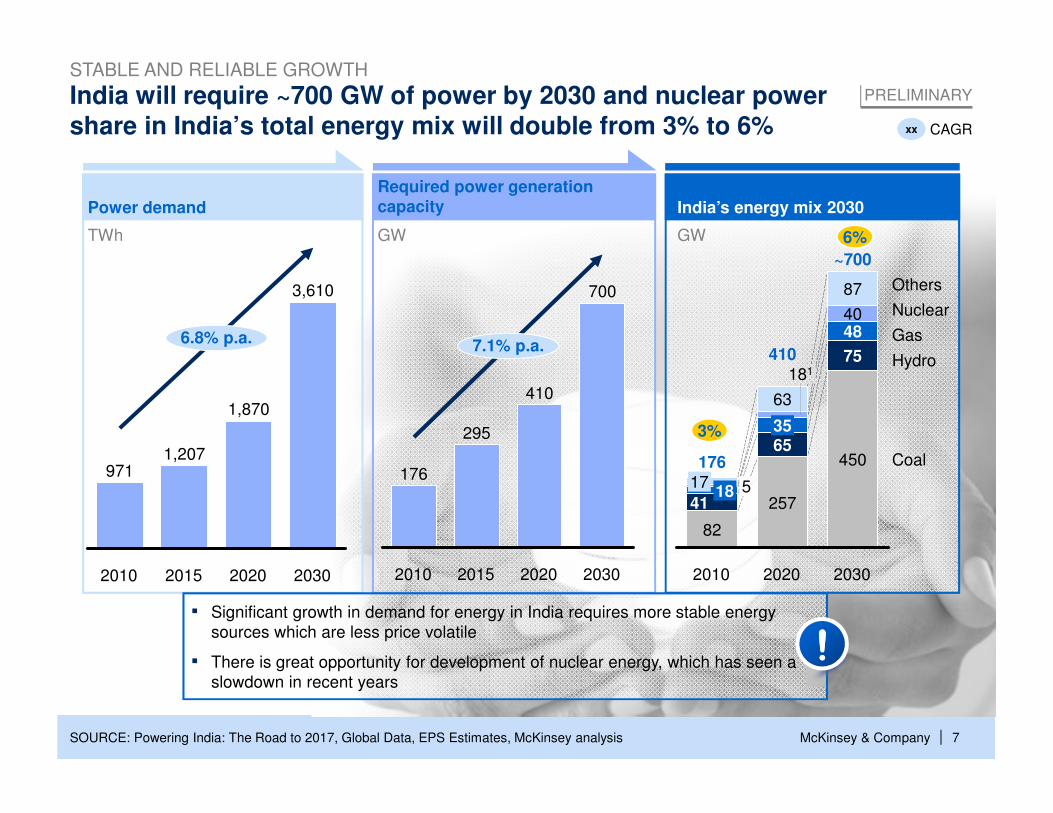
India will require ~700 GW of power by 2030 and nuclear power share in India’s total energy mix will double from 3% to 6%
PRELIMINARY
xx CAGR
TWh GW GW
6.8% p.a.
2015
1,207
2010
3,610
2020
971
2030
1,870
7.1% p.a.
2030202020152010
700
410
295
176176
82
41
2030
517
Coal
Nuclear
18
Gas
Hydro
Others
~700
450
75
4840
87
2020
410
63
257
6535
181
2010
▪ Significant growth in demand for energy in India requires more stable energy
sources which are less price volatile
▪ There is great opportunity for development of nuclear energy, which has seen a
slowdown in recent years
3%
6%
Power demand
Required power generation capacity India’s energy mix 2030
SOURCE: Powering India: The Road to 2017, Global Data, EPS Estimates, McKinsey analysis
STABLE AND RELIABLE GROWTH

McKinsey & Company | 8
Increased demand for energy in China stimulates increase in energy supply and need for diversification of energy generation
CAGR2010-30Percent
Generation mixTWh
SOURCE: NDRC ERI; IEA; UBS; Expert interviews; McKinsey analysis
1 Include solar, biomass, etc.
1013
5
7
22
19
17
54
5
2030
2,637
53
2020
Coal
100% =
Wind
Nuclear
Gas
Hydro
Other alternative1
2,090
3
60
2010
966
13
13
69
Installed capacity mixGW
CAGR2010-30Percent
57
6
85
6
16
17
13
1
2020
8,433
2 2
11,398
6467
2010
4,229
22
78
100% =
Other alternative1
1
Nuclear
Gas
Hydro
Coal
2030
Wind
5
4
4
11
13
15
DIVERSIFICATION
▪ China as a one of the biggest consumer of oil and natural gas, needs diversification
▪ Nuclear energy has significant potential in China, and installed nuclear capacities are estimated to increase by ~13% annually until 2030
▪ Nuclear power needs to compete intensively with another power sources, including RES
5
4
4
10
13
14
13 11
McKinsey & Company | 9
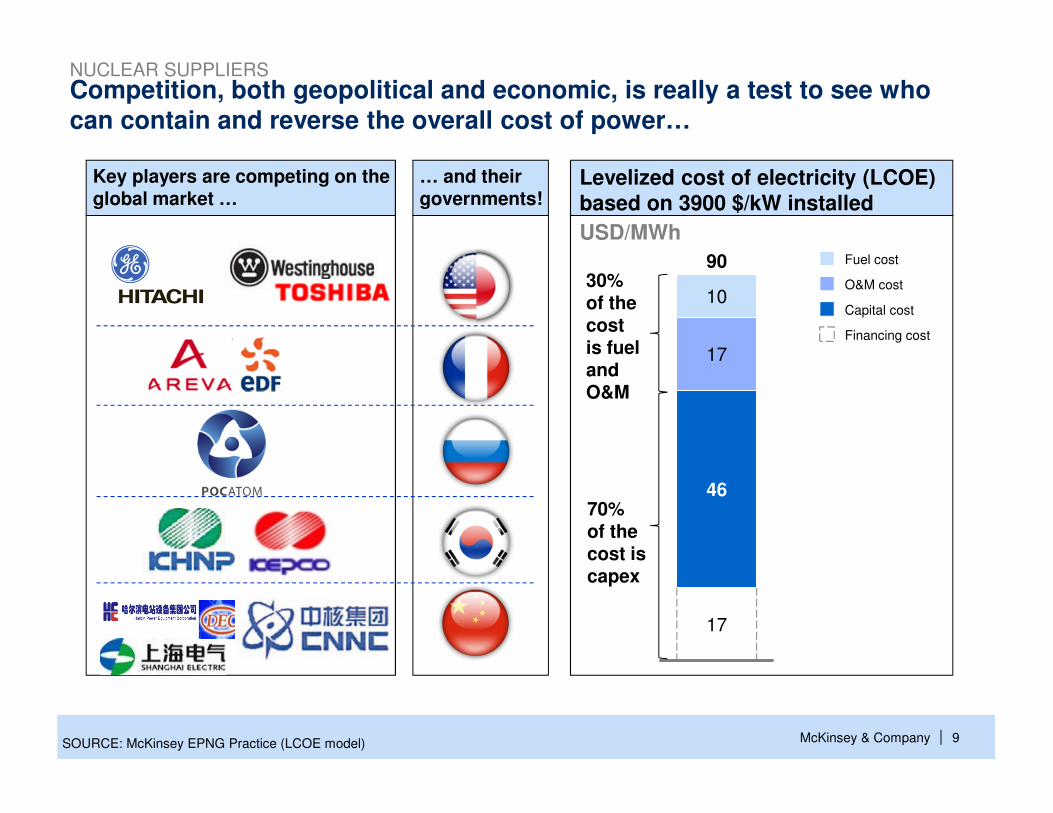
Competition, both geopolitical and economic, is really a test to see who can contain and reverse the overall cost of power…
Key players are competing on the global market …
… and their governments!
SOURCE: McKinsey EPNG Practice (LCOE model)
90
17
46
17
10
Financing cost
O&M cost
Fuel cost
Capital cost
Levelized cost of electricity (LCOE) based on 3900 $/kW installed
70% of the cost is capex
30% of the cost is fuel and O&M
NUCLEAR SUPPLIERS
USD/MWh
McKinsey & Company | 101010
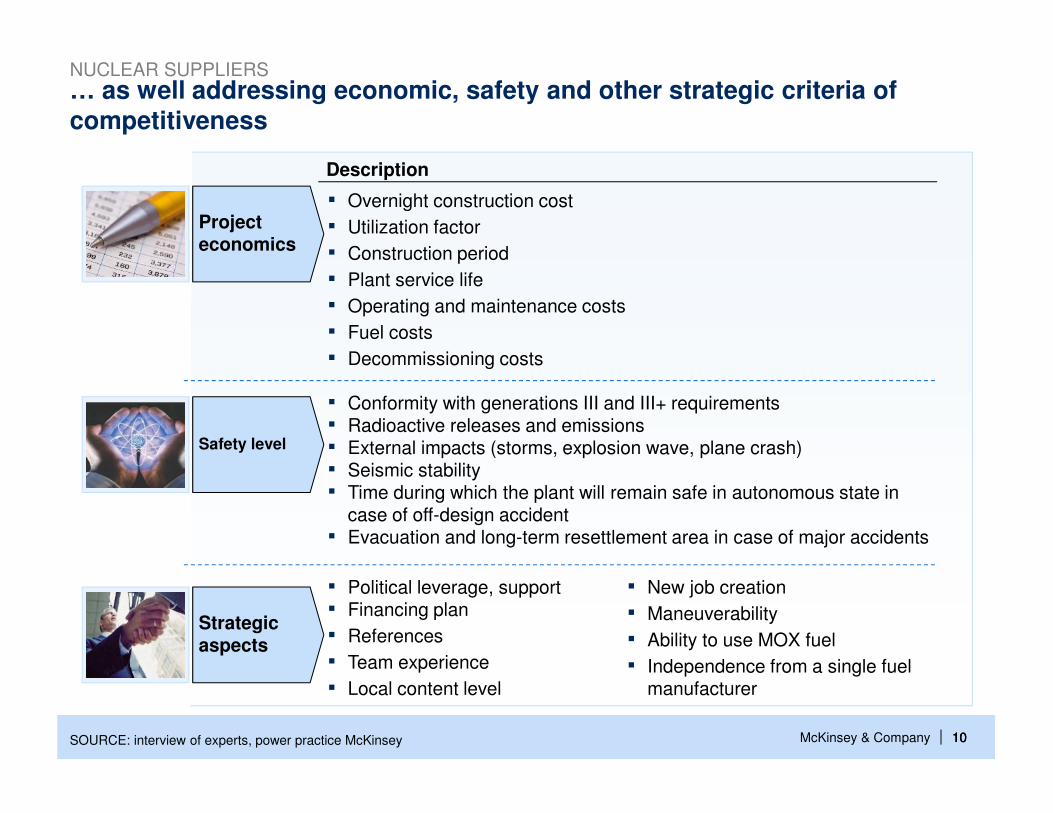
… as well addressing economic, safety and other strategic criteria of competitiveness
Description
SOURCE: interview of experts, power practice McKinsey
Strategicaspects
▪ Political leverage, support▪ Financing plan
▪ References
▪ Team experience
▪ Local content level
Projecteconomics
▪ Overnight construction cost
▪ Utilization factor
▪ Construction period
▪ Plant service life
▪ Operating and maintenance costs
▪ Fuel costs
▪ Decommissioning costs
Safety level
▪ Conformity with generations III and III+ requirements▪ Radioactive releases and emissions▪ External impacts (storms, explosion wave, plane crash)▪ Seismic stability▪ Time during which the plant will remain safe in autonomous state in
case of off-design accident▪ Evacuation and long-term resettlement area in case of major accidents
▪ New job creation
▪ Maneuverability
▪ Ability to use MOX fuel
▪ Independence from a single fuel manufacturer
NUCLEAR SUPPLIERS
McKinsey & Company | 11
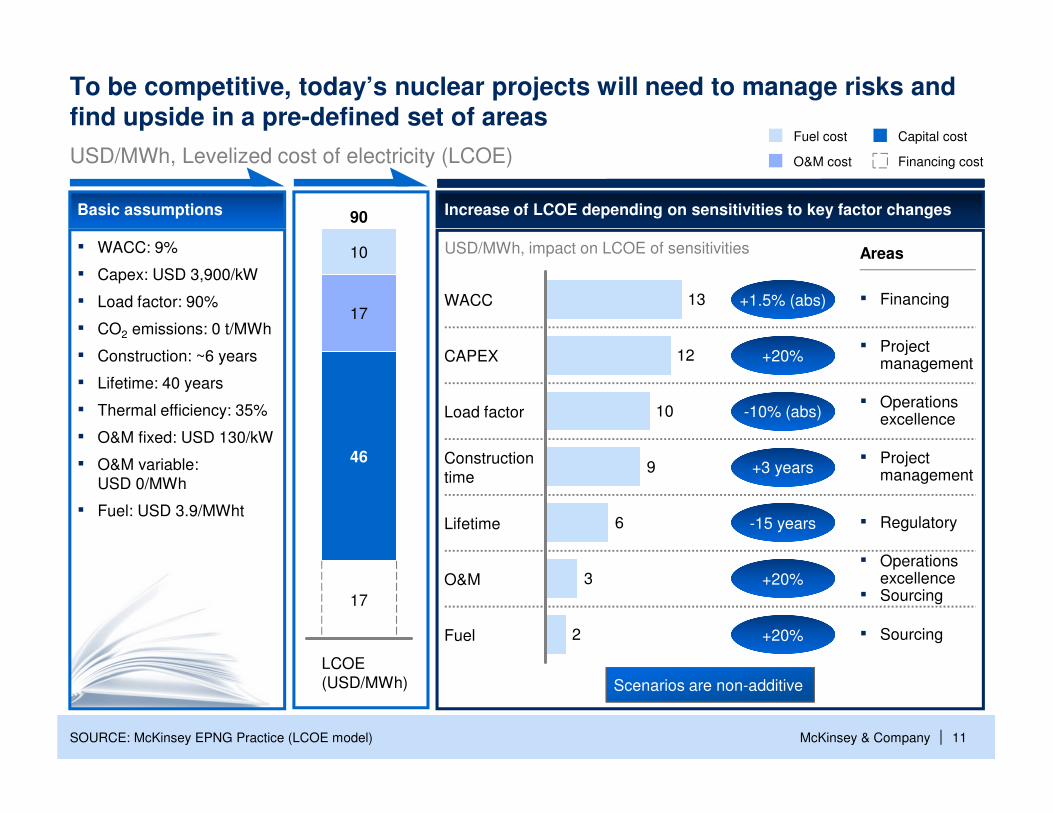
USD/MWh, impact on LCOE of sensitivities
SOURCE: McKinsey EPNG Practice (LCOE model)
10
17
46
17
LCOE
(USD/MWh)
90
Financing cost
Capital cost
O&M cost
Fuel cost
USD/MWh, Levelized cost of electricity (LCOE)
2
3
6
9
10
12
13
O&M
Fuel
Lifetime
Construction
time
Load factor
CAPEX
WACC
Basic assumptions
▪ WACC: 9%
▪ Capex: USD 3,900/kW
▪ Load factor: 90%
▪ CO2 emissions: 0 t/MWh
▪ Construction: ~6 years
▪ Lifetime: 40 years
▪ Thermal efficiency: 35%
▪ O&M fixed: USD 130/kW
▪ O&M variable:
USD 0/MWh
▪ Fuel: USD 3.9/MWht
Increase of LCOE depending on sensitivities to key factor changes
To be competitive, today’s nuclear projects will need to manage risks and find upside in a pre-defined set of areas
Scenarios are non-additive
Areas
▪ Sourcing
+20%▪ Operations
excellence▪ Sourcing
-15 years ▪ Regulatory
+3 years▪ Project
management
-10% (abs)▪ Operations
excellence
+20%▪ Project
management
+1.5% (abs) ▪ Financing
+20%