Personalized Click Prediction in Sponsored · PDF filePersonalized Click Prediction in...
9
Personalized Click Prediction in Sponsored Search Haibin Cheng Yahoo! Labs 4401 Great America Parkway Santa Clara, CA, U.S.A [email protected] Erick Cantú-Paz Yahoo! Labs 4401 Great America Parkway Santa Clara, CA, U.S.A [email protected] ABSTRACT Sponsored search is a multi-billion dollar business that gen- erates most of the revenue for search engines. Predicting the probability that users click on ads is crucial to sponsored search because the prediction is used to influence ranking, filtering, placement, and pricing of ads. Ad ranking, fil- tering and placement have a direct impact on the user ex- perience, as users expect the most useful ads to rank high and be placed in a prominent position on the page. Pric- ing impacts the advertisers’ return on their investment and revenue for the search engine. The objective of this paper is to present a framework for the personalization of click models in sponsored search. We develop user-specific and demographic-based features that reflect the click behavior of individuals and groups. The features are based on obser- vations of search and click behaviors of a large number of users of a commercial search engine. We add these features to a baseline non-personalized click model and perform ex- periments on offline test sets derived from user logs as well as on live traffic. Our results demonstrate that the per- sonalized models significantly improve the accuracy of click prediction. Categories and Subject Descriptors H.3.5 [Online Information Services]: Commercial Ser- vices; H.4.m [Information Systems]: Miscellaneous; I.5.2 [Design Methodology]: Classifier Design and Evaluation General Terms Algorithms, Measurement, Design, Experimentation, Hu- man Factors Keywords Sponsored Search, Click Prediction, Personalization, User Profile, Demographic, Click Feedback, Maximum Entropy Modeling Permission to make digital or hard copies of all or part of this work for personal or classroom use is granted without fee provided that copies are not made or distributed for profit or commercial advantage and that copies bear this notice and the full citation on the first page. To copy otherwise, to republish, to post on servers or to redistribute to lists, requires prior specific permission and/or a fee. WSDM’10, February 4–6, 2010, New York City, New York, USA. Copyright 2010 ACM 978-1-60558-889-6/10/02 ...$10.00. 1. INTRODUCTION Sponsored search is an Internet advertising system that generates most of the revenue of search engines by presenting targeted advertisements along with the search results. In the common “pay-per-click” model, advertisers are charged for each click on their ads. To maximize the revenue for a search engine and maintain a desirable user experience, the sponsored search system needs to make decisions related to selection, ranking and placement of the ads. These decisions are based greatly on the probabilities that users will click on ads, and therefore accurate click prediction is an essential problem in sponsored search. Current state-of-the-art sponsored search systems typi- cally rely on a machine learned model to predict the clicka- bility of ads returned for a user search query. For the experi- ments in this paper, we will use a system based on numerous user-independent features as a baseline. Some of these fea- tures are based on the similarity of the query to the text of the ads and range in complexity from simple word or phrase overlap to more sophisticated semantic similarities between the query and different elements of the ads. Other features are related to the historical performance of ads. In our expe- rience, certain statistics of the past performance of ads are good predictors of the click probability. Yet another group of features gives contextual information, such as the time of day or day of the week. All of these features ignore the users both individually and as parts of groups with similar behav- iors and therefore the model will predict the same probabil- ity of click for every user. We believe that personalizing the click prediction benefits both the users and the advertisers: The users will be presented ads in the manner that is most relevant to them, and the advertisers will receive clicks from users who are more engaged with the ads. The objective of this paper is to present the design of per- sonalized click prediction models. An essential part of these models is the development of new user-related features. We base our features on observations over a significant volume of search queries from a large number of users. Our obser- vations suggest that user click behavior varies significantly with regard to their demographic background, such as age or gender. We investigate the click distribution for differ- ent users from various backgrounds and design a set of de- mographic features to model their group clicking patterns. Recognizing that there is still significant variability in de- mographic groups, we also investigate user-specific features. The new user-related features are integrated with other fea- tures in a maximum entropy classification framework and contribute to the final predicted clickability score for each 351
Transcript of Personalized Click Prediction in Sponsored · PDF filePersonalized Click Prediction in...

Personalized Click Prediction in Sponsored Search
Haibin ChengYahoo! Labs
4401 Great America ParkwaySanta Clara, CA, U.S.A
Erick Cantú-PazYahoo! Labs
4401 Great America ParkwaySanta Clara, CA, U.S.A
ABSTRACTSponsored search is a multi-billion dollar business that gen-erates most of the revenue for search engines. Predicting theprobability that users click on ads is crucial to sponsoredsearch because the prediction is used to influence ranking,filtering, placement, and pricing of ads. Ad ranking, fil-tering and placement have a direct impact on the user ex-perience, as users expect the most useful ads to rank highand be placed in a prominent position on the page. Pric-ing impacts the advertisers’ return on their investment andrevenue for the search engine. The objective of this paperis to present a framework for the personalization of clickmodels in sponsored search. We develop user-specific anddemographic-based features that reflect the click behaviorof individuals and groups. The features are based on obser-vations of search and click behaviors of a large number ofusers of a commercial search engine. We add these featuresto a baseline non-personalized click model and perform ex-periments on offline test sets derived from user logs as wellas on live traffic. Our results demonstrate that the per-sonalized models significantly improve the accuracy of clickprediction.
Categories and Subject DescriptorsH.3.5 [Online Information Services]: Commercial Ser-vices; H.4.m [Information Systems]: Miscellaneous; I.5.2[Design Methodology]: Classifier Design and Evaluation
General TermsAlgorithms, Measurement, Design, Experimentation, Hu-man Factors
KeywordsSponsored Search, Click Prediction, Personalization, UserProfile, Demographic, Click Feedback, Maximum EntropyModeling
Permission to make digital or hard copies of all or part of this work forpersonal or classroom use is granted without fee provided that copies arenot made or distributed for profit or commercial advantage and that copiesbear this notice and the full citation on the first page. To copy otherwise, torepublish, to post on servers or to redistribute to lists, requires prior specificpermission and/or a fee.WSDM’10, February 4–6, 2010, New York City, New York, USA.Copyright 2010 ACM 978-1-60558-889-6/10/02 ...$10.00.
1. INTRODUCTIONSponsored search is an Internet advertising system that
generates most of the revenue of search engines by presentingtargeted advertisements along with the search results. Inthe common “pay-per-click” model, advertisers are chargedfor each click on their ads. To maximize the revenue for asearch engine and maintain a desirable user experience, thesponsored search system needs to make decisions related toselection, ranking and placement of the ads. These decisionsare based greatly on the probabilities that users will click onads, and therefore accurate click prediction is an essentialproblem in sponsored search.
Current state-of-the-art sponsored search systems typi-cally rely on a machine learned model to predict the clicka-bility of ads returned for a user search query. For the experi-ments in this paper, we will use a system based on numeroususer-independent features as a baseline. Some of these fea-tures are based on the similarity of the query to the text ofthe ads and range in complexity from simple word or phraseoverlap to more sophisticated semantic similarities betweenthe query and different elements of the ads. Other featuresare related to the historical performance of ads. In our expe-rience, certain statistics of the past performance of ads aregood predictors of the click probability. Yet another groupof features gives contextual information, such as the time ofday or day of the week. All of these features ignore the usersboth individually and as parts of groups with similar behav-iors and therefore the model will predict the same probabil-ity of click for every user. We believe that personalizing theclick prediction benefits both the users and the advertisers:The users will be presented ads in the manner that is mostrelevant to them, and the advertisers will receive clicks fromusers who are more engaged with the ads.
The objective of this paper is to present the design of per-sonalized click prediction models. An essential part of thesemodels is the development of new user-related features. Webase our features on observations over a significant volumeof search queries from a large number of users. Our obser-vations suggest that user click behavior varies significantlywith regard to their demographic background, such as ageor gender. We investigate the click distribution for differ-ent users from various backgrounds and design a set of de-mographic features to model their group clicking patterns.Recognizing that there is still significant variability in de-mographic groups, we also investigate user-specific features.The new user-related features are integrated with other fea-tures in a maximum entropy classification framework andcontribute to the final predicted clickability score for each
351

Figure 1: Overview of sponsored search system.
query-ad-user tuple. We tested the personalized models of-fline on a large test set based on log data of the Yahoo!search engine. The results show that the personalized mod-els are significantly more accurate than the non-personalizedbaseline. In addition, we report results of a test on live trafficof a personalized model that confirm the offline evaluations.
The rest of this paper is organized as follows. Section 2briefly outlines one approach to click prediction in sponsoredsearch. Next, we present a study on user click distributionin Section 3. The personalized click prediction framework isproposed in Section 4. The user related features developedin our work are introduced in Section 5. The experimentalsetup and results are presented in Section 6. We discusssome related work in Section 7 and conclude the paper witha summary of our findings and proposals for future work inSection 8.
2. CLICK PREDICTIONSponsored search is a complex advertising system that
presents ads to users of search engines. It involves severalprocesses as illustrated in Figure 1. The input query fromthe user is used to retrieve a list of candidate ads. Theexact mechanisms of query parsing, query expansion, andad retrieval used in our system are beyond the scope of thispaper. For our purposes we assume that we receive a set ofcandidate ads that need to be scored by the click model toestimate the probability they will be clicked. This estimateis an essential component of the sponsored search systemas it influences user experience and revenue for the searchengine: The click probability is a factor to rank the ads inappropriate order, filter out uninteresting ads, place the adsin different sections of the page, and to determine the pricethat will be charged to the advertiser if a click occurs.
We formulate click prediction as a supervised learningproblem. We collected click and non-click events from logs astraining samples, where each sample represents a query-adpair presented to a user. Assume there is a set of n train-ing samples, D = {(f(qj , aj), cj)}n
j=1, where f(qj , aj) ∈ �d
represents the d-dimensional feature space for query-ad pairj and cj ∈ {−1, +1} is the corresponding class label (+1 :click or −1 : non-click). Given a query q and ad a, the
problem is to calculate the probability of click p(c|q, a). Themaximum entropy model (ME) [4] is well suited for thistask because of its strength in combining diverse forms ofcontextual information, and formulates the click probabilityfor a query-ad pair as follows:
p(c|q, a) =1
1 + exp(∑d
i=1 wifi(q, a))(1)
where fi(q, a) is the i-th feature derived for query-ad pair(q, a) and wi ∈ w is the associated weight. Given the train-ing set D, the maximum entropy model learns the weightvector w by maximizing the likelihood of exponential mod-els as:
w = max(n∑
i=1
log(p(ci|qi, ai)) + log(p(w))) (2)
where the first part represents the likelihood function andthe second part utilizes a Gaussian prior on the weight vec-tor w to smooth the maximum entropy model [7]. There aremany approaches available in the literature [15] to solve thiskind of optimization problems including iterative scaling andits variants, quasi-Newton algorithms, and conjugate gradi-ent ascent. Given the large collection of samples and highdimensional feature space, we use a nonlinear conjugate gra-dient algorithm [16].
2.1 FeaturesAn accurate maximum entropy model relies greatly on the
design of features f. There are many possible features thatcan be derived for the purpose of predicting click probabil-ities. One class of features explores the lexical similaritybetween the query and ads by calculating word or phraseoverlap of the query to different elements of the ads. Thesefeatures rely on a simple assumption that users tend to clickon ads that appear to be relevant to their query and thatquery-ad overlap is correlated with perceived relevance. Wehave found some usefulness in these features, but it is clearthat the discrimination power of lexical features is limiteddue to the typically short queries and simple ads.
Another set of features is derived from the historical per-formance of ads. In our experience, these features are goodestimators of the future performance of ads. It is well known [9]that the click-through rate (CTR) of search results or adver-tisements decreases significantly depending on the positionof the results. To account for this position bias, we use aposition-normalized statistic known as clicks over expectedclicks (COEC):
COEC =
∑Rr=1 cr∑R
r=1 ir ∗ CTRr
, (3)
where the numerator is the total number of clicks receivedby a query-ad pair; the denominator can be interpreted asthe expected clicks (ECs) that an average ad would receiveafter being impressed ir times at rank r, and CTRr is theaverage CTR for each position in the result page (up to R),computed over all queries and ads.
We can obtain COEC statistics for specific query-ad pairs,and we have found these features to be good predictors ofclick probabilities. However, many impressions are neededfor these statistics to be reliable and therefore data for spe-cific query-ad pairs can be sparse and noisy. To amelio-rate this problem, we can obtain additional COEC statistics
352

by counting clicks and expected clicks over aggregations ofqueries or ads. The full details of these aggregations areoutside the scope of this paper, but briefly we note that theadvertisers organize their ads in ad groups, campaigns, andaccounts. We can exploit this organization and count clicksand expected clicks for different combinations of query-adgroups, campaigns, and accounts. Of course, other aggre-gations using query or ad clusters are possible and can beused in practice. The COECs and expected clicks computedover each of the aggregation levels are used as inputs to themaximum entropy framework.
There are other features that provide additional contextthat we have observed are helpful in predicting the clickprobabilities. For example, features such as time of day, dayof week, and the position on the page where ads have beendisplayed.
Note that all the features described so far ignore differ-ences among users. We will use the model described in thissection as a baseline for our personalized models with userinformation.
2.2 Feature Quantization, Conjunctions, andSelection
The click feedback (CF) features are expected to be skewed,and this may cause problems to many learning algorithms,including maximum entropy. In our work, the features aretransformed into the log form and then quantized using asimple K-means [5] clustering algorithm with objective func-tion:
arg mink∑
j=1
∑
vi∈Cj
||vi − uj ||2 (4)
where vi is the feature value after log transform, uj is thecentroid of cluster Cj and k is the number of clusters. Eachcluster of feature values represents a quantized segment. Weintroduce binary indicator features for each segment, anduse these binary features as inputs to the ME model. Wealso introduce a binary indicator feature to indicate that acertain value is missing, which is common for click feedbackfeatures (for new ads or new queries, for example).
To model relationships among features, we create featureconjunctions by taking the cross product of the binary in-dicators for pairs of features. We select the features to beconjoined using domain knowledge. For example, we haveconjunctions between COECs and expected clicks for eachof the levels over which we aggregate click feedback statis-tics. If the COECs and ECs are quantized into ten segmentseach, we will add 100 new binary features corresponding toall the possible combinations of the segments.
The feature set will grow exponentially after quantizationand adding conjunctions. To limit the growth, we eliminatebinary features and conjunctions that appear less than 10thousand times in the training data. After quantization,conjunction and selection, the features are used as inputs tothe maximum entropy click model.
3. USER CLICK ANALYSISAs a first step towards our goal for personalized click mod-
els, we conduct a preliminary analysis of the log data tounveil some patterns of user behavior in sponsored search.
0 5 10 15 20 250
0.1
0.2
0.3
0.4
0.5
0.6
0.7
0.8
0.9
Views Per <User, Ad>
Per
cent
age
of <
Use
r,A
d> P
airs
0 5 10 15 20Views Per <User, Ad>
Ave
rage
CT
R
Figure 2: The upper graph shows the distribution ofuser-ad views. The bottom graph shows that CTRof user-ad pairs is inversely proportional to the num-ber of views.
3.1 User-Ad View and Click DistributionsFor the initial part of the analysis, we consider one day
of data (2008/08/01) sampled from the logs of the Yahoo!search engine. Our initial objective is to examine the dis-tribution of user-ad views and clicks. The upper graph ofFigure 2 shows that the distribution of user-ad views followsa power law distribution. In the figure, the X-axis repre-sents the number of daily observations for each user-ad pairand the Y -axis represents the percentage of unique user-adpairs. The data show that approximately 85% of user-adpairs are observed only once and 10% are observed twice,which means that only 5% of the user-ad pairs are observedmore than twice. The bottom graph of Figure 2 plots theaverage CTR for each group of user-ad pairs with the samenumber of views (note the sudden jump at x = 16 may bedue to limited data size). The average CTR is clearly de-creasing linearly when the views are increasing. This trendmotivates one of the features that we describe in Section 5,in which we compare the past click behavior of each user toa group of users with similar searching patterns.
3.2 View, Click and Bid Distributions per UserDemographics
In marketing, consumers are segmented into groups withsimilar needs or shopping behaviors. This segmentation can
353

occur along different dimensions, such as behavioral, demo-graphic or geographic variables. In the work reported here,we segment users into demographic groups using data dis-closed by them as part of the registration process to obtainan account with Yahoo!. These demographic data are notavailable for all users of the search engine and are not guar-anteed to be accurate.
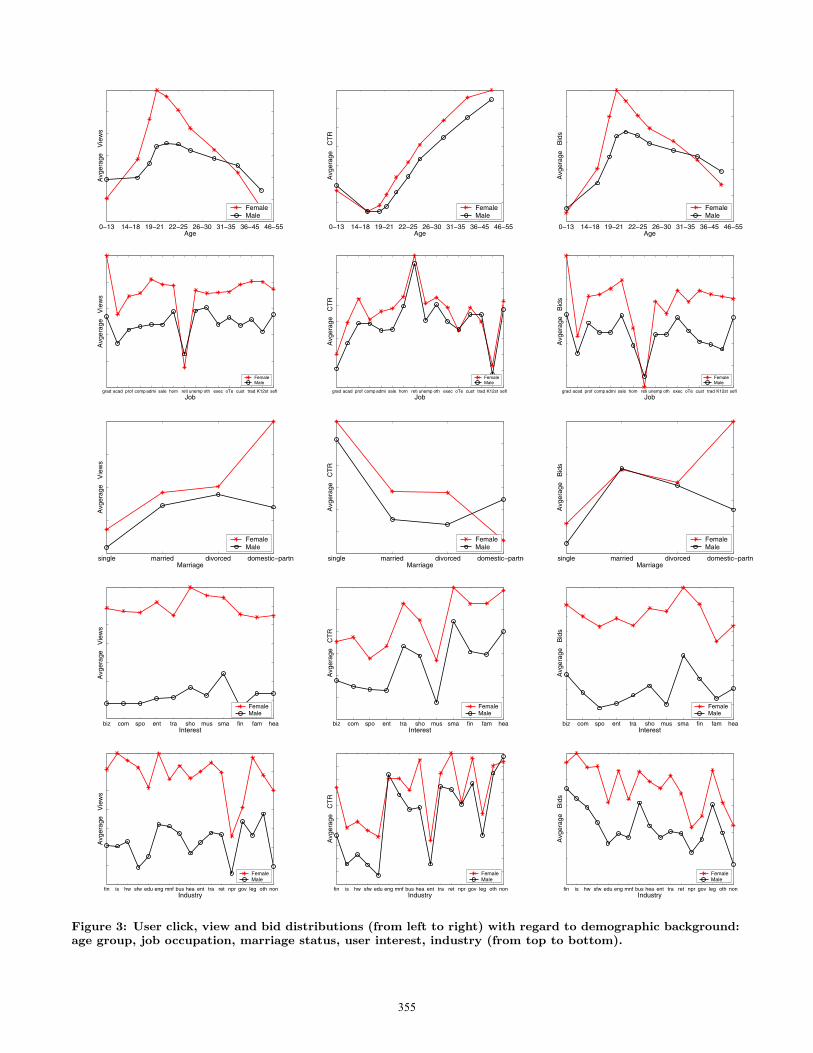
For this part of the study, we use the entire training datathat will be described in detail in Section 6, but it is sufficientto say for now that these data span two months of activityof more than 400 million unique users. We partition userswith demographic information into groups according to theirage, job, marriage status, interests and their occupation asshown from the top to the bottom panels in Figure 3. TheX-axes of the graphs in Figure 3 represent the demographicgroups. For example, age is partitioned into 8 segments andthere are four possible values for marriage status. The Y -axes show the number of views, average CTR, and averagebids for each demographic category. We omit the scalesto protect proprietary information. The average bids in theright panel indicate how the ads shown to different segmentsof users differ in terms of the bid advertisers make and aresuggestive of query differences among the groups.
Here we list a few of our observations from Figure 3:
• From all the graphs, we can clearly see that femaleusers always view and click more ads than males andthat those ads have higher bids, except a few rare andnoisy cases like in age group 0–13.
• Click-through rates have a very strong positive corre-lation with age.
• Users who are single are more likely to click than mar-ried and divorced users.
• Users with travel, shopping and business interests aremore likely to click ads, whose bids seem to be highertoo. Users with music, sport entertainment interestsare less likely to click ads.
• Users whose occupations are in financial, engineering,and travel industries are more likely to click than thosein entertainment and education industries.
These data show strong correlations between the users’ de-mographic background and their searching and clicking be-haviors, which could used to improve the accuracy of clickprediction.
4. PERSONALIZED CLICK PREDICTIONThe baseline prediction model described in Section 2 esti-
mates the click probabilities using user-independent featuresand therefore will produce the same estimates for every user.In this section, we propose a family of models that incorpo-rate user information.
Our vision of personalized models is a direct extension ofthe maximum entropy model introduced in Section 2. LetD = {(f(qj , aj , uj), cj)}n
j=1 represent the new training setwhere each sample j represents a click or non-click eventwhen ad aj is presented to user uj for query qj . Insteadof assigning a click probability for each new query-ad pairas shown in Equation 1, we develop a new click predictionfunction p(c|q, a, u) for each query-ad-user tuple as:
p(c|q, a, u) =1
1 + exp(∑d
i=1 wifi(q, a, u))(5)
where fi(q, a, u) is a feature derived from the query (q), ad(a) or user (u) or a combination thereof, and wi is the weightassociated with each feature. Similarly, the weight vectorw is learned by maximizing the likelihood of exponentialmodels with Gaussian prior as:
w = max(n∑
i=1
log(p(ci|qi, ai, ui)) + log(p(w))). (6)
Again, the nonlinear conjugate gradient method is used tosolve this optimization problem.
In the personalized click model, user information is inte-grated into the ME model directly as features and combinedwith features derived from the query and the ads. The learn-ing algorithm will automatically tune the weights as before.The next section describes the user-related features we use.
5. USER FEATURESWe consider two sets of user-related features. The first
set is composed of demographic group features, which cap-ture the behaviors of group of users segmented according totheir demographic background. The second set of featuresis composed of features associated with each particular user.
For both sets of features, we accumulate historical infor-mation over multiple days in the past. We remove the userswith fewer than two ad views during a day. We found thatthis was a convenient way to smooth the data. Then, foreach item, we consider a time window that is long enoughto accumulate 500 ad impressions or reach a maximum of 90days. This variable length window is a good compromise be-tween accumulating enough data to compute reliable statis-tics for items with low daily activity and capturing temporalchanges in behavior for items with high activities.
5.1 Demographic FeaturesIn our work, we partition users into demographic segments
based on age, gender, marriage status, interests, job status,and occupation. To incorporate this information into themaximum entropy framework, we introduce binary featuresfor each possible value of the demographic variables. Forexample, there are eight binary features indicating each ofthe possible age groups, and only one of these eight featurestriggers for each user.
Besides using the demographic information as direct in-puts to the click model, we develop click feedback featuresto capture the historical behavior of user groups. We cansegment the users based on one or multiple of the demo-graphic variables available to us. Specifically, in our exper-iments we take the cross product of these gender and agegroups to partition the users, resulting in 16 groups com-posed of users with the same gender and of the same agegroup. Once the demographic groups are formed, we envi-sion numerous combinations with other factors for which wealready compute click feedback features. For example, wealready accumulate historical information for all the ads ofspecific advertiser accounts and, along those lines, we canconceive of accumulating data for combinations of accountsand demographic groups. Such a combination would cap-ture the relative preference of different demographic groupsto specific brands or merchants. Table 1 lists some of thecombinations we conceive as being useful in click prediction.
As for specific features, our experiments use the COECand expected click features described earlier, but we can
354
0−13 14−18 19−21 22−25 26−30 31−35 36−45 46−55Age
Avg
erag
e V
iew
s
FemaleMale
0−13 14−18 19−21 22−25 26−30 31−35 36−45 46−55Age
Avg
erag
e C
TR
FemaleMale
0−13 14−18 19−21 22−25 26−30 31−35 36−45 46−55Age
Avg
erag
e B
ids
FemaleMale
grad acad prof comp admi sale hom reti unemp oth exec oTe cust trad K12st sefl
Job
Avg
erag
e V
iew
s
FemaleMale
grad acad prof comp admi sale hom reti unemp oth exec oTe cust trad K12st sefl
Job
Avg
erag
e C
TR
FemaleMale
grad acad prof comp admi sale hom reti unemp oth exec oTe cust trad K12st sefl
Job
Avg
erag
e B
ids
FemaleMale
single married divorced domestic−partneMarriage
Avg
erag
e V
iew
s
FemaleMale
single married divorced domestic−partneMarriage
Avg
erag
e C
TR
FemaleMale
single married divorced domestic−partneMarriage
Avg
erag
e B
ids
FemaleMale
biz com spo ent tra sho mus sma fin fam heaInterest
Avg
erag
e V
iew
s
FemaleMale
biz com spo ent tra sho mus sma fin fam heaInterest
Avg
erag
e C
TR
FemaleMale
biz com spo ent tra sho mus sma fin fam heaInterest
Avg
erag
e B
ids
FemaleMale
fin is hw sfw edu eng mnf bus hea ent tra ret npr gov leg oth nonIndustry
Avg
erag
e V
iew
s
FemaleMale
fin is hw sfw edu eng mnf bus hea ent tra ret npr gov leg oth nonIndustry
Avg
erag
e C
TR
FemaleMale
fin is hw sfw edu eng mnf bus hea ent tra ret npr gov leg oth nonIndustry
Avg
erag
e B
ids
FemaleMale
Figure 3: User click, view and bid distributions (from left to right) with regard to demographic background:age group, job occupation, marriage status, user interest, industry (from top to bottom).
355

Table 1: Examples of User Demographic Features. The items in italic case denote data used in the experimentsreported in this paper. “Demo” stands for any partitioning of the users based on demographic variables.
Feature class Feature examplesdemographic profile gender, age group, marriage status, interests, job, occupationdemo CF demodemo-ad CF demo-domain, demo-account, demo-ad group, demo-campaign, demo-
creative, demo-term, demo-phrase (in title, description, etc.)demo-query CF demo-query, demo-phrase(in query)demo-location CF demo-most-specific-location-available, demo-zip, demo-state
envision numerous other features such as the total number ofad views (NV), total number of ad clicks (NCLI), and totalnumber of unique queries (NQ). We hypothesize that addingdemographic features to the click model will improve theaccuracy of click prediction and finally improve the ranking,filtering and placing ads in sponsored search. For example,20-year old female users that click frequently on ads of acertain retailer will be presented with more of these ads andin more prominent positions than the average user.
5.2 User-Specific FeaturesUser-specific features capture individual user’s interac-
tions with the ads shown in the search result page. Thisis attractive as there could be significant variability betweenmembers of demographic groups. However, deriving userspecific features from log data is challenging for several rea-sons. First, user-specific data are very noisy because of theintrinsic randomness in users’ actions. For example, a usermay click an ad accidentally. Second, the user specific dataare very sparse since a large portion of the search users maynot click on any ads in a given time period.
A simple user-specific feature could be the user CTR mea-sured over all queries and all ads. However, it is probably notfair to compare the CTR of users seeing more ads (e.g., com-mercial queries) to the CTR of users seeing fewer ads (e.g.,academic queries). To ameliorate this bias, we design a newfeature called user activity normalized COEC (UCOEC).This feature is inspired by the observations in Section 3.1,where we observed that the average CTR decreases as thenumber of views of user-ad pairs increased. To compute theUCOEC feature, users are grouped together based on thetotal number of ads they have seen. The average CTR iscalculated for each user group. Then each user’s CTR isnormalized by dividing it by the group average CTR. Thecalculation of UCOEC is denoted as:
UCOECu =CTR of user u
Average CTR of u’s group(7)
The intuition behind UCOEC is to indicate a user’s clickactivity compared to users with similar searching behavior.
We can also derive other user-specific click feedback fea-tures at the user, user-query, and user-ad levels. These fea-tures would be similar to the demographic features describedin the previous section, but using individual users instead ofaggregating historical information over groups of users. Spe-cific features such as EC, COEC, NV, NCLI, and UCOECcan be derived over the different user-specific levels of ag-gregations. A list of user-specific click feedback features aredescribed in Table 2.
The user-level click feedback features measure the propen-sity of individual users to click on ads in general. User-queryclick feedback features are a bit more specialized and capture
the propensity of users to click on certain queries or groupsof queries. Finally user-ad features capture the user pref-erences on certain ads or advertisers (represented by theirdomain or account).
6. EXPERIMENTSThis section first describes the models and data sets used
in the evaluations. Next, we present offline and online evalu-ations of the accuracy of the personalized models comparedto a non-personalized baseline model.
6.1 Experimental MethodsWe are interested in comparing models with different sets
of features to investigate their relative usefulness in clickprediction. Our evaluation methodology is two-fold: firstwe compare the different models using a test set, and thenwe evaluate the most promising models on live user traf-fic. In both cases, the query-ad pairs are ordered by thepredicted clickability score and traditional methods such asprecision-recall (P-R) curves as well as area under curvemetric (AUC) are used to measure the accuracy of the mod-els. Here precision is defined as the number of query ad pairsclicked on by users divided by the total number of query adpairs labeled as click by the model, and recall is defined asthe number of query ad pairs labeled as click by the modeldivided by the total number of actually clicked query adpairs.
We evaluated six personalized models with different com-binations of features against one non-personalized baselinemodel. All the models used the same lexical and contextualfeatures and a basic set of user-independent click feedbackfeatures. The variations in feature sets were related to user-dependent features. Specifically, we tested models with thefollowing combinations of user-dependent features:
1. user COEC and ECs
2. user and user-account COEC and ECs
3. user and user-query COEC and ECs
4. user, user-account, and user-query COEC and ECs
5. user, user-account COEC and ECs, and demographicfeatures
6. demographic features
The demographic features above refer to the categorical de-mographic features as well as click feedback COECs andECs aggregated over (gender-age group-query), (gender-agegroup-ad group) and (gender-age group-location).
The training and testing data used in our experimentswere sampled from the Yahoo! sponsored search traffic logs
356

Table 2: Examples of User-Specific Features. The items in italic case denote data used in the experimentsreported in this paper. “Demo” stands for any partitioning of the users based on demographic variables.
Feature class Feature examplesuser level CF useruser-query CF user-query, user-phrase(in query)user-ad CF user-domain, user-account, user-ad group, user-campaign, user-
creative, user-term, user-phrase (in title, description, landing page etc.)
for a period of 2 months. Each sample of the data is a query-ad view event labeled as click or non-click by a user of theYahoo! search engine. In the data there are approximately467 million unique users, 100 million unique queries and20 million unique ads. Each user is identified by a uniquebrowser cookie in the Yahoo! network. We split the data tocreate training and testing sets that are disjoint with regardto both time and users. Specifically, samples of the first51 days and associated with 3/4 of randomly selected userswere used as training data, while samples associated withthe remaining 1/4 of users and occurring in the last 11 dayswere used as testing data. There were approximately 2.44billion samples in the training data.
To better illustrate the results, we divide the test datainto two disjoint sets based on the matching technologyused to retrieve the ads. In all major commercial sponsoredsearch systems, candidate ads are retrieved either by directlymatching the (possibly normalized) query to the keywordsbidded by the advertiser or by some “broad” match tech-nologies that seek to improve recall, such as query expan-sion. Yahoo! calls the former matches “exact” and the latter“advanced.”
For each click-view event, we constructed a vector of fea-tures to be used in the click models. The lexical and con-textual features were extracted in an ad-hoc fashion. Theclick feedback features were calculated by processing logdata starting three months prior to the beginning of theperiod in which the training set was collected. As explainedbefore, when computing the user-related click feedback fea-tures we eliminated events by users viewing no more than 2ads during a day. All features were quantized and we appliedfeature selection using the methods described in Section 2.2.
6.2 Offline Performance ComparisonsWe tested the first four personalized models with user-
specific features using the offline test data sets describedabove. The results on the exact and advanced slices arereported with P-R curves plotted in Figure 4 and the corre-sponding AUCs are recorded in Table 3. In terms of AUC,adding only the user-specific click feedback feature improvedover the baseline by 11.41% in the testing data with exact-matched ads and 7.41% in the testing data with advanced-matched ads. Adding the user-account and user-query clickfeedback features shows additional significant performanceimprovements: AUC increased by 16.51% with user anduser-account click feedback features and 17.46% with userand user-query features in the exact-matched slice. Themodel with all the three sets of user related features per-forms the best with an 18.59% AUC increase in the exact-match slice and 12.30% increase in advanced-match. Theseresults suggest that the user-specific click feedback featuresare very helpful in generating more accurate prediction scorein sponsored search click modeling.
0
0.1
0.2
0.3
0.4
0.5
0.6
0.7
0.8
0.9
1
0 0.1 0.2 0.3 0.4 0.5 0.6 0.7 0.8 0.9 1
Pre
cisi
on
Recall
Personalized Models - Baseline
baselinepersonalized model with user CF feature
personalized model with user, user-account CF featurespersonalized model with user, user-query CF features
personalized model with user, user-account, user-query CF features
Figure 4: Offline performance of personalized mod-els using user specific features on two slices of testingdata: exact-match and advanced match.
Next, we investigate the performance of personalized mod-els with demographic features. In addition to the compari-son to the non-personalized baseline, it is interesting to seehow the demographic features perform on top of user-specificclick feedback features. Three models are compared in ad-dition to the baseline: with demographic features; with de-mographic, user, and user-account; and with user and user-account features (these are the personalized models 4, 5, and6). The P-R curves and corresponding AUC are reported inFigure 5 and Table 4. Adding the demographic features tothe baseline resulted in a very small increase of 0.15% inthe AUC on the exact-matched test data. The improvementbecame even less significant when the demographic featureswere added to the user-specific features. This is probablybecause the user’s background information has already beencaptured by the user-specific click feedback features. How-ever, the user specific data are very sparse, so we inves-
357

0
0.2
0.4
0.6
0.8
1
0 0.2 0.4 0.6 0.8 1
Pre
cisi
on
Recall
Personalized Models - Baseline
baselinepersonalized model with user, user-ad CF features and demo features
personalized model with demo featurespersonalized model with user, user-ad CF features
0
0.2
0.4
0.6
0.8
1
0 0.2 0.4 0.6 0.8 1
Pre
cisi
on
Recall
Personalized Models - Baseline
baselinepersonalized model with user, user-ad CF features and demo features
personalized model with demo featurespersonalized model with user, user-ad CF features
Figure 5: Offline performance of personalized mod-els using demographic features on two slices of test-ing data: exact-match and data with demographicfeatures, but no user-specific feedback (6%).
tigated whether the demographic features are useful whenthe user-specific features are not available. As shown in thesecond panel of Figure 5 and second column of Table 4, weobtained more improvement by using demographic featureswhen user click information is not present, which accountsfor approximately 6% of the testing data.
6.3 Online Performance ComparisonSince the personalized model with user-specific features
shows significant improvement over the baseline, it is fur-ther tested using real time traffic. Although the model withuser, user-ad and user-query features seems to work best asshown in Table 3 and Figure 4, the user-query click featuretable was too large to fit into the memory available in the
Table 3: AUC of personalized models using user-specific features.model exact advancedbaseline 0.35778 0.15043user 0.39870 (+11.44%) 0.16157 (+7.41%)user,ad 0.41686 (+16.51%) 0.16605 (+10.38%)user,query 0.42025 (+17.46%) 0.16618 (+10.47%)user,query, ad 0.42428 (+18.59%) 0.16894 (+12.30%)
Table 4: AUC of personalized models using demo-graphic features.model exact demo, but no userbaseline 0.35778 0.28735demo 0.35832 (+0.15%) 0.28840 (+0.37%)user,ad 0.41686 (+16.51%) 0.30462 (+6.01%)(user,ad),demo 0.41704 (+16.56%) 0.30512 (+6.18%)
0
0.1
0.2
0.3
0.4
0.5
0.6
0.7
0.8
0.9
1
0 0.1 0.2 0.3 0.4 0.5 0.6 0.7 0.8 0.9 1
Pre
cisi
on
Recall
User Specific Personalized Models - Baseline
non-personalized modelpersonalized model with user specific features
Figure 6: Online performance of the personalizedmodel.
serving system because of the large number of user-querypairs. Thus, for online testing we selected the model withuser and user-ad features.
We ran the personalized model and the non-personalizedbaseline for several weeks using a sufficient portion of Yahoo!search traffic and plot the P-R curve for all the logged sam-ples during one of the days in Figure 6, where the baselinehas the exact same settings except the lack of user relatedfeatures. Comparing Figure 4 with Figure 6, it is obviousthat the online performance is consistent with offline resultswith significant performance boosting in personalized modelover the non-personalized baseline model.
7. RELATED WORKSponsored search has received significant attention from
both industry and academic research in the last decade [13][11].To target search engine users with the most interesting ads,sponsored search needs to solve several important problems,such as query to ad matching [1], click prediction for ranking,filtering and placement of candidate ads [12], and pricing ofthe final presented ads [10].
As a core component in sponsored search system, clickprediction uses a machine learning model such as maximumentropy [4] using various features extracted from multiplesources like user, query and ad. Certain lexical (or syntac-tic) features model the relevance between query and ad bytreating the ad’s text as a short document and building alanguage model as in classic information retrieval [14][13].Besides text features, click feedback features based on ag-gregating historical click data [8] have been shown to bevery effective in predicting the clickability of ads [6]. Fur-thermore, previous research shows that factors such as theposition in which ads are displayed on the page affect theclicks the ads receive [9].
358

These previous works consider information from queriesand ads, but do not capture the user behavior completely.Although there has been work in web search area to incorpo-rate user behavior information directly to improve the websearch ranking [2], there is limited research on integratinguser information to improve ads ranking in sponsored search.The only work we found is the recent study on post-resultuser behavior in sponsored search [3], however, its goal isto predict the user’s action after clicking the ads instead ofimproving the click prediction.
8. CONCLUSIONS AND FUTURE WORKIn this paper we proposed a personalized click modeling
framework to improve the accuracy of click prediction insponsored search. Specifically, we derive user-specific clickfeedback features and demographic features from logged userdata. We evaluated the personalized models offline on alarge scale data set based on logs from the Yahoo! searchengine. We observed significant improvements when user-specific click feedback features were added to a baseline clickmodel without user features. We also saw notable improve-ments for the personalized model with demographic featurescompared to the baseline. Another interesting point is thatadding demographic features to the model that already in-cluded user-specific features helped improve accuracy, espe-cially for users without enough user-specific click feedback.We further tested one personalized model with user-specificfeatures by running it on live traffic and the performanceboost was consistent with the offline evaluations.
There are several promising directions for future research.One of these directions is to extend the personalized featureset. In the paper we presented numerous features that havenot been completely evaluated yet, and many more featurescan be developed. Another direction for future researchis to take into account session-based information. Eventssuch as query reformulations, dwell time on landing pagesafter clicking on links, and the sequence of clicks have ad-ditional information that can be aggregated and exploitedin personalized click models. Another area of research isto group users in different ways. We have seen that usingself-disclosed demographic information has some value, butautomatic clustering of users based on their behavior cangive rise to smoothed personalized statistics that may proveuseful in click prediction.
AcknowledgmentsWe thank our colleagues Eren Manavoglu, Divy Kothiwal,Ozgur Cetin, Anand Murugappan, Kannan Achan and VadimVon Brzeski for their assistance with data collection andmodel evaluation.
9. REFERENCES[1] V. Abhishek and K. Hosanagar. Keyword generation
for search engine advertising using semantic similaritybetween terms. In Proceedings of the ninthinternational conference on Electronic commerce,pages 89–94, New York, NY, USA, 2007. ACM.
[2] E. Agichtein, E. Brill, and S. Dumais. Improving websearch ranking by incorporating user behaviorinformation. In Proceedings of the 29th annualinternational ACM SIGIR conference on Research and
development in information retrieval, pages 19–26,New York, NY, USA, 2006. ACM.
[3] J. Attenberg, S. Pandey, and T. Suel. Modeling andpredicting user behavior in sponsored search. InProceedings of the 15th ACM SIGKDD internationalconference on Knowledge discovery and data mining,pages 1067–1076, New York, NY, USA, 2009. ACM.
[4] A. L. Berger and V. J. D. Pietra. A maximum entropyapproach to natural language processing.Computational Linguistics, 22:39–71, 1996.
[5] D. Chakrabarti, D. Agarwal, and V. Josifovski. Somemethods for classification and analysis of multivariateobservations. In Proceedings of 5th BerkeleySymposium on Mathematical Statistics andProbability, pages 281–297, Berkeley, CA, 1967.University of California Press.
[6] D. Chakrabarti, D. Agarwal, and V. Josifovski.Contextual advertising by combining relevance withclick feedback. In Proceeding of the 17th internationalconference on World Wide Web, pages 417–426, NewYork, NY, USA, 2008. ACM.
[7] S. F. Chen and R. Rosenfeld. A gaussian prior forsmoothing maximum entropy models. Technicalreport, Carnegie Mellon University, 1999.
[8] M. Ciaramita, V. Murdock, and V. Plachouras. Onlinelearning from click data for sponsored search. InProceeding of the 17th international conference onWorld Wide Web, pages 227–236, New York, NY,USA, 2008. ACM.
[9] N. Craswell, O. Zoeter, M. Taylor, and B. Ramsey. Anexperimental comparison of click position-bias models.In Proceedings of the international conference on Websearch and web data mining, pages 87–94, New York,NY, USA, 2008. ACM.
[10] B. Edelman, M. Ostrovsky, and M. Schwarz. Internetadvertising and the generalized second-price auction:Selling billions of dollars worth of keywords. TheAmerican Economic Review, 97(1):242–259, March2007.
[11] D. C. Fain and J. O. Pedersen. Sponsored search: abrief history. In Proceedings of 2nd Workshop onSponsored Search Auctions, 2006.
[12] Google. How are ads ranked?http://www.google.com/support/grants/bin/
answer.py?hl=en&answer=98917.
[13] B. J. Jansen and T. Mullen. Sponsored search: anoverview of the concept, history, and technology.International Journal of Electronic Business,6:114–131, 2008.
[14] C. Liu, H. Wang, S. Mcclean, J. Liu, and S. Wu.Syntactic information retrieval. In Proceedings of the2007 IEEE International Conference on GranularComputing, page 703, Washington, DC, USA, 2007.IEEE Computer Society.
[15] T. P. Minka. A comparison of numerical optimizers forlogistic regression. Technical report, Microsoft, 2003.
[16] A. Mordecai. Nonlinear Programming: Analysis andMethods. Dover Publishing, Mineola, NY, 2003.
359