Personality Characteristics and the Decision to Become …ftp.iza.org/dp5566.pdf · Personality...
64
DISCUSSION PAPER SERIES Forschungsinstitut zur Zukunft der Arbeit Institute for the Study of Labor Personality Characteristics and the Decision to Become and Stay Self-Employed IZA DP No. 5566 March 2011 Marco Caliendo Frank Fossen Alexander Kritikos
Transcript of Personality Characteristics and the Decision to Become …ftp.iza.org/dp5566.pdf · Personality...
DI
SC
US
SI
ON
P
AP
ER
S
ER
IE
S
Forschungsinstitut zur Zukunft der ArbeitInstitute for the Study of Labor
Personality Characteristics and the Decision to Become and Stay Self-Employed
IZA DP No. 5566
March 2011
Marco CaliendoFrank FossenAlexander Kritikos
Personality Characteristics and the Decision to Become and Stay
Self-Employed
Marco Caliendo IZA, IAB and DIW Berlin
Frank Fossen DIW Berlin and IZA
Alexander Kritikos
DIW Berlin, University of Potsdam, IAB and IZA
Discussion Paper No. 5566 March 2011
IZA
P.O. Box 7240 53072 Bonn
Germany
Phone: +49-228-3894-0 Fax: +49-228-3894-180
E-mail: [email protected]
Any opinions expressed here are those of the author(s) and not those of IZA. Research published in this series may include views on policy, but the institute itself takes no institutional policy positions. The Institute for the Study of Labor (IZA) in Bonn is a local and virtual international research center and a place of communication between science, politics and business. IZA is an independent nonprofit organization supported by Deutsche Post Foundation. The center is associated with the University of Bonn and offers a stimulating research environment through its international network, workshops and conferences, data service, project support, research visits and doctoral program. IZA engages in (i) original and internationally competitive research in all fields of labor economics, (ii) development of policy concepts, and (iii) dissemination of research results and concepts to the interested public. IZA Discussion Papers often represent preliminary work and are circulated to encourage discussion. Citation of such a paper should account for its provisional character. A revised version may be available directly from the author.
IZA Discussion Paper No. 5566 March 2011
ABSTRACT
Personality Characteristics and the Decision to Become and Stay Self-Employed*
This paper systematically investigates whether different kinds of personality characteristics influence entrepreneurial development. On the basis of a large, representative household panel survey, we examine the extent to which the Big Five traits and further personality characteristics, which are more specifically related to entrepreneurial tasks, influence entry into self-employment and survival of self-employed persons in Germany. The empirical analysis reveals that among the specific characteristics in particular “risk attitudes” and “locus of control” have strong effects on entry and survival. With respect to the Big Five approach, in particular the traits “openness to experience” and “extraversion” and to a lower extent “agreeableness” and “neuroticism” help to explain entrepreneurial development. The explanatory power of the Big Five is comparable to one of the most prominent determinants of entrepreneurship – education – and approximately three times larger than parental self-employment. JEL Classification: D81, J23, M13 Keywords: entrepreneurship, personality, Big Five, risk aversion, locus of control Corresponding author: Alexander Kritikos DIW Berlin 10108 Berlin Germany E-mail: [email protected]
* We would like to thank Silke Anger, Nataliya Barasinska, Rob Fairlie, Adam Lederer, Martin Obschonka, Simon Parker, Rainer Silbereisen, Mirjam van Praag, Utz Weitzel, the seminar participants in Jena and Nijmegen, and the participants of the IZA workshop on Entrepreneurship Research for their helpful and valuable comments.
1
1 Introduction
Both science and mass media are excited about self-employed entrepreneurs. The Economist (2009) devoted a special issue to these “global heroes”, and Lazear (2005, p. 649) claimed that “the entrepreneur is the single most important player in a modern economy”, because, as Acs and Audretsch (2003) put it, entrepreneurs engage in innovation processes and job creation. This is why – as Schumpeter emphasized in 1911 – entrepreneurs are the engine of growth and, thus, one determining factor in the creation of new wealth. At the same time, entrepreneurs are rare: in highly developed economies like the US, Sweden or Germany, only one in ten employed individuals are self-employed. Thus the entrepreneur “species” is rare but important for economic growth and performance. Scientists are left wondering, whether there are any reliable factors or variables related to the human personality that affect the probability of becoming and of succeeding as a self-employed entrepreneur. Research indicates that with respect to the first point – the probability of becoming an entrepreneur – genetic factors have some explanatory power (Nicolaou, Shane, Cherkas, Hunkin, and Spector, 2008). Further, Shane, Nicolaou, Cherkas, and Spector (2010, p.1154) argue that it is unlikely that there is an entrepreneurship-specific gene, but rather “genes probably influence entrepreneurship through mediating mechanisms, such as personality.”
Personality variables, traditionally studied by psychologists and incorporated only more recently by economists, are a potential source to explain the development of self-employed entrepreneurs. Rauch and Frese (2007, p.1) argue that the “person should be put back into entrepreneurship research” and that entry into self-employment and success as an entrepreneur is not a random process of actions but is crucially influenced by personality. However, at every point in the literature, there is conflicting evidence. On the one hand, some empirical evidence finds that personality variables play an important role in explaining entrepreneurial processes: Zhao and Seibert (2006), for example, show that the personality structure is an important component explaining new venture creation and entrepreneurial success. However, others suggest that personality traits are unimportant: Blanchflower and Oswald (1998, p.51), analyzing the question “who becomes an entrepreneur”, find that “psychology apparently does not play a key role”. Similarly, Aldrich (1999) claims that research on personality traits has reached an apparent empirical dead end. Additionally Gartner (1985) believes that the diversity in personality traits amongst entrepreneurs is much greater than differences between entrepreneurs and non-entrepreneurs, thus making it impossible to determine the personality profile of a typical entrepreneur.
Even if it is accepted that personality variables partially explain entrepreneurial processes, there is also a debate over which set of personality variables is relevant. Zhao and Seibert (2006) advocate that general personality traits, the Big Five construct, are a fundamental approach, such that, for reasons of reliability and validity, it is better able to
2
identify the relevant relationships between traits and entrepreneurial developments than more specific personality characteristics. However, there are also those arguing that this general traits approach is not sufficiently related to entrepreneurial tasks (Dudley, Orvis, Lebiecki, and Cortina, 2006). Further, Barrick and Mount (2005, p. 367) point out that “narrow traits rely on explicit description of entrepreneurial activities that may be situated in time, place and role,” which is why specific personality characteristics are more useful in predicting entrepreneurial performance than the Big Five approach.
There is similar contradicting evidence at the level of single variables, such as risk attitudes, locus of control, and impulsivity, when analyzing entrepreneurial processes. Risk attitudes – being the most often studied personality characteristic at least in economic sciences in this context – serve as an example of how single variables are debated. Research suggests that entrepreneurs seem to be less risk averse than employed persons (Hartog, Ferrer-i-Carbonell, and Jonker, 2002) or managers (Stewart and Roth, 2001) and that the decision to become an entrepreneur is positively related with an increased willingness to take risks (Caliendo, Fossen, and Kritikos, 2009). Other researchers agree with these findings, but believe that it is not necessary to explicitly examine risk taking propensity as it is a compound personality characteristic reflected by a specific combination of scores within the Big Five personality construct (see for instance Nicholson, Soane, Fenton-O’Creevy, and Willman, 2005). In contrast, Paunonen and Ashton (2001) suggest that risk attitudes form a separate dimension of personality outside of the Big Five. Rauch and Frese (2007) find that the effect size of risk taking on entrepreneurial development is insignificant.
Thus there is conflicting evidence at different levels and hierarchies. First, at the fundamental level of whether or not personality matters, some researchers suggest that personality is unimportant while others assign it a crucial role as differences in personality characteristics may explain why some individuals become successful entrepreneurs and others do not. Then, assuming that personality matters, there is also debate whether it is best measured in terms of the Big Five construct or whether specific personality characteristics should be used in the context of entrepreneurship. Finally, there is a discussion whether certain variables, relevant for entrepreneurs, should be separately examined or are reflected by a combined specific set of the general personality traits construct.
In this paper, we systematically analyze the influence of different traits and personality characteristics on entrepreneurial development. We examine whether, and if so, which personality traits influence the entry into and exit from entrepreneurial activities and for which traits we observe differences between entrepreneurs and other persons. As we have data covering the Big Five traits and several specific personality characteristics, we can address the debate at all three dimensions. For that purpose we will differentiate throughout the rest of the paper between the broad Big Five model which represents the five core traits of human personality and which we will abbreviate as ‘traits’, and specific personality
3
characteristics which are related to entrepreneurial activities and which we will abbreviate as ‘personality characteristics’. We test to what extent traits and personality characteristics have a statistical and an economic impact on entrepreneurial development and provide information on their total explanatory power for entrepreneurship. When conducting these tests we are able to control not only for a large set of socio-demographic characteristics but also for cognitive abilities. We further make various robustness checks and we test to what extent traits and personality characteristics are stable over a certain period of time.
We show that traits and personality characteristics do play an important role. The explanatory power of the Big Five is comparable to one of the most prominent determinants of entrepreneurship – education – and three times larger than parental self-employment. Within the Big Five approach, the factors openness to experience and extraversion and to a lower extent agreeableness and neuroticism are particularly relevant. Moreover, specific personality characteristics add substantial information. In particular, the variables of ‘locus of control’ and of ‘risk attitudes’ explain how individuals handle entrepreneurial processes.
The rest of the paper is organized as follows. In Section 2 we present a heuristic describing in which way traits and personality characteristics match to entrepreneurial tasks. In Section 3 we review the existing empirical evidence on the relationship between personality and entrepreneurial processes. In Section 4, we describe the representative data which we use for our analysis. Section 5 is devoted to the econometric approach and the presentation of the results. In this Section, we also make several sensitivity tests and robustness checks. Section 6 provides a summary and concludes the analysis.
2 Personality and Entrepreneurial Processes: Some Heuristics
2.1 Entrepreneurial Activities and Their Relation to Traits
Similarly to earlier research (see e.g. Brandstätter, 1997), as self-employed entrepreneurs we define those persons who are the founders, owners and managers of a business under their own liability – mostly small firms. In these small firm success depends on the decisions made by the entrepreneur (Van Gelderen et al. 2000). These decisions are driven by their strategies and goals which are directly influenced by personality traits and other personal variables such as human capital and cognitive abilities. Thus, from personality theory it is possible to derive that the influence of personality variables on entrepreneurial success is mediated by the strategies and goals of the decision maker (see e.g. Baum and Locke, 2004). In order to identify which personality characteristics may influence entrepreneurship, we shortly discuss what kind of tasks entrepreneurs face and which of these tasks are different from those faced by employees. We also explore how business strategies mediate the relationship between personality characteristics and entrepreneurial outcomes.
4
Entrepreneurs should be able to produce a good or service. It is even better – at least for the economy – if entrepreneurial activity is backed up by an innovative idea. Thus the entrepreneur needs to be both productive and innovative. However, employees are also supposed to be productive; some are even innovative. There is ample evidence that most innovative ideas by entrepreneurs never see the market with many entrepreneurs losing money. However there are countless examples of entrepreneurs getting rich with brilliant, but not necessarily innovative, ideas.1 Being innovative or able to offer better or cheaper products than existent ones might be a necessary prerequisite, but it does not explain why some people become entrepreneurs and others do not; it does not discriminate between entrepreneurs and employees; and it does not discriminate between successful and unsuccessful entrepreneurs.
Entrepreneurs must do more: the decisions they make, at every step of the process, will determine whether their new business succeeds or fails. These steps range from the basic quality and quantity of production, determining investments in the business, its marketing strategy, understanding the competition and, ultimately, delivery of the goods or service to the end user: the client that the entrepreneur has successfully sold their product to. Thus, entrepreneurs need to do many things, or, as Lazear (2004) notes, they need to be “jacks-of-all-trades”. It is not enough to identify opportunity: the opportunity must be exploited. In this process entrepreneurs make a large number of rapid decisions under uncertainty. And once decisions are done, they need to be able to tolerate risk – the uncertain situation existing until the goods and services are actually being sold. Thus entrepreneurs need not just knowledge, expertise and professional competencies, but also need a variety of skills and abilities which are influenced by personality characteristics. Besides these internal variables2, external factors, including economic, specific sector related issues, governmental regulation, and political events, influence not just the entrepreneur’s business goals and strategies but their ultimate entrepreneurial success. According to this heuristic, all influences of traits and cognitive skills, as well as external influences on entrepreneurial success, are mediated by entrepreneurial decisions and actions (see e.g. Rauch and Frese, 2000).
Therefore, we need to select the traits and characteristics that influence entrepreneurial decision making (Tett et al., 2003). This also means that personality characteristics related to entrepreneurial tasks need to be identified in order to be able to estimate the true effects of personality on entrepreneurship. Typical examples of personality characteristics matching entrepreneurial tasks are, inter alia, need for achievement (see McClelland, 1961), locus of control (Rotter, 1966), risk taking (Kihlstrom and Laffont, 1979), need for autonomy (Brandstätter, 1997) and assertiveness (Caliendo and Kritikos, 2008). In the following
1 After all, companies like Starbucks were tremendously successful but selling coffee has not much in common with the picture most people have of an innovative entrepreneur. 2 Another strand of literature focuses on the influence of cognitive skills on entrepreneurial decisions (see e.g., Baron, 1998, 2003, or Hartog et al., 2008). In our analysis, we also control for cognitive skills.
5
Section, we conceptualize the links between traits, personality characteristics, and business start-up and entrepreneurial success. Based on previous research, we derive, for each trait and personality characteristic, expectations about its influences on the probability to start an own business, the probability to be an entrepreneur and the probability of business survival.3
2.2 The Broad Approach: The Five-Factor Model of Personality
One way of matching traits with the tasks of running a business is to use the Big Five taxonomy, as developed by Costa and McCrae (1992). As this taxonomy organizes a vast variety of personality traits into a small personality construct, it is necessary to describe how each of the five factors, named extraversion, emotional stability, agreeableness, openness to experience, and conscientiousness, relate to entrepreneurial development.
The first factor, extraversion, consists of variables that describe the extent that individuals are assertive, dominant, ambitious, energetic, and seek leadership roles (see Judge, Higgins, Thoresen, and Barrick, 1999). Moreover, extraverted individuals tend to be sociable, thus enabling them to develop social networks more easily, which may result in stronger partnerships with clients and suppliers. All parts of the factor – being assertive, seeking leadership and developing networks – are positively related to entrepreneurial development in terms of the entry decision and in terms of entrepreneurial success. This holds true for different roles, both internally when building teams and assigning responsibilities, and externally when contracts are being negotiated as well as when client and supplier networks have to be developed (see Costa, McCrae, and Holland, 1984). Therefore, we hypothesize that the higher individuals score on extraversion, the higher the probability that they will (i) become an entrepreneur, (ii) be an entrepreneur, and (iii) survive as an entrepreneur.
The second factor, emotional stability, or neuroticism in its negative specification, should have similarly unambiguous effects on entrepreneurship. Emotionally stable individuals are characterized as self-confident, relaxed, and able to tolerate stress situations. They can manage performance pressure, remain optimistic and maintain relationships toward others. At the beginning of the process, individuals in entrepreneurial environments must manage stress and uncertainty while working in an unstructured environment with uncertain outcomes. Moreover, entrepreneurs usually have a financial stake in the enterprise. Being optimistic and stress resistant is helpful for bearing uncertainty. Therefore, it is possible to derive as hypothesis that the higher individuals score on emotional stability, the higher the probability that they will (i) become an entrepreneur, (ii) be an entrepreneur, and (iii) survive as an entrepreneur.
3 In this context, we should clarify that exits from entrepreneurship comprise both business failure and business closure (see also Bates, 2005).
6
The third factor is openness to experience. Among the Big Five constructs it is probably the one closest to the innovation aspect, as defined by Schumpeter (1911). On the one hand, openness to experience describes the individual’s ability for seeking new experiences and exploring novel ideas. Persons scoring high on this factor should be creative, innovative, and curious (McCrae, 1987). On the other hand, this factor also contains cognitive aspects (see Barrick and Mount, 1991). Persons scoring high on this factor should be intelligent, in particular when intelligence is related to their originality and broad-mindedness. In terms of entrepreneurial activities a high score on openness to experience should have a positive influence on entrepreneurial development. The attributes of exploring new ideas, being creative and taking novel approaches to the complete entrepreneurial process are crucial for starting a new venture, and should also influence entrepreneurial survival in a positive way. Therefore, we expect that the higher individuals score on openness to experience, the higher the probability that they will (i) become an entrepreneur, (ii) be an entrepreneur, and (iii) survive as an entrepreneur.
Conscientiousness is the fourth factor of the Big Five construct and contains two components. On the one hand, conscientious individuals are achievement oriented; on the other hand they can be described as hard workers, efficient and dutiful. Need for achievement expresses the motivation of individuals to search for new and better solutions than those given in the actual environment (see McClelland 1961). Therefore, it is expected that achievement oriented persons will become successful entrepreneurs. With respect to the other aspects of this factor, being a hard worker or being dutiful, there is less awareness in the entrepreneurship literature. There are considerations that entrepreneurs have to work harder than most employees (see Barrick and Mount, 1991) while, with respect to dutifulness, it is expected to be negatively linked to entrepreneurial development (see Rauch and Frese, 2007). This is a personality characteristic relating more to employees. Therefore, there are two contradictory effects within the construct of conscientiousness. If it is not possible to separate between the aspects of this factor, we expect that different scores of the factor conscientiousness do not influence entrepreneurial decisions.
Different hypotheses exist concerning the last factor, agreeableness. Persons scoring high on agreeableness are described as having a forgiving and a trusting nature, as being altruistic on the one hand and flexible on the other. Thus this factor focuses on interpersonal relationships. A high value of agreeableness suggests that the individual is cooperative, while low values indicate self-centered and hard bargaining individuals. With respect to entrepreneurship both extremes of this factor seem to have positive and negative effects on entrepreneurial development. High ends of agreeableness relate to interpersonal reactivity and should help to develop positive relationships with clients, but also with suppliers and investors which is why high scores on agreeableness could increase the probability of entrepreneurial entry (see Ciavarella, Buchholtz, Riordan, Gatewood, and Stokes, 2004). Others describe negative effects on survival if entrepreneurs show signs of high levels of
7
agreeableness as it might inhibit their willingness to make hard bargains. For example, Zhao and Seibert (2006) expect entrepreneurs to suffer more from bargaining disadvantages than managers, which is why they hypothesize that successful entrepreneurs will score lower than managers on agreeableness and why lower scores in agreeableness should increase entrepreneurial survival. Given the contradicting effects of this factor, we expect that differing scores in agreeableness do not influence the entry decision of entrepreneurs. With respect to business survival, however, we expect that the lower individuals score on agreeableness, the higher the probability that they will survive as entrepreneurs.
H1) Putting the expectations with respect to each factor together, we formulate as a first hypothesis that the higher individuals score on each of the single factors of extraversion, openness to experience, and emotional stability, the higher the probability that they will enter entrepreneurship, be in entrepreneurship, and survive as entrepreneurs. With respect to conscientiousness, we formulate in our first hypothesis that this factor should have no effect, neither on entrepreneurial entry nor exit, as long as single variables of this factor cannot be analyzed separately. For the factor agreeableness, we hypothesize that the lower individuals score on this factor the higher the probability that they will survive as entrepreneurs.
2.3 Specific Personality Characteristics in the Context of Entrepreneurship
As previously emphasized, there is a debate over which traits and personality characteristics are relevant for entrepreneurial processes. Proponents of the specific personality characteristic approach argue that it is impossible to meaningfully combine the numerous personality variables into a construct like Big Five. Some of the five factors include sub-factors with contradicting effects, which results in information for individual personality traits being lost. The example given above with respect to the conscientiousness factor illustrates to what extent the effects of sub-factors may cancel each other out. Further discussions exist: Which factor captures locus of control? Which part of the factor agreeableness affects the entry decision into entrepreneurship in which direction? Therefore, inter alia Vinchur, Schippmann, Switzer, and Roth (1998) argue that specific characteristics exactly matching the entrepreneurial personality are better predictors than broad trait taxonomies.
Accordingly, there is a list of specific personality characteristics related to the tasks of entrepreneurial activities (see inter alia Rauch and Frese, 2007). In our data set, we have information on the two most often reviewed variables among the specific personality characteristics, namely locus of control and risk attitudes.4 Locus of control (based on a concept of Rotter, 1966) measures generalized expectations about internal and external control of reinforcement. People with an internal locus of control believe that they determine their future outcomes through their own actions. Persons with an external locus of control
4 For a complete list of all traits related to entrepreneurial processes, see Rauch and Frese (2007).
8
believe that their future outcomes in terms of success and failure are determined randomly or by the external environment, but not by their own actions. As entrepreneurs must continuously make decisions related to their business outcomes, it is assumed that locus of control is a highly relevant personality characteristic for entrepreneurial development. In the present study, the variable locus of control is assessed by making use of two dimensions named ‘internal’ and ‘external locus of control’.
H2) We hypothesize that the higher (lower) individuals score on internal (external) locus of control the higher (lower) the probability that they will (i) become an entrepreneur, (ii) be an entrepreneur, and (iii) survive as an entrepreneur.
Every entrepreneurial decision includes risk taking because the outcome of each investment is unpredictable, which is why such decisions are risky. However, there is no unidirectional relationship between risk attitudes and entrepreneurial survival. While it is expected that there is a positive correlation between risk attitudes and the decision to become an entrepreneur where low risk attitudes characterize more risk averse and high risk attitudes indicate less risk averse persons (see inter alia Cramer, Hartog, Jonker, and Van Praag, 2002; Caliendo et al., 2009), the probability of entrepreneurial success is not correlated in a strictly positive way with risk attitudes. Instead, there should be an inverse U-shaped relation between risk attitudes and entrepreneurial survival as riskier investments should also lead to an increasing probability of high losses with the consequence of bankruptcy and entrepreneurial failure or closure (see Caliendo, Fossen, and Kritikos, 2010).
H3) We hypothesize that the higher individuals score on risk attitudes, the higher the probability that they (i) will become an entrepreneur and (ii) be an entrepreneur. Additionally, (iii) among all entrepreneurs those with low or high risk attitudes have a lower survival probability than persons whose risk attitudes fall within the medium range.
2.4 Variables of Social Cognition and Emotions in the Context of Entrepreneurship
There are several additional variables that have been partly analyzed in the entrepreneurial context. These are, on the one hand, variables of social cognition that play a crucial role in experimental economics, namely trust and reciprocity (see e.g. Cox, 2004). On the other hand, we focus on variables that deal with emotional aspects of entrepreneurial decisions, such as impatience and impulsivity. Unlike employees, who find themselves part of comparatively stable organizational structures, entrepreneurial activities take place amongst a variety of frequently changing relationships, where individuals make choices between all existing social action alternatives and where variables of social cognition and of emotions may play a role.
Trust, as a personality characteristic, relates to the extent that people believe that they can trust and rely on others, and to what extent they can deal with strangers. Being able to trust other people seems to be an important prerequisite for realizing exchange processes when opening a business. It begins with selecting and delegating tasks to trustworthy persons before
9
the entrepreneurial life starts (Logan, 2009) and turns into trusting other people in a network. We, therefore, suggest that people who are unable to rely on anyone will be less able to successfully start a business (see Caliendo, Fossen, and Kritikos, 2011).5 On the other hand, high levels of trust may also contain the risk of exploitation. Entrepreneurs unboundedly trusting others may face an increasing probability of losses leading with higher probability to entrepreneurial closure or failure when compared to less trustful persons. Thus, we expect that trust will particularly help to start entrepreneurial activities.
Last, but not least, we focus on two further characteristics reflecting emotional aspects: impulsivity and impatience. Both characteristics are included in the Big Five factor “emotional stability” (Costa and McCrae, 1992). Based on the analysis of the factor “emotional stability” we should expect that both variables are negatively associated with entrepreneurial entry and survival, as they are on the low end of the factor while entrepreneurs should be more successful when they score high on emotional stability. However, there is initial evidence that impulsivity might positively influence entrepreneurial decisions, in particular when “the risky business opportunity is a hot decision” where emotions influence the decision in contrast to “cold decisions” where emotions do not play any role (Sahakian, Lawrence, Clark, Labuzetta, and Vyakarnum, 2008, p. 168f). Similarly, there is differing evidence with respect to “impatience”. In an occupational choice model, Vereshchagina and Hopenhayn (2009) suggest that entrepreneurial risk taking will only occur if agents are sufficiently impatient and that these two variables are positively correlated. Applied to our approach this means that the probability of entry into entrepreneurial activities should increase the more impatient subjects are.
H4) We hypothesize that among all people the higher individuals score on trust, impatience and impulsivity the higher the probability that they will become an entrepreneur.
2.5 Broad versus Narrow Approach
Proponents of the broad approach argue against the narrow approach as they believe that any additional personality characteristics are covered by the Big Five construct as they are compound personality characteristics. With respect to these specific characteristics, i.e. risk attitudes, locus of control, trust, impatience and impulsivity, the following hypothesis can be formulated from the point of view of the proponents of the broad approach.
H5a) With respect to
- risk attitudes, it is hypothesized that it is a specific combination of all five factors of the Big Five approach, namely that persons scoring high on risk attitudes, also score
5 Caliendo et al. (2011) also focused on the variables of positive and negative reciprocity but found that these two variables have almost no influence on entrepreneurial processes.
10
high on extraversion, openness to experience, and emotional stability, and low on agreeableness and conscientiousness (see Nicholson et al., 2005);
- internal (external) locus of control, it is expected that it is positively (negatively) related to the factors emotional stability (Levenson, 1973) and conscientiousness (DeNeve and Cooper, 1998) and should be covered by them;
- trust, it is expected that it is positively correlated with agreeableness and should be covered by this factor (DeNeve and Cooper, 1998);
- impulsivity and impatience, it is expected that these characteristics are covered by the factor neuroticism, and it should be expected that impulsive and impatient persons also score low on emotional stability (Costa and McCrae, 1992).
H5b) Proponents of the Big Five approach hypothesize that no explanatory power is added when these specific characteristics are analyzed in addition to the Big Five factors.
As counter-hypothesis to H5b) we state in
H6) Explanatory power is added when personality characteristics related to entrepreneurial tasks are analyzed in addition to the Big Five factors.
Besides the question whether the Big Five factors also capture the effects of further special personality characteristics, the overview allows us to derive a corresponding hypothesis about correlations between the above mentioned traits and personality characteristics that we test separately in Section 4.3 and that provide information about the validity of the empirical measures of these traits and personality characteristics. We present all expected correlations in Table 1.
INSERT TABLE 1 ABOUT HERE
3 Previous Empirical Evidence
A growing body of evidence suggests that entrepreneurs differ from employees and managers with regard to their personality. There is a long list of single variable studies where the effect of specific personality characteristics on entrepreneurial status is studied. For instance, Begley and Boyd (1987), Evans and Leighton (1989), and later on Mueller and Thomas (2000) delivered empirical evidence that there is a positive relationship between the variable internal locus of control and entrepreneurial success. Based on these findings, van Praag, van Witteloostuijn, and van der Sluis (2009) further report that locus of control, when controlled for education, strongly influences entrepreneurial income and that entrepreneurs with high internal locus of control scores are more successful at generating income than employees. With respect to the risk attitudes variables, Caliendo et al. (2009, 2010) show that individuals who are less risk averse indeed have a higher probability of entry into entrepreneurship and entrepreneurs have higher risk attitudes than employees, while individuals with a medium
11
score in risk attitudes have a higher probability to remain entrepreneurs when compared with individuals with a low or a very high score.6
The meta-analytical review of Zhao and Seibert (2006) put together a large set of single variable studies to a five-factor model capturing the “Big Five” personality construct defined by Costa and McCrae (1988). They analyze to what extent entrepreneurs differ from managers in the Big Five personality dimensions. They find that distinctions exist for four of the five personality factors. In accord with their hypotheses, entrepreneurs score significantly higher than managers on conscientiousness, openness to experience, emotional stability and lower on agreeableness. Only the hypothesis that entrepreneurs score also higher on extraversion found no support. Interestingly, Zhao and Seibert (2006, 266) conclude that “exploring the role of narrow traits in the attainment of entrepreneurial status may be a productive avenue for future research. But to add theoretical value, the burden of proof is to demonstrate that the narrow traits explain variance beyond the Big Five approach”.7
Rauch and Frese (2007) make use of this narrow approach and also provide a meta-analytical study where they discuss to what extent entrepreneurs are different from managers and partly from “other populations” in those personality characteristics which are specifically matched to the tasks of entrepreneurship. Rauch and Frese (2007) find – not taking the Big Five approach into account – that entrepreneurs score higher than managers with respect to the characteristics of innovativeness, stress tolerance, proactive personality, need for autonomy, and – interestingly – lower with respect to locus of control. The authors explain the lower score of entrepreneurs when compared to managers with respect to locus of control by the fact that this variable might be even more important for managers. Rauch and Frese also discuss why the effect of entrepreneurial risk taking is so small. They argue that “running a business with a risky strategy may be good for quick success but also for early failure”.
These two approaches are important benchmarks in analyzing the influence of traits and personality characteristics on entrepreneurial success. However, although they observe differences between certain populations, they are not apt to answer the question of which traits and which personality characteristics lead individuals to become entrepreneurs and
6 There are many further analyses on other traits and personality characteristics. Stewart, Watson, Carland, and Carland (1998) find differences for the variables achievement motivation and innovativeness between managers and entrepreneurs, Brandstätter (1997) for emotional stability, Chen, Greene, and Crick (1998) for entrepreneurial self-efficacy, Müller and Gappisch (2005) for problem solving orientation, Caliendo and Kritikos (2008) for assertiveness. As we will not focus in this study on all personality variables related to entrepreneurial development, we do not aim to review the complete literature with respect to the question where entrepreneurs differ from other parts of the population. Overviews are provided by the meta-analytical studies of Zhao and Seibert (2006) and Rauch and Frese (2007). 7 Moreover, there is one study, Ciavarella et al. (2004), in which the relationship between personality and entrepreneurial survival is analyzed. They find that among the Big Five taxonomy only conscientiousness positively influences the probability that an individual remains to be an entrepreneur. However, their analysis is based on a very small sample and on an ex-post measure of the Big Five factors once the survival of the venture was determined. Thus, the study faces severe limitations.

12
which ones support entrepreneurial survival. Thus, so far no known empirical study systematically analyzes entry into entrepreneurship, the status of entrepreneurs compared to others or the survival of entrepreneurs where the Big Five approach and the role of personality characteristics in the attainment of entrepreneurial status are systematically considered.
4 Data and Methodology
4.1 Representative Household Panel Data
In our analysis we use the German Socio-Economic Panel (SOEP). The SOEP is an annual representative panel survey covering detailed information about the socio-economic situation of about 22,000 individuals living in 12,000 households across Germany (see Wagner, Frick, and Schupp, 2007, for details). Our analysis draws on ten sequential waves of the SOEP starting in 2000, when the sample was substantially enlarged, through the most recent 2009 wave. Our sample includes individuals between 19 and 59 years of age. We excludes farmers, civil servants and those currently in education, vocational training or military service as they have a limited occupational choice set or different determinants of occupational choices that could distort our analysis. Given the statutory retirement age of 65 in Germany we also exclude individuals aged 60 or older in order to avoid early retirement issues.8 Family members working for a self-employed relative are also excluded from the sample because they are not entrepreneurs in the sense that they run their own business.
The concept of entrepreneurship differs from self-employment, as the former usually implies the risk bearing of innovation, whereas the latter goes along with income risk but not necessarily with innovation. This study focuses on self-employment, which can be identified in our data, as a proxy for entrepreneurship. Working individuals are classified as self-employed when they report self-employment as their primary activity. A transition into or out of self-employment can be identified in the data when a person is observed in different employment states in two consecutive years, t and t+1. Therefore, the observations of 2009 do not enter the estimations of entries and exits, but serve to identify transitions in 2008. In the estimation of the probability of being self-employed, the observations of 2009 are included.
4.2 Measurement of Personality Characteristics
In several survey waves the SOEP included short versions of established psychological personality inventories. This addition makes it possible to study traits and personality characteristics and their consequences on a large, representative sample of the population, and to relate them to a rich set of socio-economic variables. Specifically, in 2005 and 2009, the SOEP included identical special personality questionnaires that measured respondent’s Big
8 The actual average retirement age in Germany was 63 years in 2004 (Radl, 2007).
13
Five personality factors. In 2005, additional questions measured locus of control and reciprocity. The respondents were asked how much they agreed with different statements about themselves (on 7-point Likert scales). Fifteen items assessed the Big Five personality traits (3 items for each trait), internal and external locus of control were measured by 10 items, and 6 items addressed reciprocity. Similarly, in 2003 and 2008, the same respondents answered three questions measuring trust. The survey waves of 2004, 2006, 2008, and 2009 posed a question about the general willingness to take risks, using identical wording each year,9 and the 2008 questionnaire included questions about patience and impulsivity. Table A 1 in the Appendix shows the translated wording of all the statements measuring traits and personality characteristics. We obtain a respondent’s score for a personality characteristic by averaging the scores from the different statements referring to that characteristic. For some items, the scale is inverted (see also Table A 1).
We conduct a factor analysis as an ex-post validation of the personality variables. The results, which appear in Table A 2, confirm that the items used in the analysis load on distinct factors, which generally correspond very well to the personality traits identified ex-ante (as shown in Table A 1). This is noteworthy because it shows that the personality characteristics used in addition to the Big Five, such as locus of control and trust, are independent variables and are not reflected by the Big Five dimensions. It is therefore important to add these variables when analyzing the effects of personality on outcomes such as entrepreneurship, instead of relying solely on the Big Five.10
We standardize all personality variables (except risk tolerance) by subtracting the variable’s mean and dividing by its standard deviation. This transforms the variables into a common scale and facilitates interpretation of the variables’ effects on self-employment. We do not standardize the measure of risk tolerance because this variable enters the estimation equations in level and square terms.
Since we observe traits and personality characteristics only in selected survey waves, we impute a respondent’s answers to the personality questions into the observations of the same respondent in the other survey years, assuming that traits are stable within a few years.11 For
9 The SOEP waves of 2004 and 2009 additionally included a measure of risk attitudes using lottery choices. This paper uses the question about the general willingness to take risks, as this is the only risk question also available in 2006 and 2008. Furthermore, the experiment by Dohmen et al. (2005) showed that this measure performs better than the lottery measure in predicting behavior. 10 Only for the ten items intended to measure locus of control the results from the factor analysis are somewhat more mixed. We therefore do not use two of these items (indicated in Table A 1) for the construction of internal and external locus of control (see also Caliendo, Cobb-Clark, and Uhlendorff, 2008). The item “Inborn abilities are more important than any efforts one can make” loads on factor 9, which seems to represent internal locus of control, but we stick with the ex-ante concept and use it for external locus of control. We repeated the main estimations without using this item and obtained very similar results (available from the authors on request). 11 In fact, the correlation coefficients between the Big Five personality variables in the sample as measured in 2005 and 2009 are 0.60 for openness, 0.53 for conscientiousness, 0.66 for extraversion, 0.55 for agreeableness,
14
those traits and personality characteristics which are elicited in more than one survey wave, we impute values from the past where possible. For example, for 2004 through 2007, we impute information on the trust variable from 2003 and not from 2008. In Section 5.6, we conduct an analysis of the stability of the personality traits and several sensitivity tests with respect to the timing of the measurement of the personality variables and the outcomes.
4.3 Correlations and Validity Checks
We start our empirical analysis with an examination of the observed correlations between the various personality traits and relate them to the hypothesized correlations. Table 2 presents the pair-wise correlation coefficients in the pooled sample. The correlation coefficients are shown only if they are significantly different from zero at a significance level of 10%; those also significant at the 1% level are marked with a star. Obviously, almost all personality variables are correlated, but most correlation coefficients are below 0.2 in absolute terms.
INSERT TABLE 2 ABOUT HERE
The signs of the observed correlations confirm 19 out of the 21 hypothesized correlations summarized in Table 1; the correlation between impulsivity and neuroticism has the sign opposite to the expectation, but is weak, and one correlation (risk attitude and conscientiousness) is not significant at the 10% level. The fact that the data confirm most of the hypothesized relationships increases confidence that the measures of the personality traits available in the data are closely related to the theoretical concepts.
The finding that risk tolerance is positively correlated with openness and extraversion and negatively correlated with neuroticism and agreeableness confirms the expectations of Nicholson et al. (2005), who proposed that risk attitudes are a specific combination of scores on all Big Five traits (in our sample only conscientiousness is not significantly correlated with risk tolerance). As mentioned in the introduction, literature finds a positive effect of risk tolerance on entrepreneurial choice (Cramer et al., 2002; Caliendo et al., 2009). As the Big Five personality dimensions are unobserved in these studies, it is possible that the estimated effect of risk tolerance is spurious and actually reflects effects of the omitted personality traits. However, by controlling for the Big Five in our estimation, we show that risk tolerance has an independent partial effect on entrepreneurship (see Section 5.2).
In Section 2.5 we listed expected correlations between personality characteristics and the Big Five approach. Locus of control is expected to correlate with two factors, namely emotional stability and conscientiousness, and indeed strong correlations above 0.2 are found with these two factors, namely of internal locus of control with conscientiousness, and of external locus of control with neuroticism, the negative counterpart of emotional stability.
and 0.59 for neuroticism (all are significant at the 1% level). Given these quite high correlations, it seems plausible that the deviations represent (random) noise in the survey response.
15
More remarkably, the correlation between trust and agreeableness is only weak. In general it appears that the trust variable has low correlation coefficients to other variables, making clear that having additional information on this variable might be important. An interesting new result is that individuals tending to external locus of control also trust other people less.
Once having tested our hypotheses concerning the correlations, we explore what additional correlations the matrix reveals. From a theoretical perspective, it may be surprising that the data indicate significant correlations between the Big Five traits, which should be independent factors. In particular, the pairs extraversion/openness and agreeableness/conscientiousness exhibit correlation coefficients of 0.36 and 0.29. There is a theoretical explanation for this observation, i.e. there might be higher order factors behind the Big Five. In particular, Digman (1997) explicitly suggests the existence of such higher order factors. Both positive correlations are in line with his specific findings. Overall, the correlation matrix suggests that all personality characteristics used in this study, also those beyond the broad approach of the Big Five factors, measure concepts that are correlated, but clearly distinct allowing for the conclusion that a priori all variables should be included in the analysis of entrepreneurship.12
4.4 Group Means of Personality Characteristics
Table 3 shows the weighted means of the personality traits before standardization for the full sample and by employment state, based on the pooled sample of the waves 2000-2009. We conducted t-tests of equal means in the sub-samples of the self-employed and those not self-employed. Stars in the column for the self-employed indicate the results of the tests. For most traits and personality characteristics we find significant differences.
INSERT TABLE 3 ABOUT HERE
The results show that compared to others the self-employed are more risk-tolerant. Concerning the Big Five, the self-employed have higher average scores in openness and extraversion, and lower scores in agreeableness and neuroticism, than the full sample. The self-employed exhibit a higher internal and a lower external locus of control, score higher on trust, and are less patient and more impulsive than the remainder of the population.
The means of the socio-demographic variables confirm known facts. The share of women among the self-employed is low; the self-employed are more likely to have a university degree in comparison to the full sample and a higher share of them had a self-employed father
12 We made more tests on the validity and on the internal consistency of the questionnaire, e.g. by analysing correlations between the single items behind the personality variables, and also by relating personality variables to other information available in the SOEP such as the number of friends. All tests show that the questionnaire is valid and internally consistent. The tests are available from the authors on request.
16
at the age of 15. The self-employed have less unemployment experience13 and receive much higher real income from interests, dividends, and house rents on average, indicating greater financial wealth. These differences highlight the importance of controlling for these variables in order to identify the partial effects of traits and personality characteristics, ceteris paribus.
Appendix D shows histograms of the personality variables (and cognitive ability, see Section 5.5) in the estimation sample before standardization, separately for the self-employed and the remainder of the population. Especially the distributions of openness, extraversion, willingness to take risk, and internal locus of control clearly lean more to the right for the self-employed than for the others.
5 Empirical Results
5.1 Econometric Approach
We model the probabilities of transition into and out of self-employment as discrete time hazard rate models. We use annual data because interviews occur once a year and the covariates are not available for higher frequencies. The probability of entry into self-employment is estimated conditional on the tenure in dependent employment or the duration of non-employment, based on the sample of those in dependent employment and those not working. The probability of exit from self-employment is estimated conditional on the duration of the current spell in self-employment, based on the sample of the self-employed. Applying discrete time hazard rate models allows consistently taking into account state dependence and avoids survivorship bias. Starting from a general notation of a survivor model, in Appendix B we derive the estimation equation as a logit model of the transition probability conditional on the duration of the current state, estimated on the data in person-year format (cf. Jenkins, 1995; Caliendo et al., 2010).
The baseline hazard, which captures duration dependence, is specified flexibly as a third degree polynomial of the duration in the current state. For example, in the model of exit from self-employment, we expect the probability of exit to be high in the first years of self-employment and to decline with longer duration, after initial hurdles are passed (Caliendo et al., 2010). The model of entry into self-employment allows the baseline hazards to differ between those in dependent employment and those not working. This is achieved by an interaction of the variables capturing the spell duration with a dummy variable indicating the current state. For example, for the dependently employed, the probability of switching to self-employment may decrease with tenure, e.g. because of habituation, whereas for unemployed
13 To avoid endogeneity, work experience (in decades) and unemployment experience (in years) accumulate until the year before the observation year. We use retrospective information about a respondents’ employment history to recover the work and unemployment experience before the respondent had entered the panel.
17
people the probability may increase, as self-employment may appear as a means to escape unemployment when no other job is found.
Apart from the duration in the current state, we include the personality characteristics described in Section 4.2 as explanatory variables. In one specification, we include the Big Five personality dimensions only, and in a second one, we add risk tolerance, internal and external locus of control, positive and negative reciprocity, trust, patience, and impulsivity. Given that Caliendo et al. (2010) find a U-shaped relationship between risk tolerance and the probability of exit from self-employment, risk tolerance enters the transition models in linear and square terms, which allows for nonlinearity. For the other personality traits and characteristics we estimate linear approximations. We test including additional squared terms for all the linearly significant personality variables. All these squared terms are insignificant and can thus be dropped from the final specifications. Furthermore, we include the control variables listed in Table A 3.14
In the long run, the interplay between entry and exit rates determines the equilibrium self-employment rate. Instead of relying exclusively on the estimation of the flows, we also directly estimate the probability of being self-employed. We estimate a logit model of the probability of being self-employed, based on the full sample of the self-employed, the dependently employed and those not working. We use the same vector of explanatory variables as in the transition models, excluding tenure, which would be endogenous in this model.
5.2 Main Estimation Results
Table 4 presents the estimated marginal effects of the personality variables on the probability of being self-employed and on the yearly transition probabilities into and out of self-employment at the mean values of the explanatory variables. For each of these three outcomes, two specifications are displayed. Besides the control variables, one specification includes the Big Five personality dimensions only (Spec. A); the other contains all the personality variables (Spec. B). As noted in Section 4.2, all variables shown, except for risk tolerance, are standardized. The marginal effects of these variables indicate that the change in the probability is induced if their value increases by one standard deviation. The means of the outcome variables are shown at the bottom of the table. Table A 4 provides the logit coefficients, including those of the control variables.15
14 These are: age, prior working experience and prior unemployment experience, the number of children, real income from interests, dividends, and renting out as an indicator of wealth, and dummy variables indicating gender, educational degrees, disability, German nationality, marital status, geographical region, and whether the father was self-employed when the respondent was 15 years old. Section 4.4 provides more information about some of these variables. 15 The number of observations in the full sample, which is used to estimate the self-employment probability, is slightly higher than the number given in Table 3, because some of the observations have zero survey weights. In
18
INSERT TABLE 4 ABOUT HERE
The results show that personality characteristics matter for the probability of being self-employed and for the transitions probabilities, as several of them have marginal effects that are significantly different from zero, after having controlled for the known socio-demographic determinants of self-employment such as age, gender, education, a self-employed father, and capital income as an indicator of wealth. Furthermore, the Big Five personality dimensions do not seem to exhaustively capture the relevant personality traits, since a number of the additional personality variables in Spec. B have significant partial effects. Therefore, we prefer Spec. B with the full set of personality variables over Spec. A (for further discussion based on information criteria, see Section 5.4).
We first focus on the effects of the Big Five construct. Openness to experience has a significantly positive partial effect on the probability of being self-employed in specifications A and B. Increasing openness to experience by one standard deviation raises the self-employment probability by 1.51 percentage points in the preferred Spec. B. Considering that the self-employment rate in the sample is 8.74%, this corresponds to a large relative effect of 17.3%. The positive effect on the self-employment probability is explained by the positive and significant effect on the entry probability. Increasing openness by one standard deviation increases the yearly probability of entry by 0.14 percentage points corresponding to a relative effect of 12.4%, given the entry rate of 1.13% of the non-self-employed per year.
Extraversion exerts the second largest influence on the self-employment probability among the Big Five. As expected, the effect is positive. An increase by one standard deviation significantly raises the probability of being self-employed by 0.62 percentage points or 7.1%. Again this is explained by a positive and significant effect on the entry probability of 0.06 percentage points or 5.3%. Agreeableness does not have a significant effect on the self-employment probability, but it significantly increases the probability of exit from self-employment. Increasing agreeableness by one standard deviation raises the yearly probability of exit by 1.1 percentage points, which corresponds to 11.1% relative to the exit rate of 9.4% of the self-employed per year. Neuroticism does not have a significant effect on self-employment or the transitions, except for a small negative effect on entry in Spec. A. Conscientiousness does not have a significant effect on self-employment, entry, or exit, both in Spec. A and B.
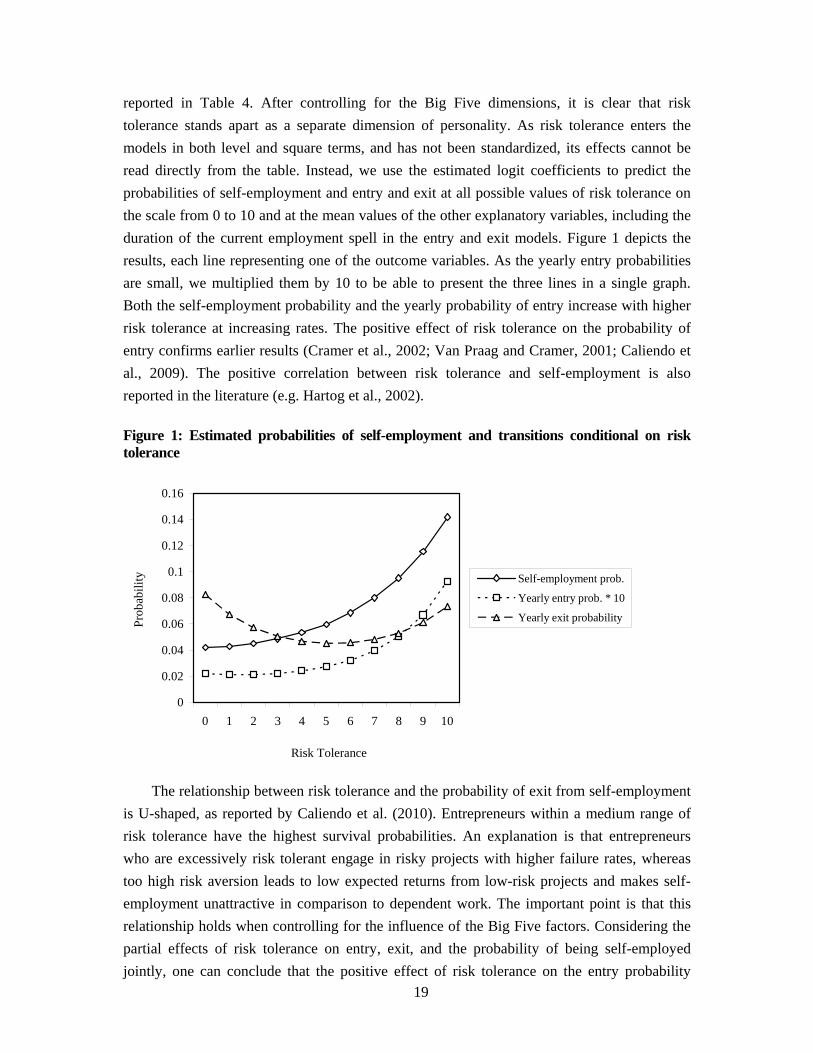
We turn now to the partial effects of the additional personality variables included in Spec. B. Risk tolerance is significantly related to self-employment, entry, and exit, as the level and square terms of risk tolerance are jointly significant at least at the 5% level in all models
the exit and entry models, fewer observations are used than shown in Table 3 for the sub-samples of the self-employed and of those not self-employed, respectively, because in the transition models only observations in 2000-08 can be included (see section 4.1), where Table 3 includes 2009.
19
reported in Table 4. After controlling for the Big Five dimensions, it is clear that risk tolerance stands apart as a separate dimension of personality. As risk tolerance enters the models in both level and square terms, and has not been standardized, its effects cannot be read directly from the table. Instead, we use the estimated logit coefficients to predict the probabilities of self-employment and entry and exit at all possible values of risk tolerance on the scale from 0 to 10 and at the mean values of the other explanatory variables, including the duration of the current employment spell in the entry and exit models. Figure 1 depicts the results, each line representing one of the outcome variables. As the yearly entry probabilities are small, we multiplied them by 10 to be able to present the three lines in a single graph. Both the self-employment probability and the yearly probability of entry increase with higher risk tolerance at increasing rates. The positive effect of risk tolerance on the probability of entry confirms earlier results (Cramer et al., 2002; Van Praag and Cramer, 2001; Caliendo et al., 2009). The positive correlation between risk tolerance and self-employment is also reported in the literature (e.g. Hartog et al., 2002).
Figure 1: Estimated probabilities of self-employment and transitions conditional on risk tolerance
0
0.02
0.04
0.06
0.08
0.1
0.12
0.14
0.16
0 1 2 3 4 5 6 7 8 9 10
Risk Tolerance
Prob
abili
ty Self-employment prob.
Yearly entry prob. * 10
Yearly exit probability
The relationship between risk tolerance and the probability of exit from self-employment is U-shaped, as reported by Caliendo et al. (2010). Entrepreneurs within a medium range of risk tolerance have the highest survival probabilities. An explanation is that entrepreneurs who are excessively risk tolerant engage in risky projects with higher failure rates, whereas too high risk aversion leads to low expected returns from low-risk projects and makes self-employment unattractive in comparison to dependent work. The important point is that this relationship holds when controlling for the influence of the Big Five factors. Considering the partial effects of risk tolerance on entry, exit, and the probability of being self-employed jointly, one can conclude that the positive effect of risk tolerance on the entry probability
20
outweighs the positive effect of excessive risk tolerance on the exit probability, such that on balance higher risk tolerance has a positive effect on the probability of being self-employed.
A more internal and less external locus of control significantly increases the probability of self-employment, as Table 4 further shows. This is consistent with our expectations and with the literature, e.g. results of Begley and Boyd (1987), Evans and Leighton (1989), or van Praag et al. (2009) using US data. Quantitatively, an increase in internal locus of control by one standard deviation raises the self-employment probability by 1.36 percentage points, which corresponds to a relative effect of 15.6%. A one standard deviation increase in external locus lowers the probability by 1.0 percentage points or 11.4%. The effects of an internal or external locus on self-employment are explained by its effects on entry, while there are – as we will see later – only in some specifications significant effects on survival. Again it should be emphasized that these statistically and economically important effects of locus of control prevail after controlling for the Big Five dimensions.
Trust is found to significantly increase the entry probability. An increase in trust by one standard deviation increases the probability of entry by 0.08 percentage points, which corresponds to a relative effect of 6.2%. Caliendo et al. (2011), who focus on the influence of trust and reciprocity on self-employment without controlling for the Big Five, locus of control, patience, and impulsivity, using SOEP data from 2000-2008, report that trust increases the entry probability by 7%, which is not significantly different. Neither this analysis nor Caliendo et al. (2011) find any further significant effects of trust.16
Patience and impulsivity do not exert significant partial effects in these specifications. This may be surprising, given that both economic theory (e.g. Vereshchagina and Hopenhayn, 2009) and psychological research (e.g. Sahakian et al., 2008) suggest links between these variables and entrepreneurship. As we are measuring the partial effects after having controlled for the Big Five construct, a possible explanation is that patience and impulsivity are nearly collinear with the Big Five and thus do not add additional information. Indeed, we will show in the sensitivity analysis later on, that if neither the Big Five nor risk attitudes are included in the model, impulsivity has a positive partial effect on the probability of being self-employed, which is significant at the 1% level (see Section 5.4 and specifications C1 through C4 in Table A 6). The correlation matrix (Table 2) shows that impulsivity and risk tolerance have a correlation coefficient of 0.239, and impulsivity and extraversion have 0.268, so the positive effects of risk tolerance and extraversion on self-employment may already capture the effect of impulsivity. The positive effect of impulsivity, when not controlling for other traits, is consistent with results from neurocognitive experiments (Sahakian et al., 2008).
16 Positive reciprocity is found to have a small, but significant negative partial effect on the probability of self-employment. This effect is not robust, however: Positive reciprocity becomes significant only when the Big Five are also included, but it is insignificant without these regressors, as shown in Table A 5. This explains the insignificance of positive reciprocity in the study of Caliendo et al. (2010b), which did not include the Big Five.
21
The estimated coefficients of the control variables are consistent with prior research (Table A 4). Women have a significantly lower probability of becoming and being self-employed, and they have a higher exit probability (see also Fairlie and Robb, 2009). Controlling for differences in risk aversion (in Spec. B) diminishes the gender effects on self-employment state and entry, which shows that gender differences in risk aversion explain a part of the, but not the complete, gender gap in self-employment (cf. Fossen, 2009). Individuals who report a self-employed father when they were 15 years old are significantly more likely to become and to be self-employed (e.g. Dunn and Holtz-Eakin, 2000). Higher capital income significantly increases the probability of entry and of being self-employed, which may indicate the presence of borrowing constraints (e.g. Evans and Jovanovic, 1989; Hurst and Lusardi, 2004), especially in Spec. B, which controls for differences in risk aversion. In the hazard rate models of entry and exit, the coefficients of the polynomial terms describing the duration in the current employment state are jointly significant showing that duration dependence plays a role in the decision to switch state. In the entry model, the results also show that the baseline hazard of entry differs between employees and those not working. This is reflected in the joint significance of the interaction terms between the spell duration terms and the dummy variable indicating non-employment.17
5.3 Separate Regressions and Analysis of Single Items
Next we assess systematically whether the results change if the various personality variables are not included jointly, but rather in separate regressions. We estimate 14 additional specifications, each of which includes only one of the personality variables and the socio-economic control variables. Table 5 shows the logit coefficients of the personality variables from these regressions.18 Most of those personality variables, which are significant when included jointly with the other personality variables, are still significant when included separately, and vice versa. Variables significant in both approaches never change sign. Their coefficients are almost always larger when included separately (see Table A 4 for the logit coefficients from the joint regressions), which suggests that omitting the other personality variables introduces positive bias. Some variables are only significant when included separately: Neuroticism then has significant negative effects on entry (as in Spec. A) and on self-employment state, and impulsivity then has positive effects on entry and self-employment
17 As an additional variable we considered optimism. The SOEP waves 2005 and 2009 included the following question: “When you think about the future, are you optimistic, more optimistic than pessimistic, more pessimistic than optimistic, pessimistic?” Answers to this question reflect a mix of a respondent’s optimistic nature and his or her objective future prospects, which makes the interpretation difficult. When we include “optimism” with a score from 1 (pessimistic) to 4 (optimistic) in our probability models of self-employment, entry, and exit, in addition to the other personality variables, its coefficients are insignificant in all models, so it could be dropped from the final specifications. The insignificance is consistent with the view that the concept of optimism as a personality characteristic is fully described by the Big Five dimensions. 18 Full results are available from the authors on request.
22
status (as mentioned in Section 5.2).19 The results from the separate regressions highlight the importance of analyzing the fundamental personality traits jointly to derive their partial effects, ceteris paribus. Studies for instance exclusively focusing on impulsivity will find positive effects. However, we show that this effect is driven by extraversion and risk attitude.
INSERT TABLE 5 ABOUT HERE
To gain further insights, we repeat the estimations using all personality variables jointly, but use the scores from all single items in the questionnaire instead of the aggregated scores of the personality variables. Table 6 reveals some effects of the single items that are otherwise hidden in the effects of the aggregated personality variables. While extraversion does not have a significant effect on exit in Table 4, agreement with the item “I see myself as someone who… is communicative, talkative” significantly decreases the yearly exit probability. Concerning agreeableness, while the aggregated variable has no significant effect on entry, the item “I see myself as someone who… is considerate and kind to others” has a positive partial effect. This seems to be offset by the item “…has a forgiving nature”, which has a negative sign, but is not individually significant. The items indicating neuroticism show some mixed effects. The item “…gets nervous easily” is significantly negative in the models of entry and self-employment state and drives the negative effect of neuroticism on entry in Spec. A. Apparently this item outweighs the effect of “…is relaxed, handles stress well”, which is also significantly negative in Spec. B of the entry model (this item’s score is reversed before entering the neuroticism sum). Similarly, “…worries a lot” has a significantly positive effect on the probability of being self-employed, but the negative effect of the “nervous” item offsets this, and taken together neuroticism is insignificant in Spec. B.
INSERT TABLE 6 ABOUT HERE
The negative effect of an external locus of control on entry and self-employment state partly results from respondents who believe that “The opportunities that I have in life are determined by the social conditions”. The positive effect of trust on entry is driven by respondents who disagree with the statement “If one is dealing with strangers, it is better to be careful before one can trust them”. Consistently, disagreement with this statement also has a negative effect on exit and a positive effect on the probability of being self-employed. Apparently the aggregated trust variable is insignificant in the models of exit and self-employment state because in these models the other two trust items pull in the opposite direction, although they are not individually significant.
19 Positive and negative reciprocity are significant only when included jointly with the other personality variables, which is consistent with the observation reported before.
23
5.4 Explanatory Contributions of the Personality Variables
In this section, we analyze how much personality characteristics add to the explanation of self-employment and of entries and exits, beyond what is already explained by the conventional socio-demographic variables. Furthermore, we assess if including the Big Five personality dimensions is sufficient to capture the influence of personality, or if the additional personality variables significantly contribute to the explanatory power of the models.
The literature suggests several goodness-of-fit measures for binary response models such as the logit model, which may serve as an analog to the usual R2 in an OLS regression. Each of these pseudo-R2 have specific advantages and disadvantages (e.g. Greene, 2008). To get an impression of the sensitivity of the results, we base our analysis on three alternative measures: McFadden’s (1974), McKelvey and Zavoina’s (1975), and Efron’s (1978) R2 (see Appendix C). Like the conventional R2, these pseudo-R2 lie between 0 and 1, and a higher value indicates a better fit.
Table 7 shows the different pseudo-R2 measure for the models of the probabilities of being self-employed (top panel), entry (below), and exit (bottom panel). The columns refer to the specifications including different sets of explanatory variables; going from left to right, more and more variables are added. The leftmost column refers to the model including year dummies only. The next column additionally includes the socio-economic control variables, and in the exit and entry models also the duration in the current employment state. Next, the Big Five personality dimensions are added, leading to Spec. A, and then step by step the remaining personality variables are included, until we arrive at the full models in the rightmost column (Spec. B). Correspondingly to Table 7, Table A 5 in the Appendix provides the estimated logit coefficients of the personality variables in the model of the self-employment probability when the personality variables are added step by step.20 In Table 7, below each of the pseudo-R2 measures an index is shown where the pseudo-R2 achieved with the full model is normalized to 100%.21 The row below this index provides the difference in the index between two adjacent columns. This difference may be interpreted as an approximation of the share in the full model’s explanatory power that is provided by the variables added in this column.
INSERT TABLE 7 ABOUT HERE
20 Table A 5 shows that the coefficients are not overly sensitive to the choice of variables. Among the significant coefficients, none changes sign across the specifications. Similar tables for the entry and exit models are available from the authors on request. 21 The pseudo-R2 are not very large even in the full models, as is typical in microdata applications. Obviously, most of an individual’s circumstances that induce him or her to be, become, or give up self-employment, such as specific business opportunities, are unobserved. This does not invalidate the identification of the partial effects of the observed variables, many of which have been shown to be significant.
24
One result from the table is that the conventional socio-demographic variables explain the largest part of what the full model explains. In the model of the probability of being self-employed, these contribute between 67.6% and 73.4% to the full model’s explanatory power, depending on the pseudo-R2 used. However, the Big Five personality dimensions contribute 12.8 to 14.2 percentage points to the explanatory power of the full model.22 This highlights the importance of personality traits for entrepreneurship. The explanatory power of the Big Five is on par with the most prominent determinants of entrepreneurship: education (represented by four dummy variables for educational attainment, see Table A 4) contributes 9.6 to 16.5 percentage points to the full model’s explanatory power, while having had a self-employed father at the age of 15 contributes only 1.5 to 4.0 percentage points.23
If the Big Five dimensions completely described the relevant personality traits, adding further personality variables would not further improve the model. Risk attitude and locus of control provide important additional information, however. Risk tolerance adds another 4.4 to 8.9 percentage points to the model’s explanatory power. When internal and external locus of control are included, another 5.9 to 8.8 percentage points are gained, and the full model’s explanatory power is almost reached. Having controlled for all these variables, adding reciprocity, trust, patience, and impulsivity improves the pseudo-R2 only marginally.
In the models of entry and exit, the share that the personality variables contribute to the full model’s explanatory power is smaller than in the model of being self-employed, especially in the exit model. One reason is that the control variables in the transition models include a polynomial of the duration in the current employment state, which explains a large part of the transition probability. In the entry model, all personality variables together explain 15.0% to 31.5% of what the full model explains. 7.1% to 9.9% are explained by the Big Five dimensions alone, and 1.1% (McKelvey and Zavoina’s R2) to 14.6% (Efron’s R2) by risk tolerance. In the exit model, all personality variables sum up to 7.6% to 9.4%, the Big Five contribute 1.7% to 3.3%. As in the model of being self-employed, in the transition models reciprocity, trust, patience, and impulsivity increase the pseudo-R2 only marginally.
As the personality variables are correlated (see Section 4.3), the increase in the pseudo- R2 measures used when an explanatory variable is added may depend on the sequence of addition. To explore the sensitivity of the results, we repeat this section’s exercise with reverse ordering of the personality variables, i.e. we add patience and impulsivity first and the Big Five personality dimensions last. Table A 6 provides the corresponding logit coefficients
22 Specifically, openness to experience accounts for about three quarters of the explanatory power of the Big Five, and extraversion for most of the rest; the other three factors contribute little as they are insignificant in the estimation. 23 We calculate the contributions of education (or a self-employed father, respectively) after controlling for year dummies and the other control variables, but not the personality characteristics, i.e. by splitting the step shown in column 2 in Table 7 into two steps.
25
and Table A 7 shows the resulting pseudo-R2 measures, confirming that among the personality variables, the Big Five, risk tolerance, and locus of control have the strongest explanatory power, while trust and reciprocity contribute only marginally. In the model of being self-employed, patience and impulsivity now contribute almost 3% to the full model’s pseudo-R2. This is explained by the positive correlation between impulsivity and risk tolerance. If impulsivity is included first, omitting risk tolerance, it proxies for risk tolerance and thus has a larger effect. Once risk tolerance is added, impulsivity is no longer significant (see Table A 6). Hence, we conclude that the low contribution of impulsivity displayed in Table 7 is more appropriate. This finding highlights the importance of considering different personality traits jointly, as done in our paper. An analysis of the relationship between impulsivity and entrepreneurship which does not account for risk aversion would overestimate the influence of impulsivity. Similar considerations explain why the Big Five dimensions contribute less to the explanatory power if they are added last than if they are added first.
We repeat the analysis (in the original order) using the single items instead of the aggregated personality variables in the logit estimations to assess how much explanatory power is lost due to aggregating. The results shown in Table A 8 can be compared with the original results in Table 7. The pseudo-R2 for the full models become somewhat higher, which is not surprising, as more information is used when the scores from the items are included separately instead of aggregating them. The contribution of the personality variables, especially of the Big Five and locus of control, increases relatively to the socio-demographic variables. Strikingly, using Efron’s R2 in the entry model, the 15 items used to construct the Big Five personality variables contribute 15.4% of the full model’s explanatory power, whereas the aggregated Big Five only contribute 9.9%. The explanatory power of the Big Five and locus of control in the exit model more than doubles, irrespective of which pseudo-R2 measure is used. These results show that using scores in single statements is useful for predicting self-employment and transitions.
Information criteria, which penalize model complexity, can be used to choose a preferred model that balances the goals of model fit and parsimony. We use Akaike’s (1973) information criterion AIC = -2 ln L + 2q, where L is the model likelihood and q is the number of parameters, and the Bayesian information criterion BIC = -2 ln L + (ln N)q, which increases the model-size penalty as the sample size N grows (Schwarz, 1978). For the models of the probability of being self-employed, we show both criteria in the lower sections of Table A 5 and Table A 6. A comparison shows that Spec. A3 minimizes the BIC and Spec. A4 the AIC. Thus, based on the BIC, a posteriori one would prefer the specification including the Big Five, risk attitude, and locus of control; based on the AIC, one would additionally include reciprocity. Based on both criteria, one would exclude trust, patience, and impulsivity, which makes sense as these three personality characteristics are insignificant. In the model of entry, the AIC prefers Spec. A5 which additionally includes trust (which is significant in the entry model). Using the BIC, which penalizes model complexity more than the AIC, one would
26
choose the entry model only including the Big Five and the risk attitude (Spec. A2). In the exit model, Spec. A3 including the Big Five, the risk attitude, and locus of control, minimizes the AIC, whereas the BIC is minimized when no personality variable at all is included in the exit model.24
5.5 Sub-sample Estimations Including Cognitive Ability
In this section we address the question whether the estimated effects of some personality variables are potentially driven by their correlation with cognitive ability. The SOEP data provides a unique opportunity to test this, as a sub-sample of the SOEP respondents took part in short intelligence tests in 2006. We use the results from a symbol correspondence test (SCT).25 In the SOEP version of the SCT a computer screen showed mappings between pairs of symbols and numbers. Below the mapping, the computer subsequently showed one of the symbols, and the subjects had to match as many of them to the corresponding numbers as they could in 90 seconds. The number of correct matches was recorded and serves as a simple measure of fluid intelligence, which refers to the mechanics of cognition, i.e. the performance and speed of solving tasks that are related to new material (Cattell, 1987). In contrast to the full WAIS, this quick test is suitable for a large-scale representative survey study. Lang et al. (2007) showed that the outcome from this test is sufficiently correlated with test scores from more comprehensive intelligence tests. However, the test still requires a computer-aided personal interview, which was only feasible for a sub-sample of the SOEP respondents. Our estimation sample of respondents who took part in the intelligence test is only about 20% of the full estimation sample. For this reason, we do not include the measure of cognitive ability in the main analysis.26
The first column of Table A 10 (Spec. B3) shows the logit coefficients from the estimation of the probability of self-employment, including cognitive ability (standardized) as an additional regressor. The point estimate of the coefficient (and also the marginal effect) is about zero and insignificant. Some of the personality variables are also no longer significant. The insignificance may be due to the low number of observations available for these estimations, which increase the size of the standard errors. Nevertheless, openness, internal
24 In the models of entry and exit, Spec. B2, which includes all personality variables plus cognitive ability, has even lower AIC and BIC, but it cannot be compared to the other specifications straightforwardly because it is estimated on a much smaller sample (see section 5.5). 25 The SCT in the SOEP mimics the symbol-digit-modalities-test of Smith (1995). The test corresponds to one of the non-verbal modules of the Wechsler Adult Intelligence Scale (WAIS), which is one of the most often-used intelligence tests (Tewes, 1991). 26 The SOEP wave 2006 also includs a word fluency test similar to one of the verbal modules of the WAIS, where subjects had to name as many different animals as they could in 90 seconds. We do not use the results from this test as it measures a mixture of crystallized and fluid intelligence (it requires both knowledge and working memory, as well as German language skills in case of foreigners). Moreover, in contrast to the SCT, this test is prone to measurement error, as the interviewers had to identify animal names mentioned twice (see also Heineck and Anger, 2010).
27
and external locus of control, and positive reciprocity are still significant (and even have somewhat larger partial effects) in the estimations controlling for cognitive ability. Negative reciprocity now has a positive and significant coefficient. The level and square terms of risk tolerance become individually insignificant, but remain jointly significant at the 1% level and consistently indicate that the probability of self-employment increases with risk tolerance above a score of 1 on the 11-point scale. The coefficient of extraversion is no longer significant. As cognitive ability is insignificant and only slightly correlated with extraversion in our data (Table 2), the significant coefficient of extraversion in the specifications excluding cognitive ability cannot be explained by omitted variable bias. Rather, the coefficient in the specifications including cognitive ability becomes insignificant due to the small sample size.
5.6 Stability of Personality Traits, Timing, and Causality
It is important to discuss the question whether traits and personality characteristics are stable over time. Psychologists argue that in particular personality traits covered by the Big Five approach are stable over lifetimes (see inter alia Caspi, Roberts, and Shiner, 2005). Similarly, Borghans, Duckworth, Heckman, and ter Weel (2008) conclude that traits are stable across situations and longer time periods. So far we implicitly assumed that the traits and personality characteristics we observed are constant at least over the relatively short observation period of ten years. If personality traits change non-randomly within shorter time intervals, and the changes are correlated with self-employment status or transitions, issues of reverse causality may arise.
A unique feature of our data is that the same respondents are asked questions assessing most of the personality traits – namely the Big Five, trust, and risk attitude – in two (or more) different years. This allows us to directly test if transitions into or out of self-employment between the repeated interviews induced changes in these personality traits (see Jaeger et al., 2010 for a similar test of the stability of risk attitude in the context of migration). Table A 9 shows the results. For each of the Big Five personality traits, we estimate OLS regressions as follows. The dependent variable is the change in the score in the personality variable between the two times of measurement 2005 and 2009. The key explanatory variable is a dummy variable indicating entry into (upper two panels of the table) or exit out of self-employment (lower panels) at any time within this time span. We estimate specifications with and without the control variables listed in Table A 4.27 Analogously, we estimate the influence of entry and exit on the change in the willingness to take risk between 2004 and 2009 and on the change in trust between 2003 and 2008. The coefficients of both entry and exit are insignificant for almost all personality variables, which indicates that entry and exit does not affect the observed changes. The only exception is that exit from self-employment
27 Full results are available from the authors on request.
28
significantly increases the level of neuroticism (whereas entry has no significant influence). Therefore one must be cautious with any causal interpretation of the effect of neuroticism in estimations of the probability of exit. As neuroticism and also the corresponding single items were all insignificant in our estimations of exit, however, our analysis remains valid. In summary, we conclude that the personality traits considered, with the possible exception of neuroticism, are a determinant of entry into and exit from self-employment and not vice versa.
To further assess the sensitivity of the results, we estimated a number of variants of the main Spec. B discussed in Section 5.2 (Table A 10). The logit coefficients can be compared directly with those in Table A 4. Even though reverse causality seems highly unlikely given the tests reported before, Spec. B4 to B8 further assess if potential reverse causality influences the results. In Spec. B4, we estimate the self-employment probability model based on the last available cross-section, 2009, only. Hence, none of the personality characteristics are observed after the outcome is measured. In Spec. B5, we only use 2005-2009 data and thus exclude outcomes observed before the Big Five, locus of control, and reciprocity were initially measured, in 2005. In Spec. B6, we use the complete sample, but only the Big Five observed in 2005 (not in 2009), risk attitude observed in 2004 (not in 2006, 2008, and 2009), and trust observed in 2003 (not in 2007). In Spec. B7 we additionally exclude patience and impulsivity, because no measurement before 2008 is available for these traits. The most rigorous specification is B8: We limit the sample to 2005-09, and only use the Big Five observed in 2005, risk observed in 2004 and 2003’s trust, while excluding impatience and impulsivity. Thus, in this specification no personality trait is observed after the outcome. The estimated coefficients of the personality characteristics are similar throughout all these specifications: The 95% confidence intervals overlap. In the main Spec. B and in Spec’s B5-B8, the same subset of coefficients are significantly different from zero and show the same signs (except for neuroticism, which is significantly positive at the 10% level in Spec. B8 now). In Spec. B4, which is estimated on the much smaller sub-sample of 2009 only, two coefficients become insignificant, namely those of extraversion and external locus of control. The positive influence of risk tolerance is now captured by the significant linear, not the square term. The point estimate of trust, which is positive, but insignificant in the main Spec. B, is significantly positive at the 10% level in Spec. B4. Overall, given the robustness of the results, we conclude that they are not driven by reverse causality, which is consistent with the results of the earlier tests.
5.7 Further Robustness Checks
A potential econometric issue arises in the model of entry into self-employment. The average yearly transition rate into self-employment among those not self-employed is only 1.13%, so only this small share of the observations in the sample “at risk” of entering self-employment have a positive outcome. King and Zeng (2003) point out that using a standard logistic regression in such a “rare events” setting can lead to significant finite sample bias. Thus we
29
re-estimate the entry model using the estimator suggested by King and Zeng (2003), which corrects the bias and is more efficient than the standard logit estimator when a positive outcome is very rare. It turns out that the coefficients change only slightly in comparison to the standard logit coefficients in Table A 4 (see also Caliendo et al., 2009).
As the exit model is estimated based on the comparably small and selective sub-sample of the self-employed, non-random selection into self-employment might introduce selection bias. To address this potential problem, in the last column we re-estimate the exit probability as a model with selection (cp. Heckman, 1979). We employ the sample selection model for binary dependent variables suggested by Van de Ven and Van Praag (1981), which takes into account that exit from self-employment is a binary outcome. The model estimates a reduced-form probit equation, which describes selection into self-employment, based on the full sample. The hazard rate of exit from self-employment is specified as a probit model instead of the logit model used in the remainder of this article. This allows modeling the error terms of the latent selection and exit equations to follow the bivariate normal distribution with correlation ρ and permits estimating the two equations jointly using the Full Information Maximum Likelihood Estimator.28
After having estimated the model with selection, a Wald test indicates that the hypothesis that ρ = 0, i.e. the selection and exit equations are independent, cannot be rejected (p-value 0.44). Consistently, the estimated probit coefficients of the significant personality characteristics in the rightmost column of Table A 10 show the same signs as the logit coefficients in the baseline exit model not controlling for selection (Table A 4). The probit coefficients can be multiplied by 1.6 for an approximate comparison with the magnitudes of the logit coefficients (Amemiya, 1981). The resulting estimates of the significant personality traits are not significantly different from the logit estimates in the baseline model. The linear and square terms of the risk attitude consistently indicate a U-shaped relationship between risk tolerance and the exit probability. We conclude that not controlling for potential sample selection does not significantly bias the results in this analysis.
Further, we consider the possibility that the influence of personality characteristics on the probability of exit from self-employment changes with the duration of self-employment. Instead of including a polynomial function of the duration in self-employment in the model, we define a dummy variable indicating the initial years of self-employment (defined,
28 In the selection equation we use all explanatory variables included in the exit probability equation, except duration. For better identification, we additionally include the secondary schooling level of the respondent’s father and mother in the selection equation. This information is excluded from the exit rate equation. The parents’ schooling is expected to influence their children’s initial occupational choice, but not the success or the exit rate once an adult has decided to be self-employed. The parents’ schooling levels are measured by dummy variables indicating if the parents obtained the higher secondary school degree Abitur, which qualifies for university admission in Germany. Both variables positively and significantly influence selection into self-employment.
30
alternatively, as the first year, years 1-2, years 1-3, or years 1-5). In subsequent estimations we interact the “initial years” dummy variable with the personality variables. The “initial years” dummy is always positive and highly significant, as the exit probability is high during the first years. This reflects the high “infant mortality” of small businesses. However, almost none of the interaction terms with the personality variables are significant, which indicates that the effects of the personality characteristics on the exit probability do not differ between the stages of self-employment. The only exception is external locus of control. In the first two or three years, an external locus slightly decreases, whereas in later years, it significantly increases the likelihood of exit. This may explain why the effect of external locus on exit is insignificant when not differentiating with respect to the duration of self-employment.
Last, we re-estimate the models of self-employment state, entry, and exit specifying random effects logit models. This may increase efficiency by making optimal use of the variance-covariance structure in the panel data, but may also be more sensitive with respect to the model assumptions than our baseline logit models with their cluster and heteroscedasticity robust standard errors. The results show that all the personality traits and characteristics significant in the baseline models in Table 4 remain significant and keep their signs.29
6 Concluding Summary
In this study we investigate to what extent traits and personality characteristics influence entrepreneurial processes. Previous research discusses their influence at different levels, namely whether personality influences entrepreneurial processes at all, and, if so, which sets of personality characteristics are helpful, and, at the level of individual variables, which characteristics are relevant. For our analysis we use large, representative data from the German Socio Economic Panel (SOEP) and are able, for the first time, to make simultaneous tests of a large set of traits and personality characteristics enabling us to provide consistent answers on all hierarchies of the analysis. Moreover, while previous empirical research compares data of individuals who were in differing positions (entrepreneurs with employees or managers), we have access to panel data that facilitates analyzing the influence of traits and personality characteristics on entries into and exits from a self-employed position.
We provide, in Section 2, a set of hypotheses. Consistent with hypothesis 1 (on the Big Five approach), we find that high values in openness to experience and in extraversion increase the probability of entry into self-employment and into entrepreneurial activities. High values of emotional stability (or low values of neuroticism) also increase the entry probability, but this hypothesized finding holds only when we do not control for further personality characteristics. Similarly entrepreneurs when compared to employees and not working people
29 Full results are available from the authors on request.
31
have a higher probability to score high on extraversion and openness to experience. Neuroticism shows no difference between the groups, which can be explained by the contradicting influence of two variables, namely that nervous people have indeed a lower probability and persons who worry a lot a higher probability of being in self-employment. Only with respect to the exit decision do we find almost no evidence in line with hypothesis 1. None of the factors mentioned before have any influence on survival in self-employment and among the single items of these factors we find only that the more communicative entrepreneurs are (an item of extraversion) the lower their exit probability. With respect to agreeableness, we observe in line with our hypothesis that weak bargainers (those who score high on agreeableness) face a decreased survival probability. With respect to the influence of agreeableness on the entry decision we also find support for our argument that there are two contradicting effects which cancel each other out. Overall the findings support hypothesis 1; only the influence of the Big Five factors on survival in self-employment is below expectations. Moreover, the part of our observations where we compare self-employed with others is in line with the analysis of Zhao and Seibert (2006) who restricted the analysis on the comparison of different populations.
For the second hypothesis, we find that locus of control has strong partial effects on entrepreneurial development even after controlling for the Big Five. Persons scoring high on internal (external) locus of control, have – in line with hypothesis 2 and with previous research of Begley and Boyd (1987), Evans and Leighton (1989), or van Praag et al. (2009) – a higher (lower) probability of starting a business and of being in business. Additionally we find that after the initial three years in self-employment have passed, an external locus of control has a negative effect on entrepreneurial success in terms of survival. The strongest support without any restrictions can be found for hypothesis 3: Risk attitudes have – as hypothesized – a non-uniform influence on entrepreneurial development. The higher the risk attitudes of an individual, the higher the probability that he or she will start an own business and be in business. Moreover, between risk attitudes and entrepreneurial success there is an inverse U-shaped relationship. These findings hold even when controlled for the Big Five traits.
The results on the additionally considered characteristics remain below expectations (see hypothesis 4). We do find, in line with hypothesis 4, that trustful persons have a higher entry probability into entrepreneurship. Impatience and impulsivity add little explanatory power, however. These two variables seem to be captured by the Big Five approach and the variable risk attitudes.30 Hypothesis 5a, which focuses on correlations between the variables of the Big Five construct and further personality characteristics, finds full support. Most correlations are
30 This observation is interesting as recent research (see Sahakian et al., 2008) has highlighted the importance of impulsivity for entrepreneurial decision making.
32
observed as expected. Nevertheless, hypothesis 5b is rejected in favor of hypothesis 6, according to which, in particular, the two variables locus of control and risk attitudes have strong partial effects on entrepreneurial entry, stock and survival, even if the Big Five construct is controlled for.
Concluding, the first insight of our analysis is, an affirmative one: personality significantly influences entrepreneurial choices and affects entrepreneurial processes in many ways. Second, the Big Five approach only partly explains entrepreneurial decisions. Third, the approach of considering further personality characteristics adds additional information for entrepreneurial processes. Putting the findings in a nutshell, there are several reliable traits and personality characteristics affecting the probability of becoming an entrepreneur and of succeeding as an entrepreneur. It makes sense to use a comprehensive set of information about traits and personality characteristics to partly predict what it needs to become a successful entrepreneur.
33
References
Acs, Z. and D. Audretsch (2003). Handbook of Entrepreneurship Research. Dordrecht, The Netherlands: Kluwer Academics Press.
Akaike, H. (1973). Information Theory and an Extension of the Maximum Likelihood Principle. In: B.N. Petrov and F. Csaki (eds.), Second International Symposium on Information Theory, 267-281. Budapest, Hungary: Akademiai Kaido.
Aldrich, H.E. (1999): Organizations Evolving. London, UK: Sage.
Amemiya, T. (1981). Qualitative Response Models: A Survey. Journal of Economic Literature 19, 481–536.
Baron, R.A. (1998). Cognitive Mechanisms in Entrepreneurship: Why and When Entrepreneurs Think Differently than Other People. Journal of Business Venturing 13, 275-294.
Baron, R.A. (2004). The Cognitive Perspective: A Valuable Tool for Answering Entrepreneurship’s Basic “Why” Questions. Journal of Business Venturing 19, 221-239.
Barsky, R.B., F.T. Juster, M.S. Kimball, and M.D. Shapiro (1997). Preference Parameters and Behavioral Heterogeneity: An Experimental Approach in the Health and Retirement Study. Quarterly Journal of Economics 112(2), 537-579.
Barrick, M.R. and M.K. Mount (1991). The Big Five Personality Dimensions and Job Performance: a Meta-Analysis. Personal Psychology 44, 1-26.
Barrick, M.R. and M.K. Mount (2005). Yes, Personality Matters: Moving on to More Important Matters. Human Performance 18, 359-372.
Bates, T. (2005). Analysis of young, small firms that have closed: Delineating successful from unsuccessful closure. Journal of Business Venturing 20, 343–358.
Baum, J.R. and E.A. Locke (2004). The Relation of Entrepreneurial Traits, Skill, and Motivation to Subsequent Venture Growth. Journal of Applied Psychology 89, 587-598.
Begley, T.M. and D.B. Boyd (1987). Psychological Characteristics Associated with Performance in Entrepreneurial Firms and Small Businesses. Journal of Business Venturing (2), 79-93.
Blanchflower, D. and A. Oswald (1998). What Makes an Entrepreneur? Journal of Labor Economics 16, 26-60.
Borghans, L., A.L. Duckworth, J.J. Heckman, and B. ter Weel (2008). The Economics and Psychology of Personality Traits. Journal of Human Resources 43(4), 972–1059.
Brandstätter, H. (1997). Becoming an Entrepreneur — A Question of Personality Structure? Journal of Economic Psychology 18, 157-177.
34
Caliendo, M., D. Cobb-Clark, and A. Uhlendorff (2008). Job Search Behavior, Search Effort, Reservation Wage, Locus of Control, Unemployment Duration. IZA Discussion Paper 4750, Institute for the Study of Labor.
Caliendo, M., F.M. Fossen, and A.S. Kritikos (2009). Risk Attitudes of Nascent Entrepreneurs – New Evidence from an Experimentally-Validated Survey. Small Business Economics 32(2), 153-167.
Caliendo, M., F.M. Fossen, and A.S. Kritikos (2010). The Impact of Risk Attitudes on Entrepreneurial Survival. Journal of Economic Behavior and Organization 76, 45-63.
Caliendo, M., F.M. Fossen, and A.S. Kritikos (2011). Trust, Positive Reciprocity, and Negative Reciprocity: Do These Traits Impact Entrepreneurial Dynamics? Forthcoming in: Journal of Economic Psychology.
Caliendo, M. and A.S. Kritikos (2008). Is Entrepreneurial Success Predictable? An Ex-Ante Analysis of the Character-Based Approach. Kyklos 61, 189-214.
Caspi, A., B.W. Roberts, and R.L. Shiner (2005). Personality Development: Stability and Change. Annual Review of Psychology 56, 453-484.
Cattell, R.B. (1987). Intelligence: Its Structure, Growth, and Action. New York, NY: Elsevier Science.
Chell, E., J. Harworth, and S. Brearley (1991). The Search for Entrepreneurial Traits. In: E. Chell, J. Harworth, and S. Brearley (eds.), The Entrepreneurial Personality: Concepts, Cases and Categories, Routledge Small Business Series, 29-53. London, UK: Thomson Learning.
Chen, C.C., P.G. Greene, and A. Crick (1998). Does Entrepreneurial Self-Efficacy Distinguish Entrepreneurs from Managers? Journal of Business Venturing 13, 295-316.
Ciavarella, M.A., A.K. Buchholtz, C.M. Riordan, R.D. Gatewood, and G.S. Stokes (2004). The Big Five and Venture Survival: Is There a Linkage? Journal of Business Venturing 19, 465-483.
Costa, P.T. and R.R. McCrae (1988). From Catalog to Classification: Murray's Needs and the Five-Factor Model. Journal of Personality and Social Psychology 55, 258-265.
Costa, P.T. and R.R. McCrae (1992). Revised NEO Personality Inventory (NEO-PI-R) and NEO Five Factor Inventory (NEO-FFI) Professional Manual. Odessa, FL: PAR.
Costa, P.T., R.R. McCrae, and J.L. Holland (1984). Personality and Vocational Interest in an Adult Sample. Journal of Applied Psychology 69, 390-400.
Cox, J.C. (2004). How to Identify Trust and Reciprocity. Games and Economic Behaviour 46, 260-281
Cramer, J.S., J. Hartog, N. Jonker, and C.M. van Praag (2002). Low Risk Aversion Encourages the Choice for Entrepreneurship: An Empirical Test of a Truism. Journal of Economic Behavior and Organization 48(1), 29-36.
35
DeNeve, K.M. and H. Cooper (1998). The Happy Personality: a Meta Analysis of 137 Personality Traits and Subjective Well-Being. Psychological Bulletin 124, 197-229.
Digman, J.M. (1997). Higher-Order Factors of the Big Five. Journal of Applied Psychology 73, 1246-1256.
Dohmen, T., A. Falk, D. Huffman, and U. Sunde (2010). Are Risk Aversion and Impatience Related to Cognitive Ability? American Economic Review 100(3), 1238-1260.
Dohmen, T., A. Falk, D. Huffman, U. Sunde, J. Schupp, and G.G. Wagner (2005). Individual Risk Attitudes: New Evidence from a Large, Representative, Experimentally-Validated Survey. IZA Discussion Paper 1730, Institute for the Study of Labor. Forthcoming in: Journal of the European Economic Association.
Dudley, N.M., K.A. Orvis, J.E. Lebiecki, and J.M. Cortina (2006). A Meta-Analytic Investigation of Conscientiousness in the Prediction of Job Performance: Examining the Intercorrelations and the Incremental Validity of Narrow Traits. Journal of Applied Psychology 91, 40-57.
Dunn, T., and D. Holtz-Eakin (2000). Financial Capital, Human Capital, and the Transition to Self-Employment: Evidence from Intergenerational Links. Journal of Labour Economics 18(2), 282-305.
Economist (2009). Global Heroes, a Special Report on Entrepreneurship, March 14th, 2009.
Efron, B. (1978). Regression and ANOVA with Zero-One Data: Measures of Residual Variation. Journal of the American Statistical Association 73(361), 113-121.
Evans, D.S. and B. Jovanovic (1989). An Estimated Model of Entrepreneurial Choice under Liquidity Constraints. Journal of Political Economy 97(4), 808-827.
Evans, D.S. and L.S. Leighton (1989). Some Empirical Aspects of Entrepreneurship. American Economic Review 79(3), 519-535.
Fairlie, R. and A. Robb (2009). Gender Differences in Business Performance: Evidence from the Characteristics of Business Owners Survey. Small Business Economics 33(4), 375-395.
Fossen, F.M. (2009). Gender Differences in Entrepreneurial Choice and Risk Aversion: A Decomposition Based on a Microeconometric Model. DIW Discussion Paper 936, German Institute for Economic Research. Forthcoming in: Applied Economics.
Fuchs-Schündeln, N., and M. Schündeln (2005). Precautionary Savings and Self-Selection: Evidence from the German Reunification “Experiment”. Quarterly Journal of Economics 120(3), 1085-1120.
Gartner, W.B. (1985). A Conceptual Framework for Describing the Phenomenon of New Venture Creation. Academy of Management Review 10, 696-706.
Greene, W.H. (2008). Econometric Analysis, 6th Revised Edition. Upper Saddle River, NJ: Prentice Hall.
36
Hartog, J., A. Ferrer-i-Carbonell, and N. Jonker (2002). Linking Measured Risk Aversion to Individual Characteristics. Kyklos 55(1), 3-26.
Hartog, J., M. van Praag, and J. van der Sluis (2008). If You Are So Smart, Why Aren’t You an Entrepreneur? Returns to Cognitive and Social Ability: Entrepreneurs versus Employees. IZA Discussion Paper 3648, Institute for the Study of Labor. Forthcoming in: Journal of Economics and Management Strategy.
Heckman, J. (1979). Sample Selection Bias as a Specification Error. Econometrica 47(1), 153-161.
Heineck, G. and S. Anger (2010). The Returns to Cognitive Abilities and Personality Traits in Germany. Labour Economics 17(3), 535-546.
Herron, L. and R.B. Robinson (1993). A Structural Model of the Effects of Entrepreneurial Characteristics on Venture Performance. Journal of Business Venturing 8, 281-294.
Hurst, E. and A. Lusardi (2004). Liquidity Constraints, Household Wealth, and Entrepreneurship. Journal of Political Economy 112(2), 319-347.
Jaeger, D.A., T. Dohmen, A. Falk, D. Huffman, and U. Sunde (2010). Direct Evidence on Risk Attitudes and Migration. Review of Economics and Statistics 92(3), 684–689.
Jenkins, S.P. (1995). Easy Estimation Methods for Discrete-Time Duration Models. Oxford Bulletin of Economics and Statistics 57(1), 129-138.
Judge, T.A., C.A. Higgins, C.J. Thoresen, and M.R. Barrick (1999). The Big Five Personality Traits, General Mental Ability, and Career Success across the Life Span. Personal Psychology 52, 621-652.
Kihlstrom, R. and J. Laffont (1979). A General Equilibrium Theory of Firm Formation Based on Risk Aversion. Journal of Political Economy 87, 719-748.
Lang, F.R., D. Weiss, A. Stocker, and B. von Rosenbladt (2007). Assessing Cognitive Capacities in Computer-Assisted Survey Research: Two Ultra-Short Tests of Intellectual Ability in the German Socio-Economic Panel (SOEP). Schmollers Jahrbuch – Journal of Applied Social Science Studies 127(1), 183-192.
Lazear, E.P. (2004). Balanced Skills and Entrepreneurship. American Economic Review, Papers and Proceedings 94, 208-211.
Lazear, E.M. (2005). Entrepreneurship. Journal of Labor Economics 23, 649-680.
Levenson, H. (1973). Multidimensional Locus of Control in Psychiatric Patient. Journal of Consulting and Clinical Psychology 41, 397-404.
Logan, J. (2009). Dyslexic Entrepreneurs: the Incidence; Their Coping Strategies and Their Business Skills. Dyslexia 15, 328-346.
McClelland, D. (1961). The Achievement Motive in Economic Growth. American Economic Review 51, 179-189.
37
McCrae, R.R. (1987). Creativity, Divergent Thinking, and Openness to Experience. Journal of Personality and Social Psychology 52, 1258-1265.
McFadden, D. (1974). The Measurement of Urban Travel Demand. Journal of Public Economics 3(4), 303-328.
McKelvey, R.D. and W. Zavoina (1975). A Statistical Model for the Analysis of Ordinal Level Dependent Variables. Journal of Mathematical Sociology 4, 103-120.
Mueller, S.L. and A.S. Thomas (2000). Culture and Entrepreneurial Potential: a Nine Country Study of Locus of Control and Innovativeness. Journal of Business Venturing 16, 51-75.
Müller, G.F. and C. Gappisch (2005). Personality Types of Entrepreneurs. Psychological Report 96, 737-746.
Nicolaou, N., S. Shane, L. Cherkas, J. Hunkin, and T.D. Spector (2008). Is the Tendency to Engage in Entrepreneurship Genetic? Management Science 54, 167–179.
Nicholson, N., E. Soane, M. Fenton-O’Creevy, and P. Willman (2005). Personality and Domain-Specific Risk-Taking. Journal of Risk Research 8(2), 157-176.
Paunonen, S.V. and M.C. Ashton (2001). Big Five Factors and the Prediction of Behavior. Journal of Personality and Social Psychology 81, 524-539.
Radl, J. (2007). Individuelle Determinanten des Renteneintrittsalters. Wirtschaft und Statistik 5, 511-520.
Rauch, A. and M. Frese (2000). Psychological Approaches to Entrepreneurial Success. A General Model and an Overview of Findings. In: C.L. Cooper and I.T. Robertson (eds.), International Review of Industrial and Organizational Psychology, 101-142. Chichester, UK: Wiley.
Rauch, A. and M. Frese (2007). Let’s Put the Person Back into Entrepreneurship Research: A Meta-Analysis on the Relationship Between Business Owners’ Personality Traits, Business Creation, and Success. European Journal of Work and Organizational Psychology 16, 353-385.
Rotter, J.B. (1966). Generalized Expectancies for Internal versus External Control of Reinforcement. Psychological Monographs 80, 1-2.
Sahakian, B., A. Lawrence, L. Clark, J.N. Labuzetta, and S. Vyakarnum (2008). The Innovative Brain. Nature 456(13), 168-169.
Schumpeter, J.A. (1911). The Theory of Economic Development. Cambridge, MA: Harvard University Press.
Schwarz, G. (1978). Estimating the Dimension of a Model. Annals of Statistics 6, 461-464.
Shane, S., N. Nicolaou, L. Cherkas, and T.D. Spector (2010). Genetics, the Big Five, and the Tendency to Be Self-Employed. Journal of Applied Psychology 95(6), 1154-1162.
38
Smith, A. (1995). Symbol Digit Modalities Test. Los Angeles, CA: Western Psychological Services.
Stewart, W.H. and P.L. Roth (2001). Risk Propensity Differences between Entrepreneurs and Managers: A Meta-Analytic Review. Journal of Applied Psychology 86, 145-153.
Stewart, W.H., W.E. Watson, J.C. Carland, and J.W. Carland (1998). The Proclivity for Entrepreneurship: a Comparison of Entrepreneurs, Small Business Owners, and Corporative Managers. Journal of Business Venturing 14, 189-214.
Tett, R.P., J.R. Steele, and R.S. Beauregard (2003). Broad and Narrow Measures on Both Sides of the Personality-Job Performance Relationship. Journal of Organizational Behavior 24, 335-356.
Tewes, U. (1991). Hamburger-Wechsler Intelligenztest für Erwachsene. Bern, Switzerland: Huber.
Van de Ven, W.P.M.M. and B.M.S. van Praag (1981). The Demand for Deductibles in Private Health Insurance: A Probit Model with Sample Selection. Journal of Econometrics 17, 229-252.
Van Gelderen, M., M. Frese, and R. Thurik (2000). Strategies, Uncertainty and Performance of Small Business Startups. Small Business Economics 15, 165-181.
Van Praag, C.M. and J.S. Cramer (2001). The Roots of Entrepreneurship and Labour Demand: Individual Ability and Low Risk Aversion. Economica 68(269), 45-62.
Van Praag, C.M., A. van Witteloostuijn, and J. van der Sluis (2009). Returns for Entrepreneurs vs. Employees: The Effect of Education and Personal Control on the Relative Performance of Entrepreneurs vs. Wage Employees. IZA Discussion Paper 4628, Institute for the Study of Labor.
Vereshchagina, G. and H.A. Hopenhayn (2009). Risk Taking by Entrepreneurs. American Economic Review 99(5), 1808-1830.
Vinchur, A.J., J.S. Schippmann, F.S.I. Switzer, and P.L. Roth (1998). A Meta-Analytic Review of Predictors of Job Performance for Salespeople. Journal of Applied Psychology 83, 586-597.
Wagner, G.G., J.R. Frick, and J. Schupp (2007). The German Socio-Economic Panel Study (SOEP): Scope, Evolution and Enhancements. Journal of Applied Social Science Studies 127(1), 139-170.
Zhao, H. and S.E. Seibert (2006). The Big Five Personality Dimensions and Entrepreneurial Status: A Meta-Analytical Review. Journal of Applied Psychology 91(2), 259-271.
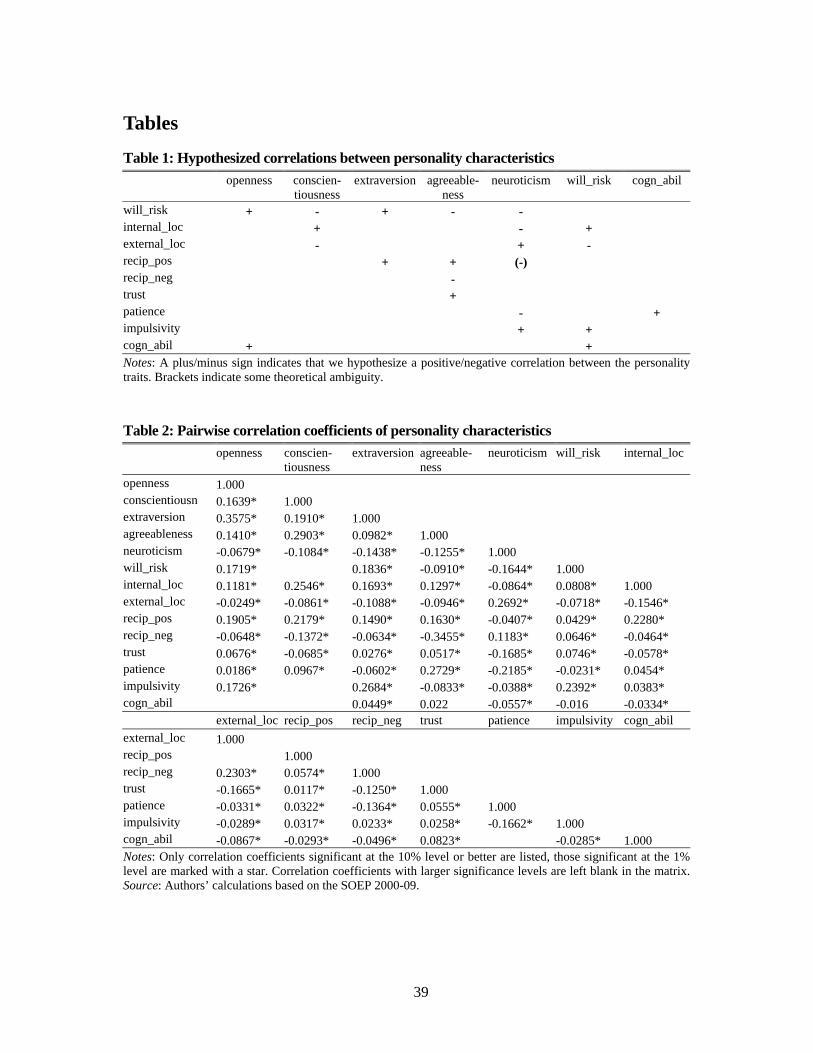
39
Tables
Table 1: Hypothesized correlations between personality characteristics
openness conscien-
tiousness extraversion agreeable-
ness neuroticism will_risk cogn_abil
will_risk + - + - - internal_loc + - + external_loc - + - recip_pos + + (-) recip_neg - trust + patience - + impulsivity + + cogn_abil + + Notes: A plus/minus sign indicates that we hypothesize a positive/negative correlation between the personality traits. Brackets indicate some theoretical ambiguity.
Table 2: Pairwise correlation coefficients of personality characteristics
openness conscien-
tiousness extraversion agreeable-
ness neuroticism will_risk internal_loc
openness 1.000 conscientiousn 0.1639* 1.000 extraversion 0.3575* 0.1910* 1.000 agreeableness 0.1410* 0.2903* 0.0982* 1.000 neuroticism -0.0679* -0.1084* -0.1438* -0.1255* 1.000 will_risk 0.1719* 0.1836* -0.0910* -0.1644* 1.000 internal_loc 0.1181* 0.2546* 0.1693* 0.1297* -0.0864* 0.0808* 1.000 external_loc -0.0249* -0.0861* -0.1088* -0.0946* 0.2692* -0.0718* -0.1546* recip_pos 0.1905* 0.2179* 0.1490* 0.1630* -0.0407* 0.0429* 0.2280* recip_neg -0.0648* -0.1372* -0.0634* -0.3455* 0.1183* 0.0646* -0.0464* trust 0.0676* -0.0685* 0.0276* 0.0517* -0.1685* 0.0746* -0.0578* patience 0.0186* 0.0967* -0.0602* 0.2729* -0.2185* -0.0231* 0.0454* impulsivity 0.1726* 0.2684* -0.0833* -0.0388* 0.2392* 0.0383* cogn_abil 0.0449* 0.022 -0.0557* -0.016 -0.0334* external_loc recip_pos recip_neg trust patience impulsivity cogn_abil external_loc 1.000 recip_pos 1.000 recip_neg 0.2303* 0.0574* 1.000 trust -0.1665* 0.0117* -0.1250* 1.000 patience -0.0331* 0.0322* -0.1364* 0.0555* 1.000 impulsivity -0.0289* 0.0317* 0.0233* 0.0258* -0.1662* 1.000 cogn_abil -0.0867* -0.0293* -0.0496* 0.0823* -0.0285* 1.000 Notes: Only correlation coefficients significant at the 10% level or better are listed, those significant at the 1% level are marked with a star. Correlation coefficients with larger significance levels are left blank in the matrix. Source: Authors’ calculations based on the SOEP 2000-09.
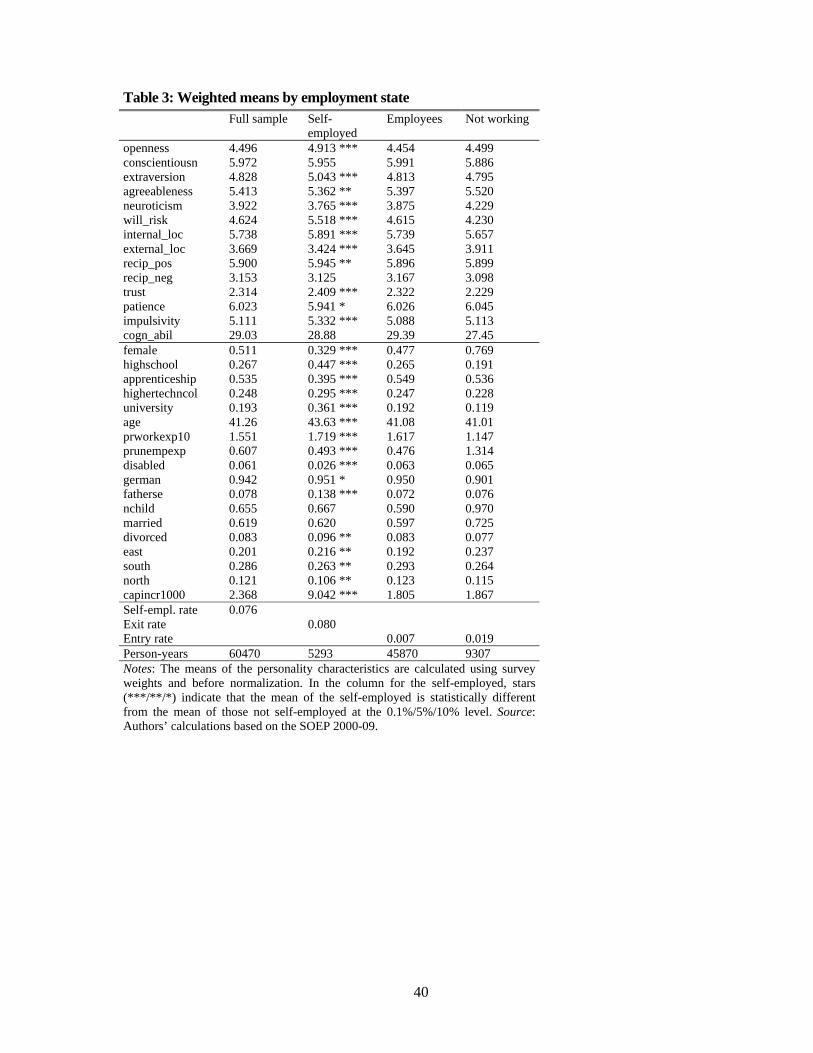
40
Table 3: Weighted means by employment state Full sample Self-
employed Employees Not working
openness 4.496 4.913 *** 4.454 4.499 conscientiousn 5.972 5.955 5.991 5.886 extraversion 4.828 5.043 *** 4.813 4.795 agreeableness 5.413 5.362 ** 5.397 5.520 neuroticism 3.922 3.765 *** 3.875 4.229 will_risk 4.624 5.518 *** 4.615 4.230 internal_loc 5.738 5.891 *** 5.739 5.657 external_loc 3.669 3.424 *** 3.645 3.911 recip_pos 5.900 5.945 ** 5.896 5.899 recip_neg 3.153 3.125 3.167 3.098 trust 2.314 2.409 *** 2.322 2.229 patience 6.023 5.941 * 6.026 6.045 impulsivity 5.111 5.332 *** 5.088 5.113 cogn_abil 29.03 28.88 29.39 27.45 female 0.511 0.329 *** 0.477 0.769 highschool 0.267 0.447 *** 0.265 0.191 apprenticeship 0.535 0.395 *** 0.549 0.536 highertechncol 0.248 0.295 *** 0.247 0.228 university 0.193 0.361 *** 0.192 0.119 age 41.26 43.63 *** 41.08 41.01 prworkexp10 1.551 1.719 *** 1.617 1.147 prunempexp 0.607 0.493 *** 0.476 1.314 disabled 0.061 0.026 *** 0.063 0.065 german 0.942 0.951 * 0.950 0.901 fatherse 0.078 0.138 *** 0.072 0.076 nchild 0.655 0.667 0.590 0.970 married 0.619 0.620 0.597 0.725 divorced 0.083 0.096 ** 0.083 0.077 east 0.201 0.216 ** 0.192 0.237 south 0.286 0.263 ** 0.293 0.264 north 0.121 0.106 ** 0.123 0.115 capincr1000 2.368 9.042 *** 1.805 1.867 Self-empl. rate 0.076 Exit rate 0.080 Entry rate 0.007 0.019 Person-years 60470 5293 45870 9307 Notes: The means of the personality characteristics are calculated using survey weights and before normalization. In the column for the self-employed, stars (***/**/*) indicate that the mean of the self-employed is statistically different from the mean of those not self-employed at the 0.1%/5%/10% level. Source: Authors’ calculations based on the SOEP 2000-09.
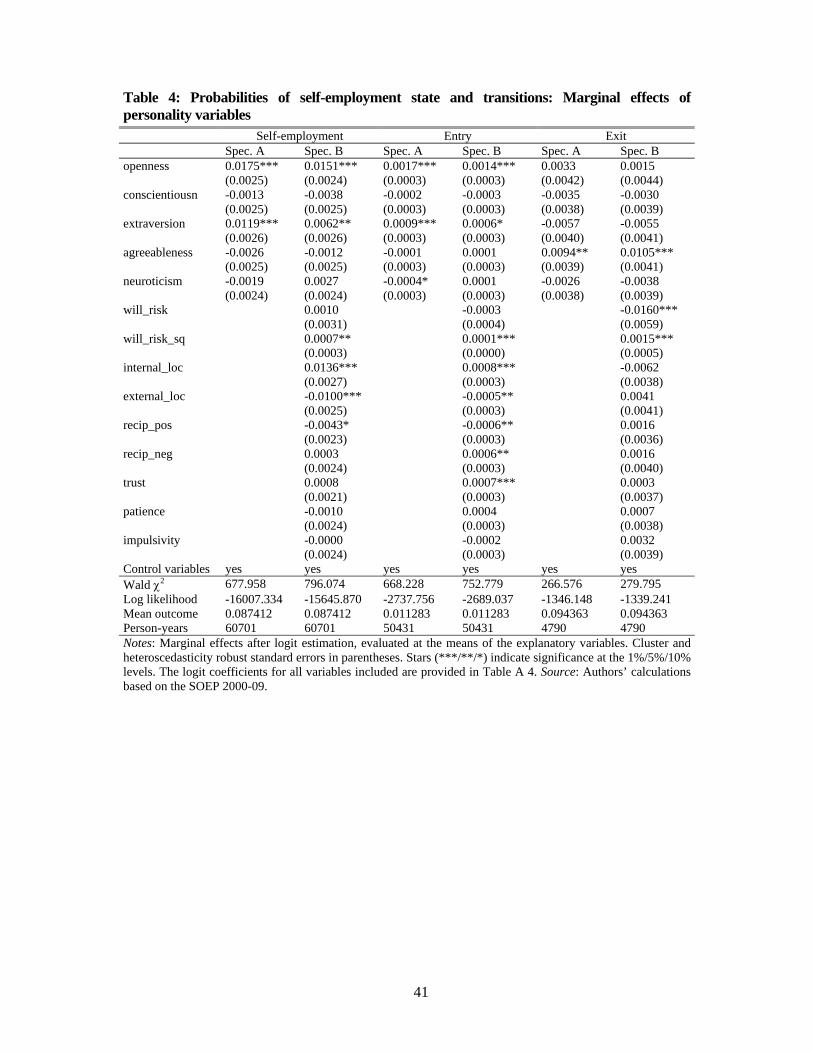
41
Table 4: Probabilities of self-employment state and transitions: Marginal effects of personality variables Self-employment Entry Exit Spec. A Spec. B Spec. A Spec. B Spec. A Spec. B openness 0.0175*** 0.0151*** 0.0017*** 0.0014*** 0.0033 0.0015 (0.0025) (0.0024) (0.0003) (0.0003) (0.0042) (0.0044) conscientiousn -0.0013 -0.0038 -0.0002 -0.0003 -0.0035 -0.0030 (0.0025) (0.0025) (0.0003) (0.0003) (0.0038) (0.0039) extraversion 0.0119*** 0.0062** 0.0009*** 0.0006* -0.0057 -0.0055 (0.0026) (0.0026) (0.0003) (0.0003) (0.0040) (0.0041) agreeableness -0.0026 -0.0012 -0.0001 0.0001 0.0094** 0.0105*** (0.0025) (0.0025) (0.0003) (0.0003) (0.0039) (0.0041) neuroticism -0.0019 0.0027 -0.0004* 0.0001 -0.0026 -0.0038 (0.0024) (0.0024) (0.0003) (0.0003) (0.0038) (0.0039) will_risk 0.0010 -0.0003 -0.0160*** (0.0031) (0.0004) (0.0059) will_risk_sq 0.0007** 0.0001*** 0.0015*** (0.0003) (0.0000) (0.0005) internal_loc 0.0136*** 0.0008*** -0.0062 (0.0027) (0.0003) (0.0038) external_loc -0.0100*** -0.0005** 0.0041 (0.0025) (0.0003) (0.0041) recip_pos -0.0043* -0.0006** 0.0016 (0.0023) (0.0003) (0.0036) recip_neg 0.0003 0.0006** 0.0016 (0.0024) (0.0003) (0.0040) trust 0.0008 0.0007*** 0.0003 (0.0021) (0.0003) (0.0037) patience -0.0010 0.0004 0.0007 (0.0024) (0.0003) (0.0038) impulsivity -0.0000 -0.0002 0.0032 (0.0024) (0.0003) (0.0039) Control variables yes yes yes yes yes yes Wald χ2 677.958 796.074 668.228 752.779 266.576 279.795 Log likelihood -16007.334 -15645.870 -2737.756 -2689.037 -1346.148 -1339.241 Mean outcome 0.087412 0.087412 0.011283 0.011283 0.094363 0.094363 Person-years 60701 60701 50431 50431 4790 4790 Notes: Marginal effects after logit estimation, evaluated at the means of the explanatory variables. Cluster and heteroscedasticity robust standard errors in parentheses. Stars (***/**/*) indicate significance at the 1%/5%/10% levels. The logit coefficients for all variables included are provided in Table A 4. Source: Authors’ calculations based on the SOEP 2000-09.
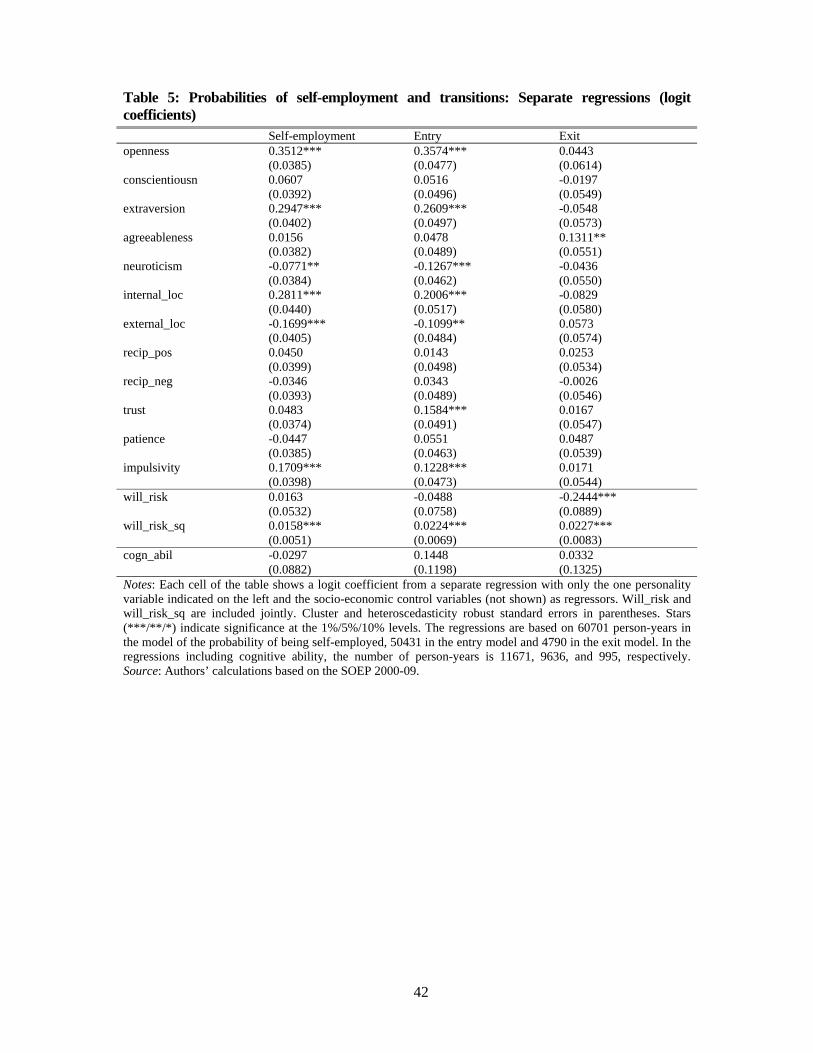
42
Table 5: Probabilities of self-employment and transitions: Separate regressions (logit coefficients) Self-employment Entry Exit openness 0.3512*** 0.3574*** 0.0443 (0.0385) (0.0477) (0.0614) conscientiousn 0.0607 0.0516 -0.0197 (0.0392) (0.0496) (0.0549) extraversion 0.2947*** 0.2609*** -0.0548 (0.0402) (0.0497) (0.0573) agreeableness 0.0156 0.0478 0.1311** (0.0382) (0.0489) (0.0551) neuroticism -0.0771** -0.1267*** -0.0436 (0.0384) (0.0462) (0.0550) internal_loc 0.2811*** 0.2006*** -0.0829 (0.0440) (0.0517) (0.0580) external_loc -0.1699*** -0.1099** 0.0573 (0.0405) (0.0484) (0.0574) recip_pos 0.0450 0.0143 0.0253 (0.0399) (0.0498) (0.0534) recip_neg -0.0346 0.0343 -0.0026 (0.0393) (0.0489) (0.0546) trust 0.0483 0.1584*** 0.0167 (0.0374) (0.0491) (0.0547) patience -0.0447 0.0551 0.0487 (0.0385) (0.0463) (0.0539) impulsivity 0.1709*** 0.1228*** 0.0171 (0.0398) (0.0473) (0.0544) will_risk 0.0163 -0.0488 -0.2444*** (0.0532) (0.0758) (0.0889) will_risk_sq 0.0158*** 0.0224*** 0.0227*** (0.0051) (0.0069) (0.0083) cogn_abil -0.0297 0.1448 0.0332 (0.0882) (0.1198) (0.1325) Notes: Each cell of the table shows a logit coefficient from a separate regression with only the one personality variable indicated on the left and the socio-economic control variables (not shown) as regressors. Will_risk and will_risk_sq are included jointly. Cluster and heteroscedasticity robust standard errors in parentheses. Stars (***/**/*) indicate significance at the 1%/5%/10% levels. The regressions are based on 60701 person-years in the model of the probability of being self-employed, 50431 in the entry model and 4790 in the exit model. In the regressions including cognitive ability, the number of person-years is 11671, 9636, and 995, respectively. Source: Authors’ calculations based on the SOEP 2000-09.
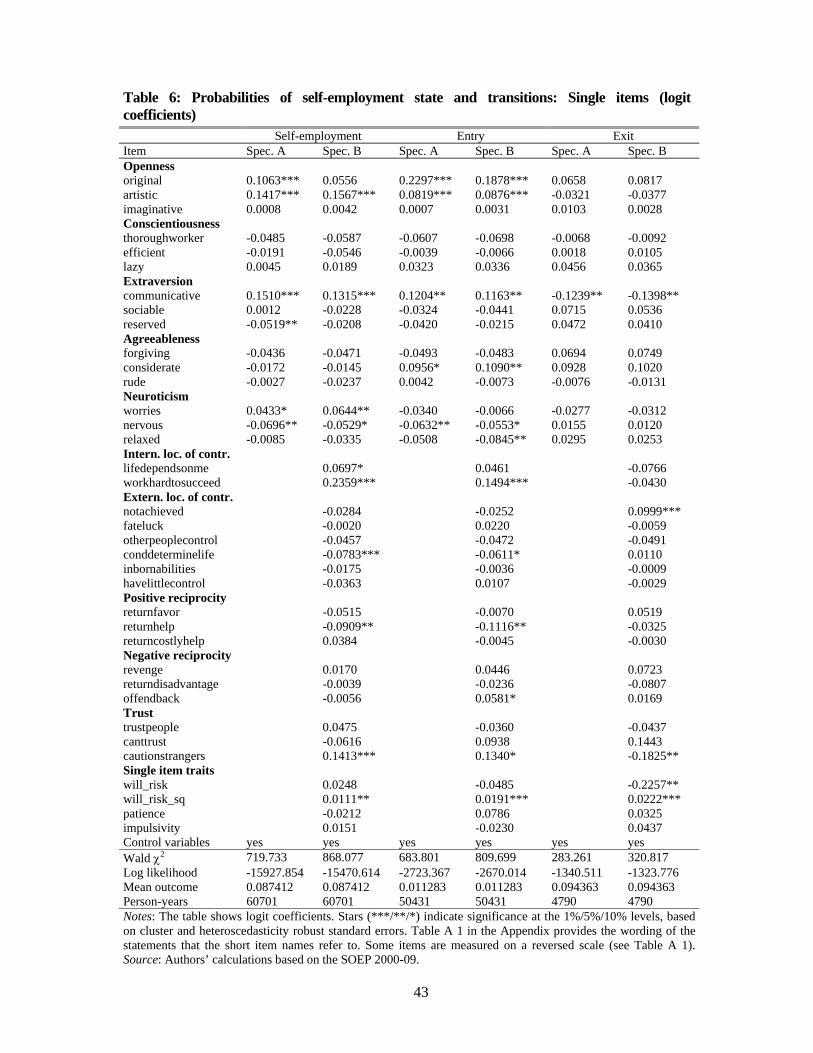
43
Table 6: Probabilities of self-employment state and transitions: Single items (logit coefficients) Self-employment Entry Exit Item Spec. A Spec. B Spec. A Spec. B Spec. A Spec. B Openness original 0.1063*** 0.0556 0.2297*** 0.1878*** 0.0658 0.0817 artistic 0.1417*** 0.1567*** 0.0819*** 0.0876*** -0.0321 -0.0377 imaginative 0.0008 0.0042 0.0007 0.0031 0.0103 0.0028 Conscientiousness thoroughworker -0.0485 -0.0587 -0.0607 -0.0698 -0.0068 -0.0092 efficient -0.0191 -0.0546 -0.0039 -0.0066 0.0018 0.0105 lazy 0.0045 0.0189 0.0323 0.0336 0.0456 0.0365 Extraversion communicative 0.1510*** 0.1315*** 0.1204** 0.1163** -0.1239** -0.1398** sociable 0.0012 -0.0228 -0.0324 -0.0441 0.0715 0.0536 reserved -0.0519** -0.0208 -0.0420 -0.0215 0.0472 0.0410 Agreeableness forgiving -0.0436 -0.0471 -0.0493 -0.0483 0.0694 0.0749 considerate -0.0172 -0.0145 0.0956* 0.1090** 0.0928 0.1020 rude -0.0027 -0.0237 0.0042 -0.0073 -0.0076 -0.0131 Neuroticism worries 0.0433* 0.0644** -0.0340 -0.0066 -0.0277 -0.0312 nervous -0.0696** -0.0529* -0.0632** -0.0553* 0.0155 0.0120 relaxed -0.0085 -0.0335 -0.0508 -0.0845** 0.0295 0.0253 Intern. loc. of contr. lifedependsonme 0.0697* 0.0461 -0.0766 workhardtosucceed 0.2359*** 0.1494*** -0.0430 Extern. loc. of contr. notachieved -0.0284 -0.0252 0.0999*** fateluck -0.0020 0.0220 -0.0059 otherpeoplecontrol -0.0457 -0.0472 -0.0491 conddeterminelife -0.0783*** -0.0611* 0.0110 inbornabilities -0.0175 -0.0036 -0.0009 havelittlecontrol -0.0363 0.0107 -0.0029 Positive reciprocity returnfavor -0.0515 -0.0070 0.0519 returnhelp -0.0909** -0.1116** -0.0325 returncostlyhelp 0.0384 -0.0045 -0.0030 Negative reciprocity revenge 0.0170 0.0446 0.0723 returndisadvantage -0.0039 -0.0236 -0.0807 offendback -0.0056 0.0581* 0.0169 Trust trustpeople 0.0475 -0.0360 -0.0437 canttrust -0.0616 0.0938 0.1443 cautionstrangers 0.1413*** 0.1340* -0.1825** Single item traits will_risk 0.0248 -0.0485 -0.2257** will_risk_sq 0.0111** 0.0191*** 0.0222*** patience -0.0212 0.0786 0.0325 impulsivity 0.0151 -0.0230 0.0437 Control variables yes yes yes yes yes yes Wald χ2 719.733 868.077 683.801 809.699 283.261 320.817 Log likelihood -15927.854 -15470.614 -2723.367 -2670.014 -1340.511 -1323.776 Mean outcome 0.087412 0.087412 0.011283 0.011283 0.094363 0.094363 Person-years 60701 60701 50431 50431 4790 4790 Notes: The table shows logit coefficients. Stars (***/**/*) indicate significance at the 1%/5%/10% levels, based on cluster and heteroscedasticity robust standard errors. Table A 1 in the Appendix provides the wording of the statements that the short item names refer to. Some items are measured on a reversed scale (see Table A 1). Source: Authors’ calculations based on the SOEP 2000-09.
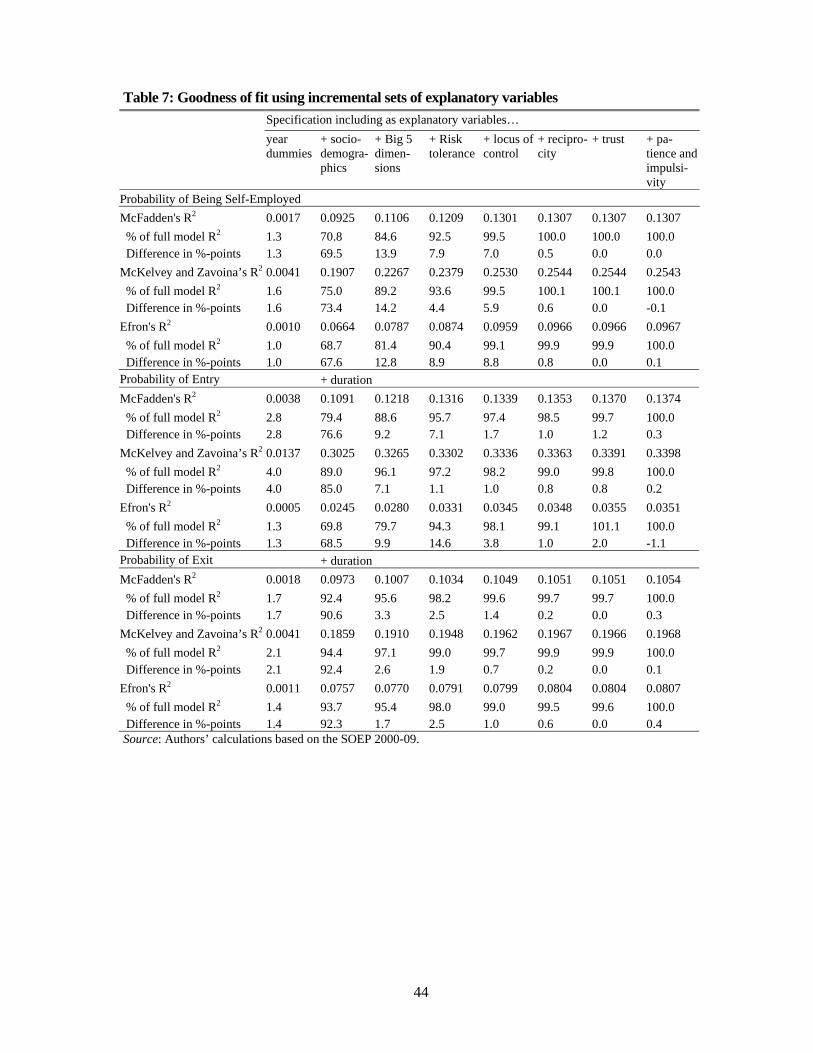
44
Table 7: Goodness of fit using incremental sets of explanatory variables Specification including as explanatory variables… year dummies
+ socio-demogra-phics
+ Big 5 dimen-sions
+ Risk tolerance
+ locus of control
+ recipro-city
+ trust + pa-tience and impulsi-vity
Probability of Being Self-Employed McFadden's R2 0.0017 0.0925 0.1106 0.1209 0.1301 0.1307 0.1307 0.1307 % of full model R2 1.3 70.8 84.6 92.5 99.5 100.0 100.0 100.0 Difference in %-points 1.3 69.5 13.9 7.9 7.0 0.5 0.0 0.0 McKelvey and Zavoina’s R2 0.0041 0.1907 0.2267 0.2379 0.2530 0.2544 0.2544 0.2543 % of full model R2 1.6 75.0 89.2 93.6 99.5 100.1 100.1 100.0 Difference in %-points 1.6 73.4 14.2 4.4 5.9 0.6 0.0 -0.1 Efron's R2 0.0010 0.0664 0.0787 0.0874 0.0959 0.0966 0.0966 0.0967 % of full model R2 1.0 68.7 81.4 90.4 99.1 99.9 99.9 100.0 Difference in %-points 1.0 67.6 12.8 8.9 8.8 0.8 0.0 0.1 Probability of Entry + duration McFadden's R2 0.0038 0.1091 0.1218 0.1316 0.1339 0.1353 0.1370 0.1374 % of full model R2 2.8 79.4 88.6 95.7 97.4 98.5 99.7 100.0 Difference in %-points 2.8 76.6 9.2 7.1 1.7 1.0 1.2 0.3 McKelvey and Zavoina’s R2 0.0137 0.3025 0.3265 0.3302 0.3336 0.3363 0.3391 0.3398 % of full model R2 4.0 89.0 96.1 97.2 98.2 99.0 99.8 100.0 Difference in %-points 4.0 85.0 7.1 1.1 1.0 0.8 0.8 0.2 Efron's R2 0.0005 0.0245 0.0280 0.0331 0.0345 0.0348 0.0355 0.0351 % of full model R2 1.3 69.8 79.7 94.3 98.1 99.1 101.1 100.0 Difference in %-points 1.3 68.5 9.9 14.6 3.8 1.0 2.0 -1.1 Probability of Exit + duration McFadden's R2 0.0018 0.0973 0.1007 0.1034 0.1049 0.1051 0.1051 0.1054 % of full model R2 1.7 92.4 95.6 98.2 99.6 99.7 99.7 100.0 Difference in %-points 1.7 90.6 3.3 2.5 1.4 0.2 0.0 0.3 McKelvey and Zavoina’s R2 0.0041 0.1859 0.1910 0.1948 0.1962 0.1967 0.1966 0.1968 % of full model R2 2.1 94.4 97.1 99.0 99.7 99.9 99.9 100.0 Difference in %-points 2.1 92.4 2.6 1.9 0.7 0.2 0.0 0.1 Efron's R2 0.0011 0.0757 0.0770 0.0791 0.0799 0.0804 0.0804 0.0807 % of full model R2 1.4 93.7 95.4 98.0 99.0 99.5 99.6 100.0 Difference in %-points 1.4 92.3 1.7 2.5 1.0 0.6 0.0 0.4 Source: Authors’ calculations based on the SOEP 2000-09.
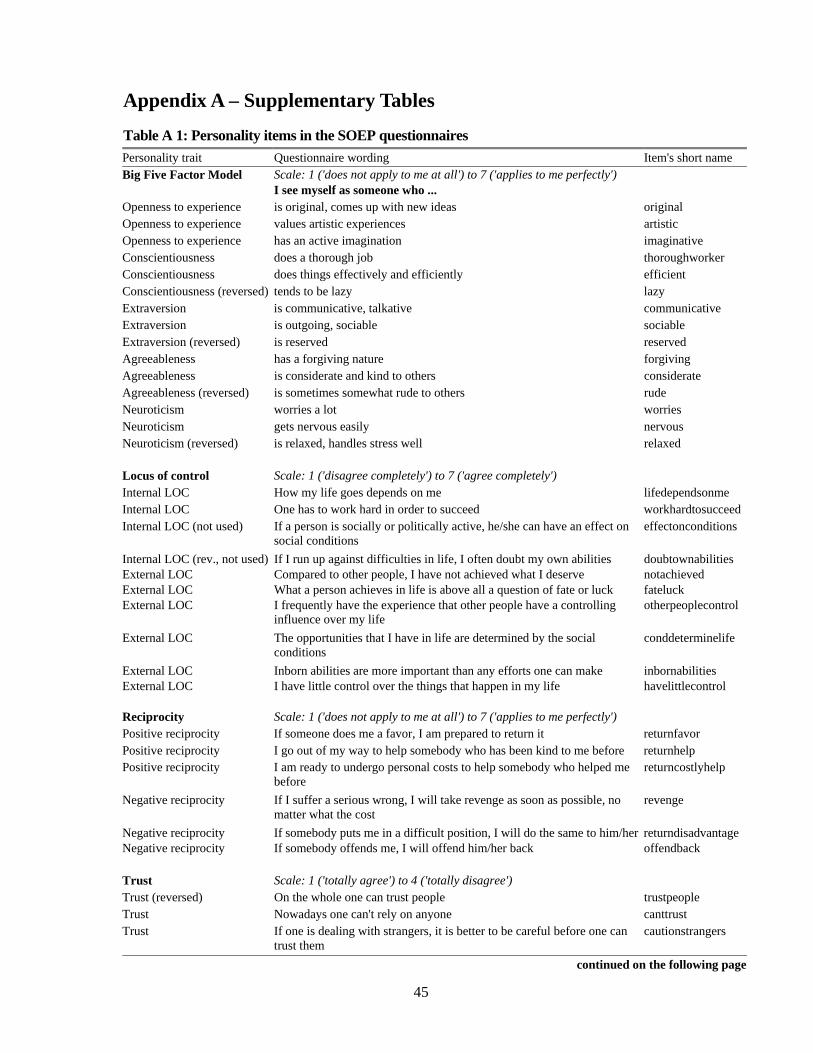
45
Appendix A – Supplementary Tables
Table A 1: Personality items in the SOEP questionnaires Personality trait Questionnaire wording Item's short name Big Five Factor Model Scale: 1 ('does not apply to me at all') to 7 ('applies to me perfectly') I see myself as someone who ... Openness to experience is original, comes up with new ideas original Openness to experience values artistic experiences artistic Openness to experience has an active imagination imaginative Conscientiousness does a thorough job thoroughworker Conscientiousness does things effectively and efficiently efficient Conscientiousness (reversed) tends to be lazy lazy Extraversion is communicative, talkative communicative Extraversion is outgoing, sociable sociable Extraversion (reversed) is reserved reserved Agreeableness has a forgiving nature forgiving Agreeableness is considerate and kind to others considerate Agreeableness (reversed) is sometimes somewhat rude to others rude Neuroticism worries a lot worries Neuroticism gets nervous easily nervous Neuroticism (reversed) is relaxed, handles stress well relaxed Locus of control Scale: 1 ('disagree completely') to 7 ('agree completely') Internal LOC How my life goes depends on me lifedependsonme Internal LOC One has to work hard in order to succeed workhardtosucceedInternal LOC (not used) If a person is socially or politically active, he/she can have an effect on
social conditions effectonconditions
Internal LOC (rev., not used) If I run up against difficulties in life, I often doubt my own abilities doubtownabilities External LOC Compared to other people, I have not achieved what I deserve notachieved External LOC What a person achieves in life is above all a question of fate or luck fateluck External LOC I frequently have the experience that other people have a controlling
influence over my life otherpeoplecontrol
External LOC The opportunities that I have in life are determined by the social conditions
conddeterminelife
External LOC Inborn abilities are more important than any efforts one can make inbornabilities External LOC I have little control over the things that happen in my life havelittlecontrol Reciprocity Scale: 1 ('does not apply to me at all') to 7 ('applies to me perfectly') Positive reciprocity If someone does me a favor, I am prepared to return it returnfavor Positive reciprocity I go out of my way to help somebody who has been kind to me before returnhelp Positive reciprocity I am ready to undergo personal costs to help somebody who helped me
before returncostlyhelp
Negative reciprocity If I suffer a serious wrong, I will take revenge as soon as possible, no matter what the cost
revenge
Negative reciprocity If somebody puts me in a difficult position, I will do the same to him/her returndisadvantage Negative reciprocity If somebody offends me, I will offend him/her back offendback Trust Scale: 1 ('totally agree') to 4 ('totally disagree') Trust (reversed) On the whole one can trust people trustpeople Trust Nowadays one can't rely on anyone canttrust Trust If one is dealing with strangers, it is better to be careful before one can
trust them cautionstrangers
continued on the following page
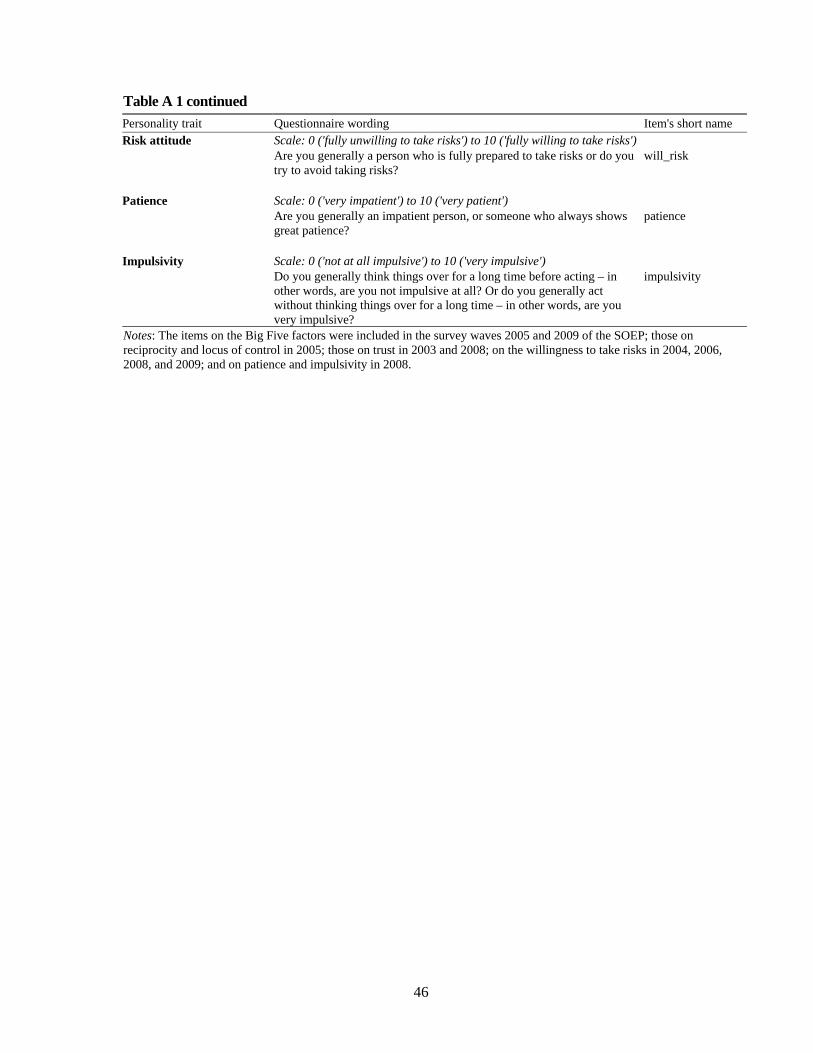
46
Table A 1 continued Personality trait Questionnaire wording Item's short name Risk attitude Scale: 0 ('fully unwilling to take risks') to 10 ('fully willing to take risks') Are you generally a person who is fully prepared to take risks or do you
try to avoid taking risks? will_risk
Patience Scale: 0 ('very impatient') to 10 ('very patient') Are you generally an impatient person, or someone who always shows
great patience? patience
Impulsivity Scale: 0 ('not at all impulsive') to 10 ('very impulsive') Do you generally think things over for a long time before acting – in
other words, are you not impulsive at all? Or do you generally act without thinking things over for a long time – in other words, are you very impulsive?
impulsivity
Notes: The items on the Big Five factors were included in the survey waves 2005 and 2009 of the SOEP; those on reciprocity and locus of control in 2005; those on trust in 2003 and 2008; on the willingness to take risks in 2004, 2006, 2008, and 2009; and on patience and impulsivity in 2008.
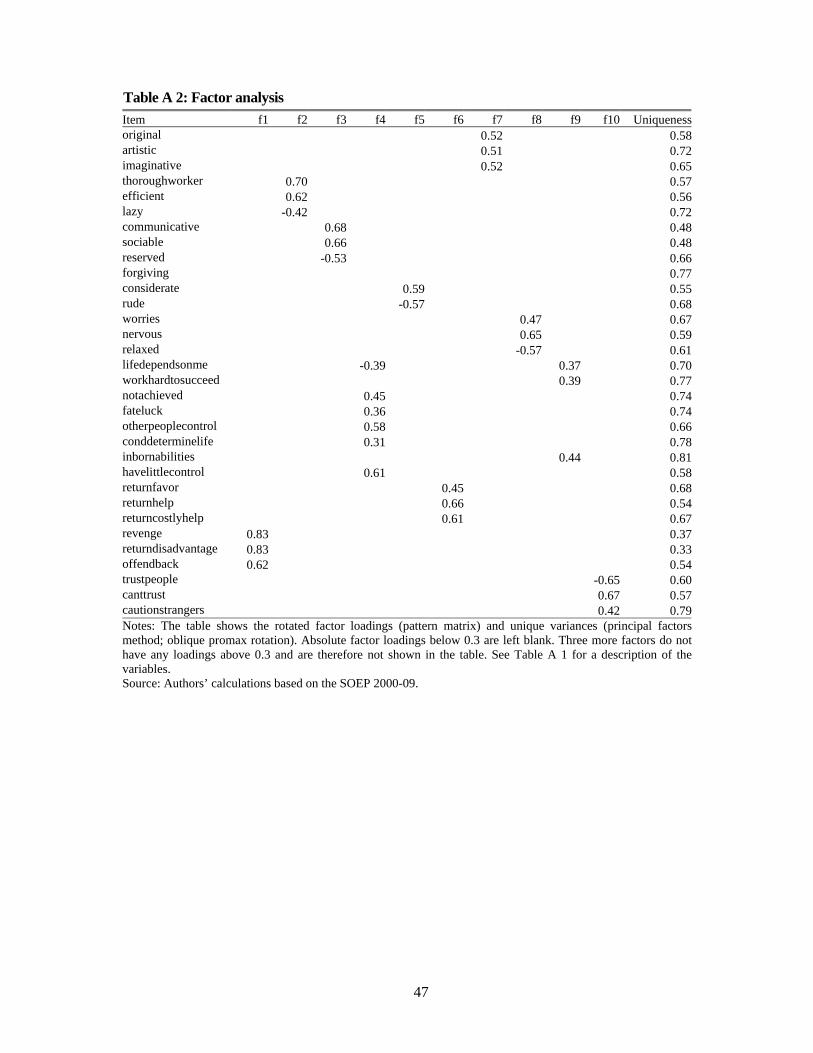
47
Table A 2: Factor analysis Item f1 f2 f3 f4 f5 f6 f7 f8 f9 f10 Uniquenessoriginal 0.52 0.58artistic 0.51 0.72imaginative 0.52 0.65thoroughworker 0.70 0.57efficient 0.62 0.56lazy -0.42 0.72communicative 0.68 0.48sociable 0.66 0.48reserved -0.53 0.66forgiving 0.77considerate 0.59 0.55rude -0.57 0.68worries 0.47 0.67nervous 0.65 0.59relaxed -0.57 0.61lifedependsonme -0.39 0.37 0.70workhardtosucceed 0.39 0.77notachieved 0.45 0.74fateluck 0.36 0.74otherpeoplecontrol 0.58 0.66conddeterminelife 0.31 0.78inbornabilities 0.44 0.81havelittlecontrol 0.61 0.58returnfavor 0.45 0.68returnhelp 0.66 0.54returncostlyhelp 0.61 0.67revenge 0.83 0.37returndisadvantage 0.83 0.33offendback 0.62 0.54trustpeople -0.65 0.60canttrust 0.67 0.57cautionstrangers 0.42 0.79Notes: The table shows the rotated factor loadings (pattern matrix) and unique variances (principal factorsmethod; oblique promax rotation). Absolute factor loadings below 0.3 are left blank. Three more factors do not have any loadings above 0.3 and are therefore not shown in the table. See Table A 1 for a description of the variables. Source: Authors’ calculations based on the SOEP 2000-09.
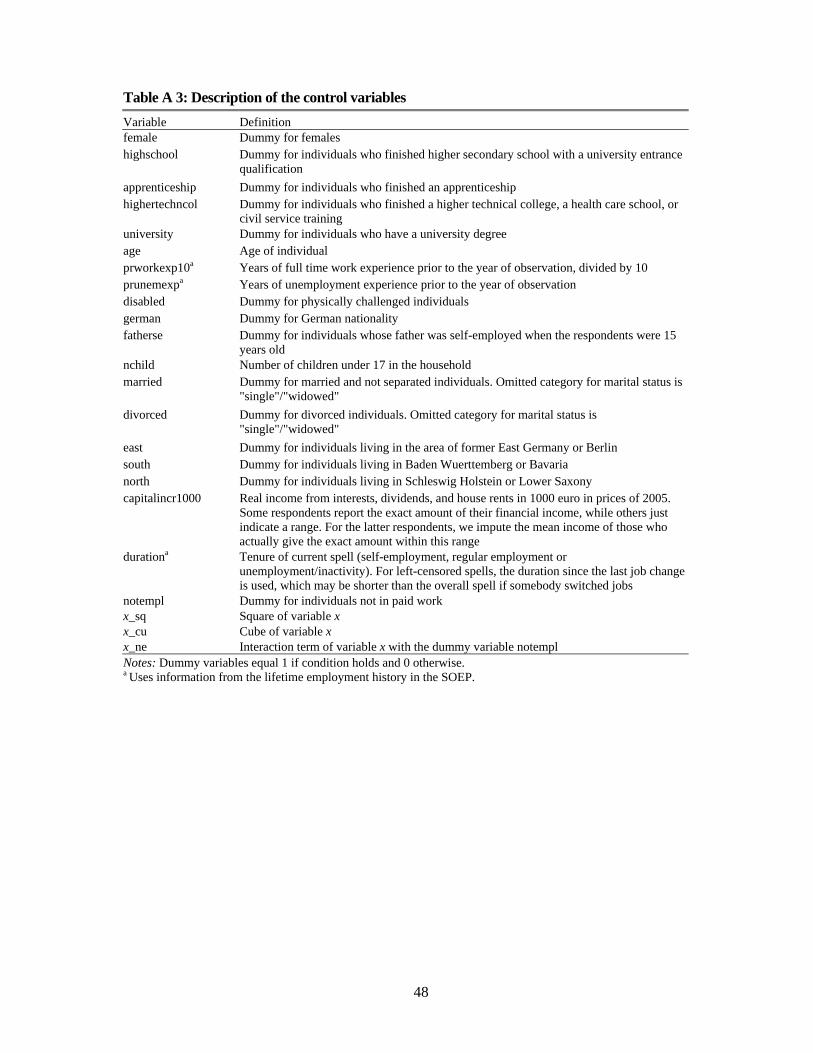
48
Table A 3: Description of the control variables Variable Definition female Dummy for females highschool Dummy for individuals who finished higher secondary school with a university entrance
qualification apprenticeship Dummy for individuals who finished an apprenticeship highertechncol Dummy for individuals who finished a higher technical college, a health care school, or
civil service training university Dummy for individuals who have a university degree age Age of individual prworkexp10a Years of full time work experience prior to the year of observation, divided by 10 prunemexpa Years of unemployment experience prior to the year of observation disabled Dummy for physically challenged individuals german Dummy for German nationality fatherse Dummy for individuals whose father was self-employed when the respondents were 15
years old nchild Number of children under 17 in the household married Dummy for married and not separated individuals. Omitted category for marital status is
"single"/"widowed" divorced Dummy for divorced individuals. Omitted category for marital status is
"single"/"widowed" east Dummy for individuals living in the area of former East Germany or Berlin south Dummy for individuals living in Baden Wuerttemberg or Bavaria north Dummy for individuals living in Schleswig Holstein or Lower Saxony capitalincr1000 Real income from interests, dividends, and house rents in 1000 euro in prices of 2005.
Some respondents report the exact amount of their financial income, while others just indicate a range. For the latter respondents, we impute the mean income of those who actually give the exact amount within this range
durationa Tenure of current spell (self-employment, regular employment or unemployment/inactivity). For left-censored spells, the duration since the last job change is used, which may be shorter than the overall spell if somebody switched jobs
notempl Dummy for individuals not in paid work x_sq Square of variable x x_cu Cube of variable x x_ne Interaction term of variable x with the dummy variable notempl Notes: Dummy variables equal 1 if condition holds and 0 otherwise. a Uses information from the lifetime employment history in the SOEP.
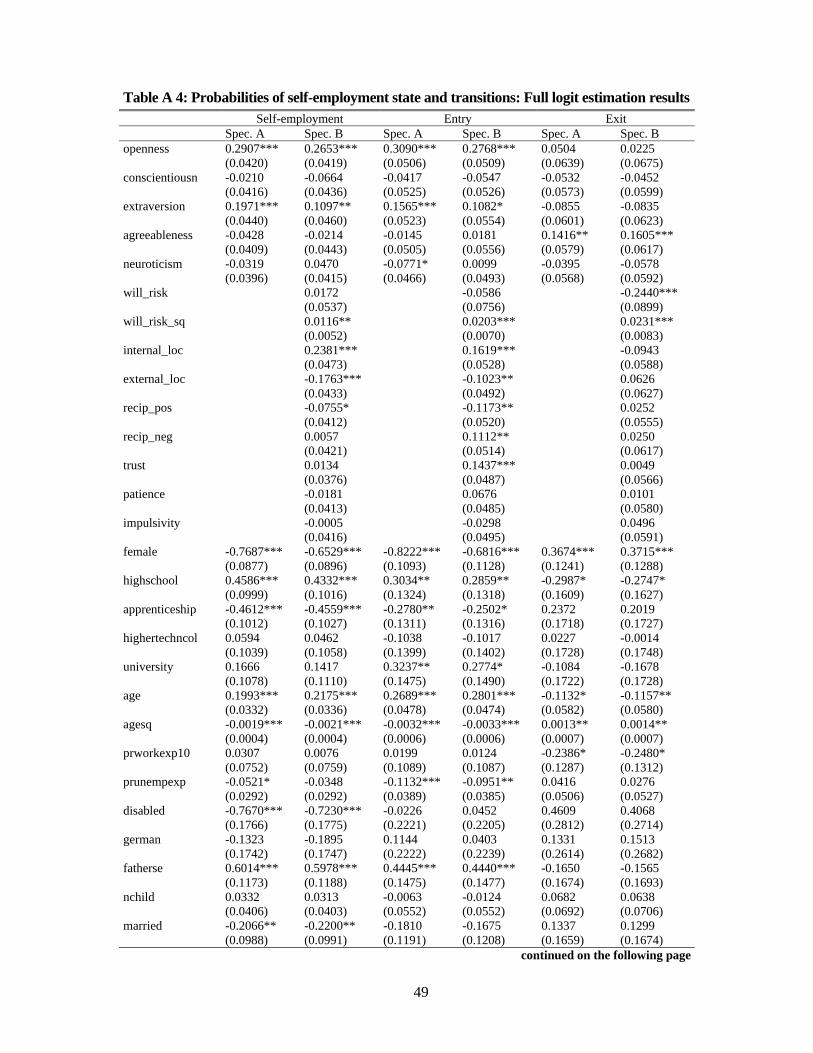
49
Table A 4: Probabilities of self-employment state and transitions: Full logit estimation results Self-employment Entry Exit Spec. A Spec. B Spec. A Spec. B Spec. A Spec. B openness 0.2907*** 0.2653*** 0.3090*** 0.2768*** 0.0504 0.0225 (0.0420) (0.0419) (0.0506) (0.0509) (0.0639) (0.0675) conscientiousn -0.0210 -0.0664 -0.0417 -0.0547 -0.0532 -0.0452 (0.0416) (0.0436) (0.0525) (0.0526) (0.0573) (0.0599) extraversion 0.1971*** 0.1097** 0.1565*** 0.1082* -0.0855 -0.0835 (0.0440) (0.0460) (0.0523) (0.0554) (0.0601) (0.0623) agreeableness -0.0428 -0.0214 -0.0145 0.0181 0.1416** 0.1605*** (0.0409) (0.0443) (0.0505) (0.0556) (0.0579) (0.0617) neuroticism -0.0319 0.0470 -0.0771* 0.0099 -0.0395 -0.0578 (0.0396) (0.0415) (0.0466) (0.0493) (0.0568) (0.0592) will_risk 0.0172 -0.0586 -0.2440*** (0.0537) (0.0756) (0.0899) will_risk_sq 0.0116** 0.0203*** 0.0231*** (0.0052) (0.0070) (0.0083) internal_loc 0.2381*** 0.1619*** -0.0943 (0.0473) (0.0528) (0.0588) external_loc -0.1763*** -0.1023** 0.0626 (0.0433) (0.0492) (0.0627) recip_pos -0.0755* -0.1173** 0.0252 (0.0412) (0.0520) (0.0555) recip_neg 0.0057 0.1112** 0.0250 (0.0421) (0.0514) (0.0617) trust 0.0134 0.1437*** 0.0049 (0.0376) (0.0487) (0.0566) patience -0.0181 0.0676 0.0101 (0.0413) (0.0485) (0.0580) impulsivity -0.0005 -0.0298 0.0496 (0.0416) (0.0495) (0.0591) female -0.7687*** -0.6529*** -0.8222*** -0.6816*** 0.3674*** 0.3715*** (0.0877) (0.0896) (0.1093) (0.1128) (0.1241) (0.1288) highschool 0.4586*** 0.4332*** 0.3034** 0.2859** -0.2987* -0.2747* (0.0999) (0.1016) (0.1324) (0.1318) (0.1609) (0.1627) apprenticeship -0.4612*** -0.4559*** -0.2780** -0.2502* 0.2372 0.2019 (0.1012) (0.1027) (0.1311) (0.1316) (0.1718) (0.1727) highertechncol 0.0594 0.0462 -0.1038 -0.1017 0.0227 -0.0014 (0.1039) (0.1058) (0.1399) (0.1402) (0.1728) (0.1748) university 0.1666 0.1417 0.3237** 0.2774* -0.1084 -0.1678 (0.1078) (0.1110) (0.1475) (0.1490) (0.1722) (0.1728) age 0.1993*** 0.2175*** 0.2689*** 0.2801*** -0.1132* -0.1157** (0.0332) (0.0336) (0.0478) (0.0474) (0.0582) (0.0580) agesq -0.0019*** -0.0021*** -0.0032*** -0.0033*** 0.0013** 0.0014** (0.0004) (0.0004) (0.0006) (0.0006) (0.0007) (0.0007) prworkexp10 0.0307 0.0076 0.0199 0.0124 -0.2386* -0.2480* (0.0752) (0.0759) (0.1089) (0.1087) (0.1287) (0.1312) prunempexp -0.0521* -0.0348 -0.1132*** -0.0951** 0.0416 0.0276 (0.0292) (0.0292) (0.0389) (0.0385) (0.0506) (0.0527) disabled -0.7670*** -0.7230*** -0.0226 0.0452 0.4609 0.4068 (0.1766) (0.1775) (0.2221) (0.2205) (0.2812) (0.2714) german -0.1323 -0.1895 0.1144 0.0403 0.1331 0.1513 (0.1742) (0.1747) (0.2222) (0.2239) (0.2614) (0.2682) fatherse 0.6014*** 0.5978*** 0.4445*** 0.4440*** -0.1650 -0.1565 (0.1173) (0.1188) (0.1475) (0.1477) (0.1674) (0.1693) nchild 0.0332 0.0313 -0.0063 -0.0124 0.0682 0.0638 (0.0406) (0.0403) (0.0552) (0.0552) (0.0692) (0.0706) married -0.2066** -0.2200** -0.1810 -0.1675 0.1337 0.1299 (0.0988) (0.0991) (0.1191) (0.1208) (0.1659) (0.1674) continued on the following page
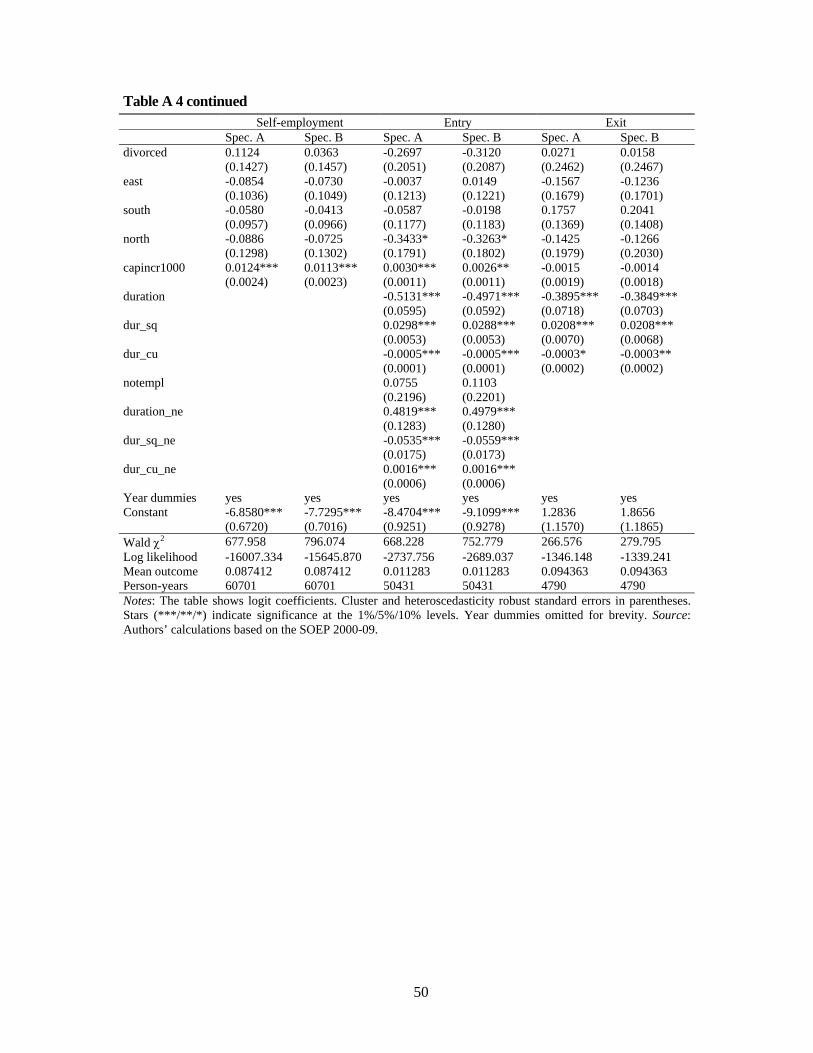
50
Table A 4 continued Self-employment Entry Exit Spec. A Spec. B Spec. A Spec. B Spec. A Spec. B divorced 0.1124 0.0363 -0.2697 -0.3120 0.0271 0.0158 (0.1427) (0.1457) (0.2051) (0.2087) (0.2462) (0.2467) east -0.0854 -0.0730 -0.0037 0.0149 -0.1567 -0.1236 (0.1036) (0.1049) (0.1213) (0.1221) (0.1679) (0.1701) south -0.0580 -0.0413 -0.0587 -0.0198 0.1757 0.2041 (0.0957) (0.0966) (0.1177) (0.1183) (0.1369) (0.1408) north -0.0886 -0.0725 -0.3433* -0.3263* -0.1425 -0.1266 (0.1298) (0.1302) (0.1791) (0.1802) (0.1979) (0.2030) capincr1000 0.0124*** 0.0113*** 0.0030*** 0.0026** -0.0015 -0.0014 (0.0024) (0.0023) (0.0011) (0.0011) (0.0019) (0.0018) duration -0.5131*** -0.4971*** -0.3895*** -0.3849*** (0.0595) (0.0592) (0.0718) (0.0703) dur_sq 0.0298*** 0.0288*** 0.0208*** 0.0208*** (0.0053) (0.0053) (0.0070) (0.0068) dur_cu -0.0005*** -0.0005*** -0.0003* -0.0003** (0.0001) (0.0001) (0.0002) (0.0002) notempl 0.0755 0.1103 (0.2196) (0.2201) duration_ne 0.4819*** 0.4979*** (0.1283) (0.1280) dur_sq_ne -0.0535*** -0.0559*** (0.0175) (0.0173) dur_cu_ne 0.0016*** 0.0016*** (0.0006) (0.0006) Year dummies yes yes yes yes yes yes Constant -6.8580*** -7.7295*** -8.4704*** -9.1099*** 1.2836 1.8656 (0.6720) (0.7016) (0.9251) (0.9278) (1.1570) (1.1865) Wald χ2 677.958 796.074 668.228 752.779 266.576 279.795 Log likelihood -16007.334 -15645.870 -2737.756 -2689.037 -1346.148 -1339.241 Mean outcome 0.087412 0.087412 0.011283 0.011283 0.094363 0.094363 Person-years 60701 60701 50431 50431 4790 4790 Notes: The table shows logit coefficients. Cluster and heteroscedasticity robust standard errors in parentheses. Stars (***/**/*) indicate significance at the 1%/5%/10% levels. Year dummies omitted for brevity. Source: Authors’ calculations based on the SOEP 2000-09.
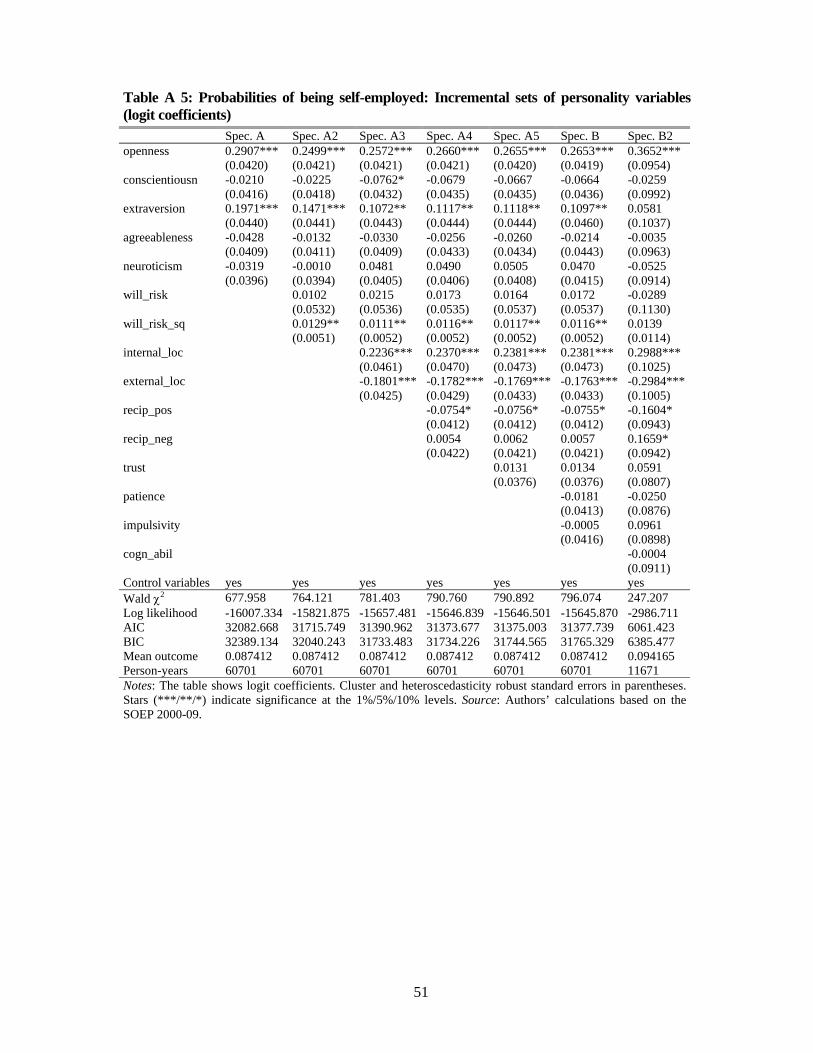
51
Table A 5: Probabilities of being self-employed: Incremental sets of personality variables (logit coefficients) Spec. A Spec. A2 Spec. A3 Spec. A4 Spec. A5 Spec. B Spec. B2 openness 0.2907*** 0.2499*** 0.2572*** 0.2660*** 0.2655*** 0.2653*** 0.3652*** (0.0420) (0.0421) (0.0421) (0.0421) (0.0420) (0.0419) (0.0954) conscientiousn -0.0210 -0.0225 -0.0762* -0.0679 -0.0667 -0.0664 -0.0259 (0.0416) (0.0418) (0.0432) (0.0435) (0.0435) (0.0436) (0.0992) extraversion 0.1971*** 0.1471*** 0.1072** 0.1117** 0.1118** 0.1097** 0.0581 (0.0440) (0.0441) (0.0443) (0.0444) (0.0444) (0.0460) (0.1037) agreeableness -0.0428 -0.0132 -0.0330 -0.0256 -0.0260 -0.0214 -0.0035 (0.0409) (0.0411) (0.0409) (0.0433) (0.0434) (0.0443) (0.0963) neuroticism -0.0319 -0.0010 0.0481 0.0490 0.0505 0.0470 -0.0525 (0.0396) (0.0394) (0.0405) (0.0406) (0.0408) (0.0415) (0.0914) will_risk 0.0102 0.0215 0.0173 0.0164 0.0172 -0.0289 (0.0532) (0.0536) (0.0535) (0.0537) (0.0537) (0.1130) will_risk_sq 0.0129** 0.0111** 0.0116** 0.0117** 0.0116** 0.0139 (0.0051) (0.0052) (0.0052) (0.0052) (0.0052) (0.0114) internal_loc 0.2236*** 0.2370*** 0.2381*** 0.2381*** 0.2988*** (0.0461) (0.0470) (0.0473) (0.0473) (0.1025) external_loc -0.1801*** -0.1782*** -0.1769*** -0.1763*** -0.2984*** (0.0425) (0.0429) (0.0433) (0.0433) (0.1005) recip_pos -0.0754* -0.0756* -0.0755* -0.1604* (0.0412) (0.0412) (0.0412) (0.0943) recip_neg 0.0054 0.0062 0.0057 0.1659* (0.0422) (0.0421) (0.0421) (0.0942) trust 0.0131 0.0134 0.0591 (0.0376) (0.0376) (0.0807) patience -0.0181 -0.0250 (0.0413) (0.0876) impulsivity -0.0005 0.0961 (0.0416) (0.0898) cogn_abil -0.0004 (0.0911) Control variables yes yes yes yes yes yes yes Wald χ2 677.958 764.121 781.403 790.760 790.892 796.074 247.207 Log likelihood -16007.334 -15821.875 -15657.481 -15646.839 -15646.501 -15645.870 -2986.711 AIC 32082.668 31715.749 31390.962 31373.677 31375.003 31377.739 6061.423 BIC 32389.134 32040.243 31733.483 31734.226 31744.565 31765.329 6385.477 Mean outcome 0.087412 0.087412 0.087412 0.087412 0.087412 0.087412 0.094165 Person-years 60701 60701 60701 60701 60701 60701 11671 Notes: The table shows logit coefficients. Cluster and heteroscedasticity robust standard errors in parentheses. Stars (***/**/*) indicate significance at the 1%/5%/10% levels. Source: Authors’ calculations based on the SOEP 2000-09.
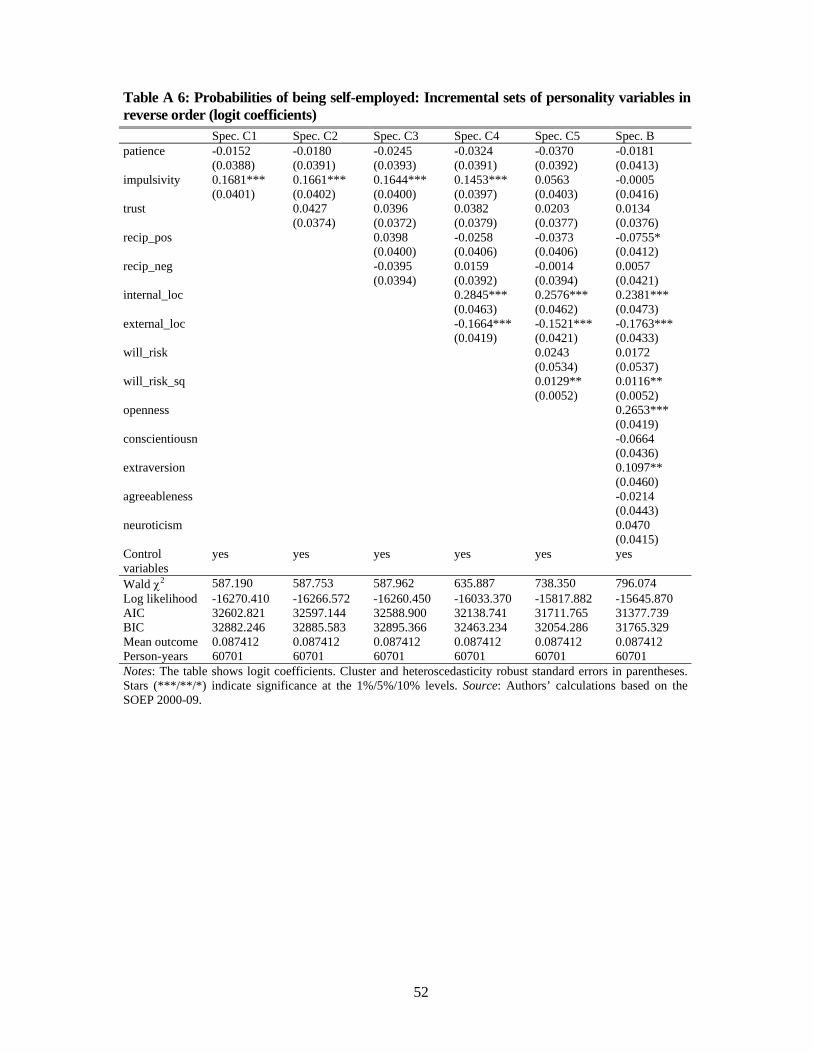
52
Table A 6: Probabilities of being self-employed: Incremental sets of personality variables in reverse order (logit coefficients) Spec. C1 Spec. C2 Spec. C3 Spec. C4 Spec. C5 Spec. B patience -0.0152 -0.0180 -0.0245 -0.0324 -0.0370 -0.0181 (0.0388) (0.0391) (0.0393) (0.0391) (0.0392) (0.0413) impulsivity 0.1681*** 0.1661*** 0.1644*** 0.1453*** 0.0563 -0.0005 (0.0401) (0.0402) (0.0400) (0.0397) (0.0403) (0.0416) trust 0.0427 0.0396 0.0382 0.0203 0.0134 (0.0374) (0.0372) (0.0379) (0.0377) (0.0376) recip_pos 0.0398 -0.0258 -0.0373 -0.0755* (0.0400) (0.0406) (0.0406) (0.0412) recip_neg -0.0395 0.0159 -0.0014 0.0057 (0.0394) (0.0392) (0.0394) (0.0421) internal_loc 0.2845*** 0.2576*** 0.2381*** (0.0463) (0.0462) (0.0473) external_loc -0.1664*** -0.1521*** -0.1763*** (0.0419) (0.0421) (0.0433) will_risk 0.0243 0.0172 (0.0534) (0.0537) will_risk_sq 0.0129** 0.0116** (0.0052) (0.0052) openness 0.2653*** (0.0419) conscientiousn -0.0664 (0.0436) extraversion 0.1097** (0.0460) agreeableness -0.0214 (0.0443) neuroticism 0.0470 (0.0415) Control variables
yes yes yes yes yes yes
Wald χ2 587.190 587.753 587.962 635.887 738.350 796.074 Log likelihood -16270.410 -16266.572 -16260.450 -16033.370 -15817.882 -15645.870 AIC 32602.821 32597.144 32588.900 32138.741 31711.765 31377.739 BIC 32882.246 32885.583 32895.366 32463.234 32054.286 31765.329 Mean outcome 0.087412 0.087412 0.087412 0.087412 0.087412 0.087412 Person-years 60701 60701 60701 60701 60701 60701 Notes: The table shows logit coefficients. Cluster and heteroscedasticity robust standard errors in parentheses. Stars (***/**/*) indicate significance at the 1%/5%/10% levels. Source: Authors’ calculations based on the SOEP 2000-09.
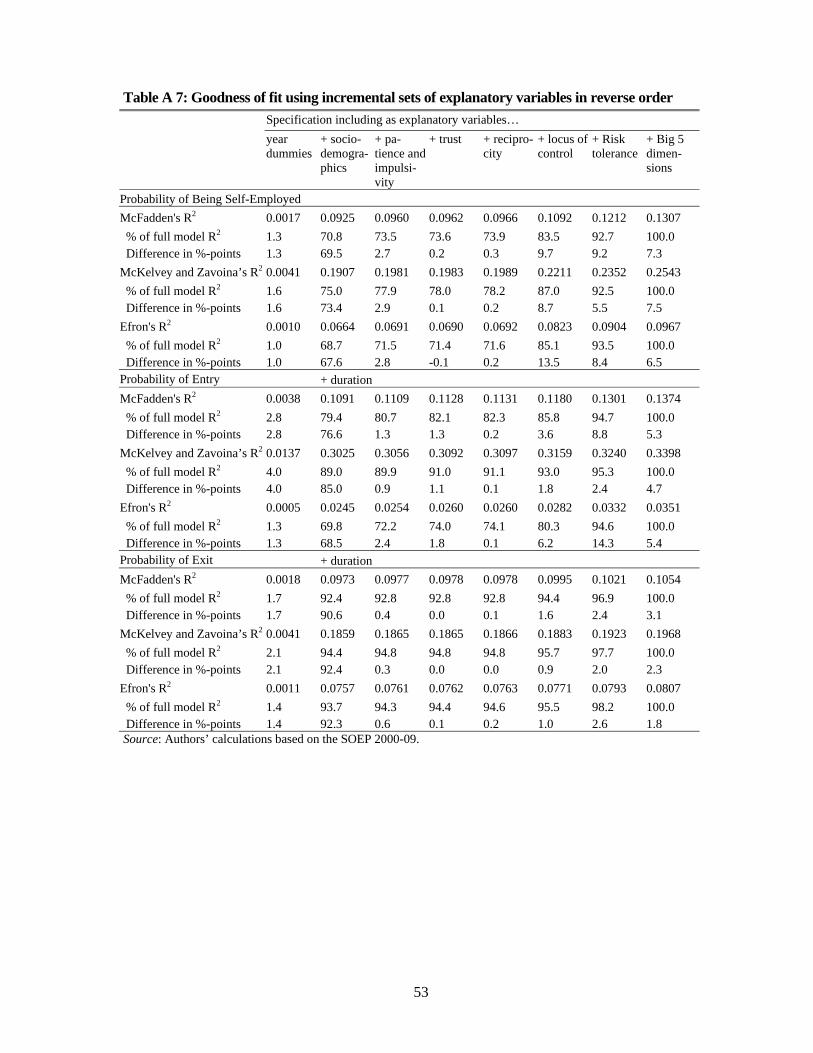
53
Table A 7: Goodness of fit using incremental sets of explanatory variables in reverse order Specification including as explanatory variables… year dummies
+ socio-demogra-phics
+ pa-tience and impulsi-vity
+ trust + recipro-city
+ locus of control
+ Risk tolerance
+ Big 5 dimen-sions
Probability of Being Self-Employed McFadden's R2 0.0017 0.0925 0.0960 0.0962 0.0966 0.1092 0.1212 0.1307 % of full model R2 1.3 70.8 73.5 73.6 73.9 83.5 92.7 100.0 Difference in %-points 1.3 69.5 2.7 0.2 0.3 9.7 9.2 7.3 McKelvey and Zavoina’s R2 0.0041 0.1907 0.1981 0.1983 0.1989 0.2211 0.2352 0.2543 % of full model R2 1.6 75.0 77.9 78.0 78.2 87.0 92.5 100.0 Difference in %-points 1.6 73.4 2.9 0.1 0.2 8.7 5.5 7.5 Efron's R2 0.0010 0.0664 0.0691 0.0690 0.0692 0.0823 0.0904 0.0967 % of full model R2 1.0 68.7 71.5 71.4 71.6 85.1 93.5 100.0 Difference in %-points 1.0 67.6 2.8 -0.1 0.2 13.5 8.4 6.5 Probability of Entry + duration McFadden's R2 0.0038 0.1091 0.1109 0.1128 0.1131 0.1180 0.1301 0.1374 % of full model R2 2.8 79.4 80.7 82.1 82.3 85.8 94.7 100.0 Difference in %-points 2.8 76.6 1.3 1.3 0.2 3.6 8.8 5.3 McKelvey and Zavoina’s R2 0.0137 0.3025 0.3056 0.3092 0.3097 0.3159 0.3240 0.3398 % of full model R2 4.0 89.0 89.9 91.0 91.1 93.0 95.3 100.0 Difference in %-points 4.0 85.0 0.9 1.1 0.1 1.8 2.4 4.7 Efron's R2 0.0005 0.0245 0.0254 0.0260 0.0260 0.0282 0.0332 0.0351 % of full model R2 1.3 69.8 72.2 74.0 74.1 80.3 94.6 100.0 Difference in %-points 1.3 68.5 2.4 1.8 0.1 6.2 14.3 5.4 Probability of Exit + duration McFadden's R2 0.0018 0.0973 0.0977 0.0978 0.0978 0.0995 0.1021 0.1054 % of full model R2 1.7 92.4 92.8 92.8 92.8 94.4 96.9 100.0 Difference in %-points 1.7 90.6 0.4 0.0 0.1 1.6 2.4 3.1 McKelvey and Zavoina’s R2 0.0041 0.1859 0.1865 0.1865 0.1866 0.1883 0.1923 0.1968 % of full model R2 2.1 94.4 94.8 94.8 94.8 95.7 97.7 100.0 Difference in %-points 2.1 92.4 0.3 0.0 0.0 0.9 2.0 2.3 Efron's R2 0.0011 0.0757 0.0761 0.0762 0.0763 0.0771 0.0793 0.0807 % of full model R2 1.4 93.7 94.3 94.4 94.6 95.5 98.2 100.0 Difference in %-points 1.4 92.3 0.6 0.1 0.2 1.0 2.6 1.8 Source: Authors’ calculations based on the SOEP 2000-09.
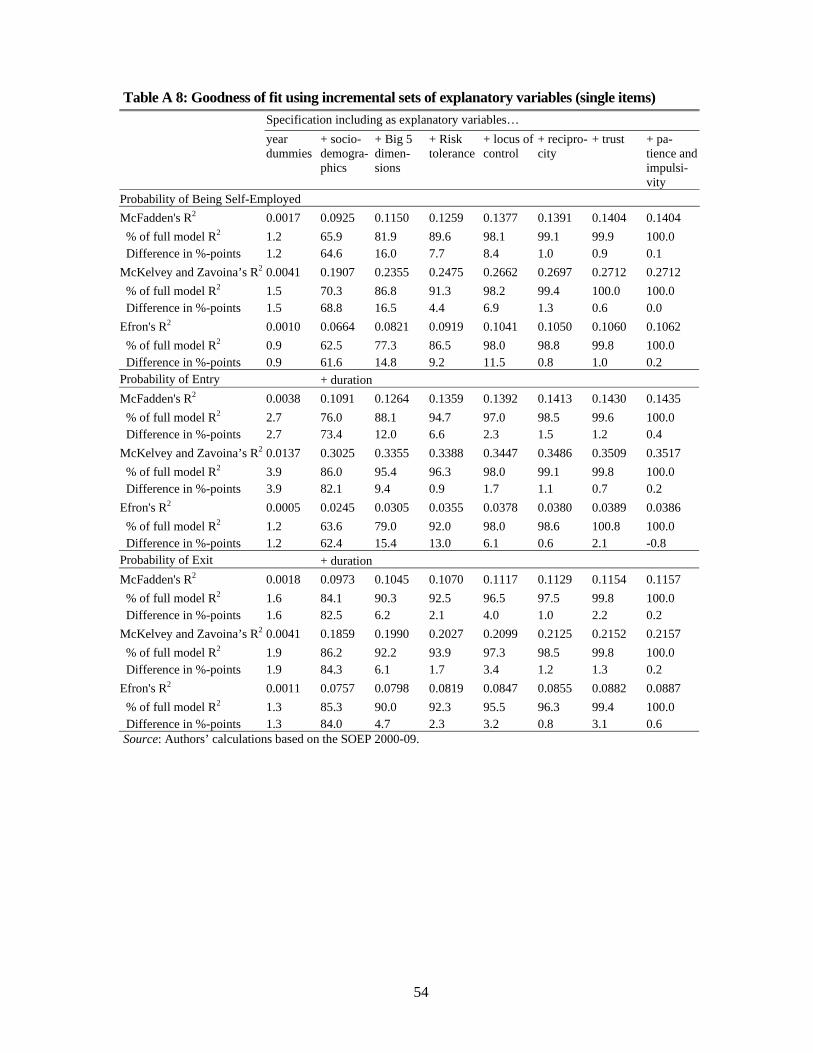
54
Table A 8: Goodness of fit using incremental sets of explanatory variables (single items) Specification including as explanatory variables… year dummies
+ socio-demogra-phics
+ Big 5 dimen-sions
+ Risk tolerance
+ locus of control
+ recipro-city
+ trust + pa-tience and impulsi-vity
Probability of Being Self-Employed McFadden's R2 0.0017 0.0925 0.1150 0.1259 0.1377 0.1391 0.1404 0.1404 % of full model R2 1.2 65.9 81.9 89.6 98.1 99.1 99.9 100.0 Difference in %-points 1.2 64.6 16.0 7.7 8.4 1.0 0.9 0.1 McKelvey and Zavoina’s R2 0.0041 0.1907 0.2355 0.2475 0.2662 0.2697 0.2712 0.2712 % of full model R2 1.5 70.3 86.8 91.3 98.2 99.4 100.0 100.0 Difference in %-points 1.5 68.8 16.5 4.4 6.9 1.3 0.6 0.0 Efron's R2 0.0010 0.0664 0.0821 0.0919 0.1041 0.1050 0.1060 0.1062 % of full model R2 0.9 62.5 77.3 86.5 98.0 98.8 99.8 100.0 Difference in %-points 0.9 61.6 14.8 9.2 11.5 0.8 1.0 0.2 Probability of Entry + duration McFadden's R2 0.0038 0.1091 0.1264 0.1359 0.1392 0.1413 0.1430 0.1435 % of full model R2 2.7 76.0 88.1 94.7 97.0 98.5 99.6 100.0 Difference in %-points 2.7 73.4 12.0 6.6 2.3 1.5 1.2 0.4 McKelvey and Zavoina’s R2 0.0137 0.3025 0.3355 0.3388 0.3447 0.3486 0.3509 0.3517 % of full model R2 3.9 86.0 95.4 96.3 98.0 99.1 99.8 100.0 Difference in %-points 3.9 82.1 9.4 0.9 1.7 1.1 0.7 0.2 Efron's R2 0.0005 0.0245 0.0305 0.0355 0.0378 0.0380 0.0389 0.0386 % of full model R2 1.2 63.6 79.0 92.0 98.0 98.6 100.8 100.0 Difference in %-points 1.2 62.4 15.4 13.0 6.1 0.6 2.1 -0.8 Probability of Exit + duration McFadden's R2 0.0018 0.0973 0.1045 0.1070 0.1117 0.1129 0.1154 0.1157 % of full model R2 1.6 84.1 90.3 92.5 96.5 97.5 99.8 100.0 Difference in %-points 1.6 82.5 6.2 2.1 4.0 1.0 2.2 0.2 McKelvey and Zavoina’s R2 0.0041 0.1859 0.1990 0.2027 0.2099 0.2125 0.2152 0.2157 % of full model R2 1.9 86.2 92.2 93.9 97.3 98.5 99.8 100.0 Difference in %-points 1.9 84.3 6.1 1.7 3.4 1.2 1.3 0.2 Efron's R2 0.0011 0.0757 0.0798 0.0819 0.0847 0.0855 0.0882 0.0887 % of full model R2 1.3 85.3 90.0 92.3 95.5 96.3 99.4 100.0 Difference in %-points 1.3 84.0 4.7 2.3 3.2 0.8 3.1 0.6 Source: Authors’ calculations based on the SOEP 2000-09.
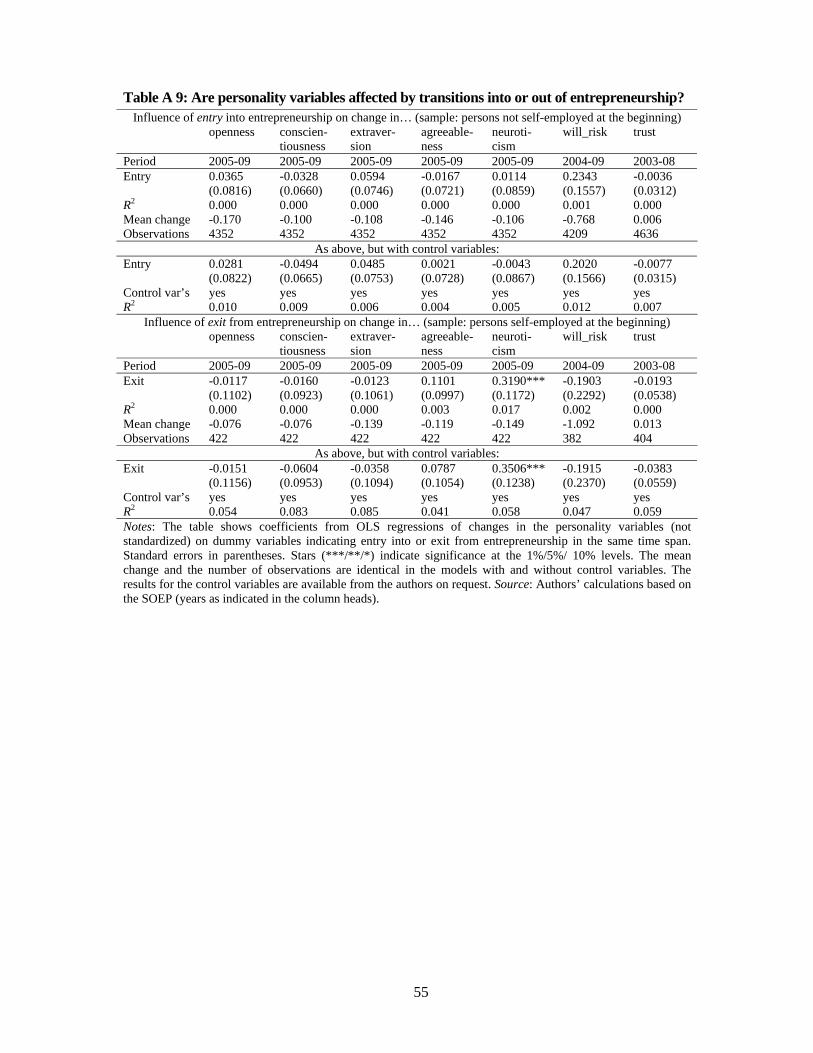
55
Table A 9: Are personality variables affected by transitions into or out of entrepreneurship? Influence of entry into entrepreneurship on change in… (sample: persons not self-employed at the beginning)
openness conscien-tiousness
extraver-sion
agreeable-ness
neuroti-cism
will_risk trust
Period 2005-09 2005-09 2005-09 2005-09 2005-09 2004-09 2003-08 Entry 0.0365 -0.0328 0.0594 -0.0167 0.0114 0.2343 -0.0036 (0.0816) (0.0660) (0.0746) (0.0721) (0.0859) (0.1557) (0.0312) R2 0.000 0.000 0.000 0.000 0.000 0.001 0.000 Mean change -0.170 -0.100 -0.108 -0.146 -0.106 -0.768 0.006 Observations 4352 4352 4352 4352 4352 4209 4636
As above, but with control variables: Entry 0.0281 -0.0494 0.0485 0.0021 -0.0043 0.2020 -0.0077 (0.0822) (0.0665) (0.0753) (0.0728) (0.0867) (0.1566) (0.0315) Control var’s yes yes yes yes yes yes yes R2 0.010 0.009 0.006 0.004 0.005 0.012 0.007
Influence of exit from entrepreneurship on change in… (sample: persons self-employed at the beginning) openness conscien-
tiousness extraver-sion
agreeable-ness
neuroti-cism
will_risk trust
Period 2005-09 2005-09 2005-09 2005-09 2005-09 2004-09 2003-08 Exit -0.0117 -0.0160 -0.0123 0.1101 0.3190*** -0.1903 -0.0193 (0.1102) (0.0923) (0.1061) (0.0997) (0.1172) (0.2292) (0.0538) R2 0.000 0.000 0.000 0.003 0.017 0.002 0.000 Mean change -0.076 -0.076 -0.139 -0.119 -0.149 -1.092 0.013 Observations 422 422 422 422 422 382 404
As above, but with control variables: Exit -0.0151 -0.0604 -0.0358 0.0787 0.3506*** -0.1915 -0.0383 (0.1156) (0.0953) (0.1094) (0.1054) (0.1238) (0.2370) (0.0559) Control var’s yes yes yes yes yes yes yes R2 0.054 0.083 0.085 0.041 0.058 0.047 0.059 Notes: The table shows coefficients from OLS regressions of changes in the personality variables (not standardized) on dummy variables indicating entry into or exit from entrepreneurship in the same time span. Standard errors in parentheses. Stars (***/**/*) indicate significance at the 1%/5%/ 10% levels. The mean change and the number of observations are identical in the models with and without control variables. The results for the control variables are available from the authors on request. Source: Authors’ calculations based on the SOEP (years as indicated in the column heads).
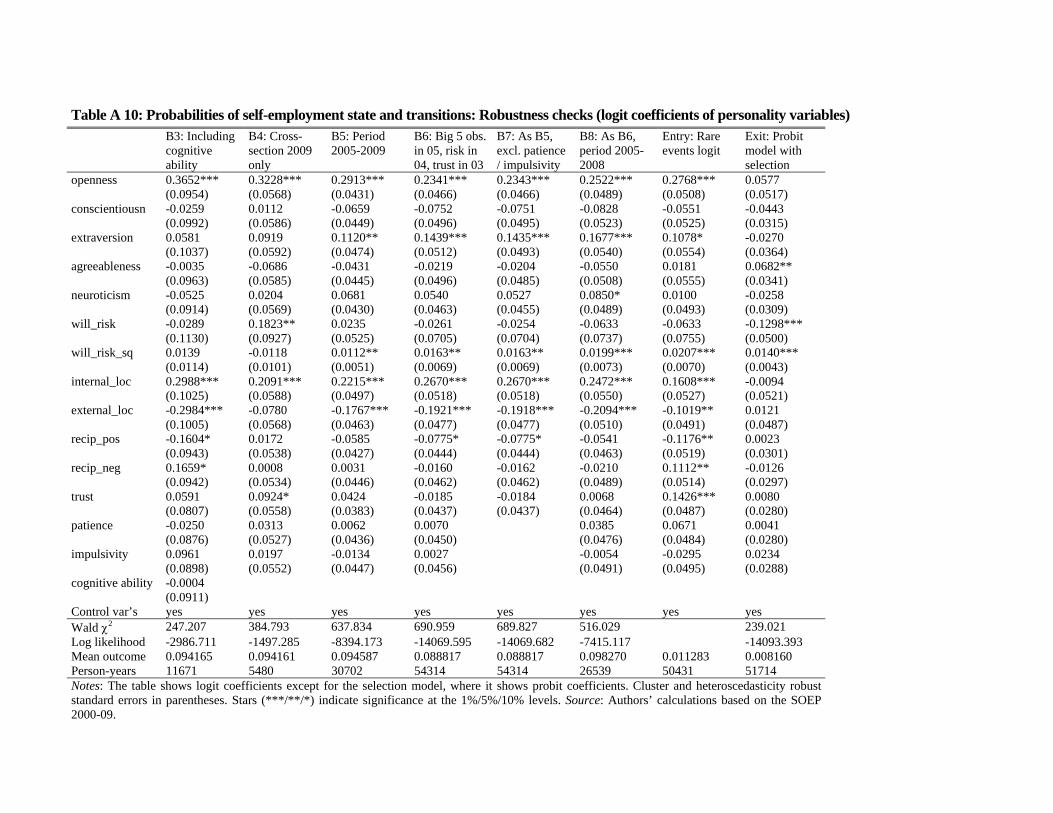
Table A 10: Probabilities of self-employment state and transitions: Robustness checks (logit coefficients of personality variables) B3: Including
cognitive ability
B4: Cross-section 2009 only
B5: Period 2005-2009
B6: Big 5 obs. in 05, risk in 04, trust in 03
B7: As B5, excl. patience / impulsivity
B8: As B6, period 2005-2008
Entry: Rare events logit
Exit: Probit model with selection
openness 0.3652*** 0.3228*** 0.2913*** 0.2341*** 0.2343*** 0.2522*** 0.2768*** 0.0577 (0.0954) (0.0568) (0.0431) (0.0466) (0.0466) (0.0489) (0.0508) (0.0517) conscientiousn -0.0259 0.0112 -0.0659 -0.0752 -0.0751 -0.0828 -0.0551 -0.0443 (0.0992) (0.0586) (0.0449) (0.0496) (0.0495) (0.0523) (0.0525) (0.0315) extraversion 0.0581 0.0919 0.1120** 0.1439*** 0.1435*** 0.1677*** 0.1078* -0.0270 (0.1037) (0.0592) (0.0474) (0.0512) (0.0493) (0.0540) (0.0554) (0.0364) agreeableness -0.0035 -0.0686 -0.0431 -0.0219 -0.0204 -0.0550 0.0181 0.0682** (0.0963) (0.0585) (0.0445) (0.0496) (0.0485) (0.0508) (0.0555) (0.0341) neuroticism -0.0525 0.0204 0.0681 0.0540 0.0527 0.0850* 0.0100 -0.0258 (0.0914) (0.0569) (0.0430) (0.0463) (0.0455) (0.0489) (0.0493) (0.0309) will_risk -0.0289 0.1823** 0.0235 -0.0261 -0.0254 -0.0633 -0.0633 -0.1298*** (0.1130) (0.0927) (0.0525) (0.0705) (0.0704) (0.0737) (0.0755) (0.0500) will_risk_sq 0.0139 -0.0118 0.0112** 0.0163** 0.0163** 0.0199*** 0.0207*** 0.0140*** (0.0114) (0.0101) (0.0051) (0.0069) (0.0069) (0.0073) (0.0070) (0.0043) internal_loc 0.2988*** 0.2091*** 0.2215*** 0.2670*** 0.2670*** 0.2472*** 0.1608*** -0.0094 (0.1025) (0.0588) (0.0497) (0.0518) (0.0518) (0.0550) (0.0527) (0.0521) external_loc -0.2984*** -0.0780 -0.1767*** -0.1921*** -0.1918*** -0.2094*** -0.1019** 0.0121 (0.1005) (0.0568) (0.0463) (0.0477) (0.0477) (0.0510) (0.0491) (0.0487) recip_pos -0.1604* 0.0172 -0.0585 -0.0775* -0.0775* -0.0541 -0.1176** 0.0023 (0.0943) (0.0538) (0.0427) (0.0444) (0.0444) (0.0463) (0.0519) (0.0301) recip_neg 0.1659* 0.0008 0.0031 -0.0160 -0.0162 -0.0210 0.1112** -0.0126 (0.0942) (0.0534) (0.0446) (0.0462) (0.0462) (0.0489) (0.0514) (0.0297) trust 0.0591 0.0924* 0.0424 -0.0185 -0.0184 0.0068 0.1426*** 0.0080 (0.0807) (0.0558) (0.0383) (0.0437) (0.0437) (0.0464) (0.0487) (0.0280) patience -0.0250 0.0313 0.0062 0.0070 0.0385 0.0671 0.0041 (0.0876) (0.0527) (0.0436) (0.0450) (0.0476) (0.0484) (0.0280) impulsivity 0.0961 0.0197 -0.0134 0.0027 -0.0054 -0.0295 0.0234 (0.0898) (0.0552) (0.0447) (0.0456) (0.0491) (0.0495) (0.0288) cognitive ability -0.0004 (0.0911) Control var’s yes yes yes yes yes yes yes yes Wald χ2 247.207 384.793 637.834 690.959 689.827 516.029 239.021 Log likelihood -2986.711 -1497.285 -8394.173 -14069.595 -14069.682 -7415.117 -14093.393 Mean outcome 0.094165 0.094161 0.094587 0.088817 0.088817 0.098270 0.011283 0.008160 Person-years 11671 5480 30702 54314 54314 26539 50431 51714 Notes: The table shows logit coefficients except for the selection model, where it shows probit coefficients. Cluster and heteroscedasticity robust standard errors in parentheses. Stars (***/**/*) indicate significance at the 1%/5%/10% levels. Source: Authors’ calculations based on the SOEP 2000-09.
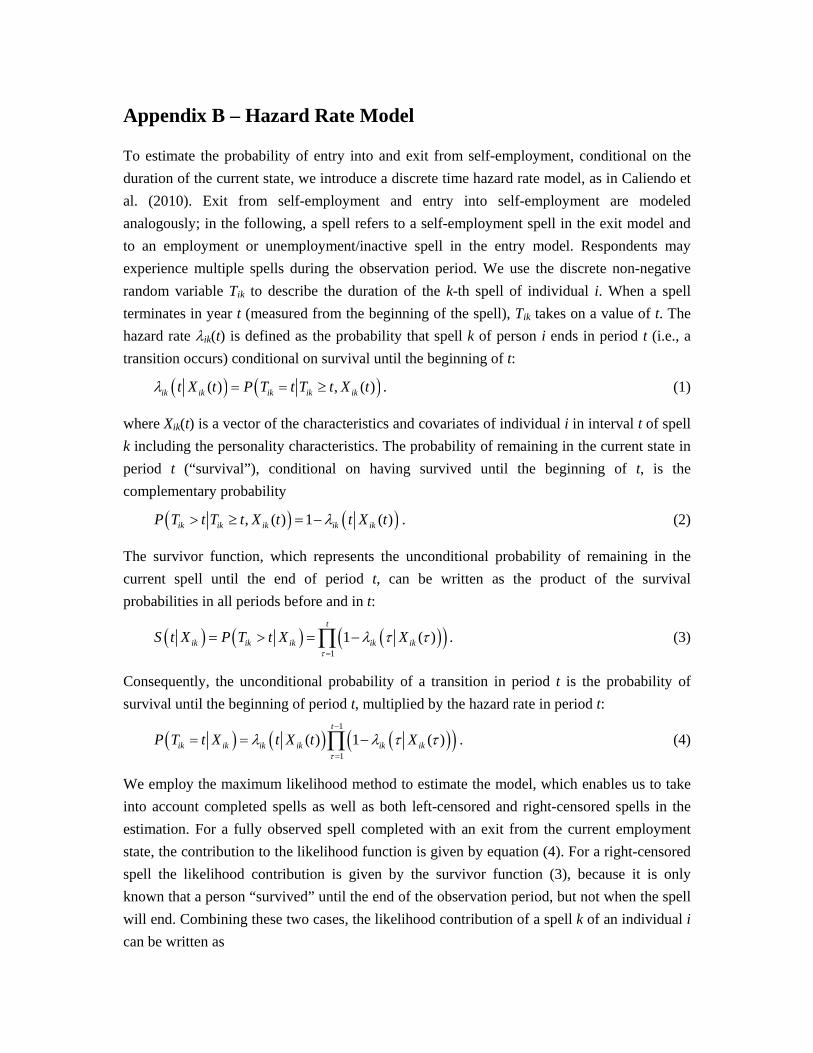
Appendix B – Hazard Rate Model
To estimate the probability of entry into and exit from self-employment, conditional on the duration of the current state, we introduce a discrete time hazard rate model, as in Caliendo et al. (2010). Exit from self-employment and entry into self-employment are modeled analogously; in the following, a spell refers to a self-employment spell in the exit model and to an employment or unemployment/inactive spell in the entry model. Respondents may experience multiple spells during the observation period. We use the discrete non-negative random variable Tik to describe the duration of the k-th spell of individual i. When a spell terminates in year t (measured from the beginning of the spell), Tik takes on a value of t. The hazard rate λik(t) is defined as the probability that spell k of person i ends in period t (i.e., a transition occurs) conditional on survival until the beginning of t:
( ) ( )( ) , ( )ik ik ik ik ikt X t P T t T t X tλ = = ≥ . (1)
where Xik(t) is a vector of the characteristics and covariates of individual i in interval t of spell k including the personality characteristics. The probability of remaining in the current state in period t (“survival”), conditional on having survived until the beginning of t, is the complementary probability
( ) ( ), ( ) 1 ( )ik ik ik ik ikP T t T t X t t X tλ> ≥ = − . (2)
The survivor function, which represents the unconditional probability of remaining in the current spell until the end of period t, can be written as the product of the survival probabilities in all periods before and in t:
( ) ( ) ( )( )1
1 ( )t
ik ik ik ik ikS t X P T t X Xτ
λ τ τ=
= > = −∏ . (3)
Consequently, the unconditional probability of a transition in period t is the probability of survival until the beginning of period t, multiplied by the hazard rate in period t:
( ) ( ) ( )( )1
1
( ) 1 ( )t
ik ik ik ik ik ikP T t X t X t Xτ
λ λ τ τ−
=
= = −∏ . (4)
We employ the maximum likelihood method to estimate the model, which enables us to take into account completed spells as well as both left-censored and right-censored spells in the estimation. For a fully observed spell completed with an exit from the current employment state, the contribution to the likelihood function is given by equation (4). For a right-censored spell the likelihood contribution is given by the survivor function (3), because it is only known that a person “survived” until the end of the observation period, but not when the spell will end. Combining these two cases, the likelihood contribution of a spell k of an individual i can be written as
58
( ) ( )( ) ( )( )
1
( ), 1 ( )
1 ( )
ikik
ct
ik ik ik iknot left censoredik i ik ik ik
ik ik ik ik
t X tL parameters c X X
t X t τ
λλ τ τ
λ−
=
⎡ ⎤= −⎢ ⎥
−⎢ ⎥⎣ ⎦∏ (5)
where cik is a censoring indicator defined such that cik = 1 if a spell is completed and 0 if a spell is right-censored.
If a spell is left-censored in the SOEP, because person i enters the panel after spell k has already lasted uik years, we must condition on survival up to the end of period uik, which means dividing expression (5) by S(uik). Then the likelihood contribution of the spell is
( ) ( )( )
( )( )
( )( )
( )( ) ( )( )
1
1
1
1 ( )( ),
1 ( ) 1 ( )
( )1 ( )
1 ( )
ik
ik
ik
ikik
ik
tc
ik ikik ik ik ik
ik i ik uik ik ik ik
ik ik
ct
ik ik ik ikik ik
uik ik ik ik
Xt X tL parameters c X
t X t X
t X tX
t X t
τ
τ
τ
λ τ τλλ λ τ τ
λλ τ τ
λ
=
=
= +
−⎡ ⎤= ⎢ ⎥
−⎢ ⎥⎣ ⎦ −
⎡ ⎤= −⎢ ⎥
−⎢ ⎥⎣ ⎦
∏
∏
∏
(6)
Note that this more general notation includes equation (5) for spells that are not left-censored (uik = 0). In the SOEP, retrospective employment history questions enable us to recover the spell durations uik and thereby deal with left-censoring.
The overall likelihood contribution of an individual i equals the product of the likelihood contributions of the Ki spells the person experienced in the observation period. The sample likelihood function is the product of the individual likelihood contributions:
( )1 1
,= =
=∏∏iKN
iki k
L parameters c X L (7)
The log-likelihood function is
( )
( )( ) ( )
1 1
1 1 1 1 1
log , log
( )log log 1 ( )
1 ( )
i
i i ik
ik
KN
iki k
K K tN Nik ik ik ik
ik ik iki k i k uik ik ik ik
L parameters c X L
t X tc X
t X t τ
λλ τ τ
λ
= =
= = = = = +
=
⎡ ⎤⎡ ⎤= + −⎢ ⎥ ⎣ ⎦−⎢ ⎥⎣ ⎦
∑∑
∑∑ ∑∑ ∑ (8)
We define a new binary transition indicator variable yikτ = 1 if person i completes spell k in period τ, and 0 otherwise. The yikτ correspond to dummy variables that equal 1 if a transition is observed between τ and τ + 1, and 0 otherwise. Effectively adding some zeros to the sum, it can be written
59
( )( )( ) ( )
( ) ( )( )1 1 1 1 1 1
1 1 1
log ,
( )log log 1 ( )
1 ( )
log ( ) (1 ) log 1 ( )
i ik i ik
ik ik
i ik
ik
K t K tN Nik ik
ik ik iki k u i k uik ik
K tN
ik ik ik ik ik iki k u
L parameters y X
Xy X
X
y X y X
ττ τ
τ ττ
λ τ τλ τ τ
λ τ τ
λ τ τ λ τ τ
= = = + = = = +
= = = +
⎡ ⎤⎡ ⎤= + −⎢ ⎥ ⎣ ⎦−⎢ ⎥⎣ ⎦
⎡ ⎤ ⎡ ⎤= + − −⎣ ⎦ ⎣ ⎦
∑∑ ∑ ∑∑ ∑
∑∑ ∑
(9)
The last expression has exactly the same form as the standard log-likelihood function for a binary regression model in which yikτ is the dependent variable and the data are organized in person-period format, where τ is measured from the beginning of the current spell and thus measures its duration (cf. Jenkins, 1995).
The functional form of the hazard rate is specified as a logistic hazard model:
( ) ( )( )
exp ( ) ( )( )
1 exp ( ) ( )ik
ik ikik
f XX
f Xτ τ β
λ τ ττ τ β+
=+ +
, (10)
where the function f(τ) represents the dependence of the hazard rate on the spell duration τ (baseline hazard), specified as a polynomial function of the third degree.
Appendix C – Pseudo-R2
McFadden’s (1974) R2 is the likelihood ratio index
2
0
ln1lnMF
LRL
= − , (11)
where L is the log likelihood in the full model, and L0 is the log likelihood in the model which only includes the constant. McKelvey and Zavoina’s (1975) R2 corresponds to the regression variation divided by the total variation in the latent index function model,
( )( )
2* *
122* *
1
ˆ ˆ
ˆ ˆ3
Ni ii
MZ Ni ii
y yR
y y Nπ=
=
−=
− +
∑∑
, (12)
where *ˆiy is the linear prediction of the latent variable, *ˆiy is its mean, and 3π is the
disturbance variance in the logit model. Finally, Efron’s (1978) R2 is the sum of squared model residuals divided by the total variability in the dependent variable,
( )( )
2
2 12
1
ˆ1
Ni ii
Ef Nii
y pR
y y=
=
−= −
−
∑∑
, (13)
where ˆ ip is the predicted probability.
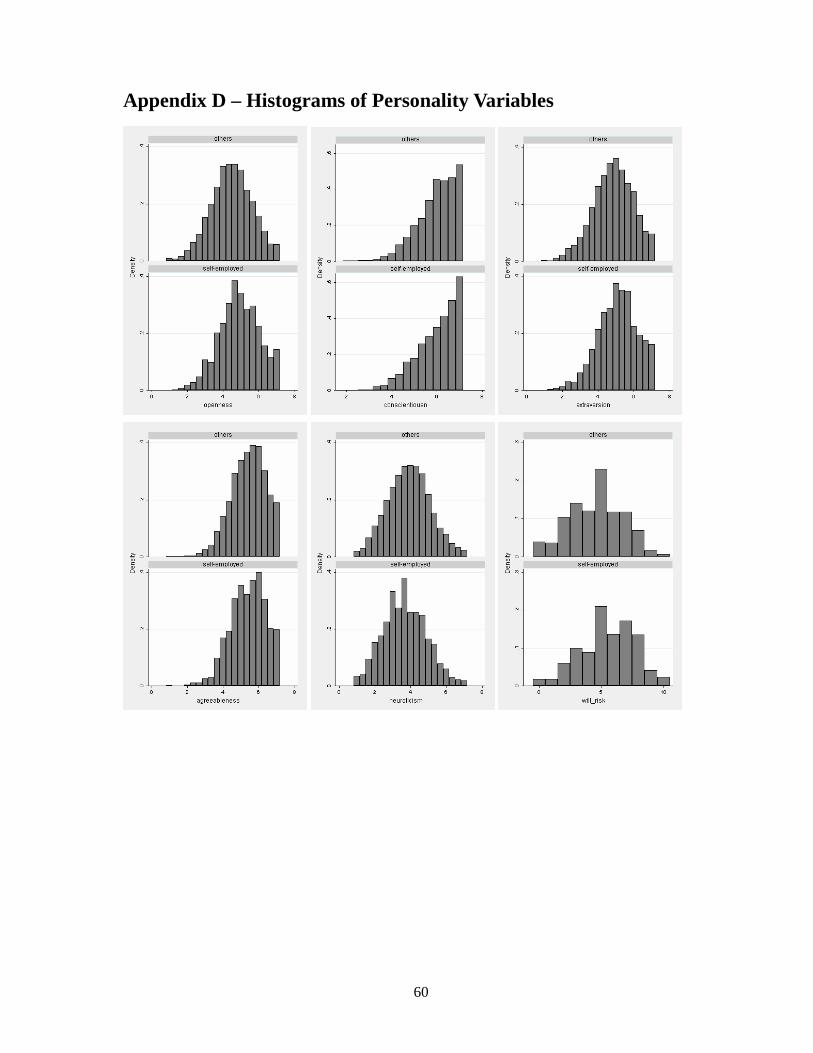
60
Appendix D – Histograms of Personality Variables
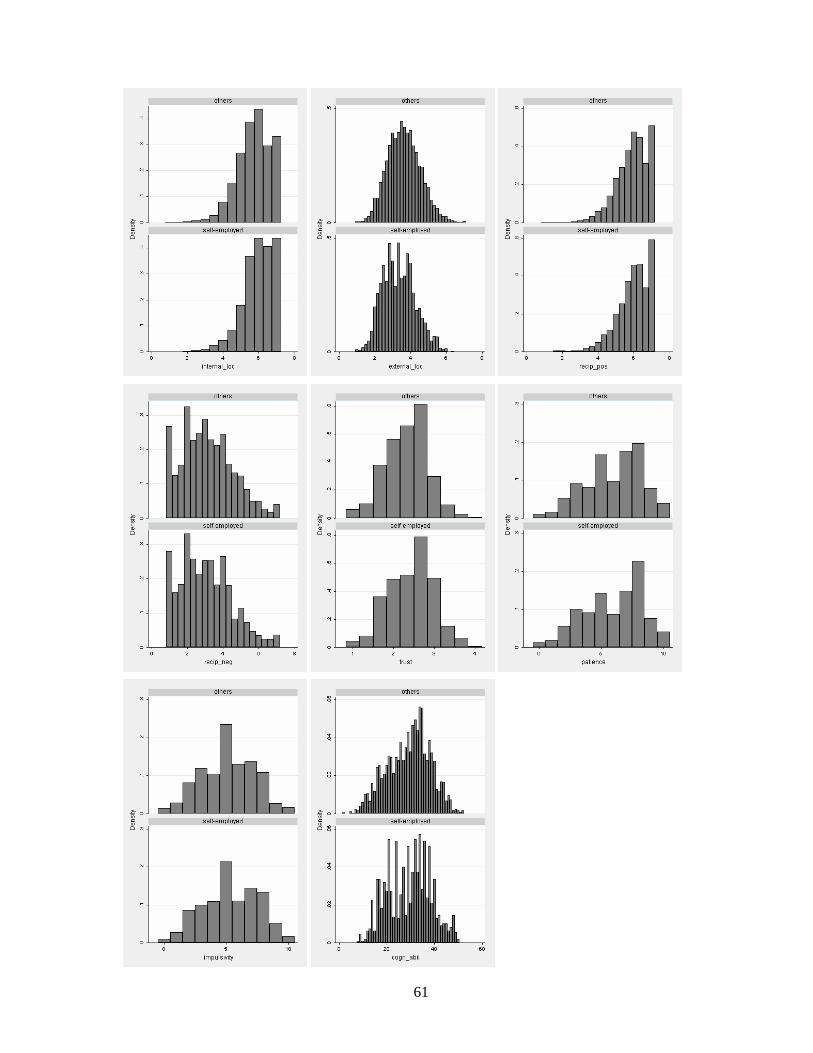
61