Personalise vitamin D3 using physiologically based ...
12
CPT Pharmacometrics Syst. Pharmacol. 2021;10:723–734. | 723 www.psp-journal.com Received: 22 December 2020 | Revised: 5 April 2021 | Accepted: 14 April 2021 DOI: 10.1002/psp4.12640 ARTICLE Personalise vitamin D 3 using physiologically based pharmacokinetic modelling Zhonghui Huang | Tao You This is an open access article under the terms of the Creative Commons Attribution-NonCommercial-NoDerivs License, which permits use and distribution in any medium, provided the original work is properly cited, the use is non-commercial and no modifications or adaptations are made. © 2021 Beyond Consulting Ltd. CPT: Pharmacometrics & Systems Pharmacology published by Wiley Periodicals LLC on behalf of American Society for Clinical Pharmacology and Therapeutics. Beyond Consulting Ltd, Macclesfield, UK Correspondence Tao You, Beyond Consulting Ltd., 14 Tytherington Park Road, Macclesfield, Cheshire SK10 2EL, UK. Email: [email protected] Funding information The work was entirely supported by salary at Beyond Consulting Ltd. Abstract Plasma concentration of vitamin D 3 metabolite 25-hydroxyvitamin D 3 (25(OH)D 3 ) is vari- able among individuals. The objective of this study is to establish an accurate model for 25(OH)D 3 pharmacokinetics (PKs) to support selection of a suitable dose regimen for an individual. We collated vitamin D 3 and 25(OH)D 3 plasma PK data from reported clinical trials and developed a physiologically-based pharmacokinetic (PBPK) model to appro- priately recapitulate training data. Model predictions were then qualified with 25(OH)D 3 plasma PKs under vitamin D 3 and 25(OH)D 3 dose regimens distinct from training data. From data exploration, we observed the increase in plasma 25(OH)D 3 after repeated dosing was negatively correlated with 25(OH)D 3 baseline levels. Our final model included a first- order vitamin D 3 absorption, a first-order vitamin D 3 metabolism, and a nonlinear 25(OH) D 3 elimination function. This structure explained the apparent paradox. Remarkably, the model accurately predicted plasma 25(OH)D 3 following repeated dosing up to 1250 μg/d in the test set. It also made sensible predictions for large single vitamin D 3 doses up to 50,000 μg in the test set. Model predicts 10 μg/d regimen may be ineffective for achieving sufficiency (plasma 25(OH)D 3 ≥ 75 nmol/L) for a severely deficient individual (baseline 25(OH)D 3 = 10 nmol/L), and it might take the same person over 200 days to reach suf- ficiency at 20 μg/d dose. We propose to personalize vitamin D 3 supplementation protocol with this PBPK model. It would require measuring 25(OH)D 3 baseline levels, which is not routinely performed under the current UK public health advice. Study Highlights WHAT IS THE CURRENT KNOWLEDGE ON THE TOPIC? Vitamin D PK exhibits substantial inter-individual variability. Different officially recommended daily doses are confusing. WHAT QUESTION DID THIS STUDY ADDRESS? Is the UK’s recommended 10 µg daily dose sufficient? Should everyone be given same dose? WHAT DOES THIS STUDY ADD TO OUR KNOWLEDGE? Our model accurately predicts plasma 25(OH)D under daily oral administration of vitamin D 3 . The 10 µg daily vitamin D 3 dose is insufficient for prophylaxis (plasma 25(OH)D at 75 nmol/L).
Transcript of Personalise vitamin D3 using physiologically based ...

CPT Pharmacometrics Syst. Pharmacol. 2021;10:723–734. | 723www.psp-journal.com
Received: 22 December 2020 | Revised: 5 April 2021 | Accepted: 14 April 2021
DOI: 10.1002/psp4.12640
A R T I C L E
Personalise vitamin D3 using physiologically based pharmacokinetic modelling
Zhonghui Huang | Tao You
This is an open access article under the terms of the Creative Commons Attribution- NonCommercial- NoDerivs License, which permits use and distribution in any medium, provided the original work is properly cited, the use is non- commercial and no modifications or adaptations are made.© 2021 Beyond Consulting Ltd. CPT: Pharmacometrics & Systems Pharmacology published by Wiley Periodicals LLC on behalf of American Society for Clinical Pharmacology and Therapeutics.
Beyond Consulting Ltd, Macclesfield, UK
CorrespondenceTao You, Beyond Consulting Ltd., 14 Tytherington Park Road, Macclesfield, Cheshire SK10 2EL, UK.Email: [email protected]
Funding informationThe work was entirely supported by salary at Beyond Consulting Ltd.
AbstractPlasma concentration of vitamin D3 metabolite 25- hydroxyvitamin D3 (25(OH)D3) is vari-able among individuals. The objective of this study is to establish an accurate model for 25(OH)D3 pharmacokinetics (PKs) to support selection of a suitable dose regimen for an individual. We collated vitamin D3 and 25(OH)D3 plasma PK data from reported clinical trials and developed a physiologically- based pharmacokinetic (PBPK) model to appro-priately recapitulate training data. Model predictions were then qualified with 25(OH)D3 plasma PKs under vitamin D3 and 25(OH)D3 dose regimens distinct from training data. From data exploration, we observed the increase in plasma 25(OH)D3 after repeated dosing was negatively correlated with 25(OH)D3 baseline levels. Our final model included a first- order vitamin D3 absorption, a first- order vitamin D3 metabolism, and a nonlinear 25(OH)D3 elimination function. This structure explained the apparent paradox. Remarkably, the model accurately predicted plasma 25(OH)D3 following repeated dosing up to 1250 μg/d in the test set. It also made sensible predictions for large single vitamin D3 doses up to 50,000 μg in the test set. Model predicts 10 μg/d regimen may be ineffective for achieving sufficiency (plasma 25(OH)D3 ≥ 75 nmol/L) for a severely deficient individual (baseline 25(OH)D3 = 10 nmol/L), and it might take the same person over 200 days to reach suf-ficiency at 20 μg/d dose. We propose to personalize vitamin D3 supplementation protocol with this PBPK model. It would require measuring 25(OH)D3 baseline levels, which is not routinely performed under the current UK public health advice.
Study HighlightsWHAT IS THE CURRENT KNOWLEDGE ON THE TOPIC?Vitamin D PK exhibits substantial inter- individual variability. Different officially recommended daily doses are confusing.WHAT QUESTION DID THIS STUDY ADDRESS?Is the UK’s recommended 10 µg daily dose sufficient? Should everyone be given same dose?WHAT DOES THIS STUDY ADD TO OUR KNOWLEDGE?Our model accurately predicts plasma 25(OH)D under daily oral administration of vitamin D3. The 10 µg daily vitamin D3 dose is insufficient for prophylaxis (plasma 25(OH)D at 75 nmol/L).

724 | HUANG ANd YOU
INTRODUCTION
Vitamin D is important for the prevention of osteoporosis and cancer,1 and it may play potential roles in diabetes, autoim-mune disease, and coronavirus disease 2019 (COVID- 19).2,3 Unfortunately, vitamin D deficiency is common around the world. In North America, the prevalence of severe deficiency (serum 25(OH)D < 30 nmol/L) increased to 10% between 2001 and 2006, and 12 to 15- year- old adolescents, 20 to 30- year- old adults, people who are pregnant, Black, or obese were over- represented in this increase.4 In Europe, extensive studies on vitamin D level indicate the prevalence of vita-min D deficiency (serum 25(OH)D < 50 nmol/L) in most countries were over 20% except some Nordic countries,5 where traditional Nordic diet of cod and cod liver is specu-lated to explain such difference.5 UK’s National Dietary and Nutrition Survey revealed that the prevalence of hypovita-minosis D (serum 25(OH)D < 40 nmol/L) in most regions is over 30% in spring, and the prevalence is higher in the northern UK.6 Hypovitaminosis D was particularly serious among the British elderly and it was also reported among British adolescents.7
Countries have issued different public health advice for vitamin D. The Recommended Dietary Allowance proposed by the US Institute of Medicine is 600 IU/d for persons 1 to 70 years old and 800 IU/d for 71 years old and over to maintain vitamin D level over 50 nmol/L.8 The UK Scientific Advisory Committee on Nutrition currently recommends a Reference Nutrient Intake for vitamin D of 400 IU/d all year round for the general UK population, including pregnant and lactating women and people at increased risk of vitamin D deficiency, to maintain serum 25(OH)D concentration no less than 25 nmol/L.9
In addition, different values of optimal vitamin D serum level and dose regimens for disease prevention have been re-ported. The amount of 930 IU/d was proposed to maintain serum 25(OH)D greater than or equal to 50 nmol/L,10 and doses between 1800 and 4000 IU/d were suggested to achieve 75– 110 nmol/L for prophylaxis of cardiovascular disease and colorectal cancer.11 The amount of 1885 IU/d was suggested for a person with normal body mass index (BMI) to achieve 25(OH)D greater than 58 nmol/L,12 whereas 6000 IU/d was concluded to be needed to achieve 25(OH)D greater than 100 nmol/L.13 The amount of 10,000 IU/d was regarded safe for everyone.14 In addition, monthly administration of a large
vitamin D dose at 50,000 IU may maintain serum 25(OH)D levels above 50 nmol/L (20 ng/ml) in healthy subjects.15
As 25(OH)D serum levels are variable among people, a model to accurately predict 25(OH)D pharmacokinetics (PKs) in an individual is needed for personalizing dose reg-imen. Previously, a physiologically- based pharmacokinetic (PBPK) model attempted to fit short duration (28 days) low dose (5 µg/d and 10 µg/d, 1 µg = 40 IU) 25(OH)D plasma data with 5 time points for each group.16 The complex model had 34 parameters. The authors noticed a high degree of variability in the baseline serum 25(OH)D levels, but un-fortunately did not assess the impact of subjects who were believed to be outliers (5 µg/d: 3/8. 10 µg/d: 2/8). The model prediction was in line with mean 25(OH)D of the remaining 5 µg/d group (baseline levels ~ 35 nmol/L) and 10 µg/d group (baseline levels ~ 20 nmol/L). Variability estimates would be expected to change if these outliers were accounted for.16 A nonlinear mixed effects model was reported to have success-fully recapitulated PK data for a range of doses.17 However, population- level predictions by that model could be im-proved, as predictions deviated from observations by about 50% in some cases. Moreover, from that analysis, it was un-clear if factors such as BMI and season should be considered to accurately predict 25(OH)D PK for an individual at any given time.17 These considerations motivated us to develop a novel PBPK model to help inform selection of appropriate dose regimen for an individual.
METHOD
The workflow of this study includes data compilation and exploration, PBPK model development, validation, and ap-plication (Figure S1).
Clinical data compilation and exploration
We systematically retrieved articles published in English lan-guage between January 1970 and January 2019, which are ac-cessible by PubMed, Google Scholar, and “https://clini caltr ials.gov/.” The keywords include vitamin D, cholecalciferol, 25- hydroxyvitamin D, 25(OH)D, plasma, and pharmacoki-netics. Vitamin D3 trials were conducted under single dose and repeated daily dosing (Tables S1– S4, S9– S13), whereas
HOW MIGHT THIS CHANGE DRUG DISCOVERY, DEVELOPMENT, AND/OR THERAPEUTICS?Combining blood test to measure 25(OH)D baseline with this PBPK model will help inform dosage selection and select follow- up date to improve effectiveness of Hypovitaminosis D treatment.

| 725PERSONALISE VITAMIN D3 BY PBPK MODELLING
25(OH)D3 trials used repeated daily dose only (Figure S8). We excluded trials with other dosing frequencies.
We excluded vitamin D2 studies. Among the included 155 treatment arms, only 13 arms (6 for training and 7 for testing) did not specify whether vitamin D2 or D3 was used (Table S1). They were included as vitamin D3 and we tabulated these studies to look up their visual predic-tive check (VPC; Table S13). For simplicity, vitamin D3 and 25(OH)D3 are referred to as vitamin D and 25(OH)D, respectively.
All studies involved subjects aged 18 and over without disease or conditions which might influence PK of vitamin D or 25(OH)D. They all have normal renal functions, although only 30 of 155 arms annotated creatinine levels (Table S1). Additionally, subjects who were prescribed vitamin D greater than or equal to 2000 IU/d prior to study enrollment or drugs that may affect vitamin D PK during the trial were excluded. Figures were digitized using WebPlotDigitizer (https://autom eris.io/WebPl otDig itize r/) to obtain plasma or serum con-centrations. Most data were plasma. Both plasma and serum values were treated equivalently.18 Imputation methods for missing data are described in Table S8.
Model development
We first modeled vitamin D PKs. Non- elimination organs other than adipose tissue were lumped into a compartment called “the rest of body.” The initial draft model Run001a considered 6 compartments, including adipose, liver, venous, arterial, depot, and the rest of the body (Model Schematic Diagrams.pptx and Tables S5– S7).
Based on vitamin D PK model Run004, 25(OH)D PK model was subsequently developed with 400 IU/d and 4000 IU/d data (Figure S6).
For simplicity, we initially assumed linear vitamin D metabolism and 25(OH)D elimination, 100% oral bioavail-ability, all vitamin D was metabolized into 25(OH)D, each compartment was well- stirred, and the distribution was per-fusion limited (Run006 and Run007).
For a non- elimination organ:
For an elimination organ:
where AT (nmol) was the amount of drug, CT (nmol/L) the con-centration in tissue T, QT (L/h) the blood flow rate, VT (L) the volume of distribution, KPT (dimensionless number) the tissue
to plasma partition coefficient, and CLT (L/h) the plasma drug clearance.
In models Run008, Run009a, Run009b, and Run010, 25(OH)D clearance was modeled as:
where CLmax was maximum clearance, C50 was the concentra-tion at half CLmax and � an exponent.
In model Run010, 25(OH)D partitioning coefficient in the rest of body was modeled as:
where Kp25max was the maximum partition coefficient, C50KP25 was the concentration at half Kp25max, and �2 as an exponent.
Endogenous vitamin D production rate (ENDOG) was as-sumed to be constant throughout the course of the study. Steady state was assumed prior to dosing. Hence, ENDOG equals to the clearance rate of basal plasma 25(OH)D (D25BASE). Initial conditions were expressed by D25BASE with other kinetic parameters (see Final Model section of the Supplementary Material for results). To simulate an arm, initial conditions were first determined at the arm’s D25BASE. Instead of nonlin-ear mixed effect (NLME) modeling, we fitted all arms with the same set of parameter values. We assumed different values for vitamin D clearance under single dose (SCLH) and repeated daily doses (MCLH). This is similar to interoccasion variabil-ity in NLME modeling.
Software
Numerical simulation was performed in Fortran 90 com-piled in gfortran in RStudio Cloud environment (https://rstud io.cloud, R version 3.6.0, deSolve package version 1.28, and FME package version 1.3.5).
Sensitivity analysis
Normalized sensitivity component Si,j is given by:
where yi is an output variable and �j is a parameter.Collinearity index is defined as:
dAT
dt= QT × CT − QT ×
AT
VT × KPT
dAT
dt= QT × CT − QT ×
AT
VT × KPT
− CLT ×AT
VT × KT
CL25D =CLmax × C25D
�
C50� + C25D
�
KP25rb =Kp25max × C25D
�2
C50Kp25�2 + C25D
�2
Si,j =�yi
��j
�j
yi
� =1
√
min(EV[STS])
726 | HUANG ANd YOU
where Si,j =Si,j
∑
jS2i,j
and EV[ŜTŜ] represents eigenvalue of a matrix.
For a pair of orthogonal parameters, construct a matrix S of nx2, where n is the number of observations. By definition, the dot product of an orthonormal matrix is the identity ma-trix with eigenvalue 1 and collinearity index � = 1.
Change in the prediction caused by change in one parame-ter can be compensated by the 1 − 1∕� fraction by appropriate changes in other parameters.
To assess identifiability for multiple parameters, cutoff for collinearity index � is set to 10, where 90% of the param-eter’s influence on prediction can be compensated by another parameter in the pair or all other parameters in the group. Results were reported in Table S7.
Bayesian analysis
Model fitting assumed that residuals followed a normal dis-tribution. Functions including optim, nls, and nlminb from R base packages and the Levenberg- Marquardt algorithm from package minpack.lm were used to obtain maximum likelihood estimate of parameters.19 With these as prior dis-tributions, we then applied the delayed rejection and adap-tive Metropolis (DRAM) procedure to perform Markov Chain Monte Carlo (MCMC) simulation (3000 iterations including 1000 iterations for burn- in, lower = 0.1 × Prior, upper = 10 × Prior, updatecov = 100) and obtained posterior distribution, using FME package (modMCMC function).20,21
Model assessment and selection
A set of nested models was developed in serial. A model with good inference was deemed favorable (Table S7). Diagnostic plots include goodness of fit, VPC, and conditional weighted residuals (CWRES) versus PRED or time were assessed. For VPC, function sensRange in the FME package was used to simulate expected PK and 5%– 95% quantiles.
RESULTS
PK data collection
Over 78% of study arms came from randomized controlled trials (Table S1). Over 74% of arms were published after year 2000. Trials covered all continents except Antarctica, with the highest number of trial arms conducted in the United States, followed by the Netherlands, United Kingdom, and Canada. Subjects came from all age groups. Based on aver-age BMI, 31 arms were normal, 59 arms were overweight (25 < BMI ≤ 30), and 18 arms were obese (BMI > 30), whereas
47 arms were unknown. Eighty- four percent of study arms were annotated with season. Various quantification methods were used, including radio- immunoassay (RIA), competitive protein- binding assay/high- performance liquid chromatog-raphy (CPBA/CPBA- HPLC), liquid chromatography mass spectrometry/liquid chromatography tandem mass spec-trometry (LC- MS/LC- MS- MS), HPLC, and others (CHEMI, ELISA, etc.) in descending order (Table S1).
A total of 307 subjects from 13 arms in 6 clinical trials were included in the vitamin D PK dataset, with an average of 84 plasma or serum vitamin D samples each (Table S2). Five arms assessed single- dose administration and eight arms assessed repeated dose administration. All but 2 articles were published after the year 2000. Daily doses were between 70 μg (2800 IU) and 2500 μg (100000 IU). Several types of dosage were used, including tablets, capsules, powders, and two trials were unknown. Most subjects were between 30 and 50 years old, including both men and women.
For 25(OH)D, 451 mean plasma concentration time points were measured in 6484 subjects in 126 trial arms (Table S3 and S4).
Data exploration
All PK data are graphed in Figure 1. Final levels of vitamin D and 25(OH)D increased with dose. Vitamin D and 25(OH)D have half- lives of around 20 h and 15 days, respectively. In line with this, at 137.5 μg/d dose (5500 IU/d), plasma vi-tamin D reached PK steady states within 10 days (Figure 1b), whereas it took more than 50 days for 25(OH)D to reach PK steady state at a similar 125 μg/d dose (5000 IU/d; Figure 1d).
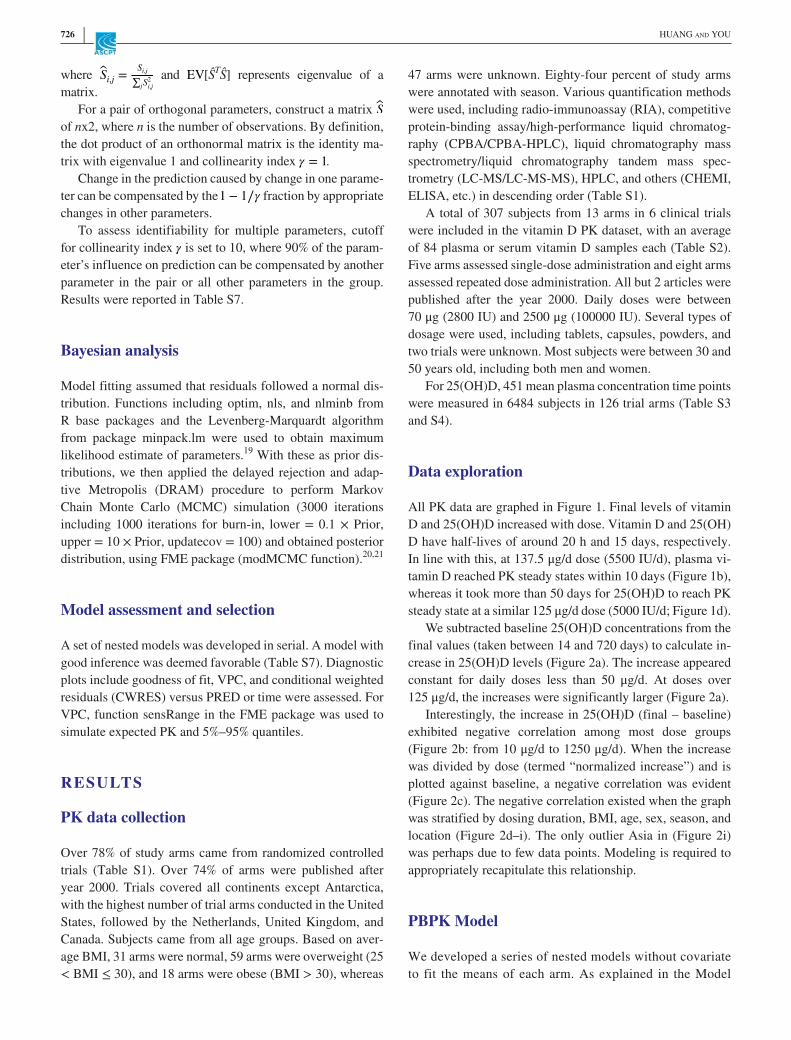
We subtracted baseline 25(OH)D concentrations from the final values (taken between 14 and 720 days) to calculate in-crease in 25(OH)D levels (Figure 2a). The increase appeared constant for daily doses less than 50 μg/d. At doses over 125 μg/d, the increases were significantly larger (Figure 2a).
Interestingly, the increase in 25(OH)D (final – baseline) exhibited negative correlation among most dose groups (Figure 2b: from 10 μg/d to 1250 μg/d). When the increase was divided by dose (termed “normalized increase”) and is plotted against baseline, a negative correlation was evident (Figure 2c). The negative correlation existed when the graph was stratified by dosing duration, BMI, age, sex, season, and location (Figure 2d– i). The only outlier Asia in (Figure 2i) was perhaps due to few data points. Modeling is required to appropriately recapitulate this relationship.
PBPK Model
We developed a series of nested models without covariate to fit the means of each arm. As explained in the Model

| 727PERSONALISE VITAMIN D3 BY PBPK MODELLING
development section, initial conditions were solved ana-lytically. For each arm, they were computed by basal plasma 25(OH)D (D25BASE) and kinetic parameters. Thereby, simulation of an arm incorporates D25BASE. For vitamin D PK, only Run004 returned good parameter in-ference (Table S7). It also successfully recapitulated data (Figures S5, S6). Based on Run004, 25(OH)D model was developed.
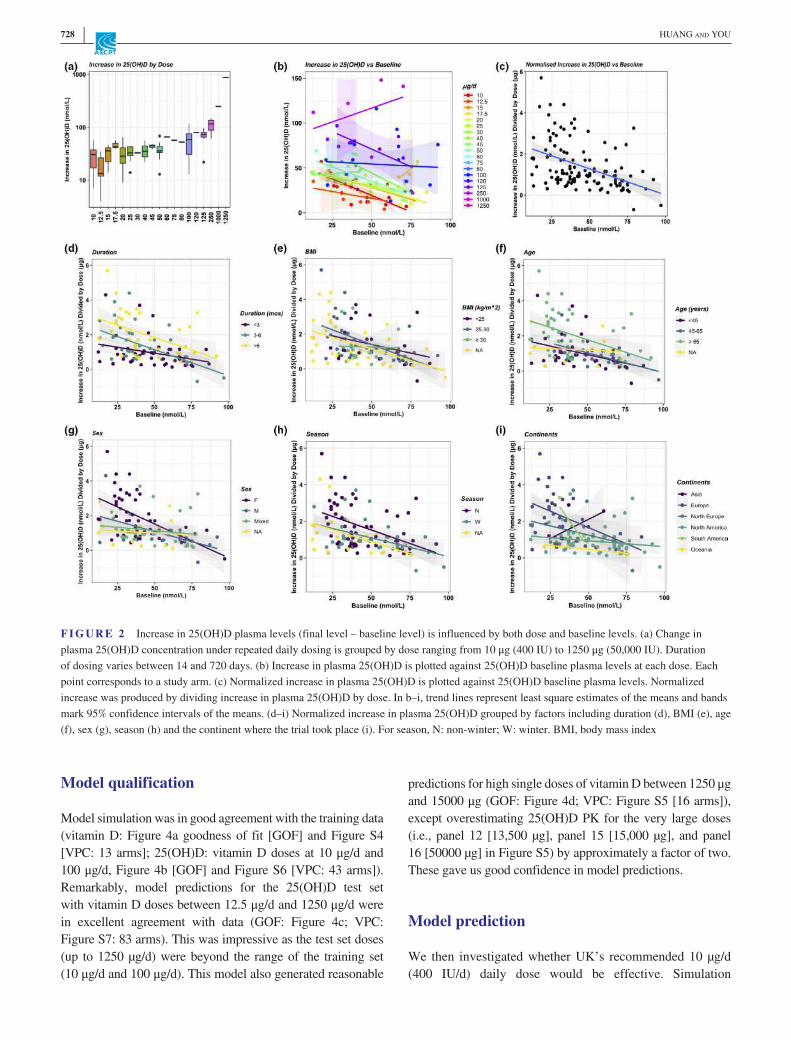
The final model Run009b considered 4 compartments, including venous, arterial, liver, and the rest of the body for both vitamin D and 25(OH)D (Figure 3). This model as-sumed a first- order absorption and elimination of vitamin D, and a nonlinear 25(OH)D clearance (Figure S9). For 25(OH)D less than 50 nmol/L, 25(OH)D clearance was predicted to be minimum (Figure S9), which would favor accumulation
of plasma 25(OH)D. This provided an explanation for the in-verse relationship plotted in Figure 2.
As a vitamin D dose is roughly equivalent to one- third the dose of 25(OH)D,22 the rate of 25(OH)D production was assumed to be equal to one- third the rate of vitamin D clear-ance. Model simulations of 25(OH)D PK under daily 25(OH)D doses at 7 µg/d and 20 µg/d were in agreement with data supporting this hypothesis (Figure S8).
The prior distribution of parameters was obtained by max-imum likelihood fitting to the training set (Figure 1a,b, Figure 1C: 10 μg/d and 100 μg/d groups), as tabulated in Table 1. We then performed MCMC simulation (Figure S2) to obtain posterior distribution of each parameter (Table 1), which was unimodal (Figure S3). The posteriors exhibited low uncertainty and were similar to the priors.
F I G U R E 1 Plasma PK of vitamin D and 25(OH)D after single or repeated daily dosing of vitamin D across a wide range of doses. (a) Vitamin D PK after single dose (days 0– 5). (b) Vitamin D PK under repeated daily dosing (days 0–150). (c) The 25(OH)D PK after single dose (days 0–360). (d) 25(OH)D PK under repeated daily dosing (days 0–360). PK, pharmacokinetic
728 | HUANG ANd YOU
Model qualification
Model simulation was in good agreement with the training data (vitamin D: Figure 4a goodness of fit [GOF] and Figure S4 [VPC: 13 arms]; 25(OH)D: vitamin D doses at 10 μg/d and 100 μg/d, Figure 4b [GOF] and Figure S6 [VPC: 43 arms]). Remarkably, model predictions for the 25(OH)D test set with vitamin D doses between 12.5 μg/d and 1250 μg/d were in excellent agreement with data (GOF: Figure 4c; VPC: Figure S7: 83 arms). This was impressive as the test set doses (up to 1250 µg/d) were beyond the range of the training set (10 μg/d and 100 μg/d). This model also generated reasonable
predictions for high single doses of vitamin D between 1250 μg and 15000 μg (GOF: Figure 4d; VPC: Figure S5 [16 arms]), except overestimating 25(OH)D PK for the very large doses (i.e., panel 12 [13,500 µg], panel 15 [15,000 µg], and panel 16 [50000 µg] in Figure S5) by approximately a factor of two. These gave us good confidence in model predictions.
Model prediction
We then investigated whether UK’s recommended 10 µg/d (400 IU/d) daily dose would be effective. Simulation
F I G U R E 2 Increase in 25(OH)D plasma levels (final level – baseline level) is influenced by both dose and baseline levels. (a) Change in plasma 25(OH)D concentration under repeated daily dosing is grouped by dose ranging from 10 μg (400 IU) to 1250 μg (50,000 IU). Duration of dosing varies between 14 and 720 days. (b) Increase in plasma 25(OH)D is plotted against 25(OH)D baseline plasma levels at each dose. Each point corresponds to a study arm. (c) Normalized increase in plasma 25(OH)D is plotted against 25(OH)D baseline plasma levels. Normalized increase was produced by dividing increase in plasma 25(OH)D by dose. In b– i, trend lines represent least square estimates of the means and bands mark 95% confidence intervals of the means. (d– i) Normalized increase in plasma 25(OH)D grouped by factors including duration (d), BMI (e), age (f), sex (g), season (h) and the continent where the trial took place (i). For season, N: non- winter; W: winter. BMI, body mass index
| 729PERSONALISE VITAMIN D3 BY PBPK MODELLING
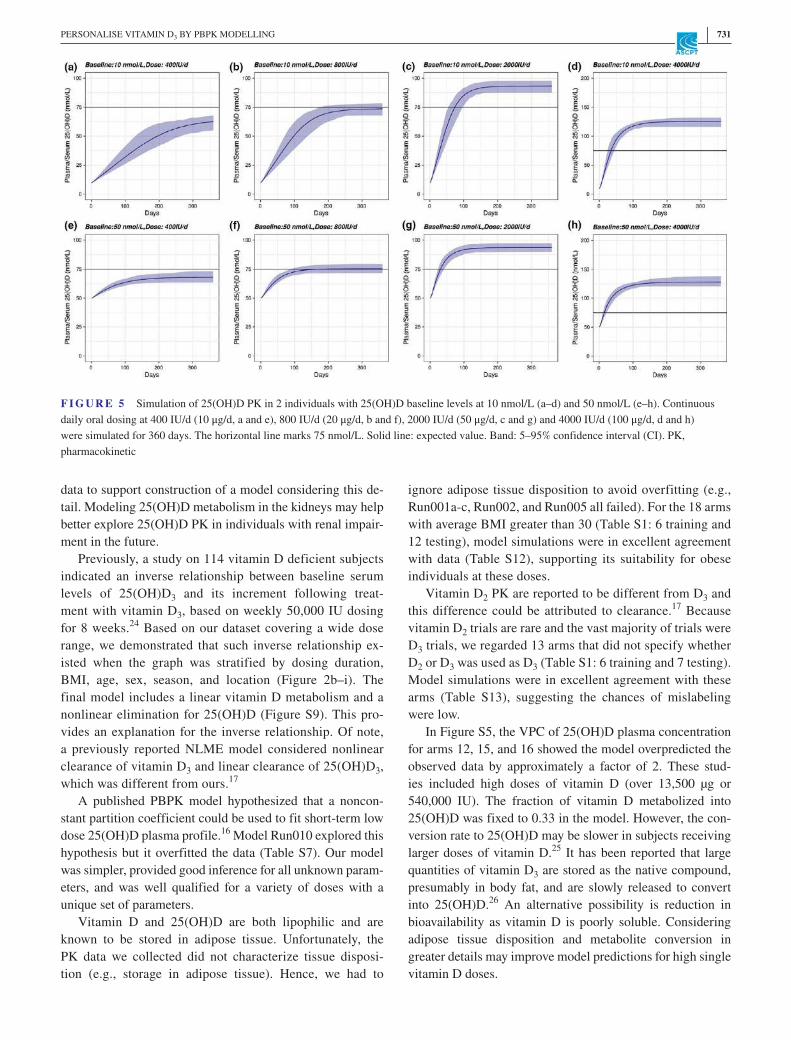
suggested 10 µg/d oral dosing would not achieve sufficiency (75 nmol/L plasma 25(OH)D)23 for a severely deficient sub-ject (Figure 5a: 10 nmol/L basal 25(OH)D) or an insufficient subject (Figure 5e: 50 nmol/L baseline). Interestingly, similar PK steady- states were predicted for both individuals, but it would take very different time for them to achieve sufficiency. Although it might take over 200 days of continuous 20 µg/d (800 IU/d) dosing for the severely deficient to achieve suf-ficiency (Figure 5b), it would take half the time (~ 100 days) for the insufficient subject to do the same (Figure 5f). Under 50 µg/d (2000 IU/d), time to sufficiency would be reduced to 75 days (Figure 5c) and 30 days (Figure 5g), respectively, which would be further decreased to 40 days (Figure 5d) and 20 days (Figure 5h) under 100 µg/d (4000 IU/d). Considering the need to ensure compliance and deliver effectiveness, doses much higher than 20 µg/d are likely needed to rapidly elevate 25(OH)D in a severely deficient subject in the clinics.
As this model makes accurate predictions for doses up to at least 1250 µg/d, it is a useful tool to support informed dose selection in the clinics.
We also asked how quickly 25(OH)D plasma levels would drop after daily oral administration is discontinued, ignoring changes in seasons and diets. Both the severely deficient (Figure 6a) and the insufficient (Figure 6c) sub-jects received 180 × 20 µg/d (800 IU/d) oral doses were predicted to exhibit similar 25(OH)D reduction profiles upon administration is discontinued after day 180. For the severely deficient subject who received 180 × 50 µg/d (2000 IU/d) doses, 25(OH)D plasma concentration was predicted to decrease precipitously below 75 nmol/L in ~ 30 days after administration was discontinued (Figure 6b), similar to the insufficient subject (Figure 6d). These high-light the importance of compliance in maintaining vitamin D sufficiency.
F I G U R E 3 Diagram of the final model. ENDOG, endogenous vitamin D production rate, GI, gastrointestinal
T A B L E 1 Prior and posterior distributions of drug- specific parameters in the final model
Parameter Description Unit Prior distribution Posterior distributiona
Vitamin D
Ka Absorption rate h−1 0.20 0.19 (0.05)
Kpl Partition coefficient for liver Dimensionless 1 (fixed) NA
Kprb Partition coefficient for the rest of the body Dimensionless 0.09 0.09 (0.02)
SCLH Hepatic clearance after single dose h−1 0.32 0.32 (0.06)
MCLH Hepatic clearance after repeated dose h−1 0.21 0.21 (0.004)
25(OH)D
Fm Fraction of vitamin D metabolized into 25(OH)D Dimensionless 0.33 (fixed) NA
Kp25rb Partition coefficient of rest of body Dimensionless 0.19 0.54 (0.15)
C50 C50 in CL Emax model (CL_C50) nmol/L 77.9 86.3 (4.23)
� GAMMA in CL Emax model (CL_GAMMA) Dimensionless 8.55 5.64 (1.28)
CLmax Emax value in Emax model (CL_Emax) L/h 0.04 0.033 (0.0023)
Abbreviations: CL, clearance; Emax, maximum effect; NA, not applicable.aNumber in parenthesis is SD of marginal posterior distribution from MCMC simulation.

730 | HUANG ANd YOU
DISCUSSION
Here, we reported a PBPK model with a relatively simple struc-ture, based on PK of vitamin D (single dose: 70 μg, 140 μg, and 2500 μg; repeated dose: 20 μg/d– 275 μg/d; Figure 4a, Figure S4) and 25(OH)D (repeated dose: 10 μg/d and 100 μg/d; Figure 4b, Figure S6). Impressively, the model accurately predicted 25(OH)D PK under daily vitamin D dosing between 12.5 μg/d and 1250 μg/d (Figure 4c, Figure S7), and made reasonable pre-dictions for high single vitamin D doses between 1250 μg and 50000 μg (Figure 4d, Figure S5). It also generated good predic-tions for 25(OH)D dosing at 7 µg/d and 20 µg/d (Figure S8).
It is worth noting that healthy subjects in the dataset we compiled refer to people without disease that are known to alter vitamin D PK, although creatinine levels were not con-sistently reported (Table S1: 30 arms reported normal cre-atinine levels, the remaining 125 arms unknown). However, they may suffer from other types of disease, especially the elderly subjects included. In addition, some of the arms are severely deficient (baseline levels lower than 30 nmol/L: Figure 1a,b,d) and our model made accurate predictions for these. This observation provides confidence that the model may be useful in the clinic. The 25(OH)D metabolism takes place in the kidneys. Unfortunately, we did not find sufficient
F I G U R E 4 Goodness of fit plot: vitamin D and 25(OH)D of training set and test set. (a) Vitamin D under single dose (vitamin D: 70 μg– 2500 μg) and repeated doses (vitamin D: 20 μg/d– 275 μg/d) (training). (b) The 25(OH)D under repeated vitamin D doses at either 10 μg/d or 100 μg/d (training). (c) The 25(OH)D under repeated vitamin D daily doses from 12.5 μg/d to 1250 μg/d, except for 10 μg/d or 100 μg/d (testing). (d) The 25(OH)D under single vitamin D dose between 1250 μg and 50000 μg (testing). R squared was calculated in the natural scale
| 731PERSONALISE VITAMIN D3 BY PBPK MODELLING
data to support construction of a model considering this de-tail. Modeling 25(OH)D metabolism in the kidneys may help better explore 25(OH)D PK in individuals with renal impair-ment in the future.
Previously, a study on 114 vitamin D deficient subjects indicated an inverse relationship between baseline serum levels of 25(OH)D3 and its increment following treat-ment with vitamin D3, based on weekly 50,000 IU dosing for 8 weeks.24 Based on our dataset covering a wide dose range, we demonstrated that such inverse relationship ex-isted when the graph was stratified by dosing duration, BMI, age, sex, season, and location (Figure 2b– i). The final model includes a linear vitamin D metabolism and a nonlinear elimination for 25(OH)D (Figure S9). This pro-vides an explanation for the inverse relationship. Of note, a previously reported NLME model considered nonlinear clearance of vitamin D3 and linear clearance of 25(OH)D3, which was different from ours.17
A published PBPK model hypothesized that a noncon-stant partition coefficient could be used to fit short- term low dose 25(OH)D plasma profile.16 Model Run010 explored this hypothesis but it overfitted the data (Table S7). Our model was simpler, provided good inference for all unknown param-eters, and was well qualified for a variety of doses with a unique set of parameters.
Vitamin D and 25(OH)D are both lipophilic and are known to be stored in adipose tissue. Unfortunately, the PK data we collected did not characterize tissue disposi-tion (e.g., storage in adipose tissue). Hence, we had to
ignore adipose tissue disposition to avoid overfitting (e.g., Run001a- c, Run002, and Run005 all failed). For the 18 arms with average BMI greater than 30 (Table S1: 6 training and 12 testing), model simulations were in excellent agreement with data (Table S12), supporting its suitability for obese individuals at these doses.
Vitamin D2 PK are reported to be different from D3 and this difference could be attributed to clearance.17 Because vitamin D2 trials are rare and the vast majority of trials were D3 trials, we regarded 13 arms that did not specify whether D2 or D3 was used as D3 (Table S1: 6 training and 7 testing). Model simulations were in excellent agreement with these arms (Table S13), suggesting the chances of mislabeling were low.
In Figure S5, the VPC of 25(OH)D plasma concentration for arms 12, 15, and 16 showed the model overpredicted the observed data by approximately a factor of 2. These stud-ies included high doses of vitamin D (over 13,500 µg or 540,000 IU). The fraction of vitamin D metabolized into 25(OH)D was fixed to 0.33 in the model. However, the con-version rate to 25(OH)D may be slower in subjects receiving larger doses of vitamin D.25 It has been reported that large quantities of vitamin D3 are stored as the native compound, presumably in body fat, and are slowly released to convert into 25(OH)D.26 An alternative possibility is reduction in bioavailability as vitamin D is poorly soluble. Considering adipose tissue disposition and metabolite conversion in greater details may improve model predictions for high single vitamin D doses.
F I G U R E 5 Simulation of 25(OH)D PK in 2 individuals with 25(OH)D baseline levels at 10 nmol/L (a– d) and 50 nmol/L (e– h). Continuous daily oral dosing at 400 IU/d (10 μg/d, a and e), 800 IU/d (20 μg/d, b and f), 2000 IU/d (50 μg/d, c and g) and 4000 IU/d (100 μg/d, d and h) were simulated for 360 days. The horizontal line marks 75 nmol/L. Solid line: expected value. Band: 5– 95% confidence interval (CI). PK, pharmacokinetic

732 | HUANG ANd YOU
CONCLUSIONS
Here, we compiled clinical PK profiles for vitamin D and 25(OH)D in response to a wide range of doses, and we successfully developed a minimal PBPK model to reca-pitulate a training set, and each parameter carried unam-biguous physiological meaning. Importantly, predictions of this model were in good agreement with test set data (12.5 μg– 50,000 μg) that were not used for structural and parametric inference. The model also embodies a novel
hypothesis for why 25(OH)D baseline level might in-fluence increase in 25(OH)D under a given dosing regi-men. Our modeling suggests UK’s 10 µg daily oral dose guideline might be ineffective for prophylaxis purpose (> 75 nmol/L). If baseline 25(OH)D is quantified in an individual, our model could be used to support oral dos-age selection of vitamin D, estimate the time it takes to reach target 25(OH)D level in order to schedule follow- up blood test, and handle real world situations that involve missing doses and drug holiday. We believe putting such
F I G U R E 6 Simulation of 25(OH)D PK in two individuals with 25(OH)D different baseline levels. (a) Baseline =10 nmol/L; 800 IU/d. (b) Baseline =50 nmol/L, 800 IU/d. (c) Baseline =10 nmol/L; 2000 IU/d. (d) Baseline =50 nmol/L; 2000 IU/d. The horizontal line marks 75 nmol/L. Dosings were discontinued after 180 days. Solid line: expected value. Band: 5– 95% confidence interval (CI). PK, pharmacokinetic

| 733PERSONALISE VITAMIN D3 BY PBPK MODELLING
model- informed decision making into practice would de-liver better clinical effectiveness.
ACKNOWLEDGEMENTSThe authors gratefully acknowledge the valuable discussions they had with Dr. Liu Dan (then Simcyp, now UCB) on data exploration and preliminary modelling in summer 2019. The authors also thank both reviewers for insightful comments which led to improvement of the manuscript as well as associ-ate editor Dr. Daniel Scholes Rosenbloom for his useful advice.
CONFLICT OF INTERESTThe authors declared no competing interests for this work.
AUTHOR CONTRIBUTIONST.Y. and Z.H. wrote the manuscript. T.Y. designed the re-search. T.Y. and Z.H. performed the research. T.Y. and Z.H. analyzed the data.
REFERENCES 1. Chandler PD, Chen WY, Ajala ON, et al. Effect of vitamin D3
supplements on development of advanced cancer a secondary anal-ysis of the VITAL randomized clinical trial. JAMA Network Open. 2020;3(11):e2025850.
2. Benskin LL. A basic review of the preliminary evidence that COVID- 19 risk and severity is increased in vitamin D defi-ciency. Front. Public Health. 2020;8:513. https://doi.org/10.3389/fpubh.2020.00513.
3. Jungreis I, Kellis M. Mathematical analysis of Córdoba calcife-diol trial suggests strong role for Vitamin D in reducing ICU ad-missions of hospitalized COVID- 19 patients. MedRxiv preprint. https://doi.org/10.1101/2020.11.08.20222 638.
4. Ganji V, Zhang X, Tangpricha V. Serum 25- hydroxyvitamin D concentrations and prevalence estimates of hypovitaminosis D in the U.S. population based on assay- adjusted data. J Nutr. 2012;142(3):498- 507. https://doi.org/10.3945/jn.111.151977.
5. Hewison M, Feldman D, Pike JW, Bouillon R, Giovannucci E, Goltzman D. (2017) Vitamin D (4th edition): Volume 2: Health, dis-ease and therapeutics. Waltham, MA: Academic Press; pp. 24- 25.Hardcover ISBN: 9780128099636. eBook ISBN: 9780128099643.
6. Hyppönen E, Power C. Hypovitaminosis D in British adults at age 45 y: nationwide cohort study of dietary and lifestyle predic-tors. Am J Clin Nutr. 2007;85(3):860- 868. https://doi.org/10.1093/ajcn/85.3.860.
7. National Diet and Nutrition Survey (NDNS): results from Years 1 to 4 (combined) of the rolling programme for 2008 and 2009 to 2011 and 2012. Public Health England and Food Standards Agency. Revised in February 2017.
8. Ross AC, Manson JE, Abrams SA, et al. The 2011 report on dietary reference intakes for calcium and vitamin D from the Institute of Medicine: what clinicians need to know. J Clin Endocrinol Metab. 2011;96(1):53- 58. https://doi.org/10.1210/jc.2010- 2704.
9. SACN. Vitamin D and Health. 2016. https://www.gov.uk/gover nment/ publi catio ns/sacn- vitam in- d- and- healt h- report.
10. Cashman KD, Fitzgerald AP, Kiely M, Seamans KM. A systematic review and meta- regression analysis of the vitamin D intake– serum
25- hydroxyvitamin D relationship to inform European recommen-dations. Br J Nutr. 2011;106(11):1638- 1648.
11. Bischoff- Ferrari HA, Shao A, Dawson- Hughes B, Hathcock J, Giovannucci E, Willett WC. Benefit– risk assessment of vitamin D supplementation. Osteoporos Int. 2009;21(7):1121- 1132. https://doi.org/10.1007/s0019 8- 009- 1119- 3.
12. Veugelers P, Pham T- M, Ekwaru J. Optimal vitamin D supplemen-tation doses that minimize the risk for both low and high serum 25- hydroxyvitamin d concentrations in the general population. Nutrients. 2015;7(12):10189- 10208. https://doi.org/10.3390/nu712 5527.
13. Kimball SM, Mirhosseini N, Holick MF. Evaluation of vitamin D3 in-takes up to 15,000 international units/day and serum 25- hydroxyvitamin D concentrations up to 300nmol/L on calcium metabolism in a com-munity setting. Dermato- Endocrinology. 2017;9(1):e1300213. https://doi.org/10.1080/19381 980.2017.1300213.
14. Heaney RP, Holick MF. Why the IOM recommendations for vi-tamin D are deficient. J Bone Mineral Res. 2011;26(3):455- 457. https://doi.org/10.1002/jbmr.328.
15. Brunel E, Schnitzler M, Foidart- Dessalle M, Souberbielle JC, Cavalier E. A double- blind, placebo controlled, randomized trial to assess the impact of a monthly administration of 50,000 IU of vitamin D3 for 6 months on serum levels of 25- hydroxyvitamin D in healthy young adults. Int J Endocrinol. 2013;2013:652648.
16. Sawyer ME, Tran HT, Evans MV. A physiologically based pharma-cokinetic model of vitamin D. J Appl Toxicol. 2017;37(12):1448- 1454. https://doi.org/10.1002/jat.3489.
17. Ocampo- Pelland AS, Gastonguay MR, French JF, Riggs MM. Model- based meta- analysis for development of a population- pharmacokinetic (PPK) model for Vitamin D3 and its 25OHD3 metabolite using both in-dividual and arm- level data. J Pharma Pharmacodyn. 2016;43(2):191- 206. https://doi.org/10.1007/s1092 8- 016- 9465- 1.
18. Colak A, Toprak B, Dogan N, Ustuner F. Effect of sample type, centrifugation and storage conditions on vitamin D concentration. Biochem Med (Zagreb). 2013;23(3):321- 325.
19. Elzhov TV, Mullen KM. minpack.lm: R Interface to the Levenberg- Marquardt Non- linear Least- Squares Algorithm Found in MINPACK. 2009. R package version 1.1- 1. http://CRAN.R- proje ct.org/packa ge=minpa ck.lm.
20. Haario H, Laine M, Mira A, Saksman E. DRAM: Efficient Adaptive MCMC. Stat. Comput. 2006;16:339- 354.
21. Laine M. Adaptive MCMC Methods with Applications in Environmental and Geophysical Models. Finnish Meteorological Institute Contributions 69. ISBN 978- 951- 697- 662- 7.
22. Shieh A, Ma C, Chun RF, et al. Effects of cholecalciferol vs cal-cifediol on total and free 25- hydroxyvitamin D and parathyroid hormone. J Clin Endocrinol Metab. 2017;102(4):1133- 1140. https://doi.org/10.1210/jc.2016- 3919.
23. Holick MF. Vitamin D deficiency. N Engl J Med. 2007;357:266- 281. https://doi.org/10.1056/nejmr a070553.
24. Kaykhaei MA, Khodadoost M, Dashipour AR, Haidari Z, Karimkoshteh A, Sandoughi M. Baseline levels determine magni-tude of increment in 25 hydroxy vitamin D following vitamin D3 prescription in healthy subjects. Endocrine. 2019;64(2):378- 383. https://doi.org/10.1007/s1202 0- 019- 01881 - 5.
25. Gertner JM, Domenech M. 25- Hydroxyvitamin D levels in pa-tients treated with high- dosage ergo- and cholecalciferol. Clin Pathol. 1977;30(2):144- 150.
26. Heaney RP, Armas LAG, Shary JR, Bell NH, Binkley N, Hollis BW. 25- Hydroxylation of vitamin D3: relation to circulating vitamin D3

734 | HUANG ANd YOU
under various input conditions. Am J Clin Nutr. 2008;87(6):1738- 1742. https://doi.org/10.1093/ajcn/87.6.1738.
SUPPORTING INFORMATIONAdditional supporting information may be found online in the Supporting Information section.
How to cite this article: Huang Z, You T. Personalise vitamin D3 using physiologically based pharmacokinetic modelling. CPT Pharmacometrics Syst. Pharmacol. 2021;10:723–734. https://doi.org/10.1002/psp4.12640