Personalisation on Instagram · Personalisation on Instagram Personalisation is a concept which is...
75
Kurskod: SKOK11/SKDK11 Termin: Spring term 2018 Handledare: Nils Holmberg Examinator: Nils Gustafsson Personalisation on Instagram A quantitative content analysis of prominent Swedish politicians’ Instagram posts ANGELICA CÖSTER & VICTOR DAHLBERG Lund University The Department of Strategic Communication Bachelor’s thesis
Transcript of Personalisation on Instagram · Personalisation on Instagram Personalisation is a concept which is...
Kurskod: SKOK11/SKDK11 Termin: Spring term 2018 Handledare: Nils Holmberg Examinator: Nils Gustafsson
Personalisation on Instagram
A quantitative content analysis of prominent Swedish politicians’ Instagram posts
ANGELICA CÖSTER & VICTOR DAHLBERG
Lund University The Department of Strategic Communication
Bachelor’s thesis

Abstract
Personalisation on Instagram
Personalisation is a concept which is based on the idea that focus is increas-
ingly directed at the individual politician and his or her personal characteris-
tics. Social media, such as Instagram, has revived the concept since the pos-
sibilities for personalised political communication have increased. This
study aimed to examine if personalised communication among prominent
Swedish politicians on Instagram has increased during the current parlia-
mentary term (2014-2018), if personalised communication gains more trac-
tion than other types of content on Instagram and, finally, if politicians in-
corporate private aspects when conveying political messages on Instagram.
To achieve this aim a quantitative content analysis of prominent Swedish
politicians’ Instagram posts (n=1641) was conducted. The findings show
that the proportion of personalised posts was large but it had not increased
during the current parliamentary term. Furthermore, personalised content
was associated with higher levels of popularity and engagement but the
study could not provide evidence for this being statistically significant for
all politicians at all times. Moreover, the study found that Swedish politi-
cians increasingly are incorporating private aspects when conveying politi-
cal messages and that these hybrids, as we have named them, are receiving
more popularity than political messages that are strictly political.
Number of characters: 106 568
Keywords: Digital political communication, strategic communication, per-
sonalisation, media logic, social media logics, quantitative content analysis,
Instagram, social media, hybrids, swedish politics, swedish politicians

Sammanfattning
Personalisering på Instagram Konceptet personalisering innebär att fokus allt oftare riktas mot individu-
ella politiker och deras personliga egenskaper. Sociala medier, så som In-
stagram, har gjort konceptet än mer aktuellt då möjligheterna att politiskt
kommunicera personligt har ökat genom dessa. Studien ämnade att under-
söka om personaliserad kommunikation av framstående svenska politiker på
Instagram har ökat under den senaste mandatperioden, om personaliserat in-
nehåll är mer attraktivt än andra innehållstyper på Instagram, samt om fram-
stående svenska politiker inkorporerar privata aspekter när de kommunice-
rar politiska budskap. För att uppnå detta syfte utfördes en kvantitativ inne-
hållsanalys av svenska politikers instagraminlägg (n=1641). Resultatet visar
att andelen personligt innehåll på Instagram var stor men fann ingen ökning
under den senaste mandatperioden. Personaliserat innehåll var associerat
med högre nivåer av popularitet och engagemang men studien kunde inte
statistiskt säkerställa att detta skulle gälla alla studerade politiker vid alla
tillfällen. Slutligen visade studien att svenska politiker alltmer använder pri-
vata aspekter när de kommunicerar politiska meddelanden på Instagram och
att dessa hybrider, som vi har valt att namnge dem, genererar mer populari-
tet än politiska meddelanden som är strikt politiska.
Antal tecken: 106 568
Nyckelord: Digital politisk kommunikation, strategisk kommunikation, per-
sonalisering, medielogiker, sociala medie-logiker, kvantitativ innehåll-
sanalys, Instagram, sociala medier, hybrider, svensk politik, svenska poli-
tiker
A Big Thank You
To Lund University and the Department of Strategic Communication
To our supervisor Nils Holmberg for supporting and guiding us
through this turbulent time of the Bachelor’s thesis.
To our families who have been incredible pillars of support,
partly in reading and giving advice but also through
providing emotional support whenever it was needed.
We would like to emphasise that both authors have contributed equally to
the dissertation and we hope that you will have a pleasant time reading it.
Angelica Cöster & Victor Dahlberg
Lund - 24 May 2018

Lund University SKOK11/SKDK11 Department of Strategic Communication Spring term 2018 Supervisor: NH
Table of content
1. Introduction .............................................................................................. 11.1. Background ......................................................................................... 11.2 Problem area ......................................................................................... 31.3. The aim of the study ............................................................................ 51.4. Delimitations ....................................................................................... 61.5. Outline of thesis ................................................................................... 61.6 Setting ................................................................................................... 7
1.6.1 The platform Instagram ................................................................. 71.6.2 Internet use and Instagram use in Sweden .................................... 71.6.3 Brief background on the Swedish political system ....................... 8
2. Previous research ..................................................................................... 92.1 The Personalisation Hypothesis – RQ1 ................................................ 92.2 Personalisation and popularity – RQ2 ................................................ 122.3 Previous research related to RQ3 ....................................................... 13
3. Theoretical framework .......................................................................... 153.1 Personalisation .................................................................................... 153.2 Mass media logic and Social media logics ......................................... 18
4. Method ..................................................................................................... 224.1 Choice of method ............................................................................... 224.2 Sample ................................................................................................ 23
4.2.1 Sampling of politicians ................................................................ 234.2.2 Sampling of posts ........................................................................ 24
4.3 Coding scheme and procedure ........................................................... 264.3.1 Coding scheme and variables ...................................................... 264.3.2 Coding procedure: training, coding manual and implementation ..................................................................................... 28
4.4 Quality criteria: intercoder reliability and validity ............................. 294.5 Data analysis ....................................................................................... 30
4.5.1 Data analysis for H1 .................................................................... 304.5.1 Data analysis for H2 .................................................................... 314.5.1 Data analysis for RQ3 ................................................................. 33
4.6 Method reflection ............................................................................... 33

2
5. Results and Analyses .............................................................................. 355.1 Introduction to results and analyses ................................................... 355.2 Descriptive overview of the data ........................................................ 355.3 Results and Analysis related to H1 and RQ1 ..................................... 36
5.3.1 Results related to H1 ................................................................... 365.3.2 Analysis related to the Personalisation Thesis - RQ1 ................. 37
5.4 Results and Analysis related to H2 and RQ2 ..................................... 395.4.1 Results related to H2 ................................................................... 395.4.2 Analysis related to Personalisation and Popularity - RQ2 .......... 45
5.3 Results and Analysis related to RQ3 .................................................. 475.5.1 Results related to RQ3 ................................................................. 475.5.2 Analysis related to hybrids - RQ3 ............................................... 49
6. Conclusions and discussion ................................................................... 516.1 Conclusions ........................................................................................ 516.2 Discussion .......................................................................................... 526.3 Research contribution and suggestions for further research .............. 54
References ................................................................................................... 56
Appendices .................................................................................................. 62Appendix 1 - Sampling of posts ............................................................... 62Appendix 2 – Coding manual ................................................................... 66Appendix 3 – Coding scheme .................................................................. 68

1
1. Introduction
1.1. Background
Social media has become an increasingly important component in political com-
munication and political mobilisation. It has opened up new ways for politicians
to interact with their party members and the public about their opinions, policy in-
itiatives and daily lives, but social media has also enabled politicians to control
their image in new ways (Kruikemeier, van Noort, Vliengenthart & de Vreese,
2013). More and more individual politicians are using social media platforms to
communicate with potential voters and their party members which makes the re-
curring thesis in political communication - personalisation - even more relevant
(Enli & Skogerbø, 2013).
Personalisation of politics is considered a central development in modern in-
dustrial democracies (Van Aelst, Sheafer & Stanyer, 2011). The personalisation
thesis is based on the idea that the focus is increasingly directed at the individual
politician and his or her personal traits at the sacrifice of parties, issues and insti-
tutions. This development is considered a result of two intertwined factors: firstly,
the process of party dealignment which means that the traditional bond between
the parties and voters is weakened; and, secondly, changes in the media landscape
which has led to a development of a media logic where personal aspects are fa-
voured in the news evaluation in order to attract a mass audience (Van Aelst, et
al., 2011; Kriesi, 2011; Karvonen, 2009). It can be argued that the tendency to di-
rect attention to the individual candidate or politician instead of the party has fur-
ther increased with the emergence of social media since these platforms are con-
structed in a way where personal content that engages the audience is favoured.
Politicians are hence provided with a platform where they increasingly can under-
take personalised campaigns and construct an image of themselves where their
personal characteristics and qualities are emphasized (Ekman & Widholm, 2017;
Larsson, 2017b; Kruikemeier et al, 2013; Enli & Skogerbø, 2013).

2
Personalisation can be studied and understood from three perspectives - the
voters, the media and the political actors. In more detail this means that, voters
may increasingly vote based on personal traits of the politician; the media may in-
creasingly focus on the individual politician and its activities at the expense of
coverage of the parties and institutions, and finally; the political actors may em-
phasise themselves and their personality traits rather than the party and its ideolo-
gies in their strategic communication strategies (Karvonen, 2010; Rahat &
Sheafer, 2007; Van Aelst et al., 2011). In this study, we have chosen to focus on
the latter, the political actors, and their strategic use of Instagram during the cur-
rent parliamentary term. There is a lack of research in this area since most studies
of the personalisation thesis in politics previously have focused on the ways in
which politicians are presented in the media and not how the politicians present
themselves (Hermans & Vergeer, 2012). Furthermore, Russman and Svensson
(2017) who is one of few that have studied politicians’ communication on Insta-
gram states that “further research should focus on candidate accounts”(p. 61)
which this study intends to do. Moreover, previous studies have focused on the
election campaign period (Gustafsson, 2015) whereas this study has been based
on Blumenthal’s (1980) idea that campaigns have become more or less permanent
and, therefore, examines a full parliamentary term.
The social media platform Instagram, which is the object of study, is a user-
generated image-sharing platform that has grown fast since its launch in 2010. In
late 2017, Instagram had 800 million users (Statista, 2018a) which means that the
global usage reach was 11 percent. In Sweden, however, this number is consider-
ably higher, 53 percent of all Swedes are active Instagram users (IIS, 2017) which
is the highest usage penetration in the world (Statista, 2018b). One would, there-
fore, assume that Instagram has caught the attention of both politicians who want
to reach this massive audience and scholars that study political communication,
but this does not seem to be the case. Instagram is still an emerging platform both
when it comes to politicians’ use of the platform but also when it comes to re-
search. Twitter is a more popular object of study (Russmann & Svensson, 2017)
which could be explained by the relative ease of data collection but also because it
is, in the Nordic region, considered as an elite medium used mostly by politicians,
PR-consultants and the media (Larsson, 2017a).

3
Instagram differs from other social media platforms as it is centred around
visual communication rather than textual communication. Differently put, the
platform is used to upload pictures with an optional caption whereas other social
media platforms such as Facebook and Twitter work the opposite way (Russmann
& Svensson, 2017). Images are not a new phenomenon in political communica-
tion, political campaigns have included tv-advertising, posters, and televised de-
bates for a long time (Russman & Svensson, 2017) and the importance of visuals
in an image-building process of a political actor is well-known (Filimonov, Russ-
man & Svensson, 2016). Visuals can, according to Barthes (1977), be helpful in
order to communicate the intended meaning and are also easier to remember and
pay attention to compared to text (Filimonov, et al., 2016). Despite its centrality,
“[t]he visual aspects of political communication remain one of the least studied
and the least understood areas and research focusing on visual symbols in political
communication is severely lacking ” (Schill, 2012, p. 119). Ekman and Widholm
(2017) also argue for the lack of research in visual political communication com-
paring it with textual political communication and Twitter which a lot of scholarly
work has been devoted to. Visual communication is, however, now an emerging
field of research in political communication (Schill, 2012).
1.2 Problem area
There are mixed perceptions among theorists regarding the consequences of poli-
tics becoming more personalised. Some scholars, such as de Vreese (2007), Enli
and Skogerbø (2013) and Kruikemeier et al., (2013), argue that personalisation
have positive implications for the democracy as it reduces the psychological gap
between the politicians and the public, and hence brings the citizens and politi-
cians closer together. The other standpoint which is represented by scholars like
Postman (1985), Hart (1992), Habermas (1989; 1996) and Sennet (1976) argue
that this, on the contrary, has negative effects for the democracy since it, instead
of focusing on substantial political issues, brings attention to personal information
which is seen as not being political or necessary. It is argued that this depoliticises
the public debate and leaves the public less informed on substantial issues (Van
Zoonen, 2005). Hart (1992) further argues that it can create cynicism among the

4
public since people will get more dissatisfied when politicians break their trust if
they are close to them and feel that they know them on a personal level.
Along with the trend of increased personalisation, the trust in the democratic
form of government is falling, a trend called democratic deconsolidation (Foa &
Mounk, 2017). In addition to this, more and more people across the globe are dis-
satisfied with, and are showing an increased scepticism towards, established polit-
ical parties, parliaments and institutions. This is especially evident in the United
States and some countries in Europe but Sweden is also showing signs of this
trend (Foa, Mounk & Inglehart, 2016; Foa & Mounk, 2017). Approval ratings for
the party leaders and parties are low and mistrust in political institutions is grow-
ing (Foa et al., 2016; SOM-institutet, 2016). Another sign of democratic deconsol-
idation is the rising popularity of the far-right populist party, Sweden Democrats,
which originally had a clear anti-establishment approach and can, thus, be linked
to this trend (Foa et al., 2016). This is not to say that this is the result of an in-
creased focus on politicians at the expense of parties and issues but it can, howev-
er, be argued that there is little evidence for personalisation bringing citizens and
politicians closer together at this time.
If the trend towards personalisation continues to evolve McAllister (2007) ar-
gue that party dealignment might further increase and the party leaders will hold a
greater deal of power and have greater autonomy. It might also result in election
results being determined by the election campaigns to a higher degree. Election
campaigns where the focus will be on the personal image rather than on political
issues. Another consequence of an increased personalisation is that it can eventu-
ally lead to demands for institutional reconstruction. Since Sweden's current par-
liamentary system is party-based it might not hold up its legitimacy in a future
where voters want to vote for a leader rather than a party (McAllister, 2007).
Even if this study’s aim is not to examine to what extent personalisation on
Instagram is affecting the democracy and the trust in political institutions it is im-
portant to shed light on the negative as well as positive consequences of this trend.
Since the number of people who question the liberal democratic system has in-
creased, Russman and Svensson (2017) argue that it has “been seen as increasing-
ly important for political actors to interact with the public about political matters;
and here, social media platforms are appealing” (p. 53). With that as a back-
ground, we believe that the results from this study will give insights into how
5
prominent Swedish politicians’ have communicated during the current parliamen-
tary term and, in that way, be helpful in order for them to improve their future
strategic communication with the consequences for the democracy in mind.
1.3. The aim of the study
The aim of the study is to examine prominent Swedish politicians’ Instagram ac-
counts in relation to the concept of personalisation. More specifically, we aim to
determine whether or not the proportion of personalised posts has increased dur-
ing the current parliamentary term and if there is a relationship between personal-
ised content and popularity or engagement (defined as likes and comments). Fur-
thermore, this study aims to uncover if Swedish politicians are incorporating as-
pects from their private sphere when communicating political messages, and if so,
see if this has increased during the current parliamentary term. A longitudinal
study was chosen since personalisation “refers to a trend, a process of change over
time” (Van Aelst, et al., 2011, p. 205) and therefore aims to examine if personali-
sation has increased over the last few years.
This will hopefully bring clarity in how Swedish politicians’ Instagram use
has developed during the present parliamentary term and if personalised content is
successful in terms of popularity and engagement. Lastly, we hope to reveal to
what extent personal aspects are used to strategically communicate political mes-
sages to potential voters. In order to reach this aim, the three following research
questions were formulated:
1. Has the proportion of personalised content on prominent Swedish politi-
cians’ Instagram accounts increased during the current parliamentary
term?
2. Is there a relationship between personalised content on Swedish politi-
cians’ Instagram and popularity/engagement?
3. a) Are politicians on Instagram incorporating aspects from their private
sphere when communicating political messages?
b) In that case, has the proportion of this communication strategy increased
during the current parliamentary term?

6
c) Are political messages with a connection to the politician’s private
sphere more popular than political messages that are strictly political?
1.4. Delimitations
This study has been delimited in several ways. First of all, we have chosen to
study personalisation on only one social media platform - Instagram - instead of
looking at this trend on a variety of platforms. Secondly, the study is delimited to
focus on the personalisation strategies employed by politicians in their own com-
municative efforts. Thirdly, the sample is delimited to include 16 politicians (2
from each party) and 8 posts per quarter since October 2014 (n=112/politician)
but still aims to generalise the results so that it represents these 16 politicians’
content overall during the current parliamentary term. Furthermore, this study is
delimited to only understand if personalisation among prominent Swedish politi-
cians has increased and to what extent personalisation is successful in terms of
popularity and engagement on Instagram and we are, thus, not trying to under-
stand this phenomenon and its consequences on a deeper level. To be able to do
that we would have needed to use qualitative methods as well. Moreover, this
study can not say anything about to what extent personalised content on Instagram
has an effect in terms of voting behaviour or level of trust in a specific politician.
We consider that the empirical data, despite the delimitations, is sufficient in
order to be able to answer the research questions. The choices on how to delimit
this study have been done as a consequence of the scarcity of time, choice of
method, as well as our area of interest - strategic political communication.
1.5. Outline of thesis
This study is disposed as follows. The next chapter will present an overview of
previous research on the personalisation thesis, the relationship between personal-
ised content and popularity and lastly the use of personal aspects when conveying
political messages. It will be divided in accordance with the research questions
and the first two sections will be concluded by proposing a hypothesis. The sub-
sequent chapter is outlining the theoretical framework in which we are trying to
intertwine two central theoretical concepts in digital political communication

7
namely: personalisation and media logics. The fourth chapter is devoted to the
choice of method, quantitative content analysis of Instagram posts (n=1641), and
our reflections surrounding this. This is followed by chapter five where the study's
result is presented and discussed in relation to the research questions and the theo-
retical framework. In the study’s sixth and final chapter a concluding discussion is
presented as well as suggestions for politicians’ strategic use of Instagram and fu-
ture research of political communication on the platform.
1.6 Setting
1.6.1 The platform Instagram
Instagram posts contain a picture or a video with an optional caption in connection
with the visual element (Filimonov et al., 2016). Additionally, the textual section
of the post complements the visual section with textual content and/or with
hashtags. These posts might also receive likes and/or comments from followers
and users. The technical course of action is that a user clicks on a digital heart-
shaped figure which symbolises that a user likes a poster’s post. The likes and
comments then become visible for all users to observe (Russman & Svensson,
2017).
1.6.2 Internet use and Instagram use in Sweden
Sweden has a high percentage of Internet penetration and Instagram has, as men-
tioned above, had an upsurge in usage lately (Filimonov et al., 2016). In fact, 53%
of the Swedish population used Instagram on a regular basis in 2017. This can be
compared with Twitter which only 25 percent of the Swedish population use regu-
larly. Since the study is examining the years 2014 -2018 it must be emphasized
that the overall development of usage on Instagram has increased steadily over the
last few years: 2014 - 36 %, 2015 - 40 %, 2016 - 44 %. A larger proportion of fe-
males and young people are using Instagram. For example, 81 percent in the age
group 16-25 use Instagram on a regular basis. However, the usage is increasing
the most among older Internet users where some of the age categories have dou-
bled in a year (IIS, 2017).

8
Seeing that almost half of the Swedish population use Instagram, political ac-
tors have the potential to reach a massive audience when targeting potential voters
on Instagram. Furthermore, younger people tend to be less interested in politics
(Loader, Vromen & Xenos, 2016) which makes communicating political content
through Instagram a great opportunity in order to reach those who normally are
not interested in politics. It should also be added that since females, especially
young females, are overrepresented on the platform this group can potentially be
reached in a way that might be considered impossible on other media platforms.
1.6.3 Brief background on the Swedish political system
Sweden has a multi-party system with proportional representation and the parlia-
mentary terms run for four years. Currently, there are eight different parties repre-
sented in the parliament and seven of these are cooperating in two different blocs.
The centre-right bloc consists of the Centre Party, Liberals, Moderates and Chris-
tian Democrats (Swedish Institute, 2018). The red-green alliance used to consist
of the Social Democrats, the Green Party and the Left Party, but this alliance is
currently disbanded, however, it still exists in a more informal manner. Besides
these seven parties, populistic Sweden Democrats is the eight party in the parlia-
ment although not belonging to any collaborating force at present time (Ekman &
Widholm, 2015).
9
2. Previous research
2.1 The Personalisation Hypothesis – RQ1
As mentioned in the introduction (see section 1.1), personalisation can be studied
and understood from three perspectives - the voters, the media and the political
actors’ - and our focus will be on the latter. There is however little research on this
area and much more focus has been directed towards the media perspective. We
will, thus, present the empirical results from studies in the media perspective and
try to connect them with the few studies that have been done concerning personal-
isation from the political actor perspective on social media in order to present an
overview of previous studies related to research question 1. It should be empha-
sized that this literature overview does not cover all research that has been con-
ducted on the area. In the selection of previous research, we chose to focus mainly
on studies concerning the northern European context.
The empirical evidence for the personalisation thesis from the news media
perspective is mixed which both Strömbäck (2014) and Rahat and Sheafer (2007)
explain might be a result of different researchers defining personalisation in vari-
ous ways as well as an absence of a uniform approach to the concept. Further-
more, Bjerling (2012) states that few studies have dealt with “the softer side of the
concept” (p.75) and instead focused on “the question of whether, over time, there
are more individual actors in the coverage” (p.75). Furthermore, previous research
has tended to disregard the importance of visuals in the personalisation thesis
(Bjerling, 2012).
A few examples of studies that support the thesis are Karvonen (2010), Lang-
er (2006) and Reinemann and Wilke (2007). The empirical result supporting the
personalisation thesis presented by Karvonen (2010) concerns campaign advertis-
ing. He found that the share of advertisements on the party had decreased steadily
while the advertisements on the individual candidate had stayed on a constant lev-
el. Langer’s (2006) study focused on media coverage of the British prime minis-
ters and she found evidence supporting three aspects of the personalisation thesis:

10
increased focus on personal traits and characteristics, increased focus on the lead-
ership aspect and finally an increased visibility. Reinemann and Wilke (2007)
studied election coverage in the German context and found that there was an
“enormous increase in the importance of appearance and the looks of candidates
”(p. 103).
Two examples of studies that present mixed evidence on the personalisation
thesis are Bjerling (2012) and Johansson (2008). Bjerling (2012) have conducted
the most extensive study on personalisation in the Swedish news media context
which covers the election campaigns between 1979 and 2010. The study shows
that not much has changed regarding how often the party leaders are mentioned in
the news media but the party leaders’ personal traits and characteristics are in-
creasingly emphasised. Johansson (2008) examined news coverage of eight Swe-
dish election campaigns since 1982 and found evidence supporting the thesis in
some media channels (e.g. tabloids). Three studies that reject the personalisation
thesis are Kreisi (2011), Asp and Johansson (1999) and Bennulf and Hedberg
(1993). Kreisi (2011) studied coverage of elections in six European countries and
found that “there is neither a general trend towards increasing personalisation in
media coverage of electoral campaigns, nor a trend towards increasing concentra-
tion of the media coverage on a limited set of top political leaders” (p.841). Asp
and Johansson (1999) and Bennulf and Hedberg (1993) have found similar results
and therefore reject the thesis in the Swedish context.
These studies’ empirical evidence are relevant also in the perspective of the
political actors’ strategic communication since personalisation in the media ac-
cording to Rahat and Sheafer (2007) “leads to personalization in the behaviour of
the politicians“ (p.65). Aylott (2005) shares this approach and suggests that since
the media have increased its focus on the individual party leaders, the parties have
responded by increasingly placing their candidates in the centre of their communi-
cation. Differently put, if there is an increased focus on the individual politician in
news coverage it is likely that the politician increasingly will start to behave and
communicate as an individual rather than as part of a collective.
Examples of studies that have focused on the political actors’ perspective in
an online context are Filimonov et. al. (2016), Lalancette and Raynauld (2014),
Enli and Skogerbo (2013) and Ekman and Widholm (2015; 2017). Filimonov et
al. (2016) studied Swedish political parties’ Instagram use four weeks during the
11
national election campaign in 2014 through a quantitative content analysis. They
found that the content posted “leaned towards personalization with a strong pres-
ence of top candidates” (p.1) but the content did not, however, display the candi-
dates’ personal life to a large extent but instead focused on the professional con-
text. Lalancette and Raynauld (2017) studied the Canadian Prime Minister Justin
Trudeau’s Instagram account through a mixed methods approach. They found that
even though the Instagram content was used to shape a positive image of Trudeau,
most content focused on him in a professional and political context rather than on
his private life. Enli and Skogerbo (2013) examined social media use among
Norwegian political communication. They found that the “social media marketing
was personalized and involved private exposure and individual initiatives” (p.770)
and suggests that social media have “become a new tool for personal politics, but
not a fully established part of campaign communication” (p.771).
Lastly, Ekman and Widholm (2015; 2017) have studied political communica-
tion on social media in two different studies. In their study Politicians as Media
Producers (2015), they examine Twitter in relation to the perspective of media-
tised interdependency between journalists and the politicians. They found that
“Twitter unquestionably contributes to the ongoing process of increased personal-
ization of politics, foremost by mediating the personal and private realm of politi-
cians’ lives” (p.87). Furthermore, they state that this increased personalisation on
social media contributes to what Wheeler (2013) names “celebrity politics” which
means that politicians are displayed as individual brands and that this, in turn, will
lead to an increased depoliticisation. The second study conducted by Ekman and
Widholm (2017) explored Swedish politicians’ Instagram use in relation the con-
cept of connectivity through a quantitative content analysis. They found that 65
per cent of the content on the platform did not contain any political messages
which means that a majority of the content focused on other dimensions than the
political. Furthermore, the content analysis showed that “the platform logic of In-
stagram contributed to the formation of digital lifestyle politics, where symbolic
connections between politicians and a variety of actors are staged through new
mediatized relations” (p. 15).
To sum up, most focus in previous research on the personalisation thesis has
been directed to the news media context. In these studies the empirical results
have been mixed which at least partly is a result of the lack of consensus regard-

12
ing the operationalisation of the concept. There is, however, empirical evidence
pointing towards social media driving personalisation and the hypothesis has
therefore been based on this evidence.
Based on previous research on personalised political content in social media, we
formulate the following hypothesis in order to address RQ1:
• H1: The proportion of personalised posts on Swedish politicians’ Instagram ac-
counts has increased during the current parliamentary term.
2.2 Personalisation and popularity – RQ2
The second research question concerns a possible relationship between personal-
ised content and a high degree of popularity (likes) and engagement (comments)
on Swedish politicians’ Instagram accounts. Three studies that have researched
this area are Larsson (2017b), Kruikemeier et al. (2013) and Ekman and Widholm
(2017).
Larsson (2017b) conducted a study in which he explored the most popular
posts on Norwegian politicians’ and parties’ Instagram accounts and analysed
them through different aspects of the personalisation thesis. He found that person-
alised content on individual politicians’ Instagram accounts was more popular in
terms of gaining popularity (defined as likes and comments) than other types of
content. However, when examining the political parties’ accounts he found that
content with a more formal character focusing on policies attracted more populari-
ty. Moreover, Larsson (2017b) states that the leaders of the parties have started to
outperform the parties’ accounts on Instagram since individual politicians’ Insta-
gram accounts manage to gain more traction than the parties’ accounts. He sug-
gests that the reason for this is the much more personalised content being posted
on the individual politicians’ accounts and that these results should be considered
when developing political communication strategies in the future. Furthermore,
Larsson (2017b) emphasises that more research should be done in this area and
suggests a study based on a quantitative content analysis with a larger sample.
Ekman and Widholm (2017) explore Swedish politicians’ Instagram use
through a quantitative content analysis (see section 2.1). They come to the conclu-
13
sion that politicians who to a large extent are providing content that is revolving
around their own private sphere attracts more popularity than the ones who adopt
a more conventional political approach in their Instagram use. Lastly, Kruikemei-
er et al. (2013) examined if personalised political communication triggers in-
volvement in politics and found that it did. Their results show that the public is
more prone to engage with political content that focuses on individuals rather than
on parties. Furthermore, they observed “interactive, personalised online commu-
nication has a positive effect on citizens’ feeling of having the opportunity to
come into contact with politics, and citizens’ feelings of closeness to politics” (p.
60). It should be noted that Kruikemeier et al. (2013) did not examine engagement
on personalised content on social media but instead as an experiment on fabricat-
ed political websites. However, this does not necessarily mean that their results
are not applicable in a social media context where engagement or involvement can
be seen as to the tendency of liking or commenting on a post.
To sum up, the empirical evidence seems to point to the direction that person-
alised content tends to gain more traction on social media platforms than other
types of content - which is why the hypothesis for research question 2 is going to
be based on these results.
Based on previous research on the relationship between personalised political con-
tent in social media and popularity, we formulate the following hypothesis in or-
der to address RQ2:
• H2: Personalised content of Swedish politicians’ Instagram accounts are asso-
ciated with higher levels of popularity and engagement indicators (likes and
comments) compared to other types of content.
2.3 Previous research related to RQ3
The third research question concerns if Swedish politicians are incorporating as-
pects from their private spheres when communicating political messages on Insta-
gram and if this behaviour has increased during the current parliamentary term.
Furthermore, it aims to reveal if this communication strategy is gaining more trac-
tion than strictly political messages. In our literature review, we found that only

14
few studies have touched upon this area before although without conceptualising
the phenomenon. These studies will be presented in the following section in order
to lay ground for the part of the study which aims to explore the strategy to incor-
porate private aspects when conveying political messages and we will, henceforth,
refer to this type of communication as hybrids.
Ekman and Widholm (2015) found in their content analysis of Swedish poli-
ticians’ Instagram use that “even when political issues are manifested, they come
to the fore with an emphasis on the persona or on the achievements of the particu-
lar individual” (p.29) which supports the idea that this type of communication is
being posted on Swedish politicians’ Instagram accounts but it is not being de-
scribed further and it is, thus, unclear to what extent or in what specific ways this
is being communicated. Another study that has examined this area is Šimunjak
(2012) who through a content analysis examined presidential candidates’ state-
ments in the daily newspapers during the 2009-2010 Croatian election. Šimunjak
(2012) aimed to uncover to what extent aspects from the candidates’ private
spheres were used to communicate about issues in the public discourse and found
that “a significant extent of the public discourse was indeed privatized” (p.50).
This research was not examining this tendency in an online environment but the
result is still relevant since it tells us something about political parties’ communi-
cation strategies.
With those two studies in mind as well as previous research on the personali-
sation thesis it seems reasonable to assume that politicians are using private as-
pects when conveying political messages. It also seems likely that this type of
communication has increased during the current parliamentary term because of
the same arguments as for hypothesis 1 which dealt with the personalisation the-
sis. Previous research also suggests that personalised content receives more popu-
larity than other content types and this can be considered applicable even though it
is political. This means that it is reasonable to assume that hybrids receive more
popularity than political messages that are strictly political. However, since there
is no previous research that has examined this specific area a hypothesis can not
be proposed. This part of the research will, hence, be devoted to explore the con-
cept of hybrids.

15
3. Theoretical framework
3.1 Personalisation
As mentioned in the introduction, personalisation is considered as a central devel-
opment in modern industrial democracies and the personalisation thesis is based
on the idea that focus is increasingly directed at the individual politician and its
personality traits. Even though there is a lack of consensus regarding the thesis it
appears that scholars can agree on three things. Firstly; personalisation concerns a
development over time which means that the thesis is based on the idea that per-
sonalisation is an upward trend; secondly; the politicians’ communication strate-
gies and the media logics are both reasons as to why there is an increased person-
alisation; lastly; personalisation has many dimensions but there is less consensus
on how to define the concept and separate dimensions within it (Van Aelst et al.
2011).
Empirical evidence on the personalisation thesis in the context of news cover-
age is, as pointed out in the literature overview, mixed which Van Aelst et al.
(2011) claim is due to a lack of a common conceptualisation and operationalisa-
tion. Consequently, Van Aelst et al. (2011) suggest a framework where personali-
sation is divided into two dimensions - individualisation and privatisation - in or-
der to unify the mixed perceptions of the concept. Individualisation refers to “a
focus on individual politicians as central actors in the political arena, including
their ideas, capacities and policies” (Van Aelst et al., 2011, p. 204). This is, how-
ever, not to say that the coverage on substantial issues necessarily is in decline but
rather an increased focus on the individual politicians at the expense of media
coverage on the parties. The second dimension, privatisation, concerns an in-
creased focus on the politicians as private persons rather than simply being por-
trayed as politicians in official roles. Van Aelst et al. (2011) state “the politician is
no longer presented solely as a policy maker or as a spokesperson but rather as a
dedicated parent or a passionate music lover” (p. 206). These two dimensions of
personalisation are also identified by Kriesi (2011) although referring to them as

16
“two phenomena” instead of naming them individualisation and privatisation. The
first phenomenon can be considered related to individualisation since it refers to
an increased emphasis on individual politicians; and the second phenomenon can
be considered related to privatisation seeing that it concerns a shift where atten-
tion is directed to politicians’ private spheres and favouring matters that are not of
a political nature rather than focusing on their professional and public roles. This
study will primarily focus on the second dimension or phenomena - privatisation -
since it is more relevant in a perspective of political actors’ communication on so-
cial media.
Even though social media is often blamed for being the reason why political
actors increasingly are communicating personalised with potential voters it is im-
portant to bear in mind that this type of communication strategy is not a new phe-
nomenon (Larsson, 2017b). The personalisation of politics can be traced back to
the what Blumler and Kavangah (1999) refer to as the second age of political
communication. This age, which started in the 1960’s, was characterised by the
television becoming the most important channel for political communication as
well as a decline in party loyalty (Blumler & Kavangah, 1999). The introduction
of televised programs was especially influential when it came to personalisation
since it contributed to a “sharper focus on top leaders” (p. 212).
Despite the fact that personalisation is a rather old phenomenon it is closely
connected with the rise of social media (Svensson, 2012). Enli and Skogerbø
(2013) point out that social media platforms like Instagram “fit into long-term on-
going processes where political communication has become increasingly focused
on personalities and personal traits of politicians” (p.758). Other scholars seem to
agree; Ekman and Widholm (2017) argues that social media steer the focus on to
political candidates’ personal characteristics which, in turn, increases personalisa-
tion in political communication strategies; Van Santen and Van Zoonen (2010)
states that social media platforms are constructed so that politicians can communi-
cate directly with the public which as a consequence puts the politician in the cen-
ter; Larsson (2017b) claim that social media has intensified the process of person-
alisation which other media types initiated. Larsson (2017b) further argues that
since visuals on the television played such a critical role in the process of person-
alisation it is likely that a platform like Instagram which focuses on images can be
of the similar importance.

17
Scholars have suggested that there are both positive as well as negative impli-
cations of the personalisation process (Larsson, 2017b). Considering positive ef-
fects, personalisation makes it easier for citizens to identify with politicians
(Kruikemeier et al., 2013) instead of being seen as “distant elite figures” (Maarek,
2014, p. 18). This is, according to Larsson (20017b), diminishing “the psycholog-
ical distance between the politician and the potential voter” (p.3). Maarek (2014)
further argues that for a public with less interest in politics, personalised content is
easier to understand than information on substantial issues. This can possibly be
beneficial for election turnout and the politicians’ that communicate personalised
might be able to get swing- and non-voters to cast their ballot in favour of them
(Larsson, 2017b; Maarek, 2014).
As for the negative implications of personalisation it has been argued that it
can be “detrimental for the quality of public debate” (Larsson, 2017b, p.4) since
many scholars believe that an increased focus on the person also means that there
will be a shift in focus from substantial political issues towards trivial information
(Larsson, 2017b). This kind of argument can be traced to Habermas and his work
on the concept the public sphere (Habermas, 1989). Habermas (2006) argues:
Issues of political discourse become assimilated into and absorbed by the modes and
contents of entertainment. Besides personalization, the dramatization of events, the sim-
plification of complex matters, and the vivid polarization of conflicts promote civic pri-
vatism and a mood of antipolitics (Habermas, 2006, p.422).
Habermas (2006) argues that the growing popularity of the image of candidates
can be explained by the increased use of communication efforts where a candi-
date’s personal characteristics are emphasised. These characteristics of the politics
are aimed to appeal to specific groups in order to sway voters. Furthermore, Ha-
bermas (2006) argues that the tendency to increasingly vote for issues goes paral-
lel with an increased tendency to vote for a candidate rather than a party. Howev-
er, the latter is not yet dominating.
In a party-centred political system like Sweden, the tendency for personalisa-
tion is less obvious compared to candidate-centred political systems such as the
United States. Policies and political messages are mainly constructed and com-
municated by parties which results in political actors not having to construct as

18
strong personal images as in candidate-centred systems (Enli & Skogerbø, 2013).
However, both Enli and Skogerbø (2013) and Larsson (2017b) argue that although
the above fact, party-centred systems seem to increasingly be focused on specific
candidates.
Enli and Skogerbø (2013) consider personalisation being “an aspect of the
mediatization of politics that characterize most Western societies, and which im-
plies, among other traits, that politicians have to meet demands not only to share
their public image but also their personal and private sides” (p.758). They further
argue that this process is closely connected to politics becoming popularised and
politicians becoming celebrities. This will be elaborated on further in the follow-
ing section.
3.2 Mass media logic and Social media logics
According to Ekman and Widholm (2015), the political actors and the journalists
are equally contributing towards an increased personalisation. Political actors
through emphasising their personal characteristics in their communication strategy
and journalists by focusing on personal aspects in their news reporting. The rea-
sons for this will be discussed in the following section.
The content in the media is dependent on what type of content that is consid-
ered to fit the media’s format, professional norms, organisation and need for atten-
tion and this is commonly known as the media logic (to differentiate this from the
social media logics which will be discussed later, we will henceforth refer to this
as the mass media logic). The mass media logic refers to the media’s tendency to
report on news that fits the format of the media and the production conditions ra-
ther than news that objectively would be considered as newsworthy and capture
the reality. News are reshaped in order to meet the media's need to reduce infor-
mation, catch the public's attention and making the content easy to grasp. One of
the concrete expressions for the mass media logic is, thus, to create narrative tech-
niques which make the content easier to understand and personalisation is one ex-
ample of this (Strömbäck, 2014).
Another part of the concept of the mass media logic has to do with how other
actors in society are affected by this. Since media have become such a central
component in modern societies actors who want to reach and communicate with

19
the public need to adjust to fit the media logic (Strömbäck, 2014). In a political
context this means “political actors need to adapt their strategies so that they fit
the modus operandi of the mass media, notably the narrative conventions, profes-
sional expectations and technological and distributional features” (Ekman &
Widholm, 2017, p. 17).
During the last few years, the mass media logic has slowly been infiltrated by
logics created by social media platforms (Van Dijck & Poell, 2013). These new
logics is influencing the ways in which one selects, consumes, distributes and
produces information (Kalsnes, 2016) and is referred to as social media logic by
Van Djick and Poell (2013), platform logic by Bucher (2012), and network media
logic by Klinger and Svensson (2014). Van Djick and Poell (2013) describes so-
cial media logic as “the processes, principles, and practices through which these
platforms process information, news, and communication, and more generally,
how they channel social traffics” (Van Dijck & Poell, 2013, p.5) and it is their
definition and framework the following part of this section will be based on. Van
Dijck and Poell (2013) have developed a framework in which they suggest that
social media logic is centred on four characteristics: datafication, connectivity,
popularity and programmability. However, only two of these are relevant when
discussing this in relation to the research questions - popularity and programma-
bility.
Programmability refers to the ways the platforms’ infrastructure is construct-
ed to influence how the users interact on, and use, the platforms. This is done
through algorithms that for example decide what type of content that is favoured
in the feed or in the “explore” function on Instagram. In the old mass media logic,
this is referred to as the editorial selection of certain content which is visible for
anyone by looking at for example a TV schedule but in the case of social media
this is not possible. The codes behind the algorithms on social media platforms
such as Instagram are kept a secret and are constantly being altered in order to
“enhance” the user experience as well as to improve the business of selling adver-
tisements (Van Dijck & Poell, 2013). In other words, with mass media it is easy to
analyse what type of content that is being favoured but with social media it is, at
the time being, impossible to analyse this since the codes behind the algorithms
are not up for display to the public.
20
The other characteristic of social media logic in Van Djick and Poell’s (2013)
framework - popularity - refers to the need to be popular in order to ensure visibil-
ity on the platform. Popularity, on Instagram being defined as likes and com-
ments, is, in other words, necessary in order to be favoured in the feed (Van Dijck
& Poell, 2013). Van Dijck and Poell (2013) state “each platform has its distinct
mechanisms for boosting popularity of people, things, or ideas, which is measured
mostly in quantified terms” (p.7) and “each corporation actively seeks to promote
their popularity and ranking mechanisms in order to enhance the value of its plat-
forms and its users” (p.7).
The implication of these characteristics is that algorithms not only decide
what content that is being favoured but the visibility is also influenced by the us-
ers’ interaction, i.e. to what extent a post is liked or commented on (Kalsnes,
2016). This gives, according to Klinger and Svensson (2015), incentives for post-
ing content that is more personalised and maximises the attention instead of con-
tent that without the logics of programmability and popularity would be consid-
ered more worthy to post. Furthermore, Ekman and Widholm (2017) argue that
since Instagram “exhorts a strong form of individualism, Instagram users have al-
so proved to be highly performative in their self-display, staging their personali-
ties for immediate public consumption in the continuous race for likes and com-
ment” (p.18).
To sum up, the mass media logic has during most of the 20th century been
dominating the ways in which actors in society have to act and communicate in
order to reach the public. In the digital era, the mass media logic is not the only
logic that reigns but rather works side by side with social media logics which
means that there are several logics and that the media system is interconnected in
many ways. This reasoning of a media system that is intertwined in so many dif-
ferent ways was brought to light foremost trough Chadwick’s (2013) work on the
hybrid media system which he describes as the following:
The hybrid media system is built upon interactions among older and newer media logics
… in the reflexively connected fields of media and politics. Actors in this system are ar-
ticulated by complex and ever-evolving relationships based upon adaptation and inter-
dependence and simultaneous concentrations and diffusions of power. Actors create,
tap, or steer information flows in ways that suit their goals and in ways that modify, en-

21
able, or disable the agency of others, across and between a range of older and newer
media settings (Chadwick, 2013, p.4).
The hybrid media system is, thus, creating new communicative possibilities
for all actors in society and the mass media logic is no longer the only logic actors
need to adapt to in order to reach the public. Today, actors also have to consider
factors such as if the algorithm will favour the content and if the content will en-
gage (Ekblom & Widholm, 2017; Van Dijck & Poell, 2013). It is possible that the
implication of this is a communication increasingly focusing on personal aspects
since this tends to be favoured both by the older mass media logic and newer so-
cial media logics.
22
4. Method
4.1 Choice of method
The aim of this study is to examine if personalised content is increasing on promi-
nent Swedish politicians’ Instagram accounts and whether personalised posts at-
tract more popularity (likes) and engagement (comments) than other types of con-
tent. Furthermore, it aims to reveal to what extent prominent Swedish politicians
incorporate aspects of their private sphere in order to convey political messages
and whether or not this behaviour has increased during the current parliamentary
term.
To be able to answer these questions, we chose to conduct a quantitative con-
tent analysis on Instagram. This type of method could help us measure key cate-
gories within the politicians’ Instagram content as well as, because of the longitu-
dinal nature of this study, help us measure development over time. According to
Neuendorf (2017), the aim of any quantitative content analysis should be to “pro-
duce counts of key categories, and measurements of the amounts of other varia-
bles” (p.21) which is what we are trying to achieve.
When talking about the unit of analysis, we refer to an Instagram post includ-
ing both the visual and textual material, and also counting comments and likes. If
a unit contained a video it has been watched and analysed, yet, we have not ac-
counted for the slides (i.e. when an Instagram post contains several photos in a
slideshow) and instead only analysed the first picture in the slide.
Since Instagram is a platform that makes the collection of metadata problem-
atic, software that is designed specifically for this purpose often stops working
because of frequent patch changes in Instagram’s application program interface
(API). However, we managed to download and handle the data in a program
called Instabro (Instabro, n.d.). This program helped us to collect and manage the
large quantities of data and was at the time, at least to our knowledge, the most
appropriate mode of administration. The choice of using a software to manage the
data was made mainly based on the fact that we aimed to get a systematic random-

23
ised sample which this software made possible. The software also made it easier
to gather the large amounts of data needed in order to make the sample representa-
tive.
4.2 Sample
4.2.1 Sampling of politicians
The content analysis was based on the content of 16 active Swedish politician’s
Instagram accounts and these were chosen with a purposive sampling method.
Two politicians from each party were selected in order to be able to present a re-
sult where all parties in the parliament were represented. The sampling of politi-
cians in the content analysis was based on the following criteria: first, the Insta-
gram account had to be public (i.e. accessible to anyone without having to get ac-
cepted); second, the account had to be started before the last quarter in 2015 (so
that it would not be missing too much data for the longitudinal analysis); third, the
politicians had to be active on a national or international level; fourth, the politi-
cians selected were the ones with the highest number of followers in their respec-
tive party. The choice of the last criterion was made since these accounts most
likely have a larger impact and are more central in the network. This type of sam-
pling process goes in line with other studies which have examined political com-
munication on Instagram, see for example Ekman and Widholm (2017) and Fili-
monov et al. (2016).
This sampling process resulted in a sample of four ministers in the current
government, one member of the European Parliament (MEP), one member of a
national board of a party, three party leaders (one of which is a minister), and
eight members of parliament. Sweden’s Prime Minister Stefan Löfven (20k fol-
lowers) was one of the politicians that did not fit the criteria, despite his relatively
high number of followers, since he lacked too many quarters in order for his ac-
count to sufficiently contribute with information to the longitudinal analysis.

24
4.2.2 Sampling of posts
We were interested in seeing a development over time but because of the
timeframe we were unable to analyse the full population of posts (N=17 734).
Thus, we chose to sample eight posts from each quarter starting in the last quarter
of 2014. The choice of sampling eight posts was made since we wanted our sam-
ple to represent 9 % of the total population of posts, and, the reason for starting at
the end of 2014 was because we wanted to capture the development during one
parliamentary term where social media use among politicians have grown im-
mensely (especially on Instagram).
In order to receive equal amounts of posts from each quarter, a stratified
sampling method was applied (Neuendorf, 2017). In other words, the full sample
was segmented into quarters to ensure that the sample distribution was not dispro-
portional over the period of time. Seeing that the sample consists of 112 posts per
politician, the stratified sampling made it possible to distribute these 112 posts
proportionally over the years using quarters as stratas. The sampling frame was
divided into 14 stratas for each politician which was defined by which quarter the
post was uploaded in and then eight posts were sampled according to the princi-
ples below.
In order to achieve a random sample within each quarter, we chose to use
what Neuendorf (2017) calls systematic random sampling, which basically gener-
ates a random sample, only with systematisation of the sampling. When applying
this type of sampling a skip interval has to be calculated which means that every
Xth unit is chosen. In order to calculate the skip interval a desired sample must be
determined which, for this study, was set to be 8 posts per quarter and politician
(to achieve a sample that represents 9% of the total population of posts). Neuen-
dorf’s (2017) suggested calculation on the skip interval was applied on all 16 poli-
ticians and the quarters connected to them:
To exemplify, if the number of posts in one quarter on one politician’s Insta-
gram account is 80, then 80(N)/ 8(n) = 10, i.e. every 10th post was chosen. This

25
has been done for each quarter and for every politician which means that the skip
interval has varied throughout the data collection.
Another consideration when conducting a systematic random sample con-
cerns the sampling frame. Neuendorf (2017) states that “If there is periodicity in
the frame or in the flow of occurrence of units that matches up with the skip inter-
val, then the representativeness of the sample is threatened” (p. 86) and the sam-
pling, hence, need to start on random number every time. However, we came to
the conclusion that there is no periodicity in our sample frame which allowed us
to start at post 1 in every quarter.
Some of the politicians have not been active on Instagram since the starting
point of the data collection and some have not uploaded enough posts every quar-
ter which means that there is some data missing. 46 posts within quarters and 13
quarters (13x8=104) are missing which makes the total amount of missing data
(md) 150 posts. The final sample (n), thereby, consists of 1641 posts (1791-150=
1641) which represent 9,3 per cent of the total population of posts on the chosen
politicians’ accounts (N=17734).
Politicians Party Followers
Posts b/w Q4'14-Q1'18
Missing posts
Missing quarters
Sample Size
Percental Sample Size
Alice Bah Kuhnke Green Party 44 000 989 0 2x8=16
112-16 (md)=96 9,7%
Gustav Fridolin Green Party 10 800 463 0 0 112 24,2%
Margot Wallström
Social Demo-cratic Party 10 300 252 0 4x8= 32
112-32 (md)=80 31,7%
Anders Ygeman
Social Demo-cratic Party 5760 592 0 0 112 18,9%
Rossana Dinamarca Left Party 10 400 755 0 0 112 14,8%
Daniel Riazat Left Party 1622 146 7 0 112-7 (md)=105 71,9%
Anna Kin-berg Batra
Moderate Party 23 800 1662 0 3x8=24
112-24 (md)=88 5,3%
Hanif Bali Moderate Party 8755 185 34 0
112-34 (md)=78 42,2%
Birgitta Ohlsson Liberals 9781 4487 0 0 112 2,5%
Fredrik Malm Liberals 1713 455 0 0 112 24,6%

26
Ebba Busch Thor
Christian Democrats 22 800 509 0 0 112 22%
Sara Skytte-dal
Christian Democrats 4556 1339 0 0 112 8,4%
Annie Lööf Center Party 35 100 1344 0 4x8= 32 112-32 (md)=80 6%
Fredrik Federley Center Party 5774 3657 0 0 112 3,1%
Paula Bieler Sweden Democrats 1513 686 0 0 112 16,3%
Hanna Wigh Sweden Democrats 1453 213 5 0
112-5 (md)=107 50,2%
Total
17734 46 104 1641 9,26% Table 1 illustrates the politicians studied, their total amount of posts during the period of study, the number of followers, how many posts missing from quarters and how many quarters that were miss-ing, the sample size in the final sample when missing data is excluded and finally a percental sample size per politician.
4.3 Coding scheme and procedure
4.3.1 Coding scheme and variables
In this section we will present our coding scheme and explain how the variables
were measured and used in order to answer the research questions. This will partly
be explained in text but an explanation of how each research question was defined
in terms of measurement is illustrated in table 2.
Each unit of analysis (i.e. post) was labelled with formal criteria which con-
sisted of a post identification number and the publishing date. In addition to the
formal criteria, the first section of the coding scheme consisted of: the amount of
likes and comments, what type of content it is (distinguishing between everyday
life private - i.e. post not containing anything of political or professional nature,
everyday life professional - i.e. post relating to the professional realm of the poli-
tician without containing a political message, and political message - i.e. every
post that includes a political message in some way or demonstrating the politi-
cian’s standpoint in a matter). When having identified the type of content, the
coder got transferred to a coding scheme with sections uniquely connected to the
type of content chosen in order to determine subcategories.
In the everyday life professional category, we coded for presence or absence
of a connection the politician’s private sphere. In the content type political mes-

27
sage, the coder had to code for a presence or absence of a connection to the politi-
cian’s private sphere. This has been done in order to answer the third research
question in which we seek evidence for politicians communicating political mes-
sages incorporating private aspects. Drawing upon on Larsson’s (2017b) claim
that “not only should we understand personalisation along the lines of personal
matter being offered up for public display - topics, matters and themes that were
previously construed as of a public nature will now be presented as inspired by
and fashioned according to the characteristics of politicians” (p. 4) we argue that
this is a reasonable way of operationalising the third research question. See Ap-
pendix 1 and 2 for more details.
Table 2. Operationalisation of the concept personalisation, see description below.
28
To answer the first research question, three variables that in different ways
consider a post being personal was created. First, everyday life private in the type
of content part; second, connection to private sphere in the professional everyday
life section; and third, connection to private sphere in the political message sec-
tion. In order to answer the second research question, we created one variable that
measured popularity defined by likes and one variable that measured engagement
defined by comments. To see if there was a relationship between personalised
content and popularity/engagement we used the same variables as in the first re-
search question. Our third research question was operationalised through the vari-
able connection to private sphere within the political message section. Moreover,
we created a temporal variable which was relevant for the longitudinal aspect of
both research question one and three.
4.3.2 Coding procedure: training, coding manual and implementation
We have followed Neuendorf’s (2017) suggestions when code training as well as
when drafting and revising the coding manual. The coding manual describes the
variables and the coding instructions in the smallest detail; and during the training
period, the coding manual was revised regularly. Both these actions were taken in
order to make the variables as unambiguous as possible. Thereafter, a pilot coding
was conducted in which we both coded the same units to eliminate discrepancies
and, thus, ensured a reliable and viable coding scheme.
The final coding was done individually through Google Forms since it was the
most convenient way to manage, arrange and export the coded units. Google Forms
is normally a tool for collecting survey data but it works just as well for coding
purposes as it allows the coder to click on the different coding options instead of
manually remembering and writing down numbers. We made sure that the coding
process did not involve discussion or consensus building by coding separately. This
was, however, not an issue since we through the coding training had calibrated how
to categorise the content which resulted in a standardised procedure. For more de-
tails regarding the coding manual see Appendix 2.

29
4.4 Quality criteria: intercoder reliability and validity
The quality criteria reliability and validity need to be considered when conducting
a quantitative content analysis. Reliability concerns the repeatability of the results
which in a quantitative content analysis carried out by humans means intercoder
reliability, or “level of agreement among two or more coders” (Neuendorf, 2017,
p. 19). In order to ensure that our coding results had a high intercoder reliability,
meaning coding consistency independently of the human coder, we employed a
third external individual in order to test the intercoder reliability. Percent agree-
ment (or “crude agreement”) was employed when testing the intercoder reliability
which was calculated in the following way:
This resulted in a rather high level of correspondence percentage (93,5%).
Our key variables had a high level of reliability (type of content= 96,25%), but
some variables did not reach the same proportion of agreement, although these
were still relatively high. The variable that measured if there was a connection to
the politician’s private sphere within the political messages category (hybrids) re-
ceived the lowest correspondence percentage (80%) and the variable that meas-
ured if there was a connection to the politician’s private sphere within the profes-
sional everyday life category achieved 90 in percent agreement. For more details
regarding the intercoder reliability testing see appendix 3.
Reliability also concerns the objectivity of the measures of the variables. The
study’s variables include both latent and manifest content. Manifest content is
self-evident and indisputable whereas latent content is more subtle which “cannot
be measured directly but can be represented or measured by one or more … indi-
cators” (Hair, Black, Babin & Andersson, 2010, p.614). Latent content can be a
problem for the reliability of the study and especially if the variables are “highly
latent” meaning that they can not easily be identified by certain indicators. Neu-
endorf (2017) argues that if the content is latent the need for coding training is
higher. We do not consider the latent content being a problem for the reliability of

30
the study because, first; the content is not “highly latent”, and second; the exten-
sive code training and revising of the coding manual, and third; the rather high
level of interrater reliability.
External validity is to what extent the study can be generalised beyond the re-
search context and because of our sampling process of the politicians, we are not
arguing for this study to be generalisable. We do, however, claim that the sam-
pling process and sample size (9,3 %) of units have made it possible to generalise
the sample to the total population of units (N= 17734) and the result is, thus, valid
for making claims of generalisability for these sixteen politicians but not beyond.
Ekman and Widholm (2017) who employed a similar method on Instagram pre-
sented a sample size of 6.6 per cent of the total population of units which has been
used to legitimise our sample size and its possibilities for generalisability.
The internal validity refers to what extent the method is measuring the in-
tended which in a content analysis to a large degree is determined by how well the
operationalisation (creating variables and a coding scheme) fits the conceptual
definition (Neuendorf, 2017). Since this study is examining personalisation in an
online context from a political actor perspective we decided to base our operation-
alisation on previous content analyses that have examined a similar area namely:
Ekman and Widholm (2017), Filimonov et al. (2016), Larsson (2017). These stud-
ies have also defined the concept personalisation similar to us which makes the
operationalisation of the variables valid in relation to the concept.
4.5 Data analysis
The statistical analysis of the data was performed with Statistical Package of So-
cial Science (SPSS) version 24.0 (IBM Software Statistics® 2009, US) and the
following section will describe our data analysis for the respective hypothesis and
research question.
4.5.1 Data analysis for H1
For hypothesis 1 the total amount of personalised posts (everyday life private,
everyday life professional with a connection to the private sphere, hybrids) per
quarter was calculated. In order to deal with the missing data in some quarters, the

31
proportion of personalised posts was calculated so that it would be representative
for a quarter with a full sample. This was calculated as follows:
Sum of personalised posts in quarter/ total posts in quarter (128 - MD) = X
X x 100 = proportion of personalised posts in per cent (%)
These percentages were thereafter inserted in a multiple line diagram in order
to illustrate the development over time.
In order to be able to analyse the development for hypothesis 1 statistically,
we conducted a mixed effect logistic regression analysis. A mixed effect logistic
regression is used to analyse longitudinal binary data which has differences with-
in, and between, the subjects (Speelman, Heylen, & Geeraerts, 2018; Ten Have,
Kunselman, Pulkstenis, Landis, 1998). It does so by taking both fixed and random
effects into account (Van Dongen, Olofsen, Dinges, Maislin, 2004). Fixed effects
are “model components used to define systematic relationships such as overall
changes over time” (Van Dongen et al., 2004, p. 11) and random effects “account
for variability among subjects around the systematic relationships captured by the
fixed effects” (Van Dongen et al., 2004, p. 11). This is suitable for our data since
the random effects can account for the missing data some politicians have in some
quarters. The mixed effect logistic regression analysis calculates a coefficient that
tells us the possible increase or decrease of personalised content over the period of
study. It also reveals whether or not the development is significant.
4.5.1 Data analysis for H2
Hypothesis 2 was analysed in four different ways. The first way hypothesis 2
was measured was by sorting the units in accordance with the highest number of
likes and comments. The 50 most popular and engaging units were then analysed
through a frequency table and illustrated in a simple pie chart in order to see
which content type the most popular and engaging posts were. No statistical test
was employed for the first analysis of research question 2. This way of measuring
was based on the way in which Larsson (2017b) examined the relationship be-
tween popularity and personalised content in the Norwegian context (see section
2.2).

32
The second way hypothesis 2 was analysed was by comparing the means and
standard deviation between personalised and non-personalised content. Since the
data is not normally distributed a non-parametric equivalent to the t-test, namely
Mann Whitney U, was employed in order to see if there was a significant differ-
ence (p = <.05) between types of content and popularity (likes) and engagement
(comments). Moreover, the differences in means were illustrated in a simple bar
chart with confidence intervals of 95%.
The third way of testing hypothesis 2 was similar to the second way, the only
difference was that three categories of content (personalised content, everyday life
professional content, political messages) was compared instead of two. Since likes
and comments were not, as mentioned above, normally distributed a non-
parametric test needed to be employed (Lantz, 2011). We used the Kruskal-Wallis
test which is a non-parametric alternative for one-way analysis of variance
(ANOVA) (Wahlgren, 2008) in order to see if there was a significant difference
between types of content and popularity or engagement. If Kruskal-Wallis showed
significance (p = <.05) a multiple comparisons correction named Bonferroni cor-
rection needed to be employed in order to distinguish if there was significance al-
so between the groups within the variable (i.e. if personalised content is signifi-
cantly more popular than both everyday life professional content and political
message content separately or if it is only one content type that shows a differ-
ence). The Bonferroni correction is a post hoc test which can be applied on data
that is not normally distributed and it, therefore, fits well after a Kruskal-Wallis
test (Armstrong, 2014). The Bonferroni correction gives adjusted significance lev-
els and the groups which get an adjusted p value of under .05 is considered as sig-
nificantly higher than the other groups in the variable.
In the fourth way of measuring hypothesis 2, we looked at each politician in-
dividually in order to see if personalised posts received significantly higher levels
of popularity (likes) and engagement (comments) compared to other types of con-
tent. The dataset was, thus, divided into 16 different parts (one per politician) and
the mean of likes and comments for the different content types were calculated.
Just as for the other way of measuring hypothesis 2 the distribution curves of the
likes and comments needed to be analysed in order to decide what type of tests to
employ. This showed that none of the data was normally distributed which meant
that the significance had to be tested through non-parametric tests (Lantz, 2011).

33
Kruskal-Wallis test was once again employed and if it showed significance (p =
<.05) we conducted a multiple comparisons correction (Bonferroni correction) in
order to distinguish if there was significance also between the groups within the
variable.
4.5.1 Data analysis for RQ3
Since research question 3 contains three sub-questions different data analysis
methods were employed for each of them. For research question 3a we simply
compared the per cent of political messages and the per cent of hybrids and illus-
trated this in a simple bar chart. For research question 3b, a similar method as for
hypothesis 1 was employed: the percentages of hybrids for each quarter was cal-
culated and in order to deal with the missing data. These percentages were there-
after inserted in a simple line diagram in order to illustrate the development over
time. Research question 3c was analysed by comparing the mean of likes for hy-
brids as well as political messages. In order to see if hybrids received a signifi-
cantly higher amount of likes a Mann-Whitney U test was employed since the data
was not normally distributed.
4.6 Method reflection
The following section will be devoted to a reflection of the weaknesses we have
identified in the choice of method. Firstly, the percental sample size of politicians
with a large number of posts is low (Ohlsson = 2,5%; Federley = 3,1%) and dif-
fers a lot from politicians with a low posting frequency (Riazat = 71,9%; Wigh =
50,2%). This suggests that it possibly would have been more reasonable to decide
on a percental sample size of each politician’s full sample of units in order to re-
ceive a higher level of generalisability. However, due to the scarcity of time and
resources this was seen as impossible knowing that some of the populations con-
tained a very high number of posts. Secondly, some of the accounts that were ana-
lysed were not professionalised and used more as strictly private accounts. This
was especially evident when looking at Sweden Democrats’ representatives’ ac-
counts. It can, therefore, be argued that these accounts did not contribute with any
relevant information when examining the politicians’ communication strategies
and, thus, should have been removed from the results. However, since the aim was
34
to examine the Instagram accounts of representatives from all parties we chose to
not exclude these accounts.
A third reflection on a weakness in the choice of method concerns the missing
data. It could be argued that it would have been more beneficial to choose politi-
cians who had a full sample size during the whole period of study since this would
have erased the missing data problems. However, some of the politicians that
were missing the initial quarters (for example Lööf, Bah Kuhnke, Kinberg Batra)
were considered important to include anyway since they had many followers and,
hence, a central position in the network.

35
5. Results and Analyses
5.1 Introduction to results and analyses
This section will be devoted to the study’s results and the analyses of these. First,
we will give a brief descriptive overview of the data and the distribution of it.
Subsequently, the results will be presented both graphically and in text in accord-
ance with the research questions’ chronological order. Each section will also pre-
sent if the hypotheses can be supported by the data or not. The analyses will be
connected to the study’s theoretical framework in order to provide a depth and not
only present the results descriptively and statistically.
5.2 Descriptive overview of the data
The total sample size is n=1641 and about one fifth, 20,2%, of all units included a
political message which means that nearly 80% of the content does not relate di-
rectly to the ideological aspect of politics. These 80 % is almost equally divided
between the categories life professional (40,4%) and everyday life private
(39,5%). Furthermore, in the everyday life professional, 6 % of the posts have a
connection to the politician’s private sphere and political messages included
43,4% hybrids. This means that when the variables were merged in order to create
the personalised content category (see section 4.3.1) the distribution appears as
follows: personalised content (50,3%), everyday life professional (38,2%), politi-
cal messages (11,5%).
Table 3. Distribution of posts between content types

36
5.3 Results and Analysis related to H1 and RQ1
5.3.1 Results related to H1
H1: The proportion of personalised posts on Swedish politicians’ Instagram ac-
counts has increased during the current parliamentary term.
Figure 1. Development of content types in percentage over time.
Even though the data clearly show that personalised posts are the most fre-
quent type of content (50, 3%) it does not seem to have increased since the start-
ing point of our longitudinal study. In fact, the per cent of personalised content is
lower in 2018 than in 2014 although the difference is rather small. At the starting
point of the study (Q4’14), 55 per cent of the content was personalised. The low-
est per cent of personalised content (40%) was observed in the fourth quarter of
2015 and the highest per cent of personalised content (62,5%) was observed in the
third quarter of 2017. At the study’s longitudinal ending point (Q1’18) the per
cent of personalised content was 50.
An interesting observation of the data which the graph illustrates is that an in-
creased amount of personalised content does not seem to affect the number of po-
litical messages posted. The per cent of political messages has instead had a small
increase during the period of study. However, it seems like personalised content

37
and professional everyday life develops mutually - when there is an increase in
personalised content the everyday life professional content decreases and vice
versa.
Model Term Coefficient Std. Error t Sig. 95% Confidence Interval
Lower Upper
Intercept 0.028 0.129 0.220 0.829 -0.252 0.309
Quarter -0.006 0.016 -0.373 0.715 -0.042 0.029
Probability distribution: Binomial Link function: Logit Table 4. Fixed Coefficients in mixed effect logistic regression analysis. Target: Personalised vs Non-personalised content, Reference category: Personalised content
The result of the mixed effect logistic regression analysis was, unsurprisingly,
that personalised content had not increased significantly (p=.715) during the
study’s observed time frame. Personalised content had instead, according to the
regression coefficient (-0.006), decreased although slightly. It can, therefore, be
stated that our data do not support Hypothesis 1 statistically since personalised
content has not increased.
5.3.2 Analysis related to the Personalisation Thesis - RQ1
Even though the first hypothesis was not supported by the data, the results can
still be analysed using the theoretical framework. The personalisation thesis is, as
mentioned previously, based on the idea that focus increasingly is directed to-
wards the individual politicians and their personal characteristics. However, what
the results imply is that personalised content represents a majority of the content
but this upward trend does not exist and it, thus, seems like the proportion of per-
sonalised post has, among prominent Swedish politicians, already reached its
culmination on the platform. Previous studies have, as elaborated on in section
2.1, had mixed results due to a lack of consensus regarding conceptualisation and
operationalisation. Hypothesis 1 was formulated based on previous research that

38
examined the personalisation thesis from a media perspective as well studies that
looked at the degree of personalisation on social media. No previous studies have
examined a possible increase of personalisation in a social media context from a
political actors perspective which makes the results not entirely surprising. The
results suggest that the personalisation thesis, in this context, might not be an up-
ward trend but rather a constant. Van Aelst et al. (2011) implies that there is a
consensus among scholars regarding personalisation referring to a positive devel-
opment over time but with this study’s results in mind, the concept seems to be in
need for a re-conceptualisation. Knowing that most previous studies have focused
on the media perspective it seems fair to assume that the conceptualisation is
mainly based on findings from this perspective. It is possible that the personalisa-
tion thesis needs different conceptualisations depending on which context it is
studied within.
Blumler and Kavangah (1999) point towards the emergence of televised de-
bates as one of the main reasons behind the start of the personalisation trend. They
argue that this contributed to a “sharper focus on top leaders” (Blumler & Kavan-
gah, 1999, p.212) and one can observe similar tendencies with the emergence of
social media. Larsson (2017b) claims that social media has intensified the process
of personalisation which other media types initiated and argues that especially In-
stagram, with its focus on visuals, can be of similar importance as the TV. There
is, when looking at the data, no doubt that the content on Instagram has a large fo-
cus on the personal aspects of the politicians but since the study’s result demon-
strates that there has not been an increase it seems like the process has come to a
standstill, at least on the platform. The study’s result can, however, not show
whether or not the high degree of personalised content on Instagram influences
the degree of personalisation in other political contexts.
The other interesting observation with regards to research question 1 was the
fact that the proportion of political messages were not affected by an increase or a
decrease in the proportion of personalised content. If personalised content in-
creased it only affected the proportion of life professional content which goes in
line with what Van Aelst et al. (2011) point out regarding personalisation not nec-
essarily having any effect on to what extent substantial issues and policies are be-
ing communicated. Habermas (2006) is of another opinion and argues that per-
sonalisation leads to depoliticisation by shifting focus from substantial political is-

39
sues towards non-political trivial information. There is both in media in general
but also in this particular study a large focus on the candidates’ personas which
might make the public debate more trivial and it is, therefore, hard to reject Ha-
bermas ideas completely but with these results it can still be argued that it might
not be that detrimental as Habermas suggests.
5.4 Results and Analysis related to H2 and RQ2
5.4.1 Results related to H2
H2: Personalised content on Swedish politicians’ Instagram accounts are associ-
ated with higher levels of popularity and engagement indicators (likes and com-
ments) compared to other types of content.
The first way we measured the relationship between personalised content and
popularity/ engagement was, as mentioned more extensively in the data analysis
section, by examining the 50 most popular and engaging posts. The results show
that personalised posts represent a clear majority of both the 50 most popular
posts and the 50 most engaging posts.
Figure 2. Top 50 most popular posts

40
Figure 3. Top 50 most engaging posts
Of the 50 most popular posts (1365-4322 likes) 76% is represented by person-
alised posts (see fig. 2). Looking at engagement (41-329 comments), the percent-
age of the top 50 posts (see fig. 3) is 62%.
The second way hypothesis 2 was measured was by comparing the mean of
likes/ comments between personalised content and non-personalised content.
Figure 4. Mean of likes for personalised vs non-personalised content

41
Figure 5. Mean of comments for personalised vs non-personalised content
The findings suggest that personalised content receives (M: 300.91, SD:
494.61) a significantly higher number of likes (p=.000) compared with non-
personalised content (M: 270.31, SD: 322.82). Personalised content (M: 9.08, SD:
19.73) do not, however, receive a significantly higher number of comments
(p=.288) compared to non-personalised content (M: 7.66, SD: 18.12).
The third way hypothesis 2 was measured was similar to the second way, on-
ly with the comparison of three content categories instead of two.
Figure 6. Mean of likes between different content types
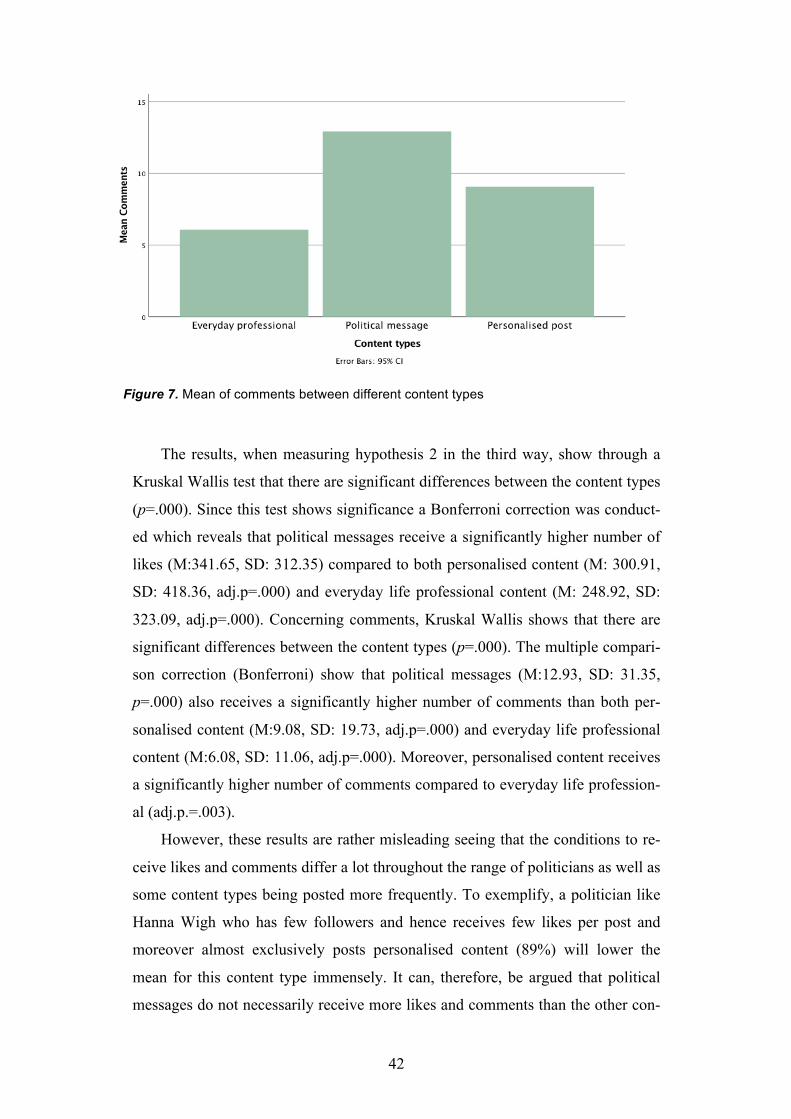
42
Figure 7. Mean of comments between different content types
The results, when measuring hypothesis 2 in the third way, show through a
Kruskal Wallis test that there are significant differences between the content types
(p=.000). Since this test shows significance a Bonferroni correction was conduct-
ed which reveals that political messages receive a significantly higher number of
likes (M:341.65, SD: 312.35) compared to both personalised content (M: 300.91,
SD: 418.36, adj.p=.000) and everyday life professional content (M: 248.92, SD:
323.09, adj.p=.000). Concerning comments, Kruskal Wallis shows that there are
significant differences between the content types (p=.000). The multiple compari-
son correction (Bonferroni) show that political messages (M:12.93, SD: 31.35,
p=.000) also receives a significantly higher number of comments than both per-
sonalised content (M:9.08, SD: 19.73, adj.p=.000) and everyday life professional
content (M:6.08, SD: 11.06, adj.p=.000). Moreover, personalised content receives
a significantly higher number of comments compared to everyday life profession-
al (adj.p.=.003).
However, these results are rather misleading seeing that the conditions to re-
ceive likes and comments differ a lot throughout the range of politicians as well as
some content types being posted more frequently. To exemplify, a politician like
Hanna Wigh who has few followers and hence receives few likes per post and
moreover almost exclusively posts personalised content (89%) will lower the
mean for this content type immensely. It can, therefore, be argued that political
messages do not necessarily receive more likes and comments than the other con-
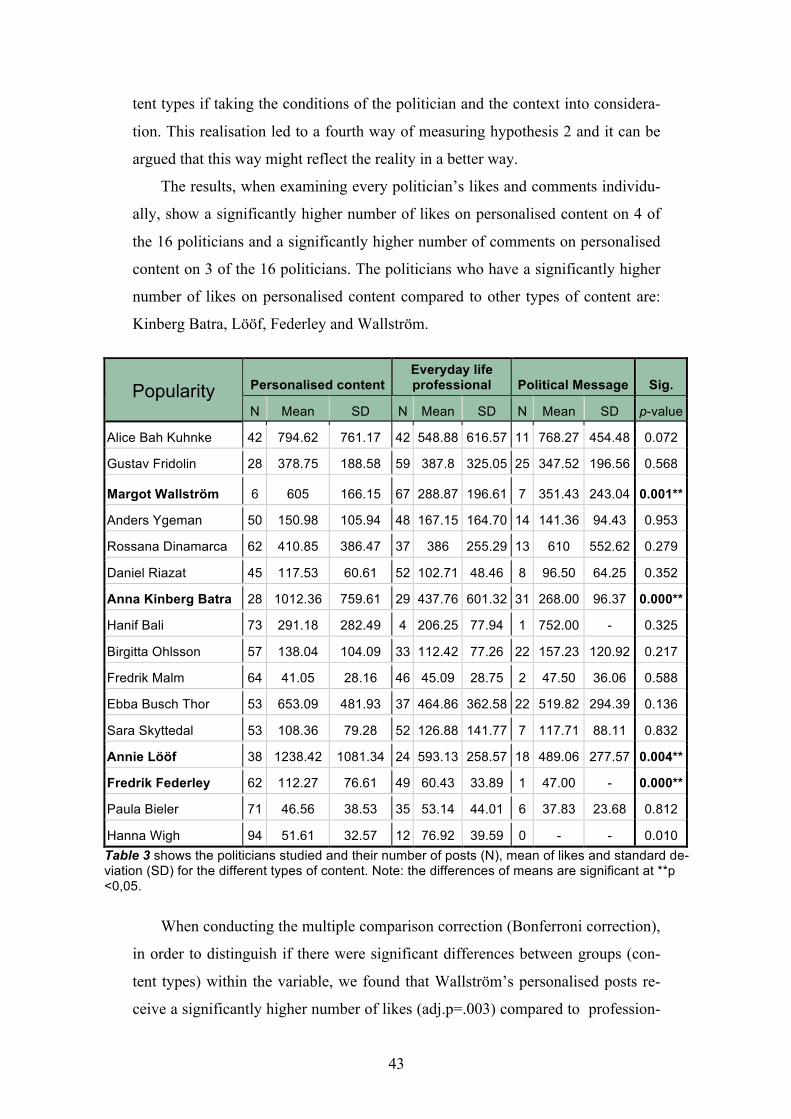
43
tent types if taking the conditions of the politician and the context into considera-
tion. This realisation led to a fourth way of measuring hypothesis 2 and it can be
argued that this way might reflect the reality in a better way.
The results, when examining every politician’s likes and comments individu-
ally, show a significantly higher number of likes on personalised content on 4 of
the 16 politicians and a significantly higher number of comments on personalised
content on 3 of the 16 politicians. The politicians who have a significantly higher
number of likes on personalised content compared to other types of content are:
Kinberg Batra, Lööf, Federley and Wallström.
Popularity Personalised content Everyday life professional Political Message Sig.
N Mean SD N Mean SD N Mean SD p-value
Alice Bah Kuhnke 42 794.62 761.17 42 548.88 616.57 11 768.27 454.48 0.072
Gustav Fridolin 28 378.75 188.58 59 387.8 325.05 25 347.52 196.56 0.568
Margot Wallström 6 605 166.15 67 288.87 196.61 7 351.43 243.04 0.001**
Anders Ygeman 50 150.98 105.94 48 167.15 164.70 14 141.36 94.43 0.953
Rossana Dinamarca 62 410.85 386.47 37 386 255.29 13 610 552.62 0.279
Daniel Riazat 45 117.53 60.61 52 102.71 48.46 8 96.50 64.25 0.352
Anna Kinberg Batra 28 1012.36 759.61 29 437.76 601.32 31 268.00 96.37 0.000**
Hanif Bali 73 291.18 282.49 4 206.25 77.94 1 752.00 - 0.325
Birgitta Ohlsson 57 138.04 104.09 33 112.42 77.26 22 157.23 120.92 0.217
Fredrik Malm 64 41.05 28.16 46 45.09 28.75 2 47.50 36.06 0.588
Ebba Busch Thor 53 653.09 481.93 37 464.86 362.58 22 519.82 294.39 0.136
Sara Skyttedal 53 108.36 79.28 52 126.88 141.77 7 117.71 88.11 0.832
Annie Lööf 38 1238.42 1081.34 24 593.13 258.57 18 489.06 277.57 0.004**
Fredrik Federley 62 112.27 76.61 49 60.43 33.89 1 47.00 - 0.000**
Paula Bieler 71 46.56 38.53 35 53.14 44.01 6 37.83 23.68 0.812
Hanna Wigh 94 51.61 32.57 12 76.92 39.59 0 - - 0.010 Table 3 shows the politicians studied and their number of posts (N), mean of likes and standard de-viation (SD) for the different types of content. Note: the differences of means are significant at **p <0,05.
When conducting the multiple comparison correction (Bonferroni correction),
in order to distinguish if there were significant differences between groups (con-
tent types) within the variable, we found that Wallström’s personalised posts re-
ceive a significantly higher number of likes (adj.p=.003) compared to profession-
44
al content. However, there is no significant difference between personalised con-
tent and political messages (adj.p=.110). Federley shows similar results, his per-
sonalised content receives a significantly higher number of likes (adj.p.=.000)
compared to everyday life professional content but a significant difference be-
tween personalised content and political messages can not be established
(adj.p.=.497). Lööf’s personalised content only receives a significantly higher
number of likes when comparing it with political messages (adj.p.=.005) and not
with everyday life professional content (adj.p.=.092). Kinberg Batra receives a
significantly higher number of likes compared with both everyday life profession-
al content (adj.p.=.000) and political messages (adj.p.=.000)
The politicians who have a significantly higher number of comments on
personalised content compared to other types of content are: Riazat, Federeley
and Wallström.
Engagement Personalised content Everyday life professional Political Message Sig.
N Mean SD N Mean SD N Mean SD p-value
Alice Bah Kuhnke 42 24.24 22.01 42 16.71 16.44 11 23.18 15.35 0.063
Gustav Fridolin 28 12.86 10.82 59 9.51 10.62 25 9.8 7.25 0.147
Margot Wallström 6 13.83 4.22 67 3.46 3.81 7 4.86 4.71 0.004**
Anders Ygeman 50 3.68 3.41 48 3.15 5.3 14 4.29 3.75 0.062
Rossana Dinamarca 62 8.9 9.7 37 7.51 15.65 13 16.23 21.26 0.088
Daniel Riazat 45 5.69 6.05 52 3.19 3.67 8 5.38 3.11 0.027**
Anna Kinberg Batra 28 18.11 24.49 29 12.38 27.92 31 15.19 52.83 0.055
Hanif Bali 73 14.63 23.8 4 10.00 5.35 1 41.00 - 0.299
Birgitta Ohlsson 57 2.88 3.23 33 2.58 3.16 22 3.5 4.67 0.962
Fredrik Malm 64 1.69 2.17 46 1.59 1.77 2 1.5 2.12 0.997
Ebba Busch Thor 53 26.08 49.39 37 11.68 12.11 22 14.95 13.75 0.067
Sara Skyttedal 53 3.92 4.89 52 4.44 5.72 7 7.86 8.23 0.169
Annie Lööf 38 26.37 32.52 24 14.83 11.02 18 32.94 64.51 0.267
Fredrik Federley 62 3.69 7.91 49 0.82 1.236 1 1.00 - 0.000**
Paula Bieler 71 2.1 2.59 35 2.09 2.87 6 2 2 0.77
Hanna Wigh 94 2.43 3.11 12 2.58 2.97 0 - - 0.647 Table 4 shows the politicians studied and their number of posts (N), mean of comments and standard deviation (SD) for the different types of content. Note: the differences of means are significant at **p <0,05 (Kruskal-Wallis).
45
When conducting the multiple comparison correction (Bonferroni correction)
on engagement Federley’s personalised content receives a significantly higher
number of comments (adj.p=.000) compared with everyday life professional con-
tent. Since Federley only posted one political message a comparison between per-
sonalised posts and political messages was not needed. Wallström receives a sig-
nificantly higher number of comments on personalised content both when com-
pared with everyday life professional content (adj.p=.000) and political messages
(adj.p=.048). Riazat shows, when employing the Kruskal-Wallis test, significance
but when the Bonferroni correction, which is a bit more conservative (Narum,
2006), was used there is no significance between personalised posts and everyday
life professional content (adj.p.=.055).
To summarise, our different ways of measuring hypothesis 2 gave mixed re-
sults. The first way of measuring resulted in a clear majority of the top posts in
popularity and engagement being personalised. The second way of measuring
suggested that personalised content achieved a significantly higher number of
likes, but not comments, compared to non-personalised content. The third way of
measuring implied that political messages were the most popular and engaging
content type but this can, as reflected on above, be somewhat misleading. There-
fore, a fourth way of measuring was employed which showed that for some of the
politicians, personalised content gave a significantly higher number of likes and
comments but this was not the case for a clear majority of them. However, there
were no significant differences the other way around either which suggests that if
there is something that drives popularity and engagement it is the personalised
content. The results indicate that there is a higher tendency to receive both popu-
larity and engagement when posting personalised content which means that hy-
pothesis 2 is supported by the data. However, the data cannot support hypothesis
2 to be statistically ensured for all politicians at all times.
5.4.2 Analysis related to Personalisation and Popularity - RQ2
Hypothesis 2 was supported by the data since personalised content was observed
being associated with higher levels of popularity and engagement when looking at
the most popular and engaging posts as well as for some of the politicians indi-

46
vidually. Personalised content also received a significantly higher number of likes
compared to non-personalised content. The data could not, however, show a sta-
tistically significant relationship between personalised content and populari-
ty/engagement when looking at every politician’s overall content separately. Lars-
son (2017b) who examined the most popular posts on Norwegian party leaders’
Instagram accounts was a central part of the previous research which the hypothe-
sis was based upon and it is therefore not surprising that the results from the first
way of measuring supported the hypothesis. Larsson (2017b) did not examine the
politicians’ overall content separately which this study did and it could, therefore,
be argued that this study contributes to the field of research by determining that
the tendency to gain more traction for personalised content is not applicable to all
politicians individually at all times. However, there is neither a tendency the other
way around.
According to the study’s results, personalised content is the only type of con-
tent that is associated with higher levels of popularity and engagement which, in
line with theories of both older and newer media logics, is not a surprising result.
The older media logic concerns the way actors in society have to fit the media’s
format by reducing the information, catch the public’s attention through content
that is easy to grasp and communicating through narrative techniques such as per-
sonalisation (Strömbäck, 2014). These logics are also applicable when actors are
their own media producers and have been complemented by social media logics
which are shaped by the infrastructure of the platforms (Van Dijck & Poell,
2013). In other words, the older logic is relevant also in a newer context. The old-
er media logic suggests that information that is reduced, easy to understand and
relatable receives more popularity and the study’s results indicate that this also is
the case when politicians are communicating on Instagram. This means that ac-
tors, in the long run, need to adapt their content to fit the modus operandi of these
platform in order to gain traction.
The part in Van Dijck and Poell’s (2013) framework on social media logics
that concern popularity is perhaps the most relevant when analysing these results.
Popularity is a cornerstone in both creating and generating visibility and since the
findings show a tendency for personalised content to receive more popularity and
engagement this type of content will more likely gain visibility on the platforms
and, thus, reach the public to a greater extent. This gives, according to Klinger and

47
Svensson (2015), incentives for posting content that is more personalised and
maximises the attention but as the first research question showed this behaviour
have, even though it is the most frequent type of content, not increased during the
last parliamentary term which in this sense is a bit unexpected.
5.3 Results and Analysis related to RQ3
5.5.1 Results related to RQ3
RQ3a: Are politicians on Instagram incorporating aspects from their private
sphere when communicating political messages?
Figure 8. Percentage of hybrids and Political Messages
As the bar chart (fig. 8) illustrates hybrids are indeed used by politicians as a
communication strategy when communicating political messages. Of all political
messages 43,4 per cent are hybrids which means that the answer to research ques-
tion 3a is that prominent Swedish politicians on Instagram do incorporate aspects
from their private sphere when conveying political messages.

48
RQ3b: In that case, has the proportion of this communication strategy increased
during the current parliamentary term?
Figure 9. Timeline of hybrid development
The line diagram (fig. 9) illustrates that there has been an increase in the use
of hybrids throughout the current parliamentary term. In the last quarter of 2014,
6,7 % of all posts were hybrids and in the first quarter of 2018, 15,5 % of all posts
were hybrids. The diagram also shows that there has been a rather steady increase
during the period which means that the answer to research question 3c is that the
proportion of hybrids have increased during the current parliamentary term.
RQ3c: Are political messages with a connection to the politician’s private sphere
more popular than political messages that are strictly political?
Figure 10. Mean of likes for hybrids and Political Messages
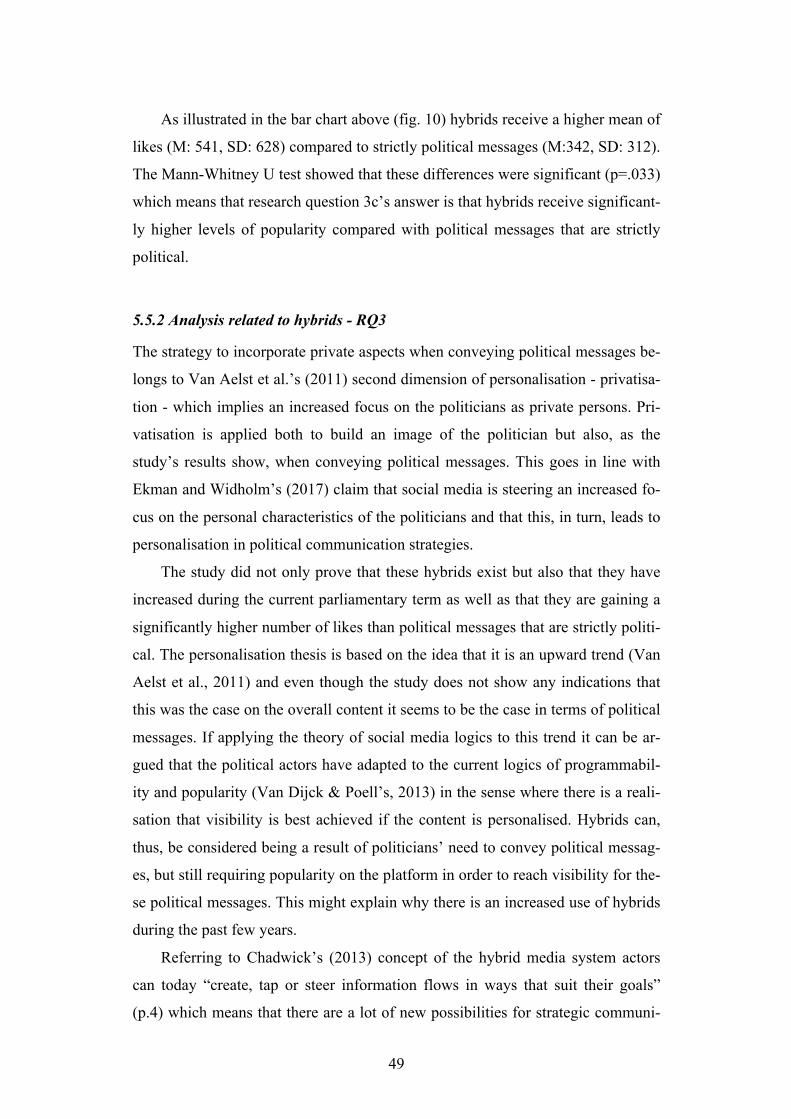
49
As illustrated in the bar chart above (fig. 10) hybrids receive a higher mean of
likes (M: 541, SD: 628) compared to strictly political messages (M:342, SD: 312).
The Mann-Whitney U test showed that these differences were significant (p=.033)
which means that research question 3c’s answer is that hybrids receive significant-
ly higher levels of popularity compared with political messages that are strictly
political.
5.5.2 Analysis related to hybrids - RQ3
The strategy to incorporate private aspects when conveying political messages be-
longs to Van Aelst et al.’s (2011) second dimension of personalisation - privatisa-
tion - which implies an increased focus on the politicians as private persons. Pri-
vatisation is applied both to build an image of the politician but also, as the
study’s results show, when conveying political messages. This goes in line with
Ekman and Widholm’s (2017) claim that social media is steering an increased fo-
cus on the personal characteristics of the politicians and that this, in turn, leads to
personalisation in political communication strategies.
The study did not only prove that these hybrids exist but also that they have
increased during the current parliamentary term as well as that they are gaining a
significantly higher number of likes than political messages that are strictly politi-
cal. The personalisation thesis is based on the idea that it is an upward trend (Van
Aelst et al., 2011) and even though the study does not show any indications that
this was the case on the overall content it seems to be the case in terms of political
messages. If applying the theory of social media logics to this trend it can be ar-
gued that the political actors have adapted to the current logics of programmabil-
ity and popularity (Van Dijck & Poell’s, 2013) in the sense where there is a reali-
sation that visibility is best achieved if the content is personalised. Hybrids can,
thus, be considered being a result of politicians’ need to convey political messag-
es, but still requiring popularity on the platform in order to reach visibility for the-
se political messages. This might explain why there is an increased use of hybrids
during the past few years.
Referring to Chadwick’s (2013) concept of the hybrid media system actors
can today “create, tap or steer information flows in ways that suit their goals”
(p.4) which means that there are a lot of new possibilities for strategic communi-

50
cation in this digital era which is intertwined with the older mass media era. The
possibilities Instagram provides, partly by putting the visuals in the centre, have
enabled politicians to communicate with the electorate in ways where political
messages can be framed to be relatable and possibly captivating. And indeed, the
study’s results indicate that the public finds hybrids being more appealing than
strictly political messages.
51
6. Conclusions and discussion
6.1 Conclusions
In this study, we examined prominent Swedish politicians’ Instagram accounts in
relation to the personalisation thesis. In more detail, whether or not the proportion
of personalised posts have increased during the current parliamentary term and if
personalised content is associated with higher levels of popularity and engage-
ment. Moreover, we explored whether or not Swedish politicians incorporate as-
pects from their private sphere when communicating political messages and if
this, in that case, have increased during the current parliamentary term and if it
achieves more popularity than other political messages.
The first hypothesis was not supported by the data since the proportion of
personalised posts did not increase during the current parliamentary term. This re-
sult was rather surprising seeing that most previous research on the personalisa-
tion thesis in an online context point to the opposite result. The second hypothesis
which concerned an association between personalised content and populari-
ty/engagement was supported by the data. However, the study could not provide
evidence of personalised content always gaining more traction but was able to
confirm that there is an association.
The findings concerning the third research question showed that political ac-
tors do incorporate private aspects when communicating political messages, they
have done so increasingly during the period of study and these hybrids gain more
popularity than political messages that are strictly political. This suggests that
prominent Swedish politicians strategically communicate their political messages
embedded in private aspects in order to reach their electorate and the results clear-
ly show that this is a successful strategy, at least in terms of gaining a more cen-
tral position on the social media platform Instagram.

52
6.2 Discussion
As pointed out in the theoretical framework, personalisation is a consequence of
both media logics and political communications strategies (Van Aelst et al. 2011).
Knowing that, it can be argued that the tendency to post personalised content has
been saturated because it simply has reached its highest point. In other words, the
politicians might not be able to adapt more to the media logics in their communi-
cation strategies than what they already have. If the politicians’ content would
merely consist of personalised posts it could arguably decrease the politicians’
professional credibility.
Another reason as to why politicians might choose to not communicate in-
creasingly personalised could be because all communication is not primarily
aimed to potential voters but rather fellow party members. It is important to re-
member the internal aspect of politicians’ social media use since it might have an
effect on what type of content is being posted. It seems reasonable to assume that
fellow party members have a higher tendency to follow prominent politicians in
their respective party on social media which means that communication strategies
need to be aimed for these too. If politicians were to only communicate personal-
ised, the intra-party support could be at risk seeing that these people most likely
have a high interest in the ideological aspects of politics as well.
Seeing that 53 per cent of all Swedes are using Instagram, which is the high-
est usage penetration in the world, Instagram has become an important communi-
cation channel not least for politicians who want to reach their potential voters and
party members. However, the social media logic of Instagram favours personal-
ised content with high rates of popularity and engagement which makes it hard to
reach out with political messages and policy initiatives. Consequently, this de-
mands a change when planning and carrying out political communication strate-
gies. In order to adapt to the modus operandi of Instagram, the study’s results
suggest that political actors incorporate private aspects when conveying political
messages (hybrids) and, in that way, try to reach their potential voters. In other
words, Instagram was not made for conventional political communication but it
can be an effective tool to strategically communicate with, and to, potential voters
if the politicians chose to adapt to the logic of Instagram and make the political
messages personal in some way. There is indeed great potential to reach the cov-

53
eted younger segment of the electorate and by communicating personalised with
them it might result in a higher political interest among this group of people
(Kruikemeier et al., 2013).
Referring back to the problem formulation, there is also a need to shed light
on the negative consequences of political communication becoming more person-
alised. It can be argued that personalisation depoliticises the public debate and
leaves the public less informed on substantial issues since communication on the
ideological aspects of politics decreases and focus is instead increasingly directed
towards the lifestyle of the politician and non-political trivial issues. Since Insta-
gram is centred around pictures it inherits a constraint in conveying political mes-
sages of a complex manner which can be seen as intensifying the tendency of
shifting focus towards the politician’s personal sphere. On Instagram, there is no
space for communicating complicated policy initiatives: posts need to be visually
appealing and the caption needs to be short and create engagement. Even if the
study’s result showed that there was no increase in personalised posts during the
last few years, the proportion of personalised posts on Instagram is still very high
(50,3 %) compared to the other types of content. Political messages only made up
for 11,5 per cent of the total sample of posts. It is important that this is reflected
upon since the younger generations which to a large extent consume news and ac-
quire knowledge on political issues through social media (Gottfried, Barthel,
Shearer & Mitchell, 2016) might get a distorted perception of politics.
The number of people who question the liberal democratic system has in-
creased and there are scholars who suggest that social media can be used as a tool
to re-establish a connection with the electorate and as a platform to discuss politi-
cal matters. The increased use of hybrids, which this study found, is interesting in
relation to this since it can be seen as a strategy to meet the demands of not only
the social media logics but also of the public. This leaves room for politicians to
disguise their political messages in visually appealing and personal ways but also
creates opportunities for future communication practitioners. However, if this is
positive or negative for the public discourse and the democracy is beyond the
scope of this study.

54
6.3 Research contribution and suggestions for further re-search
The study has contributed with insights on a few different areas. Firstly, the per-
sonalisation thesis has been examined in a social media context from a political
actors perspective which is an important contribution seeing that few studies have
examined this specific area and more generally, the personalisation thesis have
previously had mixed results. Secondly, the study found that personalised content
is not always at all times receiving more popularity and engagement which previ-
ous studies have not been able to determine. This conclusion could be drawn due
to the fact that the study was based on a relatively large sample size and did not
only examine the most popular posts which previous research have done. Lastly,
the concept of hybrids is an important contribution to the field and has provided a
basis for future research. The coding scheme used to identify hybrids can be im-
plemented also in other contexts than Instagram which can be regarded as a meth-
odological and conceptual contribution.
While this study has contributed with important insights regarding personali-
sation on Instagram and the use of hybrids the area can be further researched. Po-
litical communication on Instagram is a rather new phenomenon and research on
this area is, thus, still in an early stage. Future studies should continue to explore
the hybrids found in this study. Are hybrids successful also beyond the social me-
dia logics as a communication strategy in terms of gaining the public’s trust and
votes? Another interesting approach would be to examine the most popular Insta-
gram accounts belonging to politicians and see what their communications strate-
gies are. This could be done with quantitative methods but also through a qualita-
tive semiotic analysis in order to examine the images on a deeper level and under-
stand the conveyed connotations. In this way, feelings and emotions created by
images can be explored which can lead the way for future political communica-
tion strategies.
The personalisation thesis should also be further researched from a political
actors perspective. Up until now, a lot of focus has been directed towards the me-
dia perspective by examining whether or not the media has an increased focus on
political candidates and their characteristics. The new media landscape has, how-
ever, changed the dynamics and the politicians are increasingly their own media
55
producers which means that this trend also needs to be researched from the per-
spective of the politicians.

56
References
Armstrong, R. A. (2014). When to use the Bonferroni correction. Ophthalmic &
Physiological Optics, 34(5), 502-508.
Asp, K. & Johansson, B. (1999). Medierna och personvalet (SOU 1999:92).
Stockholm: Faktainfo.
Aylott, N. (2005). President Persson. How did Sweden get him? In The presiden-
tialization of politics. A comparative study of modern democracies. Oxford:
Oxford University Press.
Barthes, R. (1977). Rhetoric of the Image. In S. Heath (Ed.), Image – Music –
Text (p. 32–51). New York: Hill and Wang.
Bennulf, M., & Hedberg, P. (1993). Person och parti i massmedierna (SOU
1993:63). Stockholm: Allmänna Förlaget.
Binderkrantz, A. S., & Green-Pedersen, C. (2009). Policy or processes in focus?
The Harvard International Journal of Press/Politics, 14(2), 166-185.
Bjerling, J. (2012). The Personalisation of Swedish Politics. Party Leaders in the
Election Coverage 1979-2010. Unpublished doctoral dissertation, University of
Gothenburg, Gothenburg. Retrieved 25 April, 2018, from
http://hdl.handle.net/2077/31451.
Blumenthal, S. (1980). The Permanent Campaign: Inside the World of Elite Po-
litical Operatives. Boston: Beacon Press.
Blumler, J.G., & Kavanagh, D. (1999). The third age of political communication:
Influences and features. Political Communication, 16(3), 209-230.
Bucher, T. (2012). Want to Be on the Top? Algorithmic Power and the Threat of
91 Invisibility on Facebook. New Media & Society, 14(7), 1164–1180.
Chadwick, A. (2017). The hybrid media system: politics and power. New York:
Oxford University Press.
Ekman, M., & Widholm, A. (2015). Politicians as Media Producers. Journalism
Practice, 9(1), 78-91.

57
Ekman, M., & Widholm, A. (2017). Political communication in an age of visual
connectivity: Exploring Instagram practices among Swedish politicians. Nort-
hern Lights: Film & Media Studies Yearbook, 15(1), 15-32.
Enli, G. S., & Skogerbø, E. (2013). Personalized Campaigns in Party-Centered
Politics: Twitter and Facebook as arenas for political communication. Inform-
ation, Communication & Society 16(5), 757-774.
Filimonov, K., Russman, U., & Svensson, J. (2016). Picturing the Party: Instag-
ram and Party Campaigning in the 2014 Swedish Elections. Social Media +
Society, 2(3), 1-11.
Foa, R.F., Mounk, Y., & Inglehart, R. F. (2016). The Danger of Deconsolidation.
Journal of Democracy, 27(3), 5-15.
Foa, R. F., & Mounk, Y. (2017). The Signs of Deconsolidation. Journal of de-
mocracy, 28(1), 5-15.
Gottfried, J., Barthel, M., Shearer, E., & Mitchell, A. (2016). The 2016 presiden-
tial campaign—A news event that’s hard to miss (Pew Research Center). Retri-
eved 12 May, 2018, from http://www.journalism.org/2016/02/04/the-2016-
presidential-campaign-a-news-event-thats-hard-to-miss/.
Gustafsson, N. (2015). Social Media and Parliamentary Infighting: Digital
naturals in the Swedish Riksdag? In W.T., Coombs, J. Falkheimer, M. Heide,
& P. Young (Eds.), Strategic Communication, Social Media and Democracy
(pp. 95-105). New York: Routledge.
Habermas, J. (1989). The Structural Transformation of the Public Sphere: An In-
quiry into a Category of Bourgeois Society. Cambridge: Polity.
Habermas, J. (1996). Between facts and norms: contributions to a discourse the-
ory of law and democracy. Oxford: Polity Press.
Habermas, J. (2006). Political communication in media society: Does democracy
still enjoy an epistemic dimension? The impact of normative theory on empiri-
cal research. Communication Theory, 16(4), 411-426.
Hair, J. F., Black, W. C., Babin, B. J., & Anderson, R. E. (2010). Multivariate
data analysis. Upper Saddle River, NJ: Prentice Hall.
Hart, R. (1992). Seducing America. How Television Charms the Modern Voter.
London: SAGE.

58
Hermans, L., & Vergeer, M. (2012). Personalization in e-campaigning: A cross-
national comparison of personalization strategies used on candidate websites of
17 countries in EP elections 2009. New Media & Society, 15(19), 72-92.
InstaBro. (n.d.). InstaBro for Mac OS X: Browse and download Instagram photos
easily. Retrieved 23 March, 2018, from https://datastills.com/instabro/.
IIS. (2017). Svenskarna och internet 2017 - Undersökning om svenskarnas inter-
netvanor. Retrieved 18 April, 2018, from
https://www.iis.se/docs/Svenskarna_och_internet_2017.pdf
Johansson, B. (2008). Popularized election coverage? News coverage of Swedish
parliamentary election campaigns 1979-2006. In Strömbäck, J., Ørsten, M., &
Aalberg, T. (Eds.), Communicating politics. Political communication in the
Nordic countries (p.181-194). Göteborg: Nordicom.
Kalsnes, B. (2016). The power of likes: social media logic and political communi-
cation. Unpublished doctoral dissertation, University of Oslo, Oslo. Retrieved
02 May, 2018, from
https://www.researchgate.net/publication/317281598_The_power_of_likes_So
cial_media_logic_and_political_communication.
Karvonen, L. (2010). The Personalization of Politics: A Study of Parliamentary
Democracies. Colchester: ECPR Press.
Klinger, U., & Svensson, J. (2014). The Emergence of Network Media Logic in
Political Communication: A Theoretical Approach, New Media & Society,
17(8), 1241-1257.
Kriesi, H. (2011). Personalization of national election campaigns. Party Politics,
18(6), 825-844.
Kruikemeier, S., Van Noort, G., Vliengenthart, R., & de Vreese, C. H. (2013).
Getting closer: the effects of personalized and interactive online political com-
munication. European Journal of Communication, 28(1), 53-66.
Lalancette, M., & Raynauld, V. (2017). The Power of Political Image: Justin
Trudeau, Instagram, and Celebrity Politics. American Behavioral Scientist,
00(0), 1-37.
Langer, A. I. (2006). The politicisation of private persona. The case of Tony Blair
in historical perspective. London: London School of Economics and Political
Science.

59
Larsson, A. O. (2017a). Top Users and Long Tails: Twitter and Instagram Use
During the 2015 Norwegian Elections. Social Media + Society, 3(2), 1-12.
Larsson, A. O. (2017b). Skiing all the way to the polls: Exploring the popularity
of personalized posts on political Instagram accounts. Convergence: The Inter-
national Journal of Research into New Media Technologies, 1-15.
Loader, B. D., Vromen, A., & Xenos, M. A. (2016). Performing for the young
networked citizen? Celebrity politics, social networking and the political enga-
gement of young people. Media, Culture and Society, 38(3), 400-419.
Maarek, P. J. (2014). Politics 2.0: New Forms of Digital Political Marketing and
Political Communication. Trípodos, (34), 13-22.
McAllister, I. (2007). The personalization of politics. In Dalton, R, J. & Klinge-
mann, H. D. (Eds.), Oxford Handbook of Political Behavior (p. 571-588). Ox-
ford: Oxford University Press.
Narum, S. R. (2006). Beyond Bonferroni: Less conservative analyses for conser-
vation genetics. Conversation Genetics, 7(5), 783-787.
Neuendorf, K. A. (2017). The Content Analysis Guidebook. London: SAGE.
Olsson, E-K., & Eriksson, M. (2016) The logic of public organizations’ social
media use: Toward a theory of ‘social mediatization’, Public Relations Inquiry,
5(2), 187–204.
Postman, N. (1985). Amusing Ourselves to Death: Public Discourse in the Age of
Show Business. London: Heinemann.
Rahat, G., & Sheafer, T. (2007). The personalization(s) of politics: Israel, 1949–
2003. Political Communication, 41(1), 65–80.
Reinemann, C., & Wilke, J. (2007). It’s the debates, stupid! How the introduction
of televised debates changed the portrayal of chancellor candidates in the Ger-
man press, 1949-2005. The Harvard International Journal of Press/Politics,
12(4), 99-111.
Riksdagen. (2018). Ledamöter & Partier. Retrieved 18 April, 2018, from
https://www.riksdagen.se/sv/ledamoter-partier/.
Russmann, U., & Svensson, J. (2017). Interaction on Instagram? Glimpses from
the 2014 Swedish Elections. International Journal Of E-Politics, 8(1), 50-65.
Šimunjak, M. (2012). The Private Life as Part of Croatian Politicians' Communi-
cation Strategies: The 2009-2010 Presidential Elections. Medijske Studije, 3(5),
34-50.

60
Schill, D. (2012). The Visual Image and the Political Image: A Review of Visual
Communication Research in the Field of Political Communication. Review Of
Communication, 12(2), 118-142.
Sennett, R. (1976). The Fall of Public Man. Cambridge: Cambridge University
Press.
SOM-institutet. (2016). Svenska trender 1986-2016. Retrieved 23 April, 2018,
from https://som.gu.se/digitalAssets/1649/1649642_32-svenska-trender-1986-
2016.pdf.
Speelman, D., Heylen, K., & Geeraerts, D. (2018). Mixed-Effects Regression Mo-
dels in Linguistics. Cham: Springer International Publishing.
Statista. (2018a). Number of monthly active Instagram users from January 2013
to September 2017 (in millions). Retrieved 18 April, 2018, from
https://www.statista.com/statistics/253577/number-of-monthly-active-
instagram-users/.
Statista. (2018b). Usage penetration of Instagram in selected countries as of
January 2018. Retrieved 18 April, 2018, from
https://www.statista.com/statistics/325567/instagram-penetration-regions/.
Strömbäck, J. (2014). Makt, medier och samhälle: en introduktion till politisk
kommunikation. Lund: Studentlitteratur Ab.
Svensson, J. (2012). Negotiating the political self on social media platforms. An
in-depth study of image-management in an election-campaign in a multi-party
democracy. eJournal of eDemocracy and Open Government, 4(2), 183-197.
Swedish Institute. (2018). The Swedish System of Government. Retrieved 19
April, 2018, from https://sweden.se/society/the-swedish-system-of-
government/.
Ten Have, T. R., Kunselman, A. R., Pulkstenis, E. P., & Landis, R. J. (1998).
Mixed Effects Logistic Regression Models for Longitudinal Binary Response
Data with Informative Drop-Out. Biometrics, 54(1), 367-383.
Van Aelst, P., Sheafer, T., & Stanyer, J. (2011). The personalization of mediated
political communication: A review of concepts, operationalizations and key
findings. Journalism, 13(2), 203-220.
Van Dijck, J., & Poell, T. (2013). Understanding Social Media Logic. Media and
Communication, 1(1), 2-14.

61
Van Dongen, H. P., Olofsen, E., Dinges, D. F., & Maislin, G. (2004). Mixed-
Model Regression Analysis and Dealing with Interindividual Differences.
Methods In Enzymology, 384, 139-171.
Van Santen, R., & Van Zoonen, L. (2010). The personal in political television bi-
ographies. Biography, 33(1), 46–67.
Van Zoonen, L. (2005). Entertaining the Citizen: When Politics and Popular Cul-
ture Converge. Lanham, MD: Rowman & Littlefield.
Wahlgren, L. (2008). SPSS steg för steg. Lund: Studentlitteratur.
Wheeler, M. (2013). Celebrity Politics. London: Polity Press.

62
Appendices
Appendix 1 - Sampling of posts ALICE BAH KUHNKE Q4’14: Missing data Q1’15: Missing data Q2’15: 99 posts → Skip Interval = 12 Q3’15: 65 posts → Skip Interval = 8 Q4’15: 85 posts → Skip Interval = 11 Q1’16: 81 posts → Skip Interval =10 Q2’16: 87 posts → Skip Interval = 9 Q3’16: 85 posts → Skip Interval = 11 Q4’16: 100 posts → Skip Interval = 13 Q1’17: 81 posts → Skip Interval = 10 Q2’17: 76 posts → Skip Interval = 10 Q3’17: 68 posts → Skip Interval = 9 Q4’17: 82 posts → Skip Interval = 10 Q1’18: 80 posts → Skip Interval = 10 TOTALT=989 GUSTAV FRIDOLIN Q4’14: 23 posts → Skip Interval = 3 Q1’15: 22 posts → Skip Interval = 3 Q2’15: 13 posts → Skip Interval = 2 Q3’15: 26 posts → Skip Interval = 3 Q4’15: 20 posts → Skip Interval = 3 Q1’16:18 posts → Skip Interval = 2 Q2’16:19 posts → Skip Interval = 2 Q3’16:41 posts → Skip Interval = 5 Q4’16:62 posts → Skip Interval = 8 Q1’17:50 posts → Skip Interval = 6 Q2’17:43 posts → Skip Interval = 5 Q3’17:30 posts → Skip Interval = 4 Q4’17:45 posts → Skip Interval = 6 Q1’18:51 posts → Skip Interval = 6 TOTALT=463
MARGOT WALLSTRÖM Q4’14: Missing data Q1’15: Missing data Q2’15: Missing data Q3’15: Missing data Q4’15: 19 posts → Skip Interval = 2 Q1’16: 17 posts → Skip Interval = 2 Q2’16: 16 posts → Skip Interval = 2 Q3’16: 24 posts → Skip Interval = 3 Q4’16: 38 posts → Skip Interval = 5 Q1’17:35 posts → Skip Interval = 4 Q2’17:18 posts → Skip Interval = 2 Q3’17:25 posts → Skip Interval = 3 Q4’17:33 posts → Skip Interval = 4 Q1’18:37 posts → Skip Interval = 5 TOTALT=252 ANDERS YGEMAN Q4’14: 45 posts → Skip Interval = 6 Q1’15:44 posts → Skip Interval = 6 Q2’15:46 posts → Skip Interval = 6 Q3’15:33 posts → Skip Interval = 4 Q4’15:35 posts → Skip Interval = 4 Q1’16:17 posts → Skip Interval = 2 Q2’16:17 posts → Skip Interval = 2 Q3’16:49 posts → Skip Interval = 6 Q4’16:67 posts → Skip Interval = 8 Q1’17:40 posts → Skip Interval = 5 Q2’17:49 posts → Skip Interval = 6 Q3’17:43 posts → Skip Interval = 5 Q4’17:65 posts → Skip Interval = 8 Q1’18:42 posts → Skip Interval = 5 TOTALT=592

63
ROSSANA DINAMARCA Q4’14:69 posts → Skip Interval = 9 Q1’15:74 posts → Skip Interval = 9 Q2’15:65 posts → Skip Interval = 8 Q3’15:86 posts → Skip Interval = 11 Q4’15:50 posts → Skip Interval = 6 Q1’16:58 posts → Skip Interval = 7 Q2’16:46 posts → Skip Interval = 7 Q3’16:53 posts → Skip Interval = 7 Q4’16:54 posts → Skip Interval = 7 Q1’17:37 posts → Skip Interval = 5 Q2’17:35 posts → Skip Interval = 4 Q3’17:45 posts → Skip Interval = 6 Q4’17:43 posts → Skip Interval = 5 Q1’18:40 posts → Skip Interval = 5 TOTALT=1662 DANIEL RIAZAT Q4’14:8 posts → Skip Interval = 1 Q1’15:18 posts → Skip Interval = 2 Q2’15:22 posts → Skip Interval = 3 Q3’15:9 posts → Skip Interval = 1 Q4’15:12 posts → Skip Interval = 2 Q1’16:9 posts → Skip Interval = 1 Q2’16:6 posts → Skip Interval = 1 Q3’16:6 posts → Skip Interval = 1 Q4’16:13 posts → Skip Interval = 2 Q1’17:5 posts → Skip Interval = 1 Q2’17:9 posts → Skip Interval = 1 Q3’17:8 posts → Skip Interval = 1 Q4’17:11 posts → Skip Interval = 1 Q1’18:10 posts → Skip Interval = 1 TOTALT=146
ANNA KINBERG BATRA Q4’14: Missing data Q1’15: Missing data Q2’15: Missing data Q3’15:72 posts → Skip Interval = 9 Q4’15:81 posts → Skip Interval = 10 Q1’16:120 posts → Skip Interval = 15 Q2’16:183 posts → Skip Interval = 23 Q3’16:201 posts → Skip Interval = 25 Q4’16:265 posts → Skip Interval = 33 Q1’17:223 posts → Skip Interval = 28 Q2’17:242 posts → Skip Interval = 30 Q3’17:142 posts → Skip Interval = 18 Q4’17:65 posts → Skip Interval = 8 Q1’18:68 posts → Skip Interval = 9 TOTALT=1662 HANIF BALI Q4’14:3 posts → Skip Interval = 1 Q1’15:2 posts → Skip Interval = 1 Q2’15:17 posts → Skip Interval = 2 Q3’15:7 posts → Skip Interval = 1 Q4’15:1 posts → Skip Interval = 1 Q1’16:0 posts → Skip Interval = 0 Q2’16:7 posts → Skip Interval = 1 Q3’16:16 posts → Skip Interval = 2 Q4’16:10 posts → Skip Interval = 1 Q1’17:2 posts → Skip Interval = 1 Q2’17:32 posts → Skip Interval = 4 Q3’17:16 posts → Skip Interval = 2 Q4’17:24 posts → Skip Interval = 3 Q1’18:48 posts → Skip Interval = 6 TOTALT=185

64
BIRGITTA OHLSSON Q4’14:375 posts → Skip Interval = 47 Q1’15:311 posts → Skip Interval = 39 Q2’15:329 posts → Skip Interval = 41 Q3’15:298 posts → Skip Interval = 37 Q4’15:237 posts → Skip Interval = 30 Q1’16:291 posts → Skip Interval = 36 Q2’16:339 posts → Skip Interval = 42 Q3’16: 300 posts → Skip Interval = 38 Q4’16:319 posts → Skip Interval = 40 Q1’17:392 posts → Skip Interval = 49 Q2’17:414 posts → Skip Interval = 52 Q3’17:319 posts → Skip Interval = 40 Q4’17:335 posts → Skip Interval = 42 Q1’18:228 posts → Skip Interval = 29 TOTALT=4487 FREDRIK MALM Q4’14:16 posts → Skip Interval = 2 Q1’15:16 posts → Skip Interval = 2 Q2’15:58 posts → Skip Interval = 7 Q3’15:21 posts → Skip Interval = 3 Q4’15:54 posts → Skip Interval = 7 Q1’16:53 posts → Skip Interval = 7 Q2’16:39 posts → Skip Interval = 5 Q3’16:27 posts → Skip Interval = 3 Q4’16:35 posts → Skip Interval = 5 Q1’17:34 posts → Skip Interval = 5 Q2’17:26 posts → Skip Interval = 3 Q3’17:28 posts → Skip Interval = 3 Q4’17:22 posts → Skip Interval = 3 Q1’18:26 posts → Skip Interval = 3 TOTALT=455
EBBA BUSCH THOR Q4’14:10 posts → Skip Interval = 1 Q1’15:24 posts → Skip Interval = 3 Q2’15:33 posts → Skip Interval = 4 Q3’15: 20 posts → Skip Interval = 3 Q4’15:31 posts → Skip Interval = 4 Q1’16:32 posts → Skip Interval = 4 Q2’16:28 posts → Skip Interval = 4 Q3’16:19 posts → Skip Interval = 2 Q4’16:37 posts → Skip Interval = 5 Q1’17:34 posts → Skip Interval = 4 Q2’17:56 posts → Skip Interval = 7 Q3’17:50 posts → Skip Interval = 6 Q4’17:52 posts → Skip Interval = 6 Q1’18:83 posts → Skip Interval = 10 TOTALT=509 SARA SKYTTEDAL Q4’14:74 posts → Skip Interval = 9 Q1’15:101 posts → Skip Interval = 13 Q2’15:94 posts → Skip Interval = 12 Q3’15: 80 posts → Skip Interval = 10 Q4’15:99 posts → Skip Interval = 12 Q1’16:114 posts → Skip Interval = 14 Q2’16:183 posts → Skip Interval = 23 Q3’16:104 posts → Skip Interval = 13 Q4’16:83 posts → Skip Interval = 10 Q1’17:88 posts → Skip Interval = 11 Q2’17:98 posts → Skip Interval = 12 Q3’17:76 posts → Skip Interval = 10 Q4’17:77 posts → Skip Interval = 10 Q1’18:68 posts → Skip Interval = 9 TOTALT=1339
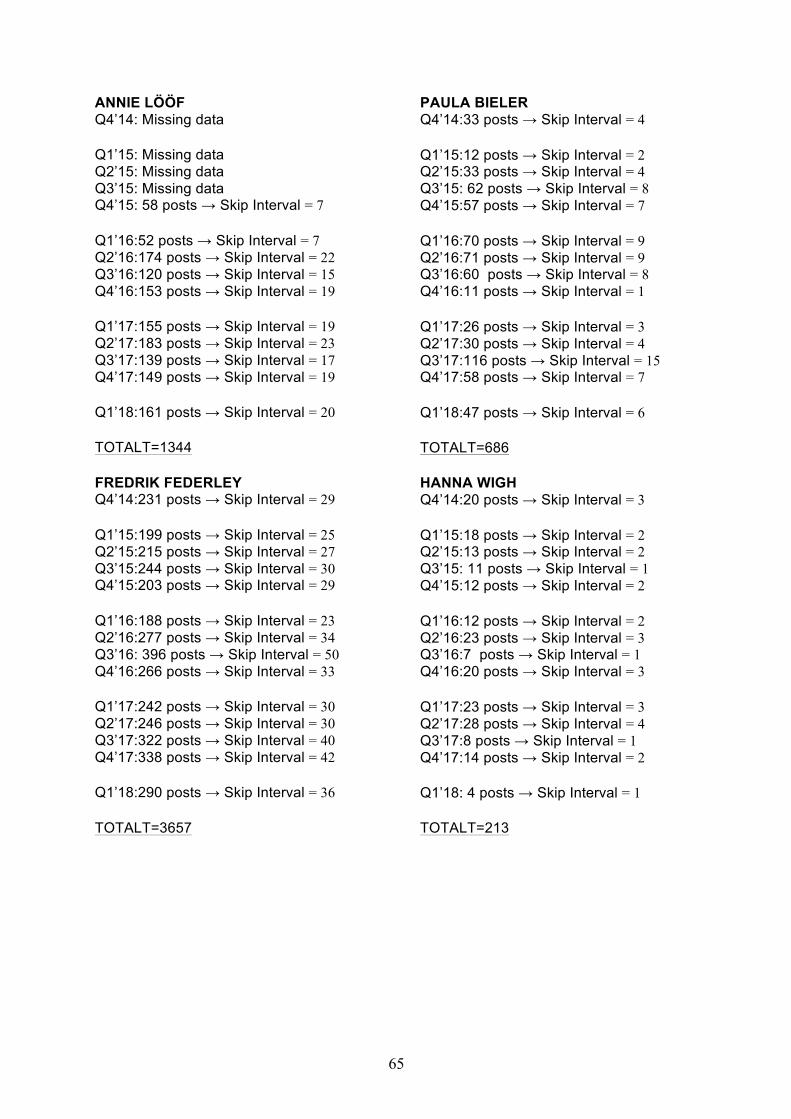
65
ANNIE LÖÖF Q4’14: Missing data Q1’15: Missing data Q2’15: Missing data Q3’15: Missing data Q4’15: 58 posts → Skip Interval = 7 Q1’16:52 posts → Skip Interval = 7 Q2’16:174 posts → Skip Interval = 22 Q3’16:120 posts → Skip Interval = 15 Q4’16:153 posts → Skip Interval = 19 Q1’17:155 posts → Skip Interval = 19 Q2’17:183 posts → Skip Interval = 23 Q3’17:139 posts → Skip Interval = 17 Q4’17:149 posts → Skip Interval = 19 Q1’18:161 posts → Skip Interval = 20 TOTALT=1344 FREDRIK FEDERLEY Q4’14:231 posts → Skip Interval = 29 Q1’15:199 posts → Skip Interval = 25 Q2’15:215 posts → Skip Interval = 27 Q3’15:244 posts → Skip Interval = 30 Q4’15:203 posts → Skip Interval = 29 Q1’16:188 posts → Skip Interval = 23 Q2’16:277 posts → Skip Interval = 34 Q3’16: 396 posts → Skip Interval = 50 Q4’16:266 posts → Skip Interval = 33 Q1’17:242 posts → Skip Interval = 30 Q2’17:246 posts → Skip Interval = 30 Q3’17:322 posts → Skip Interval = 40 Q4’17:338 posts → Skip Interval = 42 Q1’18:290 posts → Skip Interval = 36 TOTALT=3657
PAULA BIELER Q4’14:33 posts → Skip Interval = 4 Q1’15:12 posts → Skip Interval = 2 Q2’15:33 posts → Skip Interval = 4 Q3’15: 62 posts → Skip Interval = 8 Q4’15:57 posts → Skip Interval = 7 Q1’16:70 posts → Skip Interval = 9 Q2’16:71 posts → Skip Interval = 9 Q3’16:60 posts → Skip Interval = 8 Q4’16:11 posts → Skip Interval = 1 Q1’17:26 posts → Skip Interval = 3 Q2’17:30 posts → Skip Interval = 4 Q3’17:116 posts → Skip Interval = 15 Q4’17:58 posts → Skip Interval = 7 Q1’18:47 posts → Skip Interval = 6 TOTALT=686 HANNA WIGH Q4’14:20 posts → Skip Interval = 3 Q1’15:18 posts → Skip Interval = 2 Q2’15:13 posts → Skip Interval = 2 Q3’15: 11 posts → Skip Interval = 1 Q4’15:12 posts → Skip Interval = 2 Q1’16:12 posts → Skip Interval = 2 Q2’16:23 posts → Skip Interval = 3 Q3’16:7 posts → Skip Interval = 1 Q4’16:20 posts → Skip Interval = 3 Q1’17:23 posts → Skip Interval = 3 Q2’17:28 posts → Skip Interval = 4 Q3’17:8 posts → Skip Interval = 1 Q4’17:14 posts → Skip Interval = 2 Q1’18: 4 posts → Skip Interval = 1 TOTALT=213

66
Appendix 2 – Coding manual
Variable 1: Unitname - Initials and Quarter • The unitname is identified by an abbreviation with: initials, quarter, year and
what unit number it is in the quarter. For example, a post from Anna Kinberg
Batra the 1st of January 2017 would be identified as AKB_Q1’17_1.
V2: Date - publishing date • This section consists of the exact date on which the post was published.
V3: Number of comments • When counting comments the total amount of comments in the field are
counted, including the politicians answers.
V4: Number of likes V5: Type of content
V5.1: Everyday life private o That is, if there is nothing professional or political implication in the
picture or text, it is to be coded as a Everyday life private-post.
V5.2: Everyday life professional o All professional postings that does not contain a political message or
standpoint is to be coded as Everyday life professional in order to dis-
tinguish when the politician is only doing work-related tasks from actual
political messages as well as everyday private content.
V5.3: Political message o Presence of political message, that is, when the politician obviously in-
tends to convey a political message of some sort, or manifests her/his
standpoint in a matter that relates to the political sphere.

67
V6: Connection to private sphere within everyday life professional • If the everyday life professional post is containing anything from the politician’s
private sphere, this box ought to be ticked.
• A connection can concern either: Partner, Children, Other family members,
Upbringing and past life, Personal values, Personal interests
V7: Connection to private sphere within political message • If the political message is containing anything from the politician’s private
sphere, this box ought to be ticked.
• A connection can concern either: Partner, Children, Other family members,
Upbringing and past life, Personal values, Personal interests

68
Appendix 3 – Coding scheme
Intercoder Reliability Percent agreement (or “crude agreement”) was employed on 5 % of the total popula-
tion of posts in order to test the intercoder reliability and it was calculated in the fol-
lowing way: A (Number of Agreements)/ (total number of cases) =PAo (Proportion
Agreement Observed)
All variables combined
Number of Agreements: 421
Total number of cases: 444
PAo= 0.9482
Percent Agreement: 94,82%
Variable 2 - Date/ Quarter
Number of Agreements: 80
Total number of cases: 80
PAo= 1.0
Percent Agreement: 100%
Variable 3 - Comments
Number of Agreements: 80
Total number of cases: 80
PAo= 1.0
Percent Agreement: 100%
Variable 4 - Likes
Number of Agreements: 79
Total number of cases: 80
PAo= .9875
Percent Agreement: 98,75%
Variable 4 - Referring to self
Number of Agreements: 69
Total number of cases: 80
PAo= 0.8625
Percent Agreement: 86,25%
Variable 5 - Type of content
Number of Agreements: 77
Total number of cases: 80
PAo= 0.9625
Percent Agreement: 96,25%
Variable 6 - Everyday professional -
connection to private sphere
Number of Agreements: 27
Total number of cases: 30
PAo= 0.9
Percent Agreement: 90%
Variable 7 - Political message - connec-
tion to private sphere
Number of Agreements: 16
Total number of cases: 20
PAo= 0.8
Percent Agreement: 80%

2