
Personal Business Rural International Institutional Investment
60
Personal Business Rural International Institutional Investment Insurance Share tional Institutional Investment Insurance Share Trading rading
Transcript of Personal Business Rural International Institutional Investment

Personal Business Rural International Institutional Investment Insurance Sharetional Institutional Investment Insurance Share Tradingrading
Gary Judd Q.C.
Chairman
The Directors have pleasure in presenting
the Annual Report of ASB Bank Limited
for the year ended 30 June 2002. 30 July 200230 July 2002
Hugh Burrett, Managing Director
2002 marks the fifth anniversary of the introduction by ASB Bank of Fastnet Classic, thecountry’s first Internet banking service.
Today, more than 200,000 ASB Bank customers use the Bank’s online banking services, andtransaction volumes exceed two million a month. The uptake of online banking has outpaced that of any other product, including the use of ATMs, and has totally transformedthe way New Zealanders undertake their banking.
Fastnet Classic has received international recognition for its sophisticated, yet simple to use,technology and has been rated as having the highest level of satisfaction of any Internetbanking service in the country.*
* University of Auckland Residential Customer Surveys, 2000 and 2001. AC Nielsen.consult New Zealand Online Banking Report 2002.
ASB BANK FASTNET CLASSIC
2 ASB GROUP
3 CONSOLIDATED PERFORMANCE IN BRIEF
4 BUSINESS OVERVIEW
5 HIGHLIGHTS 2002 F INANCIAL YEAR
6 PERFORMANCE OVERVIEW
8 COMMUNITY SUPPORT
9 TRIBUTE
CORPORATE GOVERNANCE
10 CORPORATE GOVERNANCE
CONTENTS
16 DIRECTORS’ RESPONSIBILITY STATEMENT
17 HISTORICAL SUMMARY OF CONSOLIDATED FINANCIAL STATEMENTS
18 STATEMENT OF FINANCIAL PERFORMANCE
19 STATEMENT OF MOVEMENTS IN EQUITY
20 STATEMENT OF FINANCIAL POSITION
21 STATEMENT OF CASH FLOWS
22 NOTES TO THE FINANCIAL STATEMENTS
51 ADDITIONAL DISCLOSURES
53 DIRECTORS’ STATEMENT
54 AUDITORS’ REPORT
PERFORMANCE REVIEW
FINANCIAL STATEMENT
55 DIRECTORY
DIRECTORY
1
ASB BANK LIMITED ANNUAL REPORT

ASB GROUP
The companies and subsidiaries under which we provide our customers with the range of
products and services they need to achieve their financial goals are collectively known as
ASB Group.
The high profile brands which operate within ASB Group include ASB Bank, BankDirect,
ASB Life, ASB Securities, Sovereign and Jacques Martin.
This annual report covers the activities of ASB Bank. The Bank and its subsidiaries represent
a major component of ASB Group.
New Managing Director Appointed
Mr Hugh Burrett was appointed Chief Executive Officer and Managing Director of ASB Bank
in October 2001.
A career banker with more than 30 years’ service with ASB Bank, Mr Burrett was previously
Chief Operating Officer responsible for the Bank’s sales and service delivery in personal,
business and rural banking.
Mr Burrett has overseen the expansion of the Bank’s branch network nationally, the extension
of the Bank’s capability into business, rural banking and financial services, and the introduction
of award winning levels of customer service.
2
ASB BANK
ASB BANK
PersonalBanking
BankDirect
BusinessBanking
RuralBanking
InstitutionalBanking
InvestmentServices
InsuranceServices
TradeFinance
Life Insurance
Superannuation
HomeLoans
AssetManagement
WealthManagement
Aegis
Online ShareTrading
DiscountBroking
Client AdvisoryService
MarginLending
ASB SECURITIES
SOVEREIGN
ASB GROUP (L IFE)
ASB GROUP

CONSOLIDATED PERFORMANCE IN BRIEF
ASB BANK LIMITED ANNUAL REPORT
For the year ended 30 June 2002 2001 2000 1999 1998
STATEMENT OF FINANCIAL PERFORMANCE ($ millions)
Interest Income 1,500.7 1,473.9 1,078.1 954.0 1,121.5
Interest Expense 992.3 1,016.5 693.6 626.4 801.8
Net Interest Earnings 508.4 457.4 384.5 327.6 319.7
Other Income 215.3 187.2 177.4 137.0 121.1
Total Operating Income 723.7 644.6 561.9 464.6 440.8
Debt Provisions Expense 18.0 13.5 11.4 12.8 10.9
Total Operating Income after Debt Provisions Expense 705.7 631.1 550.5 451.8 429.9
Total Operating Expenses 371.0 351.0 322.0 275.3 267.2
Net Surplus before Taxation 334.7 280.1 228.5 176.5 162.7
Taxation 110.0 96.7 78.4 59.6 54.8
Net Surplus after Taxation 224.7 183.4 150.1 116.9 107.9
STATEMENT OF FINANCIAL POSITION ($ millions)
Total Assets 24,249.6 20,021.7 17,179.5 14,709.9 12,896.8
Advances 19,031.9 16,173.5 14,406.6 12,460.3 10,821.4
General Provision 71.3 59.3 51.0 44.1 37.3
Specific Provisions 6.8 6.8 7.5 6.6 8.0
Total Liabilities 23,216.8 19,202.0 16,332.6 13,966.5 12,239.5
Deposits (includes Amounts Due to Other Banks) 22,680.4 18,762.8 16,074.6 13,822.0 12,077.6
SHAREHOLDER’S FUNDS ($ millions)
Shareholder’s Funds at end of year 1,032.8 819.7 846.9 743.4 657.3
Dividends Ordinary 10.0 150.0 43.8 22.7 21.0
Special – – – 5.0 –
Non-Cumulative Preference – 3.1 3.1 3.1 3.1
PERFORMANCE
Return on Ordinary Shareholder’s Funds 24.26% 22.30% 19.73% 17.50% 18.55%
Return on Total Average Assets 1.02% 0.97% 0.92% 0.82% 0.88%
Net Interest Margin / Total Average Assets 2.30% 2.46% 2.41% 2.37% 2.68%
Total Operating Expenses / Total Operating Income 51.27% 54.50% 57.62% 60.40% 61.77%
Growth in Total Assets 21.12% 16.54% 16.79% 14.06% 17.35%
New Home Lending Approvals ($ millions) 4,748.2 3,141.6 3,301.1 2,887.6 2,535.8
PRUDENTIAL
Shareholder’s Funds as a % of Total Assets 4.26% 4.09% 4.93% 5.05% 5.10%
Tier One Capital as a % of Risk Weighted Exposures 7.90% 7.25% 7.74% 7.68% 7.94%
Total Capital as a % of Total Risk Weighted Exposures 10.44% 10.07% 9.69% 8.73% 9.10%
OTHER INFORMATION
Full-time Equivalent Employees 3,050 2,937 2,747 2,723 2,594
Number of Branches 119 118 117 121 120
3

BUSINESS OVERVIEW
4
ASB Bank is a full service, nationally operating bank and financial services company.
It provides a seamless, total service that covers a comprehensive range of financial options
that can be tailored to the needs of the Bank’s 800,000 international, corporate, business,
rural and personal customers.
Personal BankingASB Bank is New Zealand’s pre-eminent personal bank, and a recognised leader in customer
service, the practical application of leading edge technology and community support.
The Bank has been at the forefront of introducing advanced interactive electronic banking
and self service, and has the widest penetration of Internet and mobile banking of any bank
in Australasia.
Long recognised as a market leader in the area of home loan finance, the Bank advanced$4.7 billion in residential loans to customers during the year. The Bank is the main financialservices provider to 17% of New Zealanders.
Direct BankingBankDirect is the ASB Bank’s ‘virtual bank brand’ with a strong focus on the direct home
lending market. Customer interaction with BankDirect is undertaken through the Internet,
self service or the telephone.
Business and Rural BankingThe Bank is a credible supplier of financial services to businesses and farmers, and its strong
capabilities make it the preferred financial partner for many leading businesses. Its point of
difference is offering innovative, flexible solutions and delivering its services through the use
of advanced, online technology.
International and Institutional BankingASB Bank specialises in those international and institutional services in which it can make a
significant contribution, especially those where advanced technologies offer customer benefits.
Treasury and electronic transactional processing are two areas where the Bank offers cost
effective, innovative solutions.
Investment ServicesThrough ASB Investments Limited, customers can invest in a range of international and domestic
managed funds and retirement savings options, and access an Investment Advisory Service.
Insurance ServicesCustomers’ insurance needs are met through a range of life, borrowers’ protection, health,
and fire and general insurance offerings, available direct or through the Bank’s Insurance
Advisory Service.
Share TradingASB Securities is an industry leading, full service share broking operation and a member of
the New Zealand Stock Exchange. Customers have the option of using a broker to undertake
trades on their behalf, or trade on the Australian and New Zealand exchanges online.
Trade FinanceThrough ASB Bank we provide importers and exporters with a range of specialist trade
finance services.
For the fourth consecutive year, ASB Bank is rated New Zealand’s No.1 major bank in terms of customer satisfaction.

HIGHLIGHTS 2002 F INANCIAL YEAR
ASB BANK LIMITED ANNUAL REPORT
5
For the third successive year the Bank increases its net surplus after tax by more
than 20% setting a new record profit of $225 million.
The Bank improves its productivity by 6%, reduces the percentage of total operating
expenses to total income to 51.3% and achieves a greater than 1% return on
assets for the first time.
The Bank opens a branch in Queenstown. ASB Bank is now represented by a branch
office in every major centre in New Zealand.
The Bank’s rural lending portfolio exceeds $2 billion. This milestone is achieved five
years ahead of projections.
In the competitive area of wealth management, funds under management exceeds
$1 billion for the first time.
For the fourth consecutive year, ASB Bank is rated New Zealand’s No.1 major bank
in terms of customer satisfaction in the highly respected Auckland University survey
of residential bank customers. It is also rated No.1 business bank for the second
consecutive year in the University’s business banking customer survey.
Rated New Zealand’s best organisation, and best practice globally, for handling
customer complaints by TMI, an international people strategy and development
organisation with offices in 35 countries.
ASB Bank introduces to New Zealand the first mobile telephone banking service,
Fastnet Mobile. The service allows customers to view on screen the service they
are accessing.
The Bank introduces a new transaction account named Streamline. The product
has particular appeal to high frequency, electronic transaction users and offers the
lowest EFTPOS transaction fees in the market.
The Bank’s "Ira Goldstein" television commercials rated Best Ad by TV1’s Fair Go
programme and voted People’s Choice in the Axis Awards.
ASB Bank introduces to New Zealand the first mobile telephone banking service, Fastnet Mobile.

P E R F O R M A N C E O V E R V I E W
b
Financial Performance
For the third consecutive year, ASB Bank lifted its audited after tax surplusby more than 20%, sustaining its growth rate well ahead of the averagefor the market.
This represents an excellent achievement in what is a competitive, localfinancial services market.
For the 12 months ending 30 June 2002, audited, after tax surplus wasa record $225 million, up 23%. This year’s performance was achievedthrough strong, across the board business growth and a sharp focus oncost management and margins.
This combination enabled the Bank to lift productivity by 6%, with thepercentage of total operating expenses to income declining to 51.3%and the Bank achieving its goal of lifting the return on assets to 1% or better.
ASB Bank’s core strength has for many years been personal banking.The combination of customer service, the innovative use of technologyto deliver leading edge products and services, and a strong commitmentto community support, has assisted the Bank to consistently improve itsmarket share.
Within this sector, the Bank has long been recognised as one of theforemost providers of home mortgage lending, and during the year the ASB Bank and BankDirect brands advanced a record $4.7 billion to assistpeople to purchase homes.
In more recent years, the Bank has extended its personal banking portfolio to include financial services such as wealth management, insurances and stockbroking activities.
In a number of these areas, ASB Bank branded products and serviceshave established themselves among the market leaders.
During the year the Bank’s personal banking division grew its assets bymore than 16% off a large base.
In association with Commonwealth Bank of Australia, ASB Bank hasbeen an active and selective participant in international and institutional banking, in addition to the provision of traditional corporateand treasury services.
During the year, corporate banking increased its assets by 45%. Both corporate banking and treasury made significant contributions tothe Bank’s overall profit performance.
Our retail foreign exchange business continued the strong growth ofrecent years across all product groups, overcoming the impacts of astrengthening New Zealand dollar and the downturn in global tourismin the second half of 2001.
6
240
220
200
180
160
140
120
100
80
60
40
20
0
m
1998 1999 2000 2001 2002
TOTAL OPERATING INCOME
800
700
600
500
400
300
200
100
0
m
1998 1999 2000 2001 2002
TOTAL ASSETS
Year ended 30 JUNE
Year ended 30 JUNE
Year ended 30 JUNE
NET SURPLUS AFTER TAX

P E R F O R M A N C E O V E R V I E W
ASB BANK LIMITED ANNUAL REPORT
Our rural banking assets increased by 29% during the year and businessbanking assets grew at the more modest rate of 5%.
In the last decade ASB Bank has become one of the country’s majorrural banks, and during the year the level of advances exceeded the $2 billion milestone. The Bank achieved this target five-years ahead ofits projected date.
Non Financial Performance
To the Bank, of equal importance to financial results is its performancein the critical areas of customer service and product innovation.
The Bank has internal performance criteria against which it measurescustomer service on an ongoing basis. It also seeks to benchmark itsperformance externally against other New Zealand and international banks.
The most widely accepted measure of bank customer service in New Zealand is a survey conducted annually by the University ofAuckland. In the 2002 survey ASB Bank was rated number one majorbank for customer satisfaction for residential customers. This is thefourth consecutive year ASB Bank has achieved this ranking.
The Bank was also rated best business bank in the University’s businessbanking survey for the second consecutive year.
The Bank’s customer complaints management processes were also recognised as best in New Zealand, and best practice globally, during the year by the international people strategy and development organisation TMI.
ASB Bank has long been in the forefront of being the first to bring tomarket new products and services.
During the year the Bank introduced a new low cost, transactionaccount for customers who are frequent users of automated devices.Called Streamline, the account set a new industry benchmark for transaction fees and has been strongly supported by existing and new customers.
The Bank also extended the service capabilities of its telephone bankingservices with the introduction of Fastnet Mobile. This service enablesmobile telephone users to view on screen the banking service they areundertaking. This linking of telephone banking to mobiles is only thefirst step of what will, over time, become an extensive range of screenbased services.
7
bADVANCES
bDEPOSITS
b
HOME LOAN LENDING ADVANCED
Year ended 30 JUNE
Year ended 30 JUNE
Year ended 30 JUNE

C O M M U N I T Y S U P P O R T
Nationwide
Team New Zealand
Operation Marlin – (Police boats and safeboating campaign around America’s Cup Regatta)
ASB BANK Classic (Women’sInternational Tennis Tournament)
Ellerslie Flower Show
Post Graduate Medical Committee(ASB Bank Visiting Professor)
Starship Children’s Health
The New Zealand Breast CancerFoundation
Variety Club
Auckland
ASB BANK/Auckland Primary Schools Principals Association Travelling Fellowship
ASB BANK College Sport
ASB BANK Festival (Auckland Secondary Schools’ Maori and Pacific Islands Cultural Festival)
ASB BANK Lounge (North Harbour Stadium)
ASB Stadium
ASB Bank Stand at Eden Park(ASB Lounge)
ASB BANK Tennis Centre
Auckland Netball
Auckland Rugby Football Union
Auckland Tennis
Auckland Theatre Company
City Mission Christmas Party
Counties Manukau RugbyFootball Union.
Hobson Wharf Information Centre
MRX Yachts
Netball North Harbour
Netball Waitakere
North Harbour Rugby
North Harbour Rugby Referees Association
The Edge Explorer Programme and Youth Arts Festival
Northland
Northland Rugby Football Union
Sport Northland
Central North Island
Hamilton City Netball Centre
NZ Ironman (Taupo)
Sport Bay of Plenty
Taranaki Rugby Union
Hawkes Bay
Hawkes Bay MultiSport Club
Sport Hawkes Bay
Wellington
Downstage Theatre
Wellington Netball
Wellington Tennis
Upper South Island
ASB BANK Nelson Giants (Basketball Team)
Christchurch
ASB BANK Starry Nights
Canterbury Tennis
Lower South Canterbury
Tennis South Canterbury
Otago
ASB BANK Starry Eyed
Otago Rugby Union
Southland
Netball Southland
Community support is a major element of ASB Bank’s heritage and we
maintain a strong community presence. During the year ASB Bank joined
Team New Zealand as the exclusive supplier of banking services to the team.
We wish the team well for their defence of the America’s Cup.
8

Tribute To Staff Member John Vaughan
On 15 May 2002, Mangere Bridge staff member John Vaughan was shot during anarmed robbery and died of his wounds. John was the second victim of a random killerand acted bravely to protect his colleagues during the robbery.
John’s family, ASB Bank, his colleagues, friends and the Mangere Bridge communityhave all been deeply affected by his tragic and unnecessary death, and in our own wayswe have marked his life and what he meant to us.
ASB Bank has established the John Vaughan Memorial Scholarships, awards designedto assist the children of ASB Bank staff members as they transition from youth to adulthood. John’s only child, a young son, will receive one of these scholarships whenthe time is right.
The Bank also made the commitment to continue to serve the Mangere Bridge community, and after remodeling the branch reopened its doors for business on 5 August 2002.
T R I B U T E
9
ASB BANK LIMITED ANNUAL REPORT

1 0
CORPORATE GOVERNANCE

C O R P O R AT E G O V E R N A N C E
11
Corporate governance is a subject that has come sharply into focus as the result of somespectacular collapses of corporations in the USA and in Australia, and as a result of concern being expressed in relation to the validity of reported results by some companies.
The Board of ASB Bank has consistently placed great importance on the governance ofthe Bank. There are two elements to the governance of corporations: performance andconformance. Both are important but it is critical that focus on the latter does notcrowd out attention to the principal function of an enterprise, which is to generaterewards for shareholders who invest their capital, provide goods and services of valueto customers, and provide meaningful employment for employees, and to do so in away that contributes to the welfare of the community.
The Bank has for some years carried out an annual review of the Board’s performance, andof its policies and practices. These reviews have sought to identify where improvementscan be made, and have also assessed the quality and effectiveness of information madeavailable to Directors.
Some of the principal features of the Bank’s corporate governance are:
■ The Audit Committee consists only of non-Executive Directors. This has been theestablished position for some time.
■ The CEO does not participate in deliberations of the Executive Appointments andRemuneration Committee when matters could affect his position.
■ There is an established criteria for the appointment of new Directors and external consultants are always engaged in the search for new independent Directors.
■ The non-Executive Directors meet at least annually without management present. This is in addition to the consideration of the Chief Executive Officer’sperformance and remuneration, which is conducted in the absence of the CEO.
■ One-third of the Directors (other than the Managing Director) must retire fromoffice at each annual meeting. A retiring Director is eligible for re-election.
■ In terms of Section 74 of the Reserve Bank of New Zealand Act 1989, the conditions of registration for the Bank include:- the Board must have at least two independent Directors;
- the Chairperson must not be an employee of the Bank;
- The Bank’s Directors are not permitted to act in the interest of a holding company, where to do so would conflict with the interests of the Bank, to thedetriment of creditors.
The Bank complies with these requirements.
■ Directors participate in an induction programme upon appointment and in refresherprogrammes on a regular basis. Directors are also regularly updated in theirknowledge of issues, trends and challenges relevant to the Bank, the financialservices industry and the economy.
■ Non-Executive Directors do not participate in any of the Bank’s incentive plans.The philosophy underlying the approach to corporate governance is consistentwith the ethical standards required of all employees of the Bank.
Committees of the Board
The Board has delegated specific powers and responsibilities to a number of Board andmanagement committees. Key decisions made by management committees are alwaysrecommended to the Board for approval.
There are three permanent Board committees, other committees being formed to carry outspecific delegated tasks when required. A non-executive Director chairs each committee.
ASB BANK LIMITED ANNUAL REPORT
C O R P O R AT E G O V E R N A N C E
12
Audit Committee
The Audit Committee assists the Board in carrying out its responsibilities under theCompanies Act 1993 and the Financial Reporting Act 1993 with respect to managementaccounting practices, policies and controls relative to the Group’s financial position.
Members of the Audit Committee are Messrs J.M.R. Syme (Chairman), R. Boven, P.A.Edwards and Dr J.A. Hood.
The Charter of the Audit Committee incorporates a number of policies and practices toensure that the Committee is independent and effective. Among these are:
■ The Audit Committee consists entirely of non-Executive Directors, all of whomhave familiarity with financial management, accounting and reporting. The Chairmanof the Audit Committee is not the Chairman of the Bank.
■ At least twice a year the Audit Committee meets the external Auditors and theGroup Internal Auditor independently of management.
■ The Audit Committee is responsible for recommending the external Auditor tothe Board for appointment by the shareholder. The Audit Committee approvesthe terms of the contract with the external Auditor, agrees the annual audit planand approves payments to the Auditor.
■ The Audit Committee discusses and receives assurances from the external Auditorson the quality of the Bank’s systems, its accounting processes and its financialresults. It also receives a report from the Auditors on any significant matters raised bythe Auditors with management.
■ All material accounting matters requiring exercise of judgment by managementare specifically reviewed by the Audit Committee and reported on by the Committeeto the Board.
■ Certified assurances are received by the Audit Committee and the Board that theAuditors meet the independence requirements as recommended by the Blue Ribbon Committee of the SEC of the USA.
■ The Board has in place policies governing the nature of non-audit work which cannot be undertaken by the Bank’s Auditors for the Bank or its subsidiaries. There arealso procedures in place governing approval of any other non-audit work beforethat work can be carried out. The objective of these approvals is to avoid prejudicingthe independence of the Auditors and to prevent their developing undue relianceon revenue from the Bank. The policy ensures that the Auditor does not- Assume the role of management;- Become an advocate for their own client; or- Audit their own professional expertise.
Under the policy, the Auditor will not provide the following services:
■ Bookkeeping or services relating to accounting records■ Appraisal or valuation and fairness opinions■ Advice on deal structuring and related documentation■ Tax planning and strategic advice■ Actuarial advisory services■ Executive recruitment or extensive human resource functions■ Acting as broker-dealer, promoter or underwriter, or■ Provision of legal services.■ The Bank’s external Auditor carries out audits across the Commonwealth Bank of
Australia (CBA) Group of companies, including ASB Bank. CBA currently requiresthat the partner managing the audit for the external Auditor be changed withina period of five years.
The Bank is already materially in compliance with the framework of the legislationrecently enacted as the Sarbanes-Oxley Act in the USA. This is largely reflective of thefact that corporate governance in Australia and New Zealand had generally alreadymoved ahead of that in many corporations in the USA.

Risk Committee
The responsibilities of the Risk Committee encompass the management and monitoringof credit, market and operational risk.
Members of the Risk Committee are Messrs R. Boven (Chairman), G. H. Burrett,L. G. Cupper, G. L. Mackrell and J. M. R. Syme.
In respect of credit risk, the Committee ensures that the Bank maintains credit underwritingstandards designed to achieve portfolio outcomes consistent with the Bank’s risk/returnexpectations; reviews the Bank’s credit portfolios according to established parametersincluding concentration, duration, and expected returns and losses; approves the overallstructure of delegated credit approval authorities to management and individual creditsin excess of such delegations; and recommends to the Board the bad and doubtful debtprovisioning amounts each half year.
The Risk Committee also reviews market, funding and liquidity risks and monitors exposures relative to approved management authorities. New areas of market riskexposure are reviewed by the Committee, with appropriate management proceduresbeing approved.
Operational risk identification, management and measurement practices and proceduresare also reviewed by this Committee.
Executive Appointments & Remuneration Committee
The Executive Appointments & Remuneration Committee makes recommendations tothe Board concerning the appointment and remuneration of the Executive ManagementCommittee.
Members of the Executive Appointments & Remuneration Committee are Messrs G. J. Judd (Chairman), G. H. Burrett, L. G. Cupper and G. L. Mackrell.
Executive appointments and remuneration is another aspect of corporate governanceon which there is much focus currently. Remuneration for the Bank’s Executives isdetermined, after taking advice, to ensure competitive remuneration packages are inplace to attract and retain competent and high-calibre staff.
Incentive payments for Executives are related to performance and depend on the extentto which operating targets set at the beginning of the financial year are achieved.
C O R P O R AT E G O V E R N A N C E
13
ASB BANK LIMITED ANNUAL REPORT

Directors’ and Officers’ Liability InsuranceASB Bank has effected liability insurance for the Directors and officers of the Bank andits subsidiaries.
Items Excluded by Shareholder AgreementThe following information specified in Section 211 of the Companies Act 1993 has notbeen included in the Annual Report following agreement to its non-inclusion by ASB Bank’sordinary shareholder.
■ Particulars of entries in the Directors’ interests register.■ Total remuneration received by each Director or former Director during the accounting
period. Remuneration received by highly paid employees during the accounting period.■ The total amount of donations made by the Company and any subsidiary during
the accounting period.
Changes to Group BusinessThere have been no material changes during the financial year in the nature of theCompany’s business, or in the Company’s subsidiaries, or in the classes of business in whichthe Company has an interest, whether as a member of another company or otherwise.
AuditorsErnst & Young were re-appointed as the Bank’s Auditors on 23 October 2001.
Changes in Accounting PoliciesThere have been no material changes in accounting policies. All policies have beenapplied on a basis consistent with those in the previous year.
14
C O R P O R AT E G O V E R N A N C E

FINANCIAL STATEMENTSINCORPORATING GENERAL DISCLOSURE STATEMENT
FOR THE YEAR ENDED 30 JUNE 2002
15
ASB BANK LIMITED ANNUAL REPORT

The Directors are required by the Financial Reporting Act 1993 to prepare financial statements for the accounting period which comply with Generally Accepted AccountingPractice (GAAP) and provide such additional information as required to present a trueand fair view of the financial affairs of the Company and Group.
The Directors are required by the Companies Act 1993 to ensure that proper accountingrecords have been kept, which enable with reasonable accuracy, the determination ofthe financial position of the Company and Group.
The Directors have a general responsibility for taking such steps as are reasonably opento them to safeguard the assets of the Company and Group and to prevent and detect fraud and other irregularities.
The Directors have pleasure in presenting the financial statements and general disclosuresof ASB Bank Limited for the year ended 30 June 2002.
For, and on behalf of, the Board of Directors, which authorised the issue of the financialreport on 30 July 2002.
G.J. Judd Q.C. G.H. BurrettChairman Managing Director
30 July 2002
DIRECTORS’ RESPONSIBILITY STATEMENT
FINANCIAL STATEMENTSINCORPORATING GENERAL DISCLOSURE STATEMENT
FOR THE YEAR ENDED 30 JUNE 2002
16

Audited Audited Audited Audited Audited
$ millions 2002 2001 2000 1999 1998
STATEMENT OF FINANCIAL PERFORMANCE
Interest Income 1,500.7 1,473.9 1,078.1 954.0 1,121.5
Interest Expense 992.3 1,016.5 693.6 626.4 801.8
Net Interest Earnings 508.4 457.4 384.5 327.6 319.7
Other Income 215.3 187.2 177.4 137.0 121.1
Total Operating Income 723.7 644.6 561.9 464.6 440.8
Debt Provisions Expense 18.0 13.5 11.4 12.8 10.9
Total Operating Income after Debt Provisions 705.7 631.1 550.5 451.8 429.9
Total Operating Expenses 371.0 351.0 322.0 275.3 267.2
Net Surplus before Taxation 334.7 280.1 228.5 176.5 162.7
Taxation 110.0 96.7 78.4 59.6 54.8
Net Surplus after Taxation 224.7 183.4 150.1 116.9 107.9
Ordinary Dividends 10.0 150.0 43.8 22.7 21.0
Special Dividends – – – 5.0 –
Non-Cumulative Preference Dividends – 3.1 3.1 3.1 3.1
Surplus Retained 214.7 30.3 103.2 86.1 83.8
STATEMENT OF FINANCIAL POSITION
Total Assets 24,249.6 20,021.7 17,179.5 14,709.9 12,896.8
Impaired Assets 35.2 31.2 16.2 31.2 24.4
Total Liabilities 23,216.8 19,202.0 16,332.6 13,966.5 12,239.5
Total Shareholder’s Equity 1,032.8 819.7 846.9 743.4 657.3
HISTORICAL SUMMARY OF CONSOLIDATED FINANCIAL STATEMENTS
For the year ended 30 June 2002
17
ASB BANK LIMITED ANNUAL REPORT

Consolidated Parent
$ millions Note 2002 2001 2002 2001
Interest Income 2 1,500.7 1,473.9 1,374.7 1,418.1
Interest Expense 3 992.3 1,016.5 988.9 1,010.8
Net Interest Earnings 508.4 457.4 385.8 407.3
Other Income 5 215.3 187.2 255.3 189.2
Total Operating Income 723.7 644.6 641.1 596.5
Debt Provisions Expense 14 18.0 13.5 12.7 12.7
Total Operating Income after Debt Provisions 705.7 631.1 628.4 583.8
Total Operating Expenses 6 371.0 351.0 373.9 341.0
Salaries and Other Staff Expenses 182.5 164.2 178.3 161.2
Building Occupancy Expenses 51.4 50.2 44.8 43.0
Equipment Expenses 23.3 22.7 23.2 22.5
Information Technology Expenses 40.0 40.0 38.6 37.9
Other Expenses 73.8 73.9 89.0 76.4
Net Surplus before Taxation 334.7 280.1 254.5 242.8
Taxation 8 110.0 96.7 57.0 67.7
Net Surplus after Taxation 224.7 183.4 197.5 175.1
These statements are to be read in conjunction with the notes on pages 22 to 50 and the Auditors’ Report on page 54.
STATEMENT OF FINANCIAL PERFORMANCE
18
For the year ended 30 June 2002

STATEMENT OF MOVEMENTS IN EQUITY
For the year ended 30 June 2002 ASB BANK LIMITED ANNUAL REPORT
Consolidated Parent
$ millions Note 2002 2001 2002 2001
Total Shareholder’s Equity at Beginning of Year 819.7 846.9 788.6 816.6
Net Surplus after Taxation 224.7 183.4 197.5 175.1
(Devaluations) 25 (1.6) (7.5) (0.4) –
Repayment of Preference Share Capital – (50.0) – (50.0)
Less:
Ordinary Dividends 10.0 150.0 10.0 150.0
Non-Cumulative Preference Dividends – 3.1 – 3.1
Total Dividends 9 & 26 10.0 153.1 10.0 153.1
Total Shareholder’s Equity at End of Year 1,032.8 819.7 975.7 788.6
These statements are to be read in conjunction with the notes on pages 22 to 50 and the Auditors’ Report on page 54.19

STATEMENT OF FINANCIAL POSITION
20
Consolidated Parent
$ millions Note 2002 2001 2002 2001
ASSETS
Cash and Liquid Assets 10 105.7 46.9 105.7 47.0
Due from Other Banks 11 2,495.8 831.0 1,511.0 217.9
Investment Securities 12 484.0 154.8 – –
Other Securities 12 1,897.9 2,612.6 1,897.9 2,612.6
Advances 13 19,031.9 16,173.5 17,438.0 15,026.8
24,015.3 19,818.8 20,952.6 17,904.3
Less: General Provision for Bad and Doubtful Debts 14 71.3 59.3 65.3 57.9
23,944.0 19,759.5 20,887.3 17,846.4
Due from Associates and Subsidiaries 15 – 1.7 1,666.0 1,246.5
Investments in Associates and Subsidiaries 16 0.1 4.5 1,429.1 720.0
Property, Plant and Equipment 17 200.5 195.0 118.8 108.8
Other Assets 18 97.9 49.9 45.0 37.1
Deferred Taxation Benefit 19 7.1 11.1 8.4 13.1
Total Assets 24,249.6 20,021.7 24,154.6 19,971.9
Total Interest Earning and Discount Bearing Assets 23,910.4 19,772.3 22,494.6 19,088.6
Financed by:
LIABILITIES
Deposits and Other Borrowings
Deposits 20 18,263.2 17,618.9 18,211.1 17,371.9
Due to Other Banks 21 4,417.2 1,143.9 4,405.0 1,143.9
Other Liabilities
Due to Associates and Subsidiaries – – 70.0 252.3
Other Current Liabilities 22 281.2 188.3 237.6 164.3
22,961.6 18,951.1 22,923.7 18,932.4
Subordinated Debt 23 255.2 250.9 255.2 250.9
Total Liabilities 23,216.8 19,202.0 23,178.9 19,183.3
SHAREHOLDER’S EQUITY
Contributed Capital – Ordinary Shareholder 24 323.1 323.1 323.1 323.1
Asset Revaluation Reserves 25 4.7 6.3 10.9 11.3
Accumulated Surplus 26 705.0 490.3 641.7 454.2
Total Shareholder’s Equity 1,032.8 819.7 975.7 788.6
Total Liabilities and Shareholder’s Equity 24,249.6 20,021.7 24,154.6 19,971.9
Total Interest and Discount Bearing Liabilities 22,008.9 18,221.9 21,954.9 18,172.2
These statements are to be read in conjunction with the notes on pages 22 to 50 and the Auditors’ Report on page 54.
For the year ended 30 June 2002

STATEMENT OF CASH FLOWS
For the year ended 30 June 2002 ASB BANK LIMITED ANNUAL REPORT
21
Consolidated Parent
$ millions Note 2002 2001 2002 2001
CASH FLOWS FROM OPERATING ACTIVITIES
Cash was provided from:
Interest Received 1,451.4 1,442.4 1,374.7 1,420.0
Other Income Received 208.5 199.6 257.2 186.3
1,659.9 1,642.0 1,631.9 1,606.3
Cash was applied to:
Interest Paid 940.8 993.8 936.8 986.6
Operating Expenditure 330.8 304.8 342.0 302.9
Net Taxation Paid 29.4 42.9 15.7 42.2
Payments to Related Parties for Loss Offsets 45.6 27.5 39.7 28.3
1,346.6 1,369.0 1,334.2 1,360.0
Net Cash Flows from Operating Activities 27 313.3 273.0 297.7 246.3
CASH FLOWS FROM INVESTING ACTIVITIES
Cash was provided from:
Sale of Property, Plant and Equipment 0.2 8.0 0.2 8.0
Net Decrease / (Increase) in Securities 361.2 (586.9) 690.4 (619.3)
Due from / (to) Associates and Subsidiaries 1.7 (5.1) (1,132.9) (963.6)
Sale of Shares in Associates and Subsidiaries 7.4 – 7.4 –
370.5 (584.0) (434.9) (1,574.9)
Cash was applied to:
Net Increase / (Decrease) in:
Due from Other Banks (Term) 1,716.9 493.0 1,343.7 (107.0)
Advances 2,869.2 1,775.7 2,421.1 1,359.5
Due to Associates and Subsidiaries – – 182.4 545.7
Purchase of Property, Plant and Equipment 37.7 30.9 36.8 29.3
4,623.8 2,299.6 3,984.0 1,827.5
Net Cash Flows from Investing Activities (4,253.3) (2,883.6) (4,418.9) (3,402.4)
CASH FLOWS FROM FINANCING ACTIVITIES
Cash was provided from:
Net Increase / (Decrease) in:
Deposits 683.3 3,690.5 878.2 4,242.5
Due to Other Banks (Term) 3,703.1 (1,219.2) 3,690.9 (1,219.2)
Subordinated Debt – 150.0 – 150.0
4,386.4 2,621.3 4,569.1 3,173.3
Cash was applied to:
Dividends Paid 10.0 153.1 10.0 153.1
Repayment of Preference Share Capital – 50.0 – 50.0
10.0 203.1 10.0 203.1
Net Cash Flows from Financing Activities 4,376.4 2,418.2 4,559.1 2,970.2
SUMMARY OF MOVEMENTS IN CASH FLOWS
Net Increase / (Decrease) in Cash and Cash Equivalents 436.4 (192.4) 437.9 (185.9)
Add: Cash and Cash Equivalents at Beginning of Year (359.7) (167.3) (372.8) (186.9)
Cash and Cash Equivalents at End of Year 28 76.7 (359.7) 65.1 (372.8)
These statements are to be read in conjunction with the notes on pages 22 to 50 and the Auditors’ Report on page 54.

NOTES TO THE FINANCIAL STATEMENTS
For the year ended 30 June 2002
22
1. STATEMENT OF ACCOUNTING POLICIES
GENERAL ACCOUNTING POLICIES
These financial statements have been drawn up in accordance with the requirements of the Companies Act 1993, the Financial Reporting Act1993, and the Registered Bank Disclosure Statement (Full and Half-Year – New Zealand Incorporated Registered Banks) Order 1998.The reporting entity is ASB Bank Limited and its subsidiaries (”the Banking Group”). ASB Bank Limited (”the Bank”) is registered under theCompanies Act 1993.
The measurement base adopted is that of historical cost as modified by the revaluation of certain Property, Plant and Equipment and financialinstruments, as identified below.
PARTICULAR ACCOUNTING POLICIES
(a) Basis of Consolidation
Assets, liabilities, and operating results of subsidiaries are included in the consolidated financial statements on the basis of financial statementsmade up to balance date, using the purchase method. All material intercompany balances and transactions have been eliminated.
The results of associate companies are not equity accounted for, as their net surpluses are rebated to shareholders.
(b) Income Recognition
Interest Income is recognised on an accrual basis, either daily or on a yield to maturity basis. Early repayment interest adjustments are matchedagainst the cost of relevant hedging positions. All material fee income is recognised in the Statement of Financial Performance when theservice is provided to the customer.
Amortisation of premiums and discounts on financial assets and liabilities are included in net interest earnings. Market value adjustments areincluded in Other Income.
(c) Expense Recognition
All material expenses are recognised in the Statement of Financial Performance on an accrual basis, including interest expense either daily oron a yield to maturity basis.
(d) Advances
Advances cover all forms of lending to customers including mortgages, overdrafts, personal loans and credit card balances. Advances whichare processed in the Bank’s Treasury Department are recognised in the Statement of Financial Position at their fair value, less accrued interest,which is included in Interest Receivable Accrued. All other advances are recognised in the Statement of Financial Position at their outstandingprincipal balances.
(e) Investment Securities
Investment Securities are public and other debt securities which were purchased with the intention of holding them for the long term or until maturity.Bond securities are recognised at cost, adjusted for the amortisation of premiums and discounts.Interest income and discounts on other Investment Securities are recognised on an accrual basis.Gains or losses due to changes in market value are only recognised in the Statement of Financial Performance if an Investment Security is sold.
(f) Other Securities
Other Securities are public and other debt securities, which were purchased without the intention of holding them until maturity. Suchsecurities are recognised at their fair value, with unrealised gains or losses in respect of market value adjustments being recognisedimmediately in the Statement of Financial Performance.
(g) Repurchase and Reverse Repurchase Agreements
Securities sold under agreements to repurchase are retained within the relevant security portfolio and accounted for accordingly.The obligation to repurchase is recorded as a deposit. The difference between the sale and repurchase price represents interest expense andis recognised in the Statement of Financial Performance over the term of the repurchase agreement. Securities held under reverse repurchaseagreements are recorded as Interest Earning Assets. The difference between the purchase and sale price represents Interest Income and isrecognised in the Statement of Financial Performance over the term of the reverse repurchase agreement.
(h) Due to/from Other Banks
Due to/from Other Banks are categories defined by the nature of the counterparty. Assets and liabilities within this category are generallyrecognised at their fair value reflecting the nature of the asset or liability.
(i) Asset Quality
Impaired Assets consists of non-accrual assets and restructured assets.
A non-accrual asset is any asset for which the Bank will not be able to collect all amounts owing in accordance with the terms of the contractwith the counterparty.
A restructured asset is any asset which is not a non-accrual asset and for which:
(a) the original terms have been changed to grant the counterparty a concession that would not otherwise have been available, due to thecounterparty’s difficulties in complying with the original terms; and
(b) the revised terms of the facility are not comparable with the terms of new facilities with comparable risks; and
(c) the yield on the asset following restructuring is equal to, or greater than, the Bank’s average cost of funds, or that a loss is not otherwiseexpected to be incurred.
For the year ended 30 June 2002

NOTES TO THE FINANCIAL STATEMENTS
For the year ended 30 June 2002 ASB BANK LIMITED ANNUAL REPORT
23
Specific Provisions are made and recognised against impaired assets, where full recovery of principal and interest is not considered probable.Interest on these assets is accounted for on a cash basis. All receipts are attributed to outstanding interest before being recognised asrepayment of principal.
Incorporated in the Specific Provisions are bulk provisions made against statistically managed portfolios.
A General Provision for Bad and Doubtful Debts is maintained to cover unidentified possible losses and latent risks inherent in the overallportfolio of advances and other lending transactions. This is assessed having regard to the level of risk weighted credit exposure of on andoff balance sheet assets and a range of other criteria.
Bad debts specifically provided for and recoveries of the same are written off against Specific Provisions, whilst bad debts not specificallyprovided for and recoveries of the same, are written off through the General Provision. Amounts required to bring the Provisions to theirassessed levels are recognised in the Statement of Financial Performance.
(j) Investments in Subsidiaries and Associates
Investments in Subsidiaries and Associates are recognised in the Statement of Financial Position at cost.
(k) Property, Plant and Equipment
Property, Plant and Equipment other than Land and Buildings are recognised in the Statement of Financial Position at cost less AccumulatedDepreciation.
Land and Buildings are valued to reflect current use. The valuations are carried out by independent registered valuers in May of each year forall major buildings, and cyclically over three years for all others. The valuers are all Associate Members of the New Zealand Institute of Valuersand the major valuers are Jones Lang LaSalle Advisory Limited (Auckland), Perry Heavey & Company Limited (Auckland) and Robisons(Whangarei). In light of prevailing economic conditions, the Directors have adopted a valuation at or below the independent valuation andthe properties are recognised in the Statement of Financial Position at those values with subsequent additions at cost.
Changes in valuations are transferred directly to Asset Revaluation Reserves. Where such a transfer results in a debit balance in the AssetRevaluation Reserves the deficit is transferred direct to the Statement of Financial Performance, and any subsequent revaluation gains arewritten back through the Statement of Financial Performance to the extent of past deficits written off.
The cost or revalued amount of Property, Plant and Equipment (excluding land) less the estimated residual value is depreciated over theireconomic lives on a straight line basis. The range of economic lives of the major assets are:
Buildings 25–100 years
Furniture and Fittings 5–25 years
Other Property, Plant and Equipment 2–25 years
Computer Equipment, Software and Office Equipment 3–10 years
(l) Deposits
Deposits cover all forms of funding from customers including transactional and savings accounts, term deposits, certificates of deposit, andcredit balances on cards. Certificates of deposit are recognised at their fair value. Deposits that are processed in the Bank’s TreasuryDepartment are recognised in the Statement of Financial Position at their fair value less accrued interest, which is included in Interest PayableAccrued. All other deposits are recognised at their outstanding principal balances.
(m) Subordinated Debt
Subordinated Debt is recognised in the Statement of Financial Position at principal plus accrued interest, as both components are subordinateto other liabilities.
(n) Foreign Currencies
All foreign currency monetary assets and liabilities are converted at the rates of exchange ruling as at balance date. Foreign currency forward,futures, swaps and option positions are valued at the appropriate market rates applying at balance date. Unrealised gains and losses arisingfrom these revaluations are recognised immediately in the Statement of Financial Performance.
(o) Taxation
Provision is made for taxation after taking advantage of all allowable deductions under current taxation legislation.
The liability method (comprehensive basis) of accounting for the taxation effect of timing differences between the accounting treatment andtaxation treatment of certain items, has been adopted.
Deferred Future Taxation Benefits are only recognised in the Statement of Financial Position where there is virtual certainty that the benefitwill be utilised.
(p) Interest Rate Contracts
Interest Rate Futures, options and Forward Rate Agreements are used as part of the Banking Group’s trading activities and are also used tohedge certain assets and liabilities, commitments and anticipated transactions. Gains and losses on interest rate contracts related to tradingactivities are recognised immediately in the Statement of Financial Performance. Gains and losses related to contracts that are designated andare effective as hedges are generally deferred and recognised in the Statement of Financial Performance over the expected remaining life ofthe hedged item.
(q) Interest Rate Swaps
Interest Rate Swaps entered into for purposes other than trading have the principal objective of managing balance sheet risk. To be effectiveas hedges, the derivatives are identified and allocated against the underlying instrument and generally modify the total exposure on thatposition. Such derivative financial instruments are purchased with the intent of being held to maturity. Derivatives that are designated andeffective as hedges are accounted for on the same basis as the instruments they are hedging.

NOTES TO THE FINANCIAL STATEMENTS
For the year ended 30 June 2002
24
(r) Financial Instruments
BASIS OF RECOGNITION
Assets and liabilities arising from the revaluation or accrual of interest on off balance sheet items are recognised in the Statement ofFinancial Position.
Information on the face value and credit equivalents of off balance sheet items is given in notes 32, 37, 38 and 45.
The basis for recognising all other financial instruments is covered in individual notes to these financial statements.
Fair Value
Where available, quoted market prices are used as a measure of fair value. However, for some of the Bank’s financial instruments, quotedmarket prices do not exist. Where this is the case, fair values are estimated using present value or other market accepted valuation techniques.
The methodologies and assumptions adopted are based on the terms and risk characteristics of the various financial instruments and includethe following:
Cash and Liquid Assets
These assets are short term in nature and the related carrying value is equivalent to their fair value.
Investment Securities
For Investment Securities, the estimated fair value is based on quoted market prices.
Other Securities
For Other Securities, the estimated fair value recognised in the Statement of Financial Position is based on quoted market prices, which is alsoequivalent to their carrying value.
Advances
For floating rate Advances, the carrying amount in the Statement of Financial Position is considered a reasonable estimate of their fair valueafter making allowances for the fair value of non-accrual and potential problem loans. For fixed rate Advances, fair value has been estimatedusing discounted cash flow models based on the interest rate repricing of the Advances. The discount rates applied in this calculation werebased on current market interest rates for Advances with similar credit and maturity profiles.
Due to/from Associates and Subsidiaries
For Advances and Amounts Due to/from Associates and Subsidiaries, the carrying amounts in the Statement of Financial Position are areasonable estimate of fair value.
Deposits and Other Liabilities
For non-interest bearing debt, call and variable rate Deposits, the carrying amounts in the Statement of Financial Position are a reasonableestimate of their fair value. For other term Deposits, fair value was estimated using discounted cash flow models based on the maturity of theDeposits. The discount rates applied in these calculations were based on current market interest rates for similar Deposits with similar maturityprofiles. For all other liabilities, the carrying amount in the Statement of Financial Position is a reasonable estimate of their fair value.
Subordinated Debt
For Subordinated Debt, the estimated fair value is based on quoted market rates of publicly traded securities of similar maturity.
Off Balance Sheet Items
For those off balance sheet items such as Direct Credit Substitutes (including acceptance and endorsement of Bills of Exchange), Trade andPerformance Related Items and Commitments, no secondary market exists and it is therefore, not practical to obtain fair values for thoseinstruments. These items have therefore been excluded from fair value calculations. The fair values of Foreign Exchange and Interest RateContracts were obtained from quoted market prices, discounted cash flow models or option pricing models as appropriate.
(s) Statement of Cash Flows
This has been prepared using the direct approach modified by the netting of the cash flows associated with Securities, Due to and from OtherBanks, Advances, Deposits and amounts Due to / from Associates and Subsidiaries. This method provides more meaningful disclosure as manyof the cash flows are on behalf of the Bank’s customers and do not reflect the activities of the Bank. Cash and cash equivalents consist ofcash and liquid assets used in the day-to-day cash management of the Bank.
CHANGES IN ACCOUNTING POLICIES
There have been no material changes in accounting policies. All policies have been applied on a basis consistent with that used in theprior year.
COMPARATIVE DATA
The Interest cost inherent in Foreign Exchange Contracts has been reported on a net basis in Interest Expense. The Credit Exposure GuaranteeFee previously included in Interest Expense is now included in Interest Income. Accrued Interest Receivable and Payable on Interest Rate Swapsis now reported on a net basis in Other Current Liabilities where a legal right of set-off exists.
Certain comparative figures for the year ended 30 June 2001 have been reclassified to conform with the current year’s presentation.

NOTES TO THE FINANCIAL STATEMENTS
For the year ended 30 June 2002 ASB BANK LIMITED ANNUAL REPORT
25
Consolidated Parent
$ millions 2002 2001 2002 2001
2. INTEREST INCOME
Advances 1,347.7 1,290.2 1,191.0 1,194.6
Investment Securities 36.7 20.2 – –
Other Securities 113.1 162.8 118.0 162.8
Associates and Subsidiaries – 0.1 62.5 60.0
Other 3.2 0.6 3.2 0.7
Total Interest Income 1,500.7 1,473.9 1,374.7 1,418.1
New Zealand Government and
Local Authority Securities Income (included above) 8.4 12.9 8.4 12.9
Interest Income on Advances includes interest earned on Impaired Assets of $2.0m for consolidated (30 June 2001 $1.7m) and $1.7m forparent (30 June 2001 $1.5m).
Consolidated
Within Investment Securities (refer note 12), deposits have been set-off against interest bearing debentures. Accordingly, for the year ended30 June 2002 the Interest Expense of $35.9m (30 June 2001 $33.5m) on those deposits (7.20% p.a.) (30 June 2001 7.20% p.a.) has beenset-off against the debenture interest, inclusive of imputation credits of $53.6m (30 June 2001 $53.6m) (8.74% p.a. inclusive of imputationcredits) (30 June 2001 8.74% p.a. inclusive of imputation credits). This results in net interest earnings of $17.7m (30 June 2001 $20.2m) andis included in Investment Securities above of $36.7m (30 June 2001 $20.2m).
Parent
In Due from Associates and Subsidiaries (refer note 15), deposits have been set-off against redeemable preference shares. Accordingly, for theyear ended 30 June 2002 the Interest Expense of $35.9m (30 June 2001 $33.5m) on these deposits (7.29% p.a.) (30 June 2001 7.29% p.a.)has been set-off against the redeemable preference share dividend income of $35.7m (30 June 2001 $35.9m) (8.74% p.a. inclusive ofimputation credits) (30 June 2001 8.74% p.a. inclusive of imputation credits). This results in net interest earnings of ($0.2m) (30 June 2001$2.4m) being included in interest from Associates and Subsidiaries.
3. INTEREST EXPENSE
Certificates of Deposit and Issued Paper 106.7 161.9 100.4 124.2
Retail Term Deposits 315.8 325.3 315.8 325.3
Other Deposits Bearing Interest 552.4 515.0 551.2 512.4
Associates and Subsidiaries – – 4.1 34.6
Subordinated Debt 17.4 14.3 17.4 14.3
Total Interest Expense 992.3 1,016.5 988.9 1,010.8
4. DISCONTINUED ACTIVITIES
There were no discontinued activities during the years ended 30 June 2002 and 30 June 2001.
5. OTHER INCOME
Lending and Credit Facility Related Fees 55.5 55.4 55.5 55.4
Other Fees 108.3 92.3 90.4 78.0
Net Foreign Exchange Earnings and Commissions 27.7 24.9 27.0 24.2
Trading Gains 13.2 6.4 13.0 8.1
Rent 5.9 7.3 0.4 1.4
Other Income from Associates and Subsidiaries – – 11.0 8.7
Net Capital Gain/(Loss) 3.0 (0.1) 2.5 (0.1)
Dividends Received 0.7 – 54.6 12.5
Other 1.0 1.0 0.9 1.0
Total Other Income 215.3 187.2 255.3 189.2

NOTES TO THE FINANCIAL STATEMENTS
For the year ended 30 June 2002
26
Consolidated Parent
$ millions 2002 2001 2002 2001
6. OPERATING EXPENSE DISCLOSURES
Depreciation – Buildings 9.2 9.6 6.2 6.5
Depreciation – Other Assets 20.9 20.3 19.8 18.9
Operating Lease Rentals 35.6 34.2 33.4 32.0
Directors’ Fees and Allowances – 0.4 – 0.4
Net Losses on Sale of Property, Plant and Equipment. 0.2 0.6 0.2 0.4
7. AUDITORS’ REMUNERATION
Auditing Services – 0.1 – 0.1
Ernst & Young were appointed as auditors of the Banking Group on 24 October 2000. The Group audit fee is paid by the Bank’s ultimateparent bank, Commonwealth Bank of Australia.
No fees for other services were paid to the Bank’s auditors during the year (30 June 2001 Nil).
8. TAXATION
Net Surplus before Taxation 334.7 280.1 254.5 242.8
Permanent Differences:
Net Capital Gains (3.0) – (2.5) –
Change in General Provision for Doubtful Debts 12.0 8.3 7.4 8.1
Exempt Dividend Income – – (89.6) (48.4)
Other (10.3) 4.6 3.0 2.8
333.4 293.0 172.8 205.3
The current tax rate @ 33% gives theStatement of Financial Performance Income Tax Expense 110.0 96.7 57.0 67.7
Income Tax Expense is comprised of:
Current Taxation 106.0 96.4 52.3 66.5
Deferred Taxation 4.0 0.3 4.7 1.2
110.0 96.7 57.0 67.7
9. DIVIDENDS
Ordinary Dividends
Interim 10.0 – 10.0 –
Final – 150.0 – 150.0
Total Ordinary Dividends 10.0 150.0 10.0 150.0
Non-Cumulative Preference Dividends
Interim – 1.5 – 1.5
Final – 1.6 – 1.6
Total Non-Cumulative Preference Dividends – 3.1 – 3.1
Total Dividends 10.0 153.1 10.0 153.1

NOTES TO THE FINANCIAL STATEMENTS
For the year ended 30 June 2002 ASB BANK LIMITED ANNUAL REPORT
27
Consolidated Parent
$ millions 2002 2001 2002 2001
10. CASH AND LIQUID ASSETS
Cash and Cash at Bank 47.2 45.7 47.2 45.7
Cash in Transit 57.6 1.2 57.6 1.3
Demand Balances with Central Banks 0.9 – 0.9 –
Total Cash and Liquid Assets 105.7 46.9 105.7 47.0
11. DUE FROM OTHER BANKS
Call 22.5 74.7 10.9 61.5
Term 2,473.3 756.3 1,500.1 156.4
Total Due from Other Banks 2,495.8 831.0 1,511.0 217.9
12. SECURITIES
Investment Securities 484.0 154.8 – –
Other Securities
Local Authority Securities 2.8 3.1 2.8 3.1
New Zealand Government Securities 6.6 437.7 6.6 437.7
Treasury Bills 117.8 493.3 117.8 493.3
Other Securities 1,770.7 1,678.5 1,770.7 1,678.5
Total Other Securities 1,897.9 2,612.6 1,897.9 2,612.6
As at 30 June 2002 the Banking Group had an investment of $622.7m ($614.2m principal plus accrued interest) (30 June 2001 $622.6m) ininterest bearing debentures. The Banking Group had also received a deposit, which as at 30 June 2002 amounted to $502.8m (30 June 2001$467.9m). Both the debentures and the deposit mature in 2005. On maturity, the value of the deposit with capitalised interest will amount to$614.2m (plus accrued interest).
The Banking Group has entered into agreements such that, on maturity, the debentures will be used to extinguish the liability under thedeposit. The two balances have been set-off and recognised in Investment Securities as the net amount of $119.9m (30 June 2001 $154.8m).
13. ADVANCES
Loans and Other Receivables 19,038.7 16,180.3 17,444.1 15,032.9
Less: Specific Provisions for Bad and Doubtful Debts 6.8 6.8 6.1 6.1
Total Advances 19,031.9 16,173.5 17,438.0 15,026.8

NOTES TO THE FINANCIAL STATEMENTS
For the year ended 30 June 2002
28
Consolidated Parent
$ millions 2002 2001 2002 2001
14. DEBT PROVISIONS
General Provision for Bad and Doubtful Debts
Balance at Beginning of Year 59.3 51.0 57.9 49.8
Charged to the Statement of Financial Performance: 16.9 12.1 11.6 11.7
Bad Debts Recovered 3.7 3.8 3.7 3.8
79.9 66.9 73.2 65.3
Less: Bad Debts Written Off 8.6 7.6 7.9 7.4
Balance at End of Year 71.3 59.3 65.3 57.9
Specific Provisions for Bad and Doubtful Debts
Balance at Beginning of Year 6.8 7.5 6.1 6.8
Charged to the Statement of Financial Performance:
New Provisions 3.0 3.1 3.0 2.8
Less: Amounts Recovered 1.9 1.7 1.9 1.7
Less: Advances Written Off 2.7 2.1 2.7 1.8
Plus: Increase in Bulk Provisions 1.6 – 1.6 –
Balance at End of Year 6.8 6.8 6.1 6.1
Total Debt Provisions 78.1 66.1 71.4 64.0
Debt Provisions Expense Charged
to the Statement of Financial Performance
General Provision 16.9 12.1 11.6 11.7
Specific Provisions 1.1 1.4 1.1 1.0
Total Debt Provisions Expense Charged
to the Statement of Financial Performance 18.0 13.5 12.7 12.7
As at 30 June 2002 the Specific Provisions were comprised of:
(a) Bulk provisions of $5.0m (30 June 2001 $4.0m) for both consolidated and parent; and
(b) Provisions relating to non-accrual loans of $1.8m (30 June 2001 $2.8m) for consolidated and $1.1m (30 June 2001 $2.1m) for parent.
15. DUE FROM ASSOCIATES AND SUBSIDIARIES
Parent
As at 30 June 2002, the Bank had invested in $614.2m (30 June 2001 $614.2m) of redeemable preference shares (accrued interest is includedin Other Assets). As at 30 June 2002, the Bank had also received deposits from various subsidiaries, which amounted to $502.8m (30 June2001 $467.9m). Both the redeemable preference shares and deposits mature in 2005. On maturity, the value of the deposits with capitalisedinterest will amount to $614.2m (plus accrued interest) (30 June 2001 $614.2m).
As at 30 June 2002 the two balances are recognised in Due from Associates and Subsidiaries $1,666.0m (30 June 2001 $1,246.5m) as the netamount of $111.3m (30 June 2001 $146.3m), as per an offset agreement between the parties.
NOTES TO THE FINANCIAL STATEMENTS
For the year ended 30 June 2002 ASB BANK LIMITED ANNUAL REPORT
29
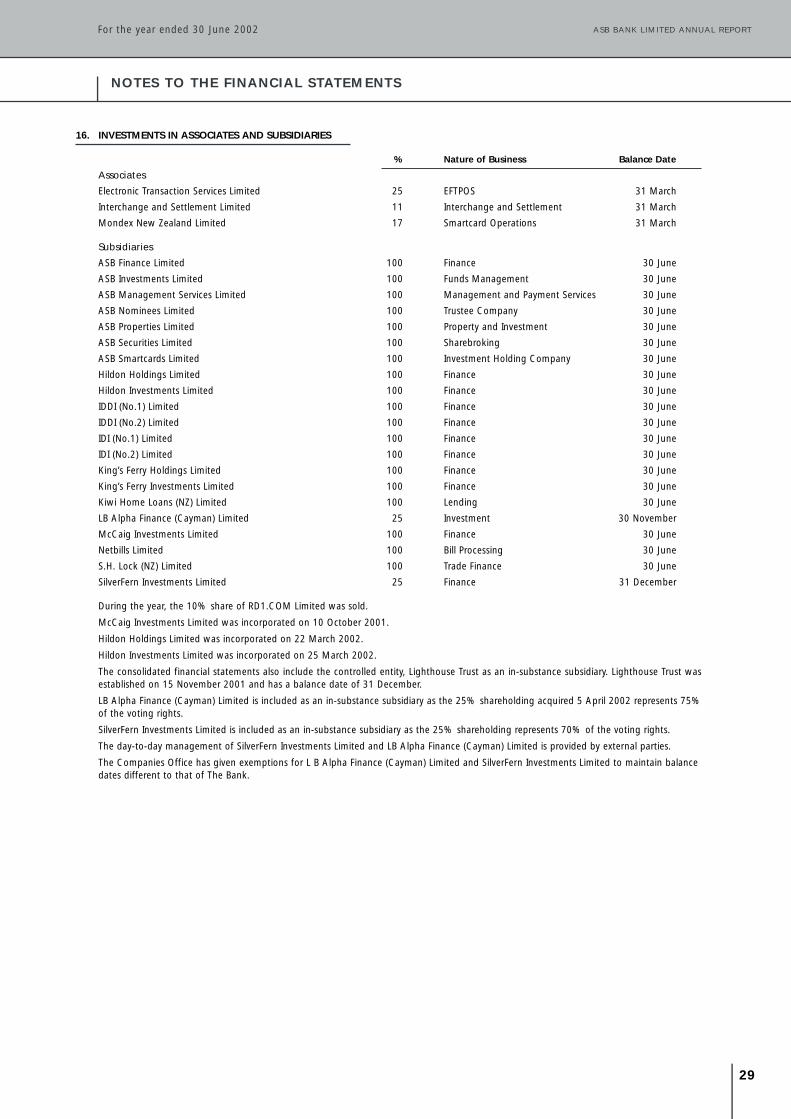
16. INVESTMENTS IN ASSOCIATES AND SUBSIDIARIES
% Nature of Business Balance Date
Associates
Electronic Transaction Services Limited 25 EFTPOS 31 March
Interchange and Settlement Limited 11 Interchange and Settlement 31 March
Mondex New Zealand Limited 17 Smartcard Operations 31 March
Subsidiaries
ASB Finance Limited 100 Finance 30 June
ASB Investments Limited 100 Funds Management 30 June
ASB Management Services Limited 100 Management and Payment Services 30 June
ASB Nominees Limited 100 Trustee Company 30 June
ASB Properties Limited 100 Property and Investment 30 June
ASB Securities Limited 100 Sharebroking 30 June
ASB Smartcards Limited 100 Investment Holding Company 30 June
Hildon Holdings Limited 100 Finance 30 June
Hildon Investments Limited 100 Finance 30 June
IDDI (No.1) Limited 100 Finance 30 June
IDDI (No.2) Limited 100 Finance 30 June
IDI (No.1) Limited 100 Finance 30 June
IDI (No.2) Limited 100 Finance 30 June
King’s Ferry Holdings Limited 100 Finance 30 June
King’s Ferry Investments Limited 100 Finance 30 June
Kiwi Home Loans (NZ) Limited 100 Lending 30 June
LB Alpha Finance (Cayman) Limited 25 Investment 30 November
McCaig Investments Limited 100 Finance 30 June
Netbills Limited 100 Bill Processing 30 June
S.H. Lock (NZ) Limited 100 Trade Finance 30 June
SilverFern Investments Limited 25 Finance 31 December
During the year, the 10% share of RD1.COM Limited was sold.
McCaig Investments Limited was incorporated on 10 October 2001.
Hildon Holdings Limited was incorporated on 22 March 2002.
Hildon Investments Limited was incorporated on 25 March 2002.
The consolidated financial statements also include the controlled entity, Lighthouse Trust as an in-substance subsidiary. Lighthouse Trust wasestablished on 15 November 2001 and has a balance date of 31 December.
LB Alpha Finance (Cayman) Limited is included as an in-substance subsidiary as the 25% shareholding acquired 5 April 2002 represents 75%of the voting rights.
SilverFern Investments Limited is included as an in-substance subsidiary as the 25% shareholding represents 70% of the voting rights.
The day-to-day management of SilverFern Investments Limited and LB Alpha Finance (Cayman) Limited is provided by external parties.
The Companies Office has given exemptions for L B Alpha Finance (Cayman) Limited and SilverFern Investments Limited to maintain balance dates different to that of The Bank.

NOTES TO THE FINANCIAL STATEMENTS
For the year ended 30 June 2002
30
Consolidated Parent
$ millions 2002 2001 2002 2001
17. PROPERTY, PLANT AND EQUIPMENT
Land Freehold 13.6 14.8 6.8 7.4
Buildings Freehold 95.9 100.1 23.8 27.5
Leasehold 65.9 53.2 60.4 48.1
Less: Accumulated Depreciation 42.2 33.5 36.5 30.6
119.6 119.8 47.7 45.0
Other Assets 246.6 215.4 231.3 203.7
Less: Accumulated Depreciation 179.3 155.0 167.0 147.3
67.3 60.4 64.3 56.4
Total Property, Plant and Equipment 200.5 195.0 118.8 108.8
Other Assets include Computer Equipment, Software, Office Equipment, Furniture and Fittings and Motor Vehicles.
No property was intended for sale as at 30 June 2002 (30 June 2001 Nil) for both consolidated and parent.
The total of the latest Government valuations of the consolidated Freehold Land and Buildings amounts to $132.4m (30 June 2001 $132.1m).Cost of additions subsequent to those valuations amounts to $0.5m (30 June 2001 $0.2m).
18. OTHER ASSETS
Interest Receivable Accrued 63.8 24.2 26.3 13.7
Other Current Assets 34.1 25.7 18.7 23.4
Total Other Assets 97.9 49.9 45.0 37.1
19. DEFERRED TAXATION BENEFIT
Balance at Beginning of Year 11.1 11.4 13.1 14.3
Net Movements in Timing Differences During Year (4.0) (0.3) (4.7) (1.2)
Balance at End of Year 7.1 11.1 8.4 13.1
The Deferred Taxation Benefit relates to:
Specific Provisions for Bad and Doubtful Debts 1.7 2.0 1.4 1.8
Depreciation 2.1 2.1 4.5 4.4
Other 3.3 7.0 2.5 6.9
Total Deferred Taxation Benefit 7.1 11.1 8.4 13.1
20. DEPOSITS
Certificates of Deposit and Issued Paper 3,901.8 4,702.1 3,851.1 4,455.5
Retail Term Deposits 6,539.3 5,377.4 6,539.3 5,377.4
Other Deposits Bearing Interest 6,895.8 6,747.6 6,894.0 6,747.2
Deposits Not Bearing Interest 926.3 791.8 926.7 791.8
Total Deposits 18,263.2 17,618.9 18,211.1 17,371.9

NOTES TO THE FINANCIAL STATEMENTS
For the year ended 30 June 2002 ASB BANK LIMITED ANNUAL REPORT
31
Consolidated Parent
$ millions 2002 2001 2002 2001
21. DUE TO OTHER BANKS
Call 51.5 481.3 51.5 481.3
Term 4,365.7 662.6 4,353.5 662.6
Total Due to Other Banks 4,417.2 1,143.9 4,405.0 1,143.9
22. OTHER CURRENT LIABILITIES
Interest Payable Accrued 156.7 100.9 155.6 98.5
Employee Entitlements 22.3 20.2 22.3 20.2
Provision for Income Tax 24.2 11.0 (5.0) (1.8)
Trade Accounts Payable and Other Liabilities 78.0 56.2 64.7 47.4
Total Other Current Liabilities 281.2 188.3 237.6 164.3
23. SUBORDINATED DEBT
The subordinated debt is subordinate to all other general liabilities of the Bank. All subordinated debt is denominated in New Zealand dollars.$100.0m face value matures 15 December 2009 with a coupon rate of 8.30% until 15 December 2004, after which the rate will be resetagainst the three month Bank Bill benchmark rate. The first subordinated debt is callable on 15 December 2004. Another $100.0m face valuematures 30 August 2010 with a coupon rate which is reset against the three month Bank Bill benchmark rate. This subordinated debt is callableon 30 August 2005. A further $50.0m face value matures 28 June 2011 with a coupon rate which is reset against the three month Bank Billbenchmark rate. This subordinated debt is callable on 28 June 2006.
All subordinated debt qualifies as Lower Tier Two Capital for Capital Adequacy calculation purposes.
24. CONTRIBUTED CAPITAL
323,121,300 Ordinary Shares 323.1 323.1 323.1 323.1
Total Contributed Capital 323.1 323.1 323.1 323.1
All Ordinary Shares have equal voting rights and share equally in dividends and surplus on winding up
Dividends are declared subject, in all cases, to the applicable Directors’ resolutions being passed.
25. ASSET REVALUATION RESERVES
Total Asset Revaluation Reserves at Beginning of Year 6.3 – 11.3 –
(Devaluations) (1.6) (7.5) (0.4) –
Transfers to Accumulated Surplus – 13.8 – 11.3
Total Asset Revaluation Reserves at End of Year 4.7 6.3 10.9 11.3
26. ACCUMULATED SURPLUS
Total Accumulated Surplus at Beginning of Year 490.3 473.8 454.2 443.5
Net Surplus after Taxation 224.7 183.4 197.5 175.1
Less:
Ordinary Dividends 10.0 150.0 10.0 150.0
Non-Cumulative Preference Dividends – 3.1 – 3.1
Transfers to Asset Revaluation Reserves – 13.8 – 11.3
Total Accumulated Surplus at End of Year 705.0 490.3 641.7 454.2

NOTES TO THE FINANCIAL STATEMENTS
For the year ended 30 June 2002
32
Consolidated Parent
$ millions 2002 2001 2002 2001
27. RECONCILIATION OF NET SURPLUS AFTER TAXATIONTO NET CASH FLOWS FROM OPERATING ACTIVITIES
Net Surplus after Taxation 224.7 183.4 197.5 175.1
Add: Movements in Balance Sheet Items
Interest Receivable Accrued – (Increase) / Decrease (31.6) (13.8) – 1.9
Interest Payable Accrued – Increase 51.5 22.7 52.1 24.2
Other Income Accrued – (Increase) / Decrease (3.7) 12.4 4.9 (3.1)
Operating Expenses Accrued – Increase 6.1 11.7 2.0 8.5
Taxation Balances – Increase / (Decrease) 17.3 8.6 1.6 (2.8)
39.6 41.6 60.6 28.7
Add: Non-Cash Items
Bad and Doubtful Debts 21.7 17.3 16.4 16.5
Depreciation 30.1 29.9 26.0 25.4
Capital Gain on Sale of Shares in Associates and Subsidiaries (3.0) – (3.0) –
Net Losses on Sale of Property, Plant and Equipment 0.2 0.8 0.2 0.6
49.0 48.0 39.6 42.5
Net Cash Flows from Operating Activities 313.3 273.0 297.7 246.3
28. RECONCILIATION OF CASH AND CASH EQUIVALENTS TO THE STATEMENT OF FINANCIAL POSITION
Cash and Liquid Assets 105.7 46.9 105.7 47.0
Demand Balances Due from Other Banks 22.5 74.7 10.9 61.5
Demand Balances Due to Other Banks (51.5) (481.3) (51.5) (481.3)
Total Cash and Cash Equivalents at End of Year 76.7 (359.7) 65.1 (372.8)
29. IMPUTATION CREDIT ACCOUNT
Balance at Beginning of Year 10.2 93.5 – –
Income Tax Paid 15.7 32.0 – –
Imputation Credits Attached to Dividends Received 18.0 17.6 – –
Less:
Transfer to ASB Holdings Tax Group – 4.8 – –
Imputation Credits Attached to Dividends Paid 31.7 75.4 – –
Imputation Credits Transferred (from) / to Policyholder Credit Account (4.3) 46.5 – –
Imputation Credits Adjustment Due to Change in Shareholding – 6.2 – –
Balance at End of Year 16.5 10.2 – –
Dividends paid by resident companies may include imputation credits representing the taxation already paid by the company or tax group onthe surpluses distributed by way of dividends. New Zealand resident shareholders may claim a tax credit to the value of the imputation creditattached to the dividends.
The Bank, together with its subsidiary companies and a number of associated companies, form a consolidated group for income tax purposes.Accordingly, income tax payments and imputation credit movements are generally reported on a consolidated basis and are available toshareholders through their shareholding in the Bank.
POLICYHOLDER CREDIT ACCOUNT
Balance at Beginning of Year 107.0 60.5 – –
Transfer (to)/from Imputation Credit Account During Year (4.3) 46.5 – –
Balance at End of Year 102.7 107.0 – –
In the consolidated tax group, one of the fellow subsidiary companies (Sovereign Group Limited) is a life insurance company which gives riseto a tax group Policyholder Credit Account. The balance of the Policyholder Credit Account is available to be transferred back to the ImputationCredit Account at the discretion of the Directors.

NOTES TO THE FINANCIAL STATEMENTS
For the year ended 30 June 2002 ASB BANK LIMITED ANNUAL REPORT
33
30. RELATED PARTY TRANSACTIONS AND BALANCES
Effective 1 July 2001, the ownership of the bank moved from ASB Group Limited to ASB Group (Holdings) Limited which is effectively a 100%owned subsidiary of Commonwealth Bank of Australia.
During the year ended 30 June 2002, the Bank has entered into, or had in place various financial transactions with members of theCommonwealth Bank Group, and other related parties. In all cases these arrangements were conducted on market terms and conditions, andwithin the Bank’s approved policies. Due to the transactional nature of banking, it is the opinion of the Directors that disclosure of totaltransactions processed for the year ended 30 June 2002 did not add any useful information, with the exception of:
Payments of $0.7m (30 June 2001 $0.2m) were made to Commonwealth Bank of Australia to guarantee repayments to the bank and itssubsidiaries for obligations against default by a counterparty, referred to in note 43.
Payments of $35.8m, $1.6m, $6.5m and $1.7m (30 June 2001 $11.4m, $7.1m, $8.9m and Nil) were made to the ASB Group (Life) LimitedGroup of Companies, ASB Group Limited, CBA NZ Subsidiaries and ASB Holdings Limited respectively, for the utilisation of tax losses.
A payment of $5.6m (30 June 2001 $4.4m) was made to ASB Group (Life) Limited Group of Companies for the origination of mortgages.
A payment of $4.4m (30 June 2001 $4.0m) was made to IT Fleet NZ (No.2) Limited for leasing of equipment.
Dealings with Directors and Parties Related to Directors: Payments of $0.5m (30 June 2001 $0.6m) were made to Research Solutions Limitedfor services rendered.
The Bank provides administrative functions for some subsidiaries and related companies for which no payments have been made.
Related Party Balances 2002 2001
$ millions Assets Liabilities Assets Liabilities
Commonwealth Bank Group (100% Ultimate Shareholder) 30.1 4,509.6 43.6 788.8
ASB Holdings Limited (100% Ultimate New Zealand Shareholder) – 34.0 – –
ASB Group Limited (Subsidiary of Commonwealth Bank Group) 0.9 16.0 0.3 19.3
ASB Group (Life) Limited Group of Companies (Subsidiary of Commonwealth Bank Group) 4.0 272.5 0.3 231.9
ASB Bank Provident Savings Fund (Staff Superannuation Scheme) – – – 0.1
ASB Unit Trusts (Funds Manager) 2.3 606.5 1.7 417.5
ASB Retirement Savings Scheme (Easyplan) 1.7 51.6 2.9 59.1
ASB Superannuation Scheme (Master Trust) – 2.0 – 1.4
Body Corporate 135 Albert Street (Management of ASB Bank Centre) 0.2 0.3 0.2 0.5
IT Fleet NZ (No.2) Limited (Subsidiary of Commonwealth Bank Group) – 0.8 – 0.8
RD1.COM Limited (Previously an Associate) – – 1.2 –
Colonial Group, Sovereign Group Limited and Sovereign Group of Companies have been amalgamated into ASB Group (Life) Limited Groupof Companies. Comparatives have been restated.
Off Balance Sheet Items
The Bank has in place interest rate swaps with Commonwealth Bank Group with a face value of $462.7m (30 June 2001 $545.8m), currencyswaps with a face value of $849.3m (30 June 2001 $39.9m) and forward exchange contracts with a face value of $672.5m (30 June 2001$1,698.8m). The Bank has forward exchange contracts with ASB Unit Trusts with a face value of $72.9m (30 June 2001 $77.7m), ASBRetirement Savings Scheme with a face value of $143.8m (30 June 2001 $138.3m) and with ASB Master Trust Scheme $5.7m (30 June 2001$3.6m). The Bank has foreign exchange contracts with the ASB Group (Life) Limited Group of Companies with a face value of $75.9m (30June 2001 $92.4m). The Bank has interest rate swaps with ASB Group Limited of $63.0m (30 June 2001 $63.0m).
31. LOANS TO/DEPOSITS FROM DIRECTORS
Loans to Directors
As at 30 June 2002 the aggregate amount of loans to Directors of the Banking Group, their spouses, dependants, trusts, or entities in whichany of these persons have an interest of not less than 10%, was $2.9m (30 June 2001 $3.5m).
All loans were made in the ordinary course of business of the Bank and on an arm’s length basis and on normal commercial terms andconditions. The interest rates applicable are between 6.7% and 18.75%. Terms of repayment range between variable, fixed rates up to twoyears, and interest only loans, all of which have been in accordance with the Bank’s lending policies.
Directors: R. Boven, G.H. Burrett, P.S. Hall, G.J. Judd, J.S.N. Mitchell, T.J. Preston, J.M.R. Syme, C.G. Wakefield, L.A. Wood S.T. Wright.
Deposits from Directors
The aggregate amount payable by the Bank to Directors as at 30 June 2002 was $1.2m (30 June 2001 $2.4m). The amount payable consistsof savings, cheque, term deposit and cash management balances, all lodgements being made and conducted on an arm’s length basis in thenormal course of business and on commercial terms and conditions.
Interest rates are from 0% to 5%, terms of repayment ranging between on call and 90 day terms.
Directors: R. Boven, G.H. Burrett, J.W. Duncan, P.A. Edwards, P.S. Hall, J.A. Hood, G.J. Judd, J.M.R. Syme, L.A. Wood S.T. Wright.

NOTES TO THE FINANCIAL STATEMENTS
For the year ended 30 June 2002
34
Consolidated Parent
2002 2001 2002 2001
Notional Credit Notional Credit Notional Credit Notional Credit
$ millions Amount Equivalent Amount Equivalent Amount Equivalent Amount Equivalent
32. CONTINGENT LIABILITIES AND CREDIT COMMITMENTS
(a) Commitments
Lending Commitments Approvedbut Not Yet Advanced 3,428.9 388.8 2,898.0 246.6 3,551.7 450.2 2,848.6 221.9
Capital Expenditure Commitments 13.6 13.6 11.6 11.6 13.6 13.6 11.3 11.3
Other Commitments – – 2.6 2.6 – – 2.6 2.6
Total Commitments 3,442.5 402.4 2,912.2 260.8 3,565.3 463.8 2,862.5 235.8
(b) Contingent Liabilities
Guarantees 51.1 25.7 80.3 51.8 51.2 25.8 269.8 146.6
Standby Letters of Credit 54.0 54.0 31.4 31.4 54.0 54.0 31.4 31.4
Other Arrangements Entered Into 27.2 7.3 38.7 13.6 27.2 7.3 38.7 13.6
Total Contingent Liabilities 132.3 87.0 150.4 96.8 132.4 87.1 339.9 191.6
(c) The Bank guarantees ASB Finance Limited’s issue of Promissory Notes. ASB Finance Limited had $50.8m outstanding Promissory Notes as at30 June 2002 (30 June 2001 $246.5m). The Promissory Note guarantee has been included in (b) above.
(d) The Bank has a loyalty programme in connection with the use of its credit cards. The Bank only expects a portion of outstanding points to beredeemed. The dollar value of outstanding points that have not been provided for as at 30 June 2002 is $2.4m (30 June 2001 $2.3m), and isincluded in (b) above.
Consolidated Parent
$ millions 2002 2001 2002 2001
33. LEASING COMMITMENTS
The following non-cancellable operating lease
commitments existed at the end of the year:
Within One Year of Balance Date 33.6 33.4 31.0 30.1
Between One and Two Years 26.6 24.6 23.4 22.1
Between Two and Five Years 52.7 52.0 44.6 43.1
Over Five Years 59.8 72.4 46.0 56.1
Total Leasing Commitments 172.7 182.4 145.0 151.4

NOTES TO THE FINANCIAL STATEMENTS
For the year ended 30 June 2002 ASB BANK LIMITED ANNUAL REPORT
35
Consolidated
Exchange Assets Liabilities Net OpenRate NZ $m NZ $m Position
34. MATERIAL FOREIGN CURRENCY BALANCES
Material Assets and Liabilities denominated in foreign currencies
recognised in these financial statements, and Net Open Positions were:
As at 30 June 2002
US Dollar 0.4883 397.0 503.2 6.5
Australian Dollar 0.8653 427.6 1,273.0 34.7
Sterling 0.3201 623.5 47.7 0.1
Japanese Yen 58.3871 16.9 2,143.9 (13.6)
EURO 0.4944 0.6 19.5 0.4
Canadian Dollar 0.7384 0.2 1.2 (0.1)
As at 30 June 2001
US Dollar 0.4036 37.7 164.6 (25.8)
Australian Dollar 0.7966 77.8 991.1 1.8
Sterling 0.2866 4.7 30.0 0.6
Japanese Yen 50.0540 15.4 2,963.9 0.5
Deutschmarks 0.9339 – 1.4 (1.6)
EURO 0.4775 – 10.1 4.1
Hong Kong Dollar 3.1480 2.0 0.2 (0.1)
Canadian Dollar 0.6150 – 1.4 (0.1)
Parent
Exchange Assets Liabilities Net OpenRate NZ $m NZ $m Position
As at 30 June 2002
US Dollar 0.4883 34.8 491.0 6.5
Australian Dollar 0.8653 13.1 1,222.2 34.7
Sterling 0.3201 3.5 26.8 0.1
Japanese Yen 58.3871 16.9 2,143.9 (13.6)
EURO 0.4944 0.6 19.5 0.4
Canadian Dollar 0.7384 0.2 1.2 (0.1)
As at 30 June 2001
US Dollar 0.4036 37.7 164.6 (25.8)
Australian Dollar 0.7966 20.8 933.0 1.8
Sterling 0.2866 4.7 30.0 0.6
Japanese Yen 50.0540 15.4 2,963.9 0.5
Deutschmarks 0.9339 – 1.4 (1.6)
EURO 0.4775 – 10.1 4.1
Hong Kong Dollar 3.1480 2.0 0.2 (0.1)
Canadian Dollar 0.6150 – 1.4 (0.1)
Differences between total monetary assets and total monetary liabilities in individual currencies are covered by contracts with other partiesand/or are controlled within internal policy limits.

NOTES TO THE FINANCIAL STATEMENTS
For the year ended 30 June 2002
36
2002 2001
Carrying Fair Carrying Fair
$ millions Amount Value Amount Value
35. FAIR VALUE OF FINANCIAL INSTRUMENTS
Consolidated
Balance Sheet Items
Cash and Liquid Assets 105.7 105.7 46.9 46.9
Due from Other Banks 2,495.8 2,495.8 831.0 831.0
Investment Securities 484.0 503.0 154.8 164.7
Other Securities 1,897.9 1,897.9 2,612.6 2,612.6
Advances 19,031.9 18,988.3 16,173.5 16,209.3
Due from Associates and Subsidiaries – – 1.7 1.7
Other Assets 97.9 97.9 49.9 49.9
Deposits 18,263.2 18,256.5 17,618.9 17,628.9
Due to Other Banks 4,417.2 4,417.2 1,143.9 1,143.9
Subordinated Debt 255.2 255.6 250.9 250.9
Parent
Balance Sheet Items
Cash and Liquid Assets 105.7 105.7 47.0 47.0
Due from Other Banks 1,511.0 1,511.0 217.9 217.9
Other Securities 1,897.9 1,897.9 2,612.6 2,612.6
Advances 17,438.0 17,398.2 15,026.8 15,062.3
Due from Associates and Subsidiaries 1,666.0 1,685.0 1,246.5 1,256.5
Other Assets 45.0 45.0 37.1 37.1
Deposits 18,211.1 18,204.4 17,371.9 17,381.9
Due to Other Banks 4,405.0 4,405.0 1,143.9 1,143.9
Due to Associates and Subsidiaries 70.0 70.0 252.3 252.3
Subordinated Debt 255.2 255.6 250.9 250.9
Off Balance Sheet Items
There are no fair values for Direct Credit Substitutes, Trade and Performance Related Items and Commitments as no secondary market exists.
Refer to note 45 for details of Fair Values of Derivative Financial Instruments.
36. FINANCIAL REPORTING BY SEGMENTS
The Bank operates predominantly in the banking industry within New Zealand. Notes 39 and 40 show the geographical distribution of creditexposures and funding within New Zealand.

NOTES TO THE FINANCIAL STATEMENTS
For the year ended 30 June 2002 ASB BANK LIMITED ANNUAL REPORT
37
Consolidated
Weighted
Average 0–6 6–12 1–2 2–5 Over 5
$ millions Interest Rate Months Months Years Years Years Total
%
37. INTEREST RATE REPRICING SCHEDULE
As at 30 June 2002
Monetary Assets
Cash and Liquid Assets – 105.7 – – – – 105.7
Due from Other Banks 7.8 1,545.8 – – 600.0 350.0 2,495.8
Investment Securities* 4.4 364.0 – – 120.0 – 484.0
Other Securities 6.0 1,862.7 20.1 3.5 3.9 7.7 1,897.9
Advances 7.4 10,661.4 3,346.8 3,655.8 1,367.9 – 19,031.9
Other Monetary Assets – 97.9 – – – – 97.9
Total Monetary Assets 14,637.5 3,366.9 3,659.3 2,091.8 357.7 24,113.2
Monetary Liabilities
Deposits 3.9 16,733.2 1,082.6 281.2 166.2 – 18,263.2
Due to Other Banks 5.4 4,417.2 – – – – 4,417.2
Other Current Liabilities – 281.2 – – – – 281.2
Subordinated Debt 6.6 155.1 – – 100.1 – 255.2
Total Monetary Liabilities 21,586.7 1,082.6 281.2 266.3 – 23,216.8
(Weighted Average Interest Rate on Liabilities) 3.82% 4.14% 6.27% 6.70% –
Off Balance Sheet Items 6,875.7 (1,619.7) (3,140.8) (1,735.2) (380.0) –
As at 30 June 2001
Monetary Assets
Cash and Liquid Assets – 46.9 – – – – 46.9
Due from Other Banks 7.4 231.0 – – 600.0 – 831.0
Investment Securities* 1.5 – – – 154.8 – 154.8
Other Securities 5.7 2,125.0 359.0 13.9 110.9 3.8 2,612.6
Advances 7.9 9,155.2 2,572.7 2,722.9 1,695.1 27.6 16,173.5
Due from Associates and Subsidiaries 1.9 1.7 – – – – 1.7
Other Monetary Assets – 49.9 – – – – 49.9
Total Monetary Assets 11,609.7 2,931.7 2,736.8 2,560.8 31.4 19,870.4
Monetary Liabilities
Deposits 4.1 16,070.9 1,305.6 162.7 79.7 – 17,618.9
Due to Other Banks 5.2 1,143.9 – – – – 1,143.9
Other Current Liabilities – 188.3 – – – – 188.3
Subordinated Debt 7.3 150.5 – – 100.4 – 250.9
Total Monetary Liabilities 17,553.6 1,305.6 162.7 180.1 – 19,202.0
(Weighted Average Interest Rate on Liabilities) 4.18% 2.82% 6.56% 7.74% –
Off Balance Sheet Items 5,914.7 (2,103.0) (2,242.8) (1,527.0) (41.9) –
*Offset arrangement and Imputation Credits result in a nominal interest rate that does not reflect the actual value of the investment (refer note 2).

NOTES TO THE FINANCIAL STATEMENTS
For the year ended 30 June 2002
38
Parent
Weighted
Average 0–6 6–12 1–2 2–5 Over 5
$ millions Interest Rate Months Months Years Years Years Total
%
37. INTEREST RATE REPRICING SCHEDULE (Continued)
As at 30 June 2002
Monetary Assets
Cash and Liquid Assets – 105.7 – – – – 105.7
Due from Other Banks 5.5 1,511.0 – – – – 1,511.0
Investment Securities* – – – – – – –
Other Securities 6.0 1,862.7 20.1 3.5 3.9 7.7 1,897.9
Advances 7.7 9,667.5 3,346.8 3,655.8 767.9 – 17,438.0
Due from Associates and Subsidiaries 5.5 1,554.7 – – 111.3 – 1,666.0
Other Monetary Assets – 45.0 – – – – 45.0
Total Monetary Assets 14,746.6 3,366.9 3,659.3 883.1 7.7 22,663.6
Monetary Liabilities
Deposits 3.9 16,681.1 1,082.6 281.2 166.2 – 18,211.1
Due to Other Banks 5.4 4,405.0 – – – – 4,405.0
Due to Associates and Subsidiaries 0.2 70.0 – – – – 70.0
Other Current Liabilities – 237.6 – – – – 237.6
Subordinated Debt 6.6 155.1 – – 100.1 – 255.2
Total Monetary Liabilities 21,548.8 1,082.6 281.2 266.3 – 23,178.9
(Weighted Average Interest Rate on Liabilities) 3.81% 4.14% 6.27% 6.70% –
Off Balance Sheet Items 5,273.9 (1,434.1) (2,783.8) (676.0) (380.0) –
As at 30 June 2001
Monetary Assets
Cash and Liquid Assets – 47.0 – – – – 47.0
Due from Other Banks 5.1 217.9 – – – – 217.9
Other Securities 5.7 2,125.0 359.0 13.9 110.9 3.8 2,612.6
Advances 7.9 8,362.8 2,381.1 2,569.5 1,685.8 27.6 15,026.8
Due from Associates and Subsidiaries* 6.5 1,091.7 – – 154.8 – 1,246.5
Other Monetary Assets – 37.1 – – – – 37.1
Total Monetary Assets 11,881.5 2,740.1 2,583.4 1,951.5 31.4 19,187.9
Monetary Liabilities
Deposits 4.1 15,823.9 1,305.6 162.7 79.7 – 17,371.9
Due to Other Banks 5.2 1,143.9 – – – – 1,143.9
Due to Associates and Subsidiaries 3.9 252.3 – – – – 252.3
Other Current Liabilities – 164.3 – – – – 164.3
Subordinated Debt 7.3 150.5 – – 100.4 – 250.9
Total Monetary Liabilities 17,534.9 1,305.6 162.7 180.1 – 19,183.3
(Weighted Average Interest Rate on Liabilities) 4.47% 2.82% 6.56% 7.74% –
Off Balance Sheet Items 5,583.3 (1,933.3) (2,124.3) (1,483.8) (41.9) –
*Offset arrangement and Imputation Credits result in a nominal interest rate that does not reflect the actual value of the investment (refer note 2).
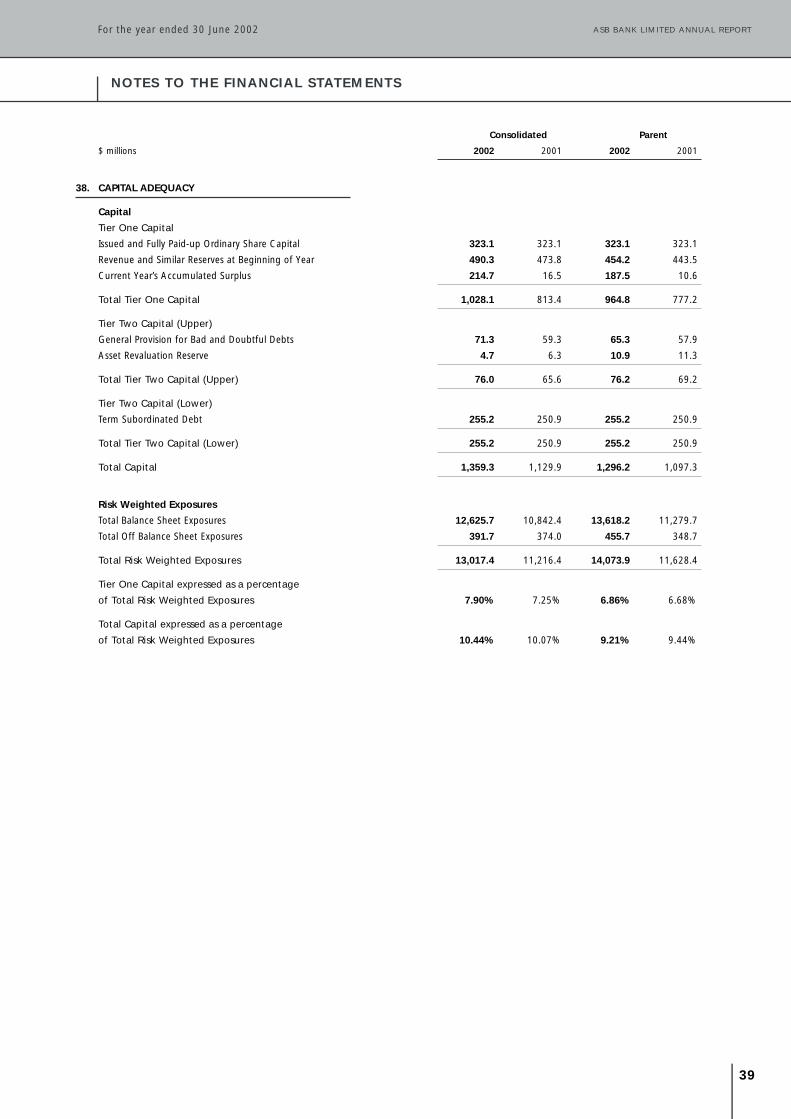
NOTES TO THE FINANCIAL STATEMENTS
For the year ended 30 June 2002 ASB BANK LIMITED ANNUAL REPORT
39
Consolidated Parent
$ millions 2002 2001 2002 2001
38. CAPITAL ADEQUACY
Capital
Tier One Capital
Issued and Fully Paid-up Ordinary Share Capital 323.1 323.1 323.1 323.1
Revenue and Similar Reserves at Beginning of Year 490.3 473.8 454.2 443.5
Current Year’s Accumulated Surplus 214.7 16.5 187.5 10.6
Total Tier One Capital 1,028.1 813.4 964.8 777.2
Tier Two Capital (Upper)
General Provision for Bad and Doubtful Debts 71.3 59.3 65.3 57.9
Asset Revaluation Reserve 4.7 6.3 10.9 11.3
Total Tier Two Capital (Upper) 76.0 65.6 76.2 69.2
Tier Two Capital (Lower)
Term Subordinated Debt 255.2 250.9 255.2 250.9
Total Tier Two Capital (Lower) 255.2 250.9 255.2 250.9
Total Capital 1,359.3 1,129.9 1,296.2 1,097.3
Risk Weighted Exposures
Total Balance Sheet Exposures 12,625.7 10,842.4 13,618.2 11,279.7
Total Off Balance Sheet Exposures 391.7 374.0 455.7 348.7
Total Risk Weighted Exposures 13,017.4 11,216.4 14,073.9 11,628.4
Tier One Capital expressed as a percentage
of Total Risk Weighted Exposures 7.90% 7.25% 6.86% 6.68%
Total Capital expressed as a percentage
of Total Risk Weighted Exposures 10.44% 10.07% 9.21% 9.44%

NOTES TO THE FINANCIAL STATEMENTS
For the year ended 30 June 2002
40
Consolidated
Risk
Principal Risk Weighted
Amount Weight Exposure
$ millions % $ millions
38. CAPITAL ADEQUACY (Continued)
Risk Weighted Exposures
As at 30 June 2002
Balance Sheet Exposures
Cash and Short Term Claims on Government 1,244.8 – –
Long Term Claims on Government 596.2 10 59.6
Claims on Banks 2,563.3 20 512.7
Claims on Public Sector Entities 103.8 20 20.8
Claims Secured by Residential Mortgages 15,560.4 50 7,780.2
Other 4,252.4 100 4,252.4
Total Balance Sheet Exposures 24,320.9 12,625.7
(excludes General Provision for Bad and Doubtful Debts)
Credit Credit Average Risk
Principal Conversion Equivalent Counterparty Weighted
Amount Factor Amount Risk Weight Exposure
$ millions % $ millions % $ millions
Off Balance Sheet Exposures
Direct Credit Substitutes 54.4 100 54.4 100 54.4
Commitments with Certain Drawdown 13.6 100 13.6 100 13.6
Underwriting and Sub-underwriting Facilities – 50 – 100 –
Transaction Related Contingent Items 56.8 50 28.4 100 28.4
Short Term, Self-liquidating Trade Related Contingencies 21.0 20 4.2 100 4.2
Other Commitments to Provide Financial Services WhichHave an Original Maturity of One Year or More 777.7 50 388.8 57 220.9
Other Commitments with an Original Maturity ofLess Than One Year or Which can be UnconditionallyCancelled at any Time 2,651.3 – – – –
Market Related Contracts (current exposure)
Foreign Exchange Contracts 6,679.4 3.4 225.6 24 53.7
Interest Rate Contracts 20,061.6 0.3 66.0 25 16.5
Total Off Sheet Exposures 391.7
Total Risk Weighted Exposures 13,017.4

NOTES TO THE FINANCIAL STATEMENTS
For the year ended 30 June 2002 ASB BANK LIMITED ANNUAL REPORT
41
Consolidated
Risk
Principal Risk Weighted
Amount Weight Exposure
$ millions % $ millions
38. CAPITAL ADEQUACY (Continued)
Risk Weighted Exposures
As at 30 June 2001
Balance Sheet Exposures
Cash and Short Term Claims on Government 876.4 – –
Long Term Claims on Government 104.0 10 10.4
Claims on Banks 2,099.0 20 419.8
Claims on Public Sector Entities 73.0 20 14.6
Claims Secured by Residential Mortgages 13,061.5 50 6,530.8
Other 3,866.8 100 3,866.8
Non-Risk Weighted Assets 0.3 – –
Total Balance Sheet Exposures 20,081.0 10,842.4
(excludes General Provision for Bad and Doubtful Debts)
Credit Credit Average Risk
Principal Conversion Equivalent Counterparty Weighted
Amount Factor Amount Risk Weight Exposure
$ millions % $ millions % $ millions
Off Balance Sheet Exposures
Direct Credit Substitutes 54.7 100 54.7 100 54.7
Commitments with Certain Drawdown 14.2 100 14.2 100 14.2
Underwriting and Sub-underwriting Facilities 9.0 50 4.5 100 4.5
Transaction Related Contingent Items 67.4 50 33.7 100 33.7
Short Term, Self-liquidating Trade Related Contingencies 19.3 20 3.9 100 3.9
Other Commitments to Provide Financial Services WhichHave an Original Maturity of One Year or More 493.2 50 246.6 77 189.0
Other Commitments with an Original Maturity ofLess Than One Year or Which can be UnconditionallyCancelled at any Time 2,404.8 – – – –
Market Related Contracts (current exposure)
Foreign Exchange Contracts 8,524.3 2.9 246.5 23 55.9
Interest Rate Contracts 13,250.9 0.6 75.1 24 18.1
Total Off Balance Sheet Exposures 374.0
Total Risk Weighted Exposures 11,216.4

NOTES TO THE FINANCIAL STATEMENTS
For the year ended 30 June 2002
42
Parent
Risk
Principal Risk Weighted
Amount Weight Exposure
$ millions % $ millions
38. CAPITAL ADEQUACY (Continued)
Risk Weighted Exposures
As at 30 June 2002
Balance Sheet Exposures
Cash and Short Term Claims on Government 1,244.8 – –
Long Term Claims on Government 246.2 10 24.6
Claims on Banks 1,565.0 20 313.0
Claims on Public Sector Entities 103.8 20 20.8
Claims Secured by Residential Mortgages 15,600.6 50 7,800.3
Other 5,459.5 100 5,459.5
Total Balance Sheet Exposures 24,219.9 13,618.2
(excludes General Provision for Bad and Doubtful Debts)
Credit Credit Average Risk
Principal Conversion Equivalent Counterparty Weighted
Amount Factor Amount Risk Weight Exposure
$ millions % $ millions % $ millions
Off Balance Sheet Exposures
Direct Credit Substitutes 54.4 100 54.4 100 54.4
Commitments with Certain Drawdown 13.6 100 13.6 100 13.6
Underwriting and Sub-underwriting Facilities – 50 – 100 –
Transaction Related Contingent Items 56.9 50 28.5 100 28.5
Short Term, Self-liquidating Trade Related Contingencies 21.0 20 4.2 100 4.2
Other Commitments to Provide Financial Services WhichHave an Original Maturity of One Year or More 900.4 50 450.2 68 303.8
Other Commitments with an Original Maturity ofLess Than One Year or Which can be UnconditionallyCancelled at any Time 2,651.3 – – – –
Market Related Contracts (current exposure)
Foreign Exchange Contracts 5,355.4 3.0 159.4 22 35.1
Interest Rate Contracts 19,949.1 0.3 65.3 25 16.1
Total Off Balance Sheet Exposures 455.7
Total Risk Weighted Exposures 14,073.9

NOTES TO THE FINANCIAL STATEMENTS
For the year ended 30 June 2002 ASB BANK LIMITED ANNUAL REPORT
43
Parent
Risk
Principal Risk Weighted
Amount Weight Exposure
$ millions % $ millions
38. CAPITAL ADEQUACY (Continued)
Risk Weighted Exposures
As at 30 June 2001
Balance Sheet Exposures
Cash and Short Term Claims on Government 876.4 – –
Long Term Claims on Government 104.0 10 10.4
Claims on Banks 1,485.9 20 297.2
Claims on Public Sector Entities 73.0 20 14.6
Claims Secured by Residential Mortgages 13,065.5 50 6,532.8
Other 4,424.7 100 4,424.7
Non-Risk Weighted Assets 0.3 – –
Total Balance Sheet Exposures 20,029.8 11,279.7
(excludes General Provision for Bad and Doubtful Debts)
Credit Credit Average Risk
Principal Conversion Equivalent Counterparty Weighted
Amount Factor Amount Risk Weight Exposure
$ millions % $ millions % $ millions
Off Balance Sheet Exposures
Direct Credit Substitutes 54.7 100 54.7 100 54.7
Commitments with Certain Drawdown 13.9 100 13.9 100 13.9
Underwriting and Sub-underwriting Facilities 9.0 50 4.5 100 4.5
Transaction Related Contingent Items 256.9 50 128.5 26 33.7
Short Term, Self-liquidating Trade Related Contingencies 19.3 20 3.9 100 3.9
Other Commitments to Provide Financial Services WhichHave an Original Maturity of One Year or More 443.8 50 221.9 74 164.3
Other Commitments with an Original Maturity ofLess Than One Year or Which can be UnconditionallyCancelled at any Time 2,404.8 – – – –
Market Related Contracts (current exposure)
Foreign Exchange Contracts 7,924.3 3.1 243.5 23 55.9
Interest Rate Contracts 13,093.7 0.6 73.9 24 17.8
Total Off Balance Sheet Exposures 348.7
Total Risk Weighted Exposures 11,628.4

NOTES TO THE FINANCIAL STATEMENTS
For the year ended 30 June 2002
44
Consolidated Parent
$ millions 2002 2001 2002 2001
39. CONCENTRATIONS OF CREDIT EXPOSURES
Concentration by Industry
Agricultural, Forestry and Fishing 2,028.2 1,581.8 2,026.4 1,581.8
Government and Public Authorities 253.3 81.6 253.3 81.6
Financial, Investments and Insurance 6,357.8 5,142.5 6,655.1 4,513.3
Utilities 196.1 204.5 196.1 204.5
Transport and Storage 169.3 74.8 165.1 74.8
Housing 12,982.5 10,863.8 11,488.5 10,865.9
Personal 309.4 290.8 309.4 290.8
Other Commercial and Industrial 1,612.9 1,533.8 1,399.8 1,477.1
Total Credit Exposures by Industry 23,909.5 19,773.6 22,493.7 19,089.8
Cash and Liquid Assets, Investments in Associates and Subsidiaries, Property, Plant and Equipment, Other Assets and Deferred Taxation Benefithave been excluded from the above analysis on the basis that any credit exposure is insignificant or nil. Unrecognised credit equivalentexposures as at 30 June 2002 of $781.0m consolidated and $775.6m parent (30 June 2001 $679.2m consolidated and $744.8m parent) arealso excluded.
Concentration by Geographic Region
Auckland 12,098.2 10,253.3 12,920.0 10,849.2
Northland 727.7 640.2 727.7 640.2
Waikato 1,167.6 869.3 891.5 804.3
Rest of North Island 2,725.9 2,415.1 2,492.6 2,262.5
South Island 2,280.5 1,938.8 2,021.2 1,644.6
Overseas 31.9 62.8 31.9 57.3
Uncategorised 4,877.7 3,594.1 3,408.8 2,831.7
Total Credit Exposures by Geographic Region 23,909.5 19,773.6 22,493.7 19,089.8
Uncategorised exposures includes Due from Other Banks, Investment Securities and Other Securities. The Directors consider that the nature ofthese assets make them inappropriate to categorise geographically. Unrecognised credit equivalent exposures are excluded as per the industrysegmentation above.

NOTES TO THE FINANCIAL STATEMENTS
For the year ended 30 June 2002 ASB BANK LIMITED ANNUAL REPORT
45
Consolidated Parent
$ millions 2002 2001 2002 2001
40. CONCENTRATIONS OF FUNDING
Concentration by Industry
Agricultural, Forestry and Fishing 206.6 207.4 206.6 207.4
Government and Public Authorities 400.7 336.9 400.7 336.9
Financial, Investments and Insurance 10,422.6 8,371.1 10,369.9 8,319.3
Utilities 87.5 96.4 87.5 96.4
Transport and Storage 12.8 47.7 12.8 47.7
Personal 10,673.4 8,854.7 10,673.4 8,854.7
Other Commercial and Industrial 1,132.0 1,099.5 1,132.0 1,104.9
Total Funding by Industry 22,935.6 19,013.7 22,882.9 18,967.3
Funding comprises Deposits, Subordinated Debt and Due to Other Banks.
Concentration by Geographic Region
Auckland 9,732.4 8,248.5 9,742.7 8,448.8
Northland 640.4 577.1 640.4 577.1
Waikato 281.8 204.7 281.8 204.7
Rest of North Island 1,513.8 1,816.1 1,513.8 1,816.1
South Island 994.6 831.7 994.6 831.7
Overseas 1,174.0 1,238.6 1,174.0 1,238.6
Uncategorised 8,598.6 6,097.0 8,535.6 5,850.3
Total Funding by Geographic Region 22,935.6 19,013.7 22,882.9 18,967.3
Uncategorised funding includes Certificates of Deposit and Issued Paper, Subordinated Debt and Due to Other Banks. The Directors considerthat the nature of these liabilities make them inappropriate to categorise geographically.

NOTES TO THE FINANCIAL STATEMENTS
For the year ended 30 June 2002
46
Consolidated Parent
$ millions Non-Accrual Restructured Total Non-Accrual Restructured Total
41. ASSET QUALITY
Impaired Assets (Pre-provisions)
As at 30 June 2002
Balance at Beginning of Year 31.2 – 31.2 28.5 – 28.5
Additions 6.7 – 6.7 7.7 – 7.7
Less: Amounts Written Off 2.7 – 2.7 2.7 – 2.7
Balance at End of Year 35.2 – 35.2 33.5 – 33.5
As at 30 June 2001
Balance at Beginning of Year 16.2 – 16.2 12.6 – 12.6
Additions 17.1 – 17.1 17.7 – 17.7
Less: Amounts Written Off 2.1 – 2.1 1.8 – 1.8
Balance at End of Year 31.2 – 31.2 28.5 – 28.5
Interest foregone is the amount of income that would have been recorded if interest accruals on specific loans had not been set to nil. It isestimated based on market rates. The 30 June 2002 figure is estimated at $1.0m (30 June 2001 $0.7m) for consolidated and $0.9m (30 June2001 $0.7m) for parent.
The Bank does not have any material assets acquired through enforcement of security.
Consolidated Parent
$ millions 2002 2001 2002 2001
Past Due Assets (Pre-provisions)
Balance at Beginning of Year 63.4 39.9 59.6 32.9
(Deletions) / Additions (28.1) 31.1 (27.4) 34.1
Less: Amounts Written Off 8.6 7.6 7.9 7.4
Balance at End of Year 26.7 63.4 24.3 59.6
42. MANAGED FUND AND OTHERFIDUCIARY ACTIVITIES
ASB Investments Limited is the manager for the ASB Unit Trusts. An independent Trustee firm is appointed for each Unit Trust, who monitorscompliance with the requirements of the Trust Deeds. The Bank provides banking and administration services for the Unit Trusts.
Total Unitholders’ Funds as at 30 June 2002 were $757.0m (30 June 2001 $590.6m).
ASB Investments Limited is also the Trustee for the ASB Easyplan Retirement Savings Scheme. Specialist Fund Managers have been appointed.The Bank provides banking and administration services for the Scheme.
Total Members’ Funds as at 30 June 2002 were $326.7m (30 June 2001 $340.5m).
ASB Investments Limited is also the Trustee for the ASB Superannuation Master Trust Scheme. Specialist Fund Managers have been appointed.The Bank provides banking and administration services for the Scheme.
Total Members’ Funds as at 30 June 2002 were $16.5m (30 June 2001 $12.1m).
The Bank provides limited custodial services relating to holding Certificates of Deposit on behalf of clients.

NOTES TO THE FINANCIAL STATEMENTS
For the year ended 30 June 2002 ASB BANK LIMITED ANNUAL REPORT
47
43. CONCENTRATION OF CREDIT EXPOSURESTO INDIVIDUAL COUNTERPARTIES
Peak Credit Exposures for the Three Months ended 30 June
Number of Non-Banks Number of Banks
Percentage of Shareholders’ Equity 2002 2001 2002 2001
10 – 19 2 4 – 5
20 – 29 3 – 4 3
30 – 39 2 2 3 2
40 – 49 – 1 3 5
50 – 59 – – – –
60 – 69 – – – –
70 – 79 – – 1 1
Balance Date Credit Exposures
Number of Non-Banks Number of Banks
Percentage of Shareholders’ Equity 2002 2001 2002 2001
10 – 19 2 4 – 5
20 – 29 3 – 4 3
30 – 39 2 2 3 2
40 – 49 – 1 3 5
50 – 59 – – – –
60 – 69 – – – –
70 – 79 – – 1 1
The basis of calculation is the greater of actual credit exposures or internal limits. Exposures are shown net of specific provisions and gross ofset-offs. Percentages are calculated using the Banking Group’s equity at balance date.
A portion of the Balance Date Credit Exposure itemised as 70-79% of Shareholder’s Equity (30 June 2001 70-79% of Shareholder’s Equity) hasbeen guaranteed by the banks ultimate parent, Commonwealth Bank of Australia. This Exposure is itemised as a 70-79% Peak Credit Exposure(30 June 2001 70-79%). As at 30 June 2002, the amount of this guarantee was $435.0m (30 June 2001 $435.0m). The above tables havebeen compiled using gross exposures and do not include any guarantee arrangements.
Consolidated
Peak Exposure Balance Date
for the Three Months Exposure
ended 30 June
Percentage Percentage
of Tier One of Tier One
$ millions Capital $ millions Capital
44. CREDIT EXPOSURES TO CONNECTED PERSONSAND NON-BANK CONNECTED PERSONS
2002 All Connected Persons* 465.7 45.3% 463.7 45.1%
Non-Bank Connected Persons 5.2 0.5% 3.2 0.3%
2001 All Connected Persons* 402.0 49.4% 401.9 49.4%
Non-Bank Connected Persons 2.7 0.3% 2.6 0.3%
*Credit Exposures to Connected Persons include exposures to the Bank’s ultimate parent bank, Commonwealth Bank of Australia.As at 30 June 2002, this amount was $425.2m (30 June 2001 $365.0m).
The basis of calculation is the greater of actual credit exposures or internal limits. Exposures are shown net of specific provisions and gross ofset-offs. Percentages are calculated using the Banking Group’s equity at balance date.
The Banking Group has a contingent exposure to its ultimate parent, Commonwealth Bank of Australia, arising from risk lay-off arrangementsin respect of credit exposures to counterparties. As at 30 June 2002, this amounted to $435.0m (30 June 2001 $435.0m).
The Banking Group has no Specific Provisions provided against credit exposures to connected persons.

NOTES TO THE FINANCIAL STATEMENTS
For the year ended 30 June 2002
48
Consolidated Parent
Notional Credit Fair Notional Credit Fair
$ millions Value Equivalent Value Value Equivalent Value
45. DERIVATIVE FINANCIAL INSTRUMENTS
As at 30 June 2002
Foreign Exchange Rate Related Contracts
Trading 1,141.8 24.2 (22.3) 1,141.8 24.2 (22.3)
Other than Trading 5,537.6 201.4 (9.3) 4,213.6 135.2 (8.8)
Total Foreign Exchange Rate Related Contracts 6,679.4 225.6 (31.6) 5,355.4 159.4 (31.1)
Interest Rate Related Contracts
Trading 8,103.1 7.4 (1.2) 8,103.1 7.4 (1.2)
Other than Trading 11,958.5 58.6 (54.8) 11,846.0 57.9 (54.5)
Total Interest Rate Related Contracts 20,061.6 66.0 (56.0) 19,949.1 65.3 (55.7)
As at 30 June 2001
Foreign Exchange Rate Related Contracts
Trading 1,077.8 41.7 (3.7) 1,077.8 41.7 (3.7)
Other than Trading 7,446.5 204.8 34.9 6,846.5 201.8 34.9
Total Foreign Exchange Rate Related Contracts 8,524.3 246.5 31.2 7,924.3 243.5 31.2
Interest Rate Related Contracts
Trading 4,280.4 4.2 (0.6) 4,280.4 4.2 (0.6)
Other than Trading 8,970.5 70.9 (63.0) 8,813.3 69.7 (63.5)
Total Interest Rate Related Contracts 13,250.9 75.1 (63.6) 13,093.7 73.9 (64.1)
Foreign Exchange Rate Related Contracts, other than Trading, have been transacted by the Banking Group to hedge Foreign Currency funding.Losses on contracts are offset by gains on the underlying Foreign Currency funding.
Interest Rate Related Contracts, other than Trading, hedge interest rate risk associated with the Banking Group’s Statement of FinancialPosition. The unrecognised gains on these contracts at 30 June 2002 was $3.0m for both consolidated and parent (30 June 2001 $8.6mconsolidated and $9.1m parent) calculated as the fair value loss of $54.8m consolidated and $4.5m parent (30 June 2001 $45.8m consolidatedand $45.3m parent) less the net payable recognised in the Statement of Financial Position of $57.8m consolidated and $57.5m parent (30 June2001 $54.4m for both consolidated and parent).

NOTES TO THE FINANCIAL STATEMENTS
For the year ended 30 June 2002 ASB BANK LIMITED ANNUAL REPORT
49
46. RISK MANAGEMENT POLICIES
Introduction
The Bank is committed to the management of risk to achieve sustainability – of service, employment and surpluses – and so takes on controlledamounts of risk when considered appropriate.
The primary risks are those of credit, market (currency, interest rate, equity), liquidity and operational risk.
The Bank’s risk management strategy is set by the Board of Directors via the Risk Committee. Implementation of the risk management strategyis the responsibility of the Managing Director. Day-to-day management is the function of the Executive Management Committee, a committeeof senior managers responsible for the principal divisions of the Bank and chaired by the Managing Director. The Executive ManagementCommittee is assisted by a number of specific committees, including the Asset and Liability Management Committee (“ALCO”) focusing onliquidity and interest rate risks, the Executive Credit Committee focusing on credit risk and a number of other tactical committees.
In addition to high level involvement in the management of risk, the Bank has also put in place the management structure and informationsystems to manage individual risks, has separated monitoring tasks where feasible, and subjects all material systems to regular internal audit.Periodic reviews of all risk management systems are undertaken by internal audit and, in respect of market and liquidity risk, by the Bank’sultimate parent bank, the Commonwealth Bank of Australia.
Credit Risk
Credit risk is the potential risk of loss arising from the failure of a debtor or trading counterparty to honour fully any financial or contractualobligation.
Credit risk principally arises within the Bank from its core business in providing lending facilities. Credit risk also arises from the Bank assumingcontingent liabilities, taking equity participations, participating in financial market transactions and assuming underwriting commitments.The Bank is selective in targeting credit risk exposures and avoids exposures to any high risk area.
The Bank has a comprehensive, clearly defined credit policy for the approval and management of all credit risk, including risk to other bankand related counterparties. Intra-day and term credit risk management is not differentiated.
Lending standards and criteria are clearly defined into different business sectors for all Bank products. The Bank relies primarily on the integrityof the debtor or counterparty and their ability to meet their obligations to the Bank. Except for major corporate/bank counterparties of stronginvestment standing (and a non-material amount in very short term exposures to other customer sectors), the Bank requires security coverwithin loan to security valuation margins set down in the Bank’s policy.
Industry and product concentrations are managed within established guidelines and limits. Maximum aggregated exposure limits also apply forany debtor or trading counterparty. Credit risk is strongly monitored and reviewed, with regular independent internal inspections beingundertaken to test the quality of the credit exposures, compliance with policy and the effectiveness of management control. Non-compliancewith credit policy is reported to the Board of Directors through the Risk Committee.
Currency Risk
Currency risk results from the mismatch of recognised and unrecognised foreign currency assets and liabilities. These mismatches can arise fromthe day-to-day purchase and sale of foreign currency, from trading positions taken, from deposit and lending activity in foreign currencies andfrom offshore funding by the Bank.
The Bank monitors and manages this risk through its Treasury Department. Mismatches, and the contingent risk associated with any mismatchare reported daily. Limits, both intra-day and overnight, are set on the basis of past exchange rate volatility to ensure the maximum exposureto losses from an adverse movement in exchange rates is known to agreed statistical confidence levels.
Adherence to limits is monitored by an independent department within the Bank.
Interest Rate Risk
Interest rate risks arise from holding assets and liabilities, including off balance sheet instruments, which may mature or reprice in differentperiods.
The Bank reduces interest rate risk by seeking to match the repricing of assets and liabilities. This is achieved by changing the mix of assets andliabilities through marketing and pricing initiatives, by buying and selling long term securities and through the use of derivatives such as interestrate swaps and forward rate agreements. In managing this risk, the Bank seeks to achieve a balance between reducing risk to earnings andmarket value from adverse interest rate movements, and enhancing net interest income through correct anticipation of the direction and extentof interest rate changes.
Overall strategic direction is provided by ALCO which meets monthly. On a day-to-day basis, interest rate risk is monitored and managed withinthe Treasury Department.
For market sensitive risk, daily reports of positions and potential loss amounts are produced based on past interest rate volatility to ensure themaximum loss from an adverse movement in interest rates is known to agreed statistical confidence levels.
Risk associated with non market sensitive assets and liabilities, while also monitored daily, is primarily managed by way of weekly reviews byTreasury and monthly reviews by ALCO. Gap analysis and gap limits provide the day-to-day management tool while regular simulation of Bankactivity, analysis of market value and stress tests provide the key management information and limits.

NOTES TO THE FINANCIAL STATEMENTS
For the year ended 30 June 2002
50
46. RISK MANAGEMENT POLICIES (Continued)
Future net interest earnings are regularly estimated employing existing interest rates, rates 1% above and below current levels and rates basedon historical rate analysis. The Bank manages the known and assumed repricing characteristics of its assets and liabilities as well as futurecommitments to put the Bank in a position to benefit from anticipated interest rate movements and to limit the risk of adverse interest ratemovements.
Two major limits are imposed. The sensitivity to interest rate changes must be such that expected net interest earnings under different interestrate scenarios remain within a set percentage of the central forecast and, similarly, market value remains within a set percentage of capital.These limits are set by the Board of Directors and monitored by ALCO.
Repricing mismatches, the simulation results and a stress test on the market value of the Bank’s assets and liabilities, including derivatives, arereported monthly to ALCO and the Board of Directors, along with associated limits.
Equity Risk
Equity risk results from the repricing of equity investments held by the Bank. This is not a material risk to the Bank. A formal equity risk policyapproved by the Risk Committee is in place. Under this policy, trading in equities is not permitted.
Liquidity Risk
Management of liquidity risk is designed to ensure that the Bank has the ability to generate or obtain sufficient cash or its equivalent in a timelymanner and at a reasonable price to meet its financial commitments on a daily basis.
The Bank monitors this risk primarily by forecasting future daily cash requirements. The Bank manages this risk by holding a pool of readilytradable investment assets and deposits on call or maturing within seven days with high credit quality counterparties to provide for anyunexpected patterns in cash movements and by seeking a diverse and stable funding base.
Specifically, the Bank sets targets for funding from its customers, both personal and business, through the branch network and its TreasuryDepartment. The Bank limits funding from each source of short term liquid instruments. The Bank maintains a portfolio of liquid assetsequivalent to 14-20% of total deposits.
Operational Risk
A formal reporting structure and policy approved by the Board of Directors for the management of operational risk is in place. Under thispolicy, processes and practices for the identification, monitoring, measurement and day-to-day management of operational risks havebeen established.
Accordingly, heads of all business units and specialist support functions have clearly defined roles and responsibilities to ensure that theoperational risks inherent in all business activities have been identified, measured and recorded.
A formal programme is in place for reporting back to the Risk Committee and Board of Directors on the measurement and management ofoperational risk within the Banking Group.
Internal Audit
The Banking Group maintains an independent Internal Audit function which is ultimately accountable to the Board of Directors through theManaging Director and Board Audit Committee.
Internal Audit provides an independent assurance and consulting service designed to assist the Banking Group in achieving its objectives bybringing a systematic and disciplined approach to improving the effectiveness of risk management systems, the framework of controls, andgovernance processes. Operational, compliance, financial and systems audits of all areas of the Banking Group’s operations are undertakenbased on an assessment of risk.
The Audit Committee meets on a regular basis to consider the Bank’s financial reporting, internal control and corporate governance issues. Itreviews the interim and annual financial statements, the activities of the internal and external auditors and monitors the relationship betweenmanagement and the external auditors.
ADDITIONAL DISCLOSURES
For the year ended 30 June 2002 ASB BANK LIMITED ANNUAL REPORT
51
30 June 2002
DETAILS OF INCORPORATION
The Bank is a company incorporated under the Companies Act 1955 on 16 August 1988 and is registered under AK398445. The registeredoffice of ASB Bank Limited is Level 28, ASB BANK Centre, 135 Albert Street, Auckland. The Bank was re-registered under the Companies Act1993 on 30 June 1995.
ULTIMATE PARENT BANK
The ultimate parent bank of ASB Bank Limited is Commonwealth Bank of Australia (“CBA”), its registered office being Level 5, 48 Martin Place,Sydney, NSW, Australia.
CBA is required by the Australian Prudential Regulation Authority (“APRA”) to meet minimum Total Capital Adequacy requirements of 8.0%of Risk Weighted Assets, in compliance with the Basle framework. As at 30 June 2002, CBA exceeded APRA minimum requirements with TierOne Capital being 6.76% of Risk Weighted Assets and Total Capital being 9.16% of Risk Weighted Assets.
GUARANTEE ARRANGEMENTS
The Commonwealth Bank of Australia does not guarantee repayment of any obligations of the Bank or its subsidiaries.
DEALINGS WITH DIRECTORS
There have been no dealings with Directors or parties related to the Directors on terms other than in the ordinary course of business. Refer toNote 31 for outstanding balances with Directors.
All Directors are required to table all possible conflicts of interest at the Board of Directors’ meetings and are required to abstain from any voteon those proceedings. The Bank complies with all requirements of the Companies Act 1993 in terms of registers and notices for Directors’conflict of interest.
Communications addressed to the Directors should be sent to:
Level 28ASB BANK Centre135 Albert StreetAucklandNew Zealand
CONDITIONS OF REGISTRATION – ASB BANK LIMITED
The registration of ASB Bank Limited as a registered bank is subject to the following conditions:
1. That the Banking Group complies with the following requirements:
• Capital of the Banking Group is not less than 8% of risk weighted exposures.
• Tier One Capital of the Banking Group is not less than 4% of risk weighted exposures.
• Capital of the Banking Group is not less than NZ$15m.
2. That the business of the Banking Group consists of, or substantially consists of, the borrowing and lending of money, or the provision of otherfinancial services, or both.
3. That aggregate credit exposures (net of specific provisions and gross of set-off) of the Banking Group to all connected persons do not exceed75% of the Banking Group’s Tier One Capital and that, within this limit, aggregate credit exposures (net of specific provisions and gross of set-off) to non-bank connected persons do not exceed 15% of the Banking Group’s Tier One Capital.
4. That the Board of the registered bank contains at least two independent Directors. In this context an independent Director is a Director whois not an employee of the registered bank, and who is not a director, trustee or employee of any holding company of the registered bank otherthan ASB Group (Holdings) Limited, or any other entity capable of controlling or significantly influencing the registered bank.
5. That the chairperson of the Bank’s Board of Directors is not an employee of the registered bank.
6. That the Bank’s constitution does not permit the Bank’s Directors to act in the interests of any holding company of the registered bank, whereto do so would conflict with the interests of the Bank in New Zealand, to the detriment of creditors.
7. That a substantial proportion of the Bank’s business is conducted in and from New Zealand.

ADDITIONAL DISCLOSURES
For the year ended 30 June 2002
52
CREDIT RATING
As at 30 June 2002, the rating of AA- was assigned to the Bank’s long term New Zealand dollar debt. The rating was given by Standard &Poor’s (Australia) Pty Limited.
On 4 October 2000, following Commonwealth Bank of Australia assuming 100% ownership, the Bank’s rating was upgraded from A+ to AA–.
Rating Scale Explanation
AAA Rated entities have an extremely strong capacity to pay interest and repay principal in atimely manner.
AA Rated entities have a very strong capacity to pay interest and repay principal in a timely manner.
A Rated entities have a strong capacity to pay interest and repay principal in a timely manner butmay be more susceptible to adverse effects of changes in circumstances and economicconditions than higher rated entities.
BBB Rated entities have an adequate capacity to pay interest and repay principal in a timely mannerbut are more likely to be weakened by adverse changes in circumstances and economicconditions than higher rated entities.
BB, B, CCC, CC and C Rated entities are regarded as having predominantly speculative characteristics with respect tothe capacity to repay interest and principal. BB indicates the least degree of speculation andC the highest.
D Rated entities are in default. The rating is assigned when interest or principal payments are notmade on the date due or when an insolvency petition or a request to appoint a receiver is filed.
Plus (+) or Minus (–) The ratings from ‘AA’ to ‘CCC’ may be modified by the addition of a plus or minus sign toshow relative standing within the major rating categories.
MARKET RISK EXPOSURE
The Market Risk Methodology is intended to attribute a dollar value amount to the market risk a registered bank is exposed to, based on thestructure of its Balance Sheet positions, using the process prescribed by the Reserve Bank of New Zealand.
The Market Risk Exposures have been prepared on the basis of actual exposures.
Consolidated
2002 2001
Peak Exposure Exposure Peak Exposure Exposurefor the three months as at for the three months as at
$ millions ended 30 June 30 June ended 30 June 30 June
Aggregate Interest Rate Exposure 27.5 26.4 23.3 19.4
(as % of Balance Date Equity) 2.7% 2.6% 2.9% 2.4%
Aggregate Foreign Currency Exposure 3.4 3.4 2.4 2.4
(as % of Balance Date Equity) 0.3% 0.3% 0.3% 0.3%
Aggregate Equity Exposure – – – –
(as % of Balance Date Equity) – – – –

DIRECTORS’ STATEMENT
For the year ended 30 June 2002 ASB BANK LIMITED ANNUAL REPORT
53
After due enquiry by the Directors it is each Director’s opinion that for the year ended 30 June 2002:
• the Bank complied with the conditions imposed by the Reserve Bank of New Zealand under section 74 of the Reserve Bank of NewZealand Act 1989; and
• credit exposures to connected persons were not contrary to the interests of the Banking Group; and
• the Bank had systems in place to adequately monitor and control the Banking Group’s credit risk, concentration of credit risk, interestrate risk, currency risk, equity risk, liquidity risk and other material business risks and that those systems are being properly applied.
After due enquiry by the Directors it is each Director’s opinion that as at the date of this disclosure statement:
• the disclosure statement contains all the information required by the Registered Bank Disclosure Statement (Full and Half-Year –New Zealand Incorporated Registered Banks) Order 1998; and
• the disclosure statement is not false or misleading.
The disclosure statement is signed by or on behalf of all the Directors.
G.J. Judd J.M.R. Syme G.H. Burrett
R. Boven L.G. Cupper G.L. Mackrell
J.A. Hood P.A. Edwards
30 July 2002

AUDITORS’ REPORT
54
Auditor's Report to the Shareholder of ASB Bank Limited (“the Bank”)
We have audited the financial statements and the financial information in the supplementary information on pages 18 to 50and 52. The financial statements provide information about the past financial performance and cash flows of the Bank andthe Bank and its subsidiaries (“Banking Group”) for the year ended 30 June 2002 and their financial position as at that date.The supplementary information contains that information required by clauses 12(3) and 12(4) of the Registered BankDisclosure Statement (Full and Half-Year – New Zealand Incorporated Registered Banks) Order 1998 (the “Order”).This information is stated in accordance with the accounting policies set out on pages 22 to 24.
Directors’ Responsibilities
The directors are responsible for the preparation of:■ financial statements in accordance with clause 12(1) of the Order which give a true and fair view of the financial position
of the Bank and Banking Group as at 30 June 2002 and of their financial performance and cash flows for the year ended
on that date;■ supplementary information in accordance with clause 12(3) of the Order which gives a true and fair view of the matters
to which it relates; and ■ supplementary information in accordance with clause 12(4) of the Order which complies with Schedules 7 and 8 of the Order.
Auditor's Responsibilities
In accordance with clause 15(1) of the Order, it is our responsibility to express an independent opinion on the financialstatements and supplementary information presented by the directors and report our opinion to you.
Basis of Opinion
An audit includes examining, on a test basis, evidence relevant to the amounts and disclosures in the financial statements andsupplementary information. It also includes assessing:■ the significant estimates and judgements made by the directors in the preparation of the financial statements and
supplementary information; and■ whether the accounting policies are appropriate to the Bank and Banking Group’s circumstances, consistently applied and
adequately disclosed.
We conducted our audit in accordance with generally accepted auditing standards in New Zealand. We planned andperformed our audit so as to obtain all the information and explanations which we considered necessary in order to provideus with sufficient evidence to give reasonable assurance that the financial statements and supplementary financialinformation are free from material misstatements, whether caused by fraud or error. In forming our opinion we also evaluatedthe overall adequacy of the presentation of information in the financial statements and supplementary financial information.
We provide some information technology assurance services to the Bank.
Unqualified Opinion
We have obtained all the information and explanations we have required.
In our opinion:■ proper accounting records have been kept by the Bank and Banking Group as far as appears from our examination of
those records; and■ the financial statements on pages 18 to 50:
■ comply with generally accepted accounting practice in New Zealand; and■ give a true and fair view of the financial position of the Bank and Banking Group as at 30 June 2002 and their
financial performance and cash flows for the year ended on that date; and■ the supplementary financial information included within the financial statements has been prepared in accordance with:
■ the guidelines issued pursuant to section 78(3) of the Reserve Bank of New Zealand Act 1989 or any Conditions of
Registration; and■ the books and records of the Bank and Banking Group; and
■ the supplementary financial information disclosed in accordance with clause 12(3) of the Order gives a true and fair view
of the matters to which it relates; and■ the supplementary financial information on page 52 disclosed in accordance with clause 12(4) of the Order complies with
Schedules 7 and 8 of the Order.
Our audit was completed on 30 July 2002 and our unqualified opinion is expressed as at that date.
Ernst and Young Chartered Accountants
Auckland, New Zealand
E

Directors
CHAIRMAN
G.J. (Gary) Judd Q.C., LL.B (Hons), F.Inst.D.
BARRISTER
Auckland, New Zealand
DEPUTY CHAIRMAN
J.M.R. (Jim) Syme B.Com., F.A.C.A., C.M.A.
COMPANY DIRECTOR
Auckland, New Zealand
MANAGING DIRECTOR
G.H. (Hugh) BurrettBANK EXECUTIVE
Auckland, New Zealand
R. (Rick) Boven B.A. (Hons), M.A., M.B.A.
MANAGEMENT CONSULTANT
Auckland, New Zealand
L.G. (Les) Cupper B.Econ. (Hons), M.Econ., Dip.Ed.
BANK EXECUTIVE
Sydney, Australia
P.A. (Patrick) Edwards F.C.C.A., M.C.T., F.F.T.P.
BANK EXECUTIVE
Sydney, Australia
J.A. (John) Hood B.E. (Hons), PhD (Auckland), M.Phil (Oxf)
VICE-CHANCELLOR
Auckland, New Zealand
G.L. (Garry) Mackrell B.Sc., B.Econ. (Hons), M.Com.
BANK EXECUTIVE
Sydney, Australia
EXECUTIVE MANAGEMENT
G.H. (Hugh) BurrettMANAGING DIRECTOR AND CHIEF EXECUTIVE OFFICER
B.J. (Barbara) Chapman HEAD OF RETAIL BANKING AND MARKETING
J.W. (John) DuncanGROUP GENERAL MANAGER, FINANCIAL AND RISK MANAGEMENT
P.S. (Peter) Hall HEAD OF INSTITUTIONAL BANKING,
TREASURY AND ASB SECURITIES
J.S.N. (James) MitchellHEAD OF RELATIONSHIP BANKING AND FINANCIAL SERVICES
C.G. (Clayton) WakefieldGROUP GENERAL MANAGER,
TECHNOLOGY, OPERATIONS AND PROPERTY
L.A. (Linley) WoodHEAD OF OFFICE OF THE CEO
Advisors
AUDITORS
Ernst & YoungChartered Accountants41 Shortland StreetAucklandNew Zealand
ULTIMATE SHAREHOLDER
Commonwealth Bank of Australia48 Martin PlaceSydney, NSWAustralia
REGISTERED OFFICE
Level 28ASB Bank Centre135 Albert StreetAucklandNew Zealand

NOTES


Personal Business Rural International Institutional Investment Insurance Share Trading


