Persisting Regional Disparities in Modern Contraceptive...
10
Research Article Persisting Regional Disparities in Modern Contraceptive Use and Unmet Need for Contraception among Nigerian Women Chao Wang and Huimin Cao e School of Public Policy and Management, China University of Mining and Technology, Xuzhou , Jiangsu, China Correspondence should be addressed to Huimin Cao; [email protected] Received 5 November 2018; Revised 4 January 2019; Accepted 14 January 2019; Published 18 February 2019 Academic Editor: Lucia Lopalco Copyright © 2019 Chao Wang and Huimin Cao. is is an open access article distributed under the Creative Commons Attribution License, which permits unrestricted use, distribution, and reproduction in any medium, provided the original work is properly cited. Background. Evidence suggests that equitable provision of contraceptive services can help women achieve their reproductive goals and has significant impact on reducing the rates abortion and unintended pregnancy at large. However, regional disparities continue to persist on top of low family planning prevalence which is a critical public health challenge for fast growing populations like Nigeria. Objectives. e present study aimed to explore the prevalence of (1) nonuse of modern contraceptives, (2) unmet need for contraception, and (3) regional disparities in these two. Methods. e present study used cross-sectional data obtained from the Nigeria Demographic and Health Surveys conducted in 2003, 2008, and 2013. Participants were women of reproductive of age (15-49 years) regardless of marital status. Regional disparities of nonuse of modern contraceptives and unmet need were analysed by descriptive and multivariate regression methods. Results. In the pooled sample of 79,656 participants during 2003, 2008, and 2013, 88.6% reported not using any modern methods, and 13.5% reported having unmet need for contraception. e prevalence rates of nonuse were, respectively, 91.8%, 90.6%, and 88.6% and those of unmet need were 14.2%, 16.6%, and 13.5% in the years 2003, 2008, and 2013. Significant differences were observed in the odds of reporting nonuse and unmet need for contraception across the geopolitical zones. Conclusions. e rates of nonuse of contraception are remarkably high among women in Nigeria with significant disparities across the six geopolitical zones. Efforts should be made to address the regional disparities in order to achieve the goals of universal coverage of family planning services in the country. 1. Introduction Modern contraceptive use has been widely acknowledged to be one of the most cost-effective strategies for pro- moting reproductive health and fostering socioeconomic development globally [1]. Beyond preventing unintended pregnancies and thereby reducing the risk of unsafe abor- tions and maternal mortality, fertility regulation enabled by modern contraceptive use also contributes significantly to increasing women’s access to educational and empowerment opportunities [2]. In order to promote reproductive rights and gender equality, the need to improve uptake of modern contraceptive methods has been consistently reiterated in the last few decades [3, 4]. Worldwide, contraceptive prevalence among women married or in-union women aged 15 to 49 years increased from 55% in 1990 to 64% in 2015. However, wide variations in contraceptive use exist across countries, with developing countries lagging significantly in this regard [5]. Current estimates indicate that 214 million women in developing countries who wish to avoid pregnancy are currently not using a modern contraceptive method [6]. Women with unmet need for modern contraception account for 84% of unintended (mistimed or unwanted) pregnancies in develop- ing countries [7]. Nonuse of modern contraceptives is highest in sub-Saharan Africa (SSA), with the region accounting for 21% of the global burden of unmet need for modern contra- ception. is is worrisome as 25% of unwanted pregnancies end with abortions and 3 out of 4 abortions occurring in SSA are unsafe [8, 9]. Within the background of restrictive abortion laws, suboptimal access to maternal health services, and high burden of maternal mortality in many sub-Saharan African countries including Nigeria [10], low contraceptive prevalence represents a major public health challenge in the region that requires urgent and effective solutions. Hindawi BioMed Research International Volume 2019, Article ID 9103928, 9 pages https://doi.org/10.1155/2019/9103928
Transcript of Persisting Regional Disparities in Modern Contraceptive...
Research ArticlePersisting Regional Disparities in Modern Contraceptive Useand Unmet Need for Contraception among Nigerian Women
ChaoWang and Huimin Cao
�e School of Public Policy and Management, China University of Mining and Technology, Xuzhou 221116, Jiangsu, China
Correspondence should be addressed to Huimin Cao; [email protected]
Received 5 November 2018; Revised 4 January 2019; Accepted 14 January 2019; Published 18 February 2019
Academic Editor: Lucia Lopalco
Copyright © 2019 ChaoWang andHuimin Cao.This is an open access article distributed under the Creative Commons AttributionLicense,whichpermits unrestricteduse, distribution, and reproduction in anymedium, provided the original work is properly cited.
Background. Evidence suggests that equitable provision of contraceptive services can help women achieve their reproductive goalsandhas significant impact on reducing the rates abortion andunintended pregnancy at large.However, regional disparities continueto persist on top of low family planning prevalence which is a critical public health challenge for fast growing populations likeNigeria. Objectives. The present study aimed to explore the prevalence of (1) nonuse of modern contraceptives, (2) unmet needfor contraception, and (3) regional disparities in these two. Methods. The present study used cross-sectional data obtained fromthe Nigeria Demographic and Health Surveys conducted in 2003, 2008, and 2013. Participants were women of reproductive of age(15-49 years) regardless of marital status. Regional disparities of nonuse of modern contraceptives and unmet need were analysedby descriptive and multivariate regression methods. Results. In the pooled sample of 79,656 participants during 2003, 2008, and2013, 88.6% reported not using any modern methods, and 13.5% reported having unmet need for contraception. The prevalencerates of nonusewere, respectively, 91.8%, 90.6%, and 88.6% and those of unmet need were 14.2%, 16.6%, and 13.5% in the years 2003,2008, and 2013. Significant differences were observed in the odds of reporting nonuse and unmet need for contraception across thegeopolitical zones.Conclusions. The rates of nonuse of contraception are remarkably high among women inNigeria with significantdisparities across the six geopolitical zones. Efforts should be made to address the regional disparities in order to achieve the goalsof universal coverage of family planning services in the country.
1. Introduction
Modern contraceptive use has been widely acknowledgedto be one of the most cost-effective strategies for pro-moting reproductive health and fostering socioeconomicdevelopment globally [1]. Beyond preventing unintendedpregnancies and thereby reducing the risk of unsafe abor-tions and maternal mortality, fertility regulation enabled bymodern contraceptive use also contributes significantly toincreasing women’s access to educational and empowermentopportunities [2]. In order to promote reproductive rightsand gender equality, the need to improve uptake of moderncontraceptive methods has been consistently reiterated in thelast few decades [3, 4].
Worldwide, contraceptive prevalence among womenmarried or in-union women aged 15 to 49 years increasedfrom 55% in 1990 to 64% in 2015. However, wide variationsin contraceptive use exist across countries, with developing
countries lagging significantly in this regard [5]. Currentestimates indicate that 214 million women in developingcountries who wish to avoid pregnancy are currently notusing a modern contraceptive method [6]. Women withunmet need for modern contraception account for 84% ofunintended (mistimed or unwanted) pregnancies in develop-ing countries [7]. Nonuse ofmodern contraceptives is highestin sub-Saharan Africa (SSA), with the region accounting for21% of the global burden of unmet need for modern contra-ception. This is worrisome as 25% of unwanted pregnanciesend with abortions and 3 out of 4 abortions occurring inSSA are unsafe [8, 9]. Within the background of restrictiveabortion laws, suboptimal access to maternal health services,and high burden of maternal mortality in many sub-SaharanAfrican countries including Nigeria [10], low contraceptiveprevalence represents a major public health challenge in theregion that requires urgent and effective solutions.
HindawiBioMed Research InternationalVolume 2019, Article ID 9103928, 9 pageshttps://doi.org/10.1155/2019/9103928
2 BioMed Research International
The need to ensure universal access to modern contra-ception is particularly acute in Nigeria, where populationcontrol and women empowerment are crucial for achievingsustainable development [10–12]. Although trends reveal thatNigerian women are increasingly participating in educationand workforce, delaying marriage and childbearing, andexpressing desire to space and limit childbirths in the last fewdecades, studies report that the total fertility rate in Nigeriahas declined marginally, from 5.7 in 2003 to 5.5 in 2013 [10,13–16]. This suggests that nonuse of modern contraceptiveremains a problem inNigeria that limits women from achiev-ing their reproductive desires and socioeconomic aspirations.Additionally, research indicates that modern contraceptivesuse is lowest among women in the least developed partsof Nigeria, where early marriages and low female literacylevels are also rife and only a small proportion of womenutilize maternal health care services [14–16]. Thus, regionaldisparities in contraceptive use result in further deprivationamong women who are already grappling with multipledimensions of health and socioeconomic disadvantage.
The Nigerian Government is partnering with donoragencies to intensify media campaigns to drive demand forcontraceptives and strengthen the supply of family planningcommodities at primary health care facilities at no cost towomen [15, 17–20]. While it is hoped that these interventionswill accelerate the achievement of the targeted 36% contra-ceptive prevalence rate by 2018, evidence suggests that thecountry has recorded marginal progress and is still a longway from this goal [14]. The current situation underscoresthe need to intensify efforts to increase uptake of moderncontraceptives in Nigeria. However, significant progress isunlikely to occur if regional equity gaps are not effectivelyaddressed. Although contraceptive prevalence in Nigeria hasreceived a lot of focus, the persistence of regional disparitiesin uptake of modern contraceptives appears to have garneredinsufficient attention. This paper is aimed at the exploringtrends in regional disparities in the prevalence of nonuse ofmodern contraceptive methods and unmet need for moderncontraception in Nigeria.
2. Methods
2.1. Data Collection. Data for this study were derived fromthree rounds of Demographic and Health Survey in Nigeriaconducted in 2003, 2008, and 2013. InNigeria, the surveys areimplemented by theNational Population Commission (NPC)with the financial and technical assistance from ICF Inter-national provisioned through the USAID-fundedMEASUREDHSprogram.DHS surveys are nationally representative thatcollect information on a wide range of public health relatedtopics such as anthropometric, demographic, socioeconomic,family planning, and domestic violence to name a few.The survey covered men and women aged between 15 and49 years and under-5 children residing in noninstitutionalsettings [21]. For sampling, a three-staged stratified clusterdesign was employed which was based on a list enumerationareas (EAs) from the 2006 Population Census of the FederalRepublic of Nigeria. EAs are systematically selected units
from the localities, which constitute the local governmentareas (LGAs). LGAs are subdivisions of each of the 36administrative states (including the Federal Capital Territorycalled Abuja) and classified under six developmental zones inthe country. EAs were used to form the survey clusters calledprimary sampling units. Amore detailed version of the surveywas published elsewhere [22].
2.2. Study Variables. Outcome variable was prevalence ofmodern contraceptive use and unmet need for contraception.Unmet need for contraception was categorized dichoto-mously as ‘Yes’ if the respondent reported having unmet needand ‘No’ if reported otherwise.
Independent variables of primary interest were regionaldisparity in modern contraceptive use. NDHS survey pro-vided two such indicators: (1) type of place of residence(urban/rural) and (2) geopolitical region (north-central/north-east/north-west/south-east/south-south/south-west).
To adjust the analysis for potential confounders, thefollowing variables were included based on their theoreticalrelevance to the outcome variable:
Age: 15-19/20-24/25-29/30-34/35-39/40-44/45-49; mar-ital status: in union/widowed/other; religious affiliation:Christian/Islam, others; educational attainment: nil/primary/secondary/higher; employed: yes/no; wealth index: poor-est/poorer/middle/richer/richest; sex of household head:male/female; parity: nullipara/primipara/multipara; historyof abortion: no/yes.
For the calculation household wealth status, insteadof direct income the volume of durable goods (e.g., TV,radio, and bicycle) possessed by the household and housingquality (e.g., type of floor, wall, and roof) are taken intoconsideration. Each item is assigned a factor score generatedthrough principal component analysis (PCA) which arethen summed and standardized for the households. Thesestandardized scores place the households in a continuousscale based on relative wealth scores. The scores are thusobtained from a continuous scale and subsequently catego-rized into quintiles to rank the household as poorest/poorer/middle/richer/richest to richest [23].
2.3. Data Analysis. All analyses were performed with SPSSVersion 24 for Windows. To adjust for the cluster samplingtechniques of the surveys we used complex survey modulefor all analysis by accounting for primary sampling units,sample strata, and sample weight. Following that, descrip-tive analyses were carried out to calculate the prevalencerates of contraceptive use and of unmet need. Chi-squaretests were performed to examine the bivariate associationbetween the two outcome variables and the explanatoryvariables. Variables that were found to be significant atalpha 5% were entered into regression analysis. Two setsof binary logistic regression models were carried out tocalculate the odds ratios of the association between con-traceptive nonuse and unmet need for contraception whileadjusting for the sociodemographic variables. The level ofsignificance was set at alpha 5% for the regression mod-els.
BioMed Research International 3
2.3.1. Ethical Consideration. Before taking part in the inter-view, all participants gave informed consent to the surveyors.DHS surveys are also approved by ICF International as wellas an Institutional Review Board (IRB) in the host country tomake sure that the protocols are in compliance with the U.S.Department of Health and Human Services regulations forthe protection of human subjects.
3. Result
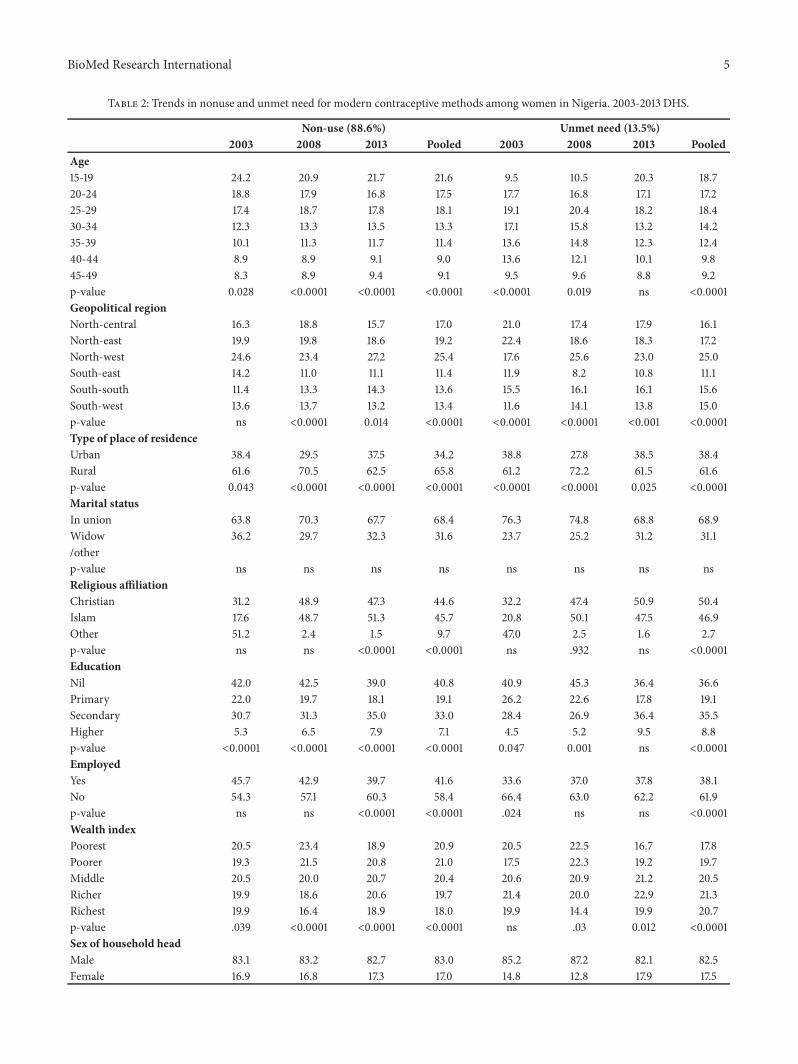
3.1. Descriptive Statistics. Thebasic sociodemographic profileof the sample population for last three DHS surveys con-ducted in Nigeria was presented in Table 1. Rate of participa-tion was highest for 2013 with most of the women belongingto the youngest age group of 15 to 19 years and averagingbelow 30, originating from the north-west developmentalregion, being rural residents, currently in union, followersof Christian faith, and having no formal education. Morethan half of the women were currently unemployed and wereliving in the richer to richest households (except for in 2008).Percentages of female headed households are quite low witha slow but steady increase over the last decade (16.3% in2003 versus 18.3% in 2013). The prevalence of nulliparityin 2013 (29.5%) was slightly higher than in 2008 (28.9),however lower compared to 2003 level (32.5%), while thatof multiparity rose from 56% in 2003 to 60.2% in 2008, butfell marginally to 59.2% in 2013. The prevalence of abortionhas declined by 3.9% during the same period (14.5% in 2003versus 10.6% in 2013).
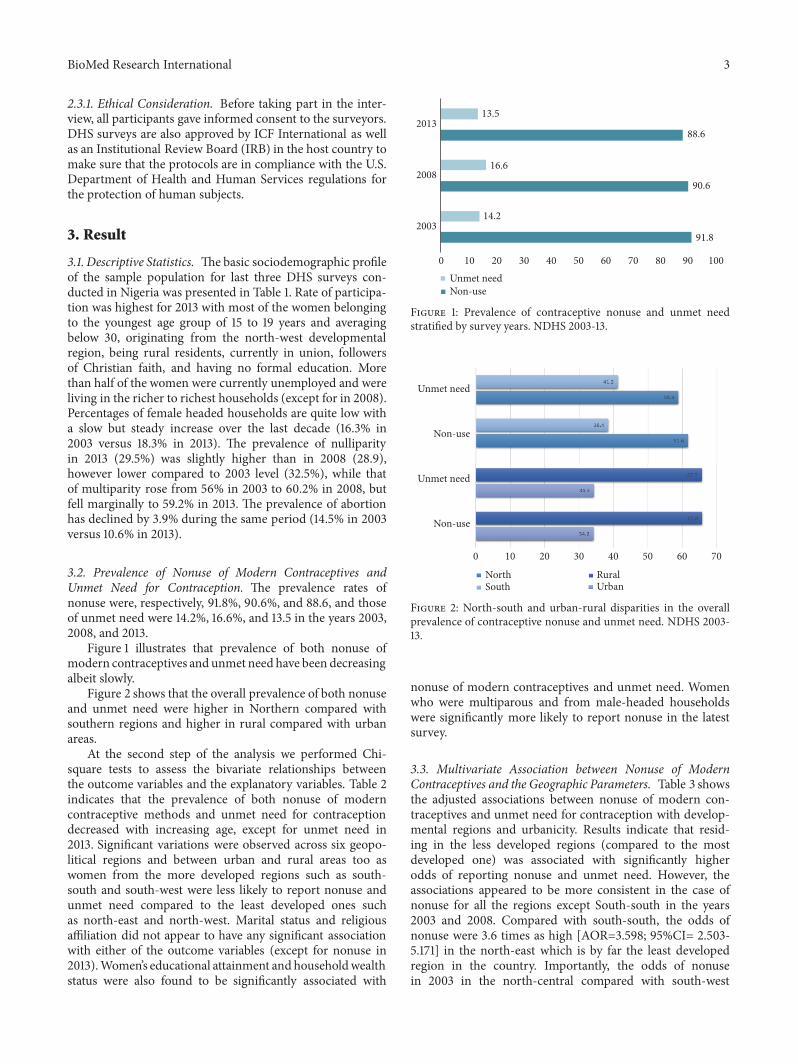
3.2. Prevalence of Nonuse of Modern Contraceptives andUnmet Need for Contraception. The prevalence rates ofnonuse were, respectively, 91.8%, 90.6%, and 88.6, and thoseof unmet need were 14.2%, 16.6%, and 13.5 in the years 2003,2008, and 2013.
Figure 1 illustrates that prevalence of both nonuse ofmodern contraceptives and unmet need have been decreasingalbeit slowly.
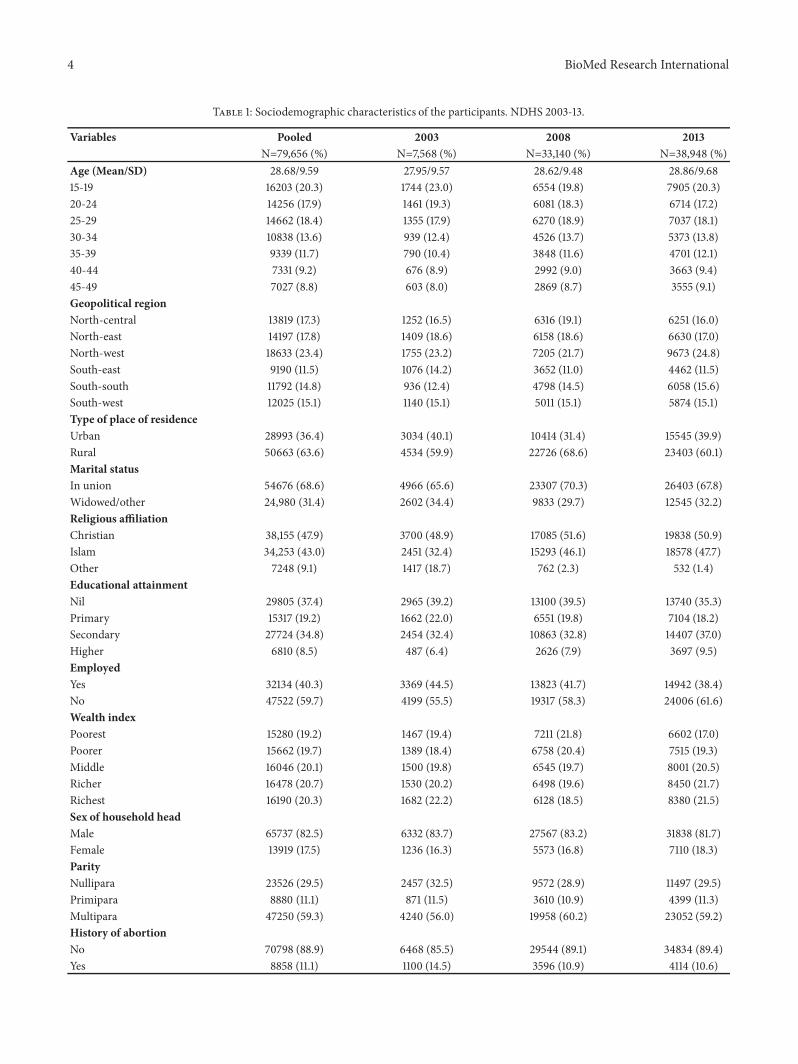
Figure 2 shows that the overall prevalence of both nonuseand unmet need were higher in Northern compared withsouthern regions and higher in rural compared with urbanareas.
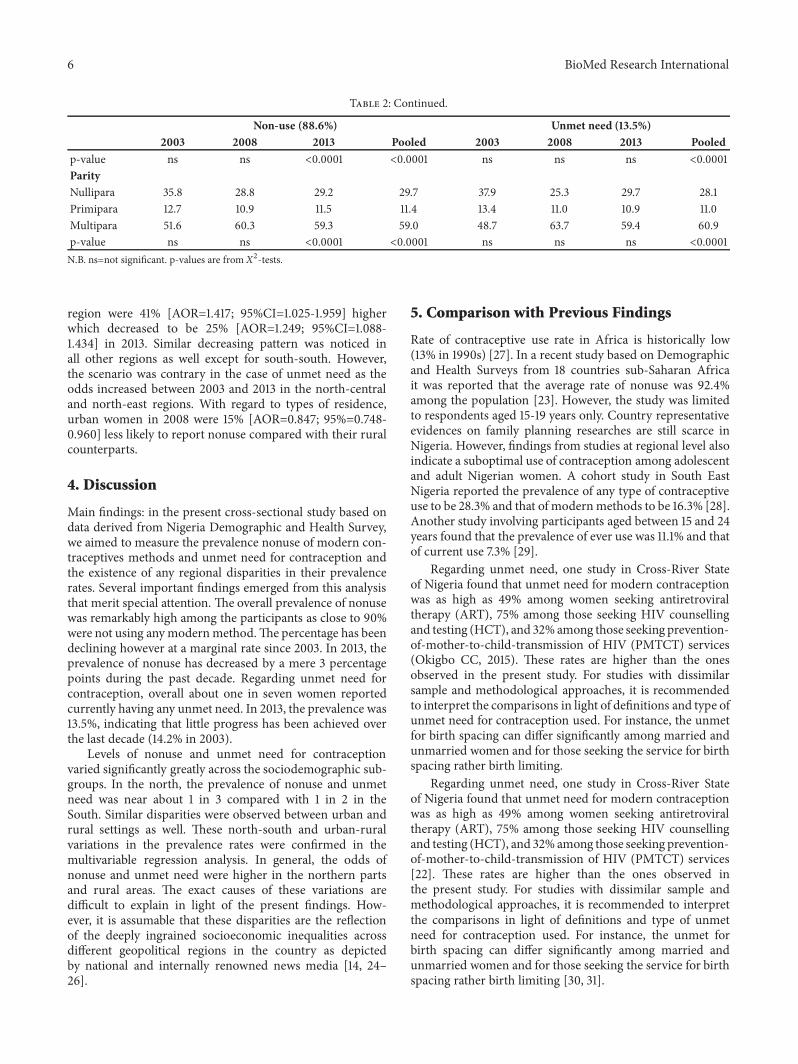
At the second step of the analysis we performed Chi-square tests to assess the bivariate relationships betweenthe outcome variables and the explanatory variables. Table 2indicates that the prevalence of both nonuse of moderncontraceptive methods and unmet need for contraceptiondecreased with increasing age, except for unmet need in2013. Significant variations were observed across six geopo-litical regions and between urban and rural areas too aswomen from the more developed regions such as south-south and south-west were less likely to report nonuse andunmet need compared to the least developed ones suchas north-east and north-west. Marital status and religiousaffiliation did not appear to have any significant associationwith either of the outcome variables (except for nonuse in2013).Women’s educational attainment and householdwealthstatus were also found to be significantly associated with
91.8
90.6
88.6
14.2
16.6
13.5
0 10 20 30 40 50 60 70 80 90 100
2003
2008
2013
Unmet needNon-use
Figure 1: Prevalence of contraceptive nonuse and unmet needstratified by survey years. NDHS 2003-13.
Unmet need
Non-use
Unmet need
Non-use
0 10 20 30 40 50 60 70
NorthSouth
RuralUrban
Figure 2: North-south and urban-rural disparities in the overallprevalence of contraceptive nonuse and unmet need. NDHS 2003-13.
nonuse of modern contraceptives and unmet need. Womenwho were multiparous and from male-headed householdswere significantly more likely to report nonuse in the latestsurvey.
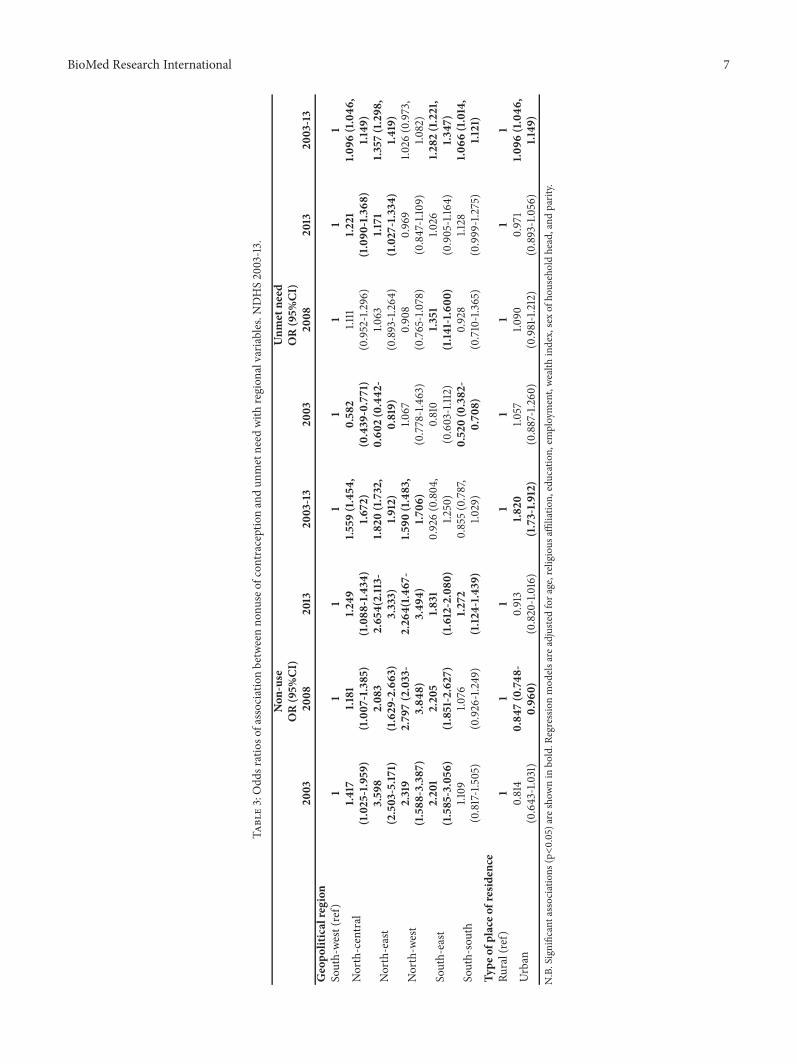
3.3. Multivariate Association between Nonuse of ModernContraceptives and the Geographic Parameters. Table 3 showsthe adjusted associations between nonuse of modern con-traceptives and unmet need for contraception with develop-mental regions and urbanicity. Results indicate that resid-ing in the less developed regions (compared to the mostdeveloped one) was associated with significantly higherodds of reporting nonuse and unmet need. However, theassociations appeared to be more consistent in the case ofnonuse for all the regions except South-south in the years2003 and 2008. Compared with south-south, the odds ofnonuse were 3.6 times as high [AOR=3.598; 95%CI= 2.503-5.171] in the north-east which is by far the least developedregion in the country. Importantly, the odds of nonusein 2003 in the north-central compared with south-west
4 BioMed Research International
Table 1: Sociodemographic characteristics of the participants. NDHS 2003-13.
Variables Pooled 2003 2008 2013N=79,656 (%) N=7,568 (%) N=33,140 (%) N=38,948 (%)
Age (Mean/SD) 28.68/9.59 27.95/9.57 28.62/9.48 28.86/9.6815-19 16203 (20.3) 1744 (23.0) 6554 (19.8) 7905 (20.3)20-24 14256 (17.9) 1461 (19.3) 6081 (18.3) 6714 (17.2)25-29 14662 (18.4) 1355 (17.9) 6270 (18.9) 7037 (18.1)30-34 10838 (13.6) 939 (12.4) 4526 (13.7) 5373 (13.8)35-39 9339 (11.7) 790 (10.4) 3848 (11.6) 4701 (12.1)40-44 7331 (9.2) 676 (8.9) 2992 (9.0) 3663 (9.4)45-49 7027 (8.8) 603 (8.0) 2869 (8.7) 3555 (9.1)Geopolitical regionNorth-central 13819 (17.3) 1252 (16.5) 6316 (19.1) 6251 (16.0)North-east 14197 (17.8) 1409 (18.6) 6158 (18.6) 6630 (17.0)North-west 18633 (23.4) 1755 (23.2) 7205 (21.7) 9673 (24.8)South-east 9190 (11.5) 1076 (14.2) 3652 (11.0) 4462 (11.5)South-south 11792 (14.8) 936 (12.4) 4798 (14.5) 6058 (15.6)South-west 12025 (15.1) 1140 (15.1) 5011 (15.1) 5874 (15.1)Type of place of residenceUrban 28993 (36.4) 3034 (40.1) 10414 (31.4) 15545 (39.9)Rural 50663 (63.6) 4534 (59.9) 22726 (68.6) 23403 (60.1)Marital statusIn union 54676 (68.6) 4966 (65.6) 23307 (70.3) 26403 (67.8)Widowed/other 24,980 (31.4) 2602 (34.4) 9833 (29.7) 12545 (32.2)Religious affiliationChristian 38,155 (47.9) 3700 (48.9) 17085 (51.6) 19838 (50.9)Islam 34,253 (43.0) 2451 (32.4) 15293 (46.1) 18578 (47.7)Other 7248 (9.1) 1417 (18.7) 762 (2.3) 532 (1.4)Educational attainmentNil 29805 (37.4) 2965 (39.2) 13100 (39.5) 13740 (35.3)Primary 15317 (19.2) 1662 (22.0) 6551 (19.8) 7104 (18.2)Secondary 27724 (34.8) 2454 (32.4) 10863 (32.8) 14407 (37.0)Higher 6810 (8.5) 487 (6.4) 2626 (7.9) 3697 (9.5)EmployedYes 32134 (40.3) 3369 (44.5) 13823 (41.7) 14942 (38.4)No 47522 (59.7) 4199 (55.5) 19317 (58.3) 24006 (61.6)Wealth indexPoorest 15280 (19.2) 1467 (19.4) 7211 (21.8) 6602 (17.0)Poorer 15662 (19.7) 1389 (18.4) 6758 (20.4) 7515 (19.3)Middle 16046 (20.1) 1500 (19.8) 6545 (19.7) 8001 (20.5)Richer 16478 (20.7) 1530 (20.2) 6498 (19.6) 8450 (21.7)Richest 16190 (20.3) 1682 (22.2) 6128 (18.5) 8380 (21.5)Sex of household headMale 65737 (82.5) 6332 (83.7) 27567 (83.2) 31838 (81.7)Female 13919 (17.5) 1236 (16.3) 5573 (16.8) 7110 (18.3)ParityNullipara 23526 (29.5) 2457 (32.5) 9572 (28.9) 11497 (29.5)Primipara 8880 (11.1) 871 (11.5) 3610 (10.9) 4399 (11.3)Multipara 47250 (59.3) 4240 (56.0) 19958 (60.2) 23052 (59.2)History of abortionNo 70798 (88.9) 6468 (85.5) 29544 (89.1) 34834 (89.4)Yes 8858 (11.1) 1100 (14.5) 3596 (10.9) 4114 (10.6)
BioMed Research International 5
Table 2: Trends in nonuse and unmet need for modern contraceptive methods among women in Nigeria. 2003-2013 DHS.
Non-use (88.6%) Unmet need (13.5%)2003 2008 2013 Pooled 2003 2008 2013 Pooled
Age15-19 24.2 20.9 21.7 21.6 9.5 10.5 20.3 18.720-24 18.8 17.9 16.8 17.5 17.7 16.8 17.1 17.225-29 17.4 18.7 17.8 18.1 19.1 20.4 18.2 18.430-34 12.3 13.3 13.5 13.3 17.1 15.8 13.2 14.235-39 10.1 11.3 11.7 11.4 13.6 14.8 12.3 12.440-44 8.9 8.9 9.1 9.0 13.6 12.1 10.1 9.845-49 8.3 8.9 9.4 9.1 9.5 9.6 8.8 9.2p-value 0.028 <0.0001 <0.0001 <0.0001 <0.0001 0.019 ns <0.0001Geopolitical regionNorth-central 16.3 18.8 15.7 17.0 21.0 17.4 17.9 16.1North-east 19.9 19.8 18.6 19.2 22.4 18.6 18.3 17.2North-west 24.6 23.4 27.2 25.4 17.6 25.6 23.0 25.0South-east 14.2 11.0 11.1 11.4 11.9 8.2 10.8 11.1South-south 11.4 13.3 14.3 13.6 15.5 16.1 16.1 15.6South-west 13.6 13.7 13.2 13.4 11.6 14.1 13.8 15.0p-value ns <0.0001 0.014 <0.0001 <0.0001 <0.0001 <0.001 <0.0001Type of place of residenceUrban 38.4 29.5 37.5 34.2 38.8 27.8 38.5 38.4Rural 61.6 70.5 62.5 65.8 61.2 72.2 61.5 61.6p-value 0.043 <0.0001 <0.0001 <0.0001 <0.0001 <0.0001 0.025 <0.0001Marital statusIn union 63.8 70.3 67.7 68.4 76.3 74.8 68.8 68.9Widow 36.2 29.7 32.3 31.6 23.7 25.2 31.2 31.1/otherp-value ns ns ns ns ns ns ns nsReligious affiliationChristian 31.2 48.9 47.3 44.6 32.2 47.4 50.9 50.4Islam 17.6 48.7 51.3 45.7 20.8 50.1 47.5 46.9Other 51.2 2.4 1.5 9.7 47.0 2.5 1.6 2.7p-value ns ns <0.0001 <0.0001 ns .932 ns <0.0001EducationNil 42.0 42.5 39.0 40.8 40.9 45.3 36.4 36.6Primary 22.0 19.7 18.1 19.1 26.2 22.6 17.8 19.1Secondary 30.7 31.3 35.0 33.0 28.4 26.9 36.4 35.5Higher 5.3 6.5 7.9 7.1 4.5 5.2 9.5 8.8p-value <0.0001 <0.0001 <0.0001 <0.0001 0.047 0.001 ns <0.0001EmployedYes 45.7 42.9 39.7 41.6 33.6 37.0 37.8 38.1No 54.3 57.1 60.3 58.4 66.4 63.0 62.2 61.9p-value ns ns <0.0001 <0.0001 .024 ns ns <0.0001Wealth indexPoorest 20.5 23.4 18.9 20.9 20.5 22.5 16.7 17.8Poorer 19.3 21.5 20.8 21.0 17.5 22.3 19.2 19.7Middle 20.5 20.0 20.7 20.4 20.6 20.9 21.2 20.5Richer 19.9 18.6 20.6 19.7 21.4 20.0 22.9 21.3Richest 19.9 16.4 18.9 18.0 19.9 14.4 19.9 20.7p-value .039 <0.0001 <0.0001 <0.0001 ns .03 0.012 <0.0001Sex of household headMale 83.1 83.2 82.7 83.0 85.2 87.2 82.1 82.5Female 16.9 16.8 17.3 17.0 14.8 12.8 17.9 17.5
6 BioMed Research International
Table 2: Continued.
Non-use (88.6%) Unmet need (13.5%)2003 2008 2013 Pooled 2003 2008 2013 Pooled
p-value ns ns <0.0001 <0.0001 ns ns ns <0.0001ParityNullipara 35.8 28.8 29.2 29.7 37.9 25.3 29.7 28.1Primipara 12.7 10.9 11.5 11.4 13.4 11.0 10.9 11.0Multipara 51.6 60.3 59.3 59.0 48.7 63.7 59.4 60.9p-value ns ns <0.0001 <0.0001 ns ns ns <0.0001N.B. ns=not significant. p-values are from X2-tests.
region were 41% [AOR=1.417; 95%CI=1.025-1.959] higherwhich decreased to be 25% [AOR=1.249; 95%CI=1.088-1.434] in 2013. Similar decreasing pattern was noticed inall other regions as well except for south-south. However,the scenario was contrary in the case of unmet need as theodds increased between 2003 and 2013 in the north-centraland north-east regions. With regard to types of residence,urban women in 2008 were 15% [AOR=0.847; 95%=0.748-0.960] less likely to report nonuse compared with their ruralcounterparts.
4. Discussion
Main findings: in the present cross-sectional study based ondata derived from Nigeria Demographic and Health Survey,we aimed to measure the prevalence nonuse of modern con-traceptives methods and unmet need for contraception andthe existence of any regional disparities in their prevalencerates. Several important findings emerged from this analysisthat merit special attention. The overall prevalence of nonusewas remarkably high among the participants as close to 90%were not using anymodernmethod.The percentage has beendeclining however at a marginal rate since 2003. In 2013, theprevalence of nonuse has decreased by a mere 3 percentagepoints during the past decade. Regarding unmet need forcontraception, overall about one in seven women reportedcurrently having any unmet need. In 2013, the prevalence was13.5%, indicating that little progress has been achieved overthe last decade (14.2% in 2003).
Levels of nonuse and unmet need for contraceptionvaried significantly greatly across the sociodemographic sub-groups. In the north, the prevalence of nonuse and unmetneed was near about 1 in 3 compared with 1 in 2 in theSouth. Similar disparities were observed between urban andrural settings as well. These north-south and urban-ruralvariations in the prevalence rates were confirmed in themultivariable regression analysis. In general, the odds ofnonuse and unmet need were higher in the northern partsand rural areas. The exact causes of these variations aredifficult to explain in light of the present findings. How-ever, it is assumable that these disparities are the reflectionof the deeply ingrained socioeconomic inequalities acrossdifferent geopolitical regions in the country as depictedby national and internally renowned news media [14, 24–26].
5. Comparison with Previous Findings
Rate of contraceptive use rate in Africa is historically low(13% in 1990s) [27]. In a recent study based on Demographicand Health Surveys from 18 countries sub-Saharan Africait was reported that the average rate of nonuse was 92.4%among the population [23]. However, the study was limitedto respondents aged 15-19 years only. Country representativeevidences on family planning researches are still scarce inNigeria. However, findings from studies at regional level alsoindicate a suboptimal use of contraception among adolescentand adult Nigerian women. A cohort study in South EastNigeria reported the prevalence of any type of contraceptiveuse to be 28.3% and that of modernmethods to be 16.3% [28].Another study involving participants aged between 15 and 24years found that the prevalence of ever use was 11.1% and thatof current use 7.3% [29].
Regarding unmet need, one study in Cross-River Stateof Nigeria found that unmet need for modern contraceptionwas as high as 49% among women seeking antiretroviraltherapy (ART), 75% among those seeking HIV counsellingand testing (HCT), and 32% among those seeking prevention-of-mother-to-child-transmission of HIV (PMTCT) services(Okigbo CC, 2015). These rates are higher than the onesobserved in the present study. For studies with dissimilarsample and methodological approaches, it is recommendedto interpret the comparisons in light of definitions and type ofunmet need for contraception used. For instance, the unmetfor birth spacing can differ significantly among married andunmarried women and for those seeking the service for birthspacing rather birth limiting.
Regarding unmet need, one study in Cross-River Stateof Nigeria found that unmet need for modern contraceptionwas as high as 49% among women seeking antiretroviraltherapy (ART), 75% among those seeking HIV counsellingand testing (HCT), and 32% among those seeking prevention-of-mother-to-child-transmission of HIV (PMTCT) services[22]. These rates are higher than the ones observed inthe present study. For studies with dissimilar sample andmethodological approaches, it is recommended to interpretthe comparisons in light of definitions and type of unmetneed for contraception used. For instance, the unmet forbirth spacing can differ significantly among married andunmarried women and for those seeking the service for birthspacing rather birth limiting [30, 31].
BioMed Research International 7
Table3:Odd
sratioso
fassociatio
nbetweenno
nuseof
contraceptionandun
metneed
with
region
alvaria
bles.N
DHS2003-13.
Non
-use
Unm
etne
edOR(95%
CI)
OR(95%
CI)
2003
2008
2013
2003-13
2003
2008
2013
2003-13
Geopo
liticalregion
South-we
st(ref)
11
11
11
11
North-central
1.417
(1.025-1.959
)1.1
81(1.007
-1.385)
1.249
(1.088
-1.434
)1.5
59(1.454
,1.6
72)
0.58
2(0.439
-0.771)
1.111
(0.952-1.296)
1.221
(1.090
-1.368
)1.0
96(1.046
,1.149
)
North-east
3.59
8(2.503-5.17
1)2.08
3(1.629
-2.663
)2.65
4(2.113-
3.333)
1.820
(1.732,
1.912)
0.60
2(0.442
-0.819)
1.063
(0.893-1.264
)1.1
71(1.027-1.334
)1.3
57(1.298
,1.4
19)
North-w
est
2.319
(1.588
-3.387
)2.79
7(2.033-
3.84
8)2.26
4(1.4
67-
3.49
4)1.5
90(1.483,
1.706
)1.0
67(0.778-1.463)
0.908
(0.76
5-1.0
78)
0.969
(0.847-1.10
9)1.0
26(0.973,
1.082)
South-east
2.20
1(1.585-3.056
)2.20
5(1.851-2.627)
1.831
(1.612-2.080
)0.926(0.804
,1.2
50)
0.810
(0.603-1.112)
1.351
(1.14
1-1.6
00)
1.026
(0.905-1.16
4)1.2
82(1.221,
1.347
)
South-south
1.109
(0.817-1.505)
1.076
(0.926-1.249)
1.272
(1.12
4-1.4
39)
0.855(
0.787,
1.029)
0.520(0.382
-0.70
8)0.928
(0.710-1.365)
1.128
(0.999-1.275)
1.066
(1.014,
1.121)
Type
ofplaceo
fresiden
ceRu
ral(ref)
11
11
11
11
Urban
0.814
(0.643-1.031)
0.84
7(0.748
-0.96
0)0.913
(0.820-1.016)
1.820
(1.73-1.9
12)
1.057
(0.887-1.260
)1.0
90(0.981-1.212)
0.971
(0.893-1.056)
1.096
(1.046
,1.149
)N.B.Significantassociatio
ns(p<0.05)are
show
nin
bold.R
egressionmod
elsare
adjuste
dfora
ge,religious
affiliatio
n,education,
employment,we
alth
index,sexof
householdhead,and
parity.
8 BioMed Research International
Current evidence based on regional disparities in con-traceptive use and unmet need is insufficient and inclusiveto make critical comparisons. Although concrete statisticsare not available, several of the previous studies on familyplanning and maternal healthcare programs in Nigeria havementioned the existence of regional disparities [32, 33]. Acommon finding is that residents of the Southern regionaland urban setting aremore likely to adhere to family planningservices and less likely to have unmet needs of contraception.Although, the findings of the present study cannot confirmany causal effect, given the present scenario it is howeverassumable that addressing the north-south and urban-ruralgap holds certain potential to promote contraceptive use andother family planning services in the country.
6. Recommendation for Policy Action andFuture Researches
The findings of the present analysis have important implica-tions for policy making. With one of the fastest growing pop-ulation and having high fertility rate, Nigerian Governmenthas shown strong commitments to control population growthand improve reproductive healthcare services. Nigeria alsoranks high among the countries with highmaternal mortalityrateswhichmakes it an urgent imperative to increase researchand development investments on family planning and othercore maternal healthcare services. Evidence shows that thesocioeconomic gap in the use of maternal healthcare serviceshas been decreasing slowly; however, significant regionaldisparities continue to persist in the provision and useof family planning services. Our findings further supportthe need for strengthening political efforts to resolve thegeopolitical issues for promoting the use of family planningservices in the country. Identifying the causes of regionaldiscrimination was not within the scope of the present study,and therefore the needs for further researches to investigatethe sources of disparities and approaches for to resolvingthose are warranted.
7. Strengths and Limitations
The study has several strength and limitations to report.Firstly, the sample size was large and pooled that allowedmeasuring the overall prevalence of contraceptive nonuseand unmet need for last three surveys. Data were analysedusing appropriate techniques for cluster samples.Thefindingswere reported in light of the existing evidences to providea comparative understanding of the scenario in Nigeria.However, the comparison of the findings with previousstudies should be done keeping in mind the methodologicalapproaches used to assess modern contraceptive and unmetneed. The limitation includes cross-sectional nature of thesurveys that prevent making any causal inference about theassociation. As the data were secondary, we had no controlover the selection and measurement of the variables. Lastly,information on contraceptive use was self-reported; hencethe chances of reporting bias should not be ignored whileinterpreting the findings.
8. Conclusions
The present study provides an update on the prevalenceof nonuse and unmet need for contraception among adultwomen in Nigeria. Based on the findings, we concludethat the prevalence of nonuse of modern contraceptionwas strikingly high with a considerably large proportionof women facing unmet need for contraception. For bothof the indicators statistically significant disparities wereobserved across regions in the prevalence rates. Promotingmodern contraceptive use and addressing unmet need areof paramount importance to reduce pregnancy related mor-bidity and mortalities and improve reproductive well-beingamong women. These arguments suggest that strengtheningnational policy efforts and family planning programs shouldbe regarded a public health priority and must address theunderlying sociopolitical barriers to equitable provision offamily planning services in the population.
Data Availability
All data used in this study are available through the DHSprogram website to the registered users: dhsprogram.com.
Ethical Approval
All DHS surveys are approved by ICF International as well asan Institutional Review Board (IRB) in the host country tomake sure that the protocols are in compliance with the U.S.Department of Health and Human Services regulations forthe protection of human subjects.
Conflicts of Interest
The authors declare that they have no conflicts of interest.
Acknowledgments
The authors acknowledge the time and patience of theparticipants in the survey and wish to thank DHS for theprovision of the data. This article is sponsored by the Fun-damental Research Funds for the Central Universities (No.:2019WA01) and the National Social Science Foundation ofChina “The Countermeasure Research on the Improvementof the Governance Performance about the Urban PublicSafety under the Overall National Security Concept” (No.:18BGL276).
References
[1] S. A. Adedini, C. Odimegwu, E. N. Imasiku, and D. N.Ononokpono, “Unmet Need for Family Planning: Implicationfor Under-five Mortality in Nigeria,” Journal of Health Popula-tion and Nutrition, vol. 33, no. 1, pp. 187–206, 2015.
[2] A. Akinyemi, S. Adedini, S. Hounton et al., “Contraceptive useand distribution of high-risk births in Nigeria: a sub-nationalanalysis,” Global Health Action, vol. 8, no. 1, Article ID 29745,2015.
BioMed Research International 9
[3] A. Austin, “Unmet contraceptive need amongmarried Nigerianwomen: an examination of trends and drivers,” Contraception,vol. 91, no. 1, pp. 31–38, 2015.
[4] A. F. Fagbamigbe and B. R. Ojebuyi, “Influence of spousalcommunication about family planning and HIV/AIDS-relatedissues on modern contraceptive use in Nigeria,” Journal ofHealth Management, vol. 19, no. 2, pp. 320–333, 2017.
[5] A. I. Ajayi, O. V. Adeniyi, and W. Akpan, “Maternal health carevisits as predictors of contraceptive use among childbearingwomen in a medically underserved state in Nigeria,” Journal ofHealth, Population and Nutrition, vol. 37, no. 1, p. 19, 2018.
[6] Ann M. Starrs, “A critical moment to increase investmentsin meeting women’s family planning needs,” https://www.guttmacher.org/article/2017/06/critical-moment-increase-in-vestments-meeting-womens-family-planning-needs, 2017.
[7] E. A. and A. I., “Changing patterns of unmet needs for familyplanning amongwomen of reproductive age inNigeria,”AfricanJournal of Reproductive Health, vol. 20, no. 3, pp. 127–135, 2016.
[8] A. Bankole, I. F. Adewole, R. Hussain, O. Awolude, S. Singh,and J. O. Akinyemi, “The incidence of abortion in Nigeria,”International Perspectives on Sexual & Reproductive Health, vol.41, no. 4, pp. 170–181, 2015.
[9] BBC, “Is Nigeria on the brink after north-south clashes? BBCNews,” 2012.
[10] J. Egede, R. Onoh, O. Umeora, C. A. Iyoke, I. Dimejesi, and L.Lawani, “Contraceptive prevalence andpreference in a cohort ofsouth–east Nigerian women,” Patient Preference and Adherence,vol. 2015, no. 9, pp. 707–714, 2015.
[11] B. J. Feyisetan and A. Bankole, Fertility transition in Nigeria:Trends and Prospects. Population Bulletin of the United Nations:Completing the Fertility Transition, United Nations, New York,NY, USA, 2009.
[12] K. T. Kollehlon, “Ethnicity and fertility in Nigeria,” Biodemog-raphy and Social Biology, vol. 50, no. 3-4, pp. 201–221, 2003.
[13] FMHN, “Nigeria family planning blueprint (scale-up plan)2014,”http://www.health.gov.ng/doc/Nigeria%20FP%20B print.pdf, 2014.
[14] G. Institute, “Induced abortions worldwide factsheet. factsheet,”https://www.guttmacher.org/fact-sheet/induced-abortion-worldwide, 2017.
[15] G. Institute, “Adding it up: Investing in contraception andmaternal and newborn health 2017 Factsheet,” https://www.guttmacher.org/sites/default/files/factsheet/adding-it-up-con-traception-mnh-2017.pdf, 2017.
[16] Amb. John Campbell, “Why Nigeria’s North South DistinctionIs Important,” https://www.huffingtonpost.com/amb-john-campbell/why-nigerias-north-south- b 817734.html, 2011.
[17] O. O. Oleribe and S. D. Taylor-Robinson, “Before sustainabledevelopment goals (SDG): Why Nigeria failed to achieve themillennium development goals (MDGs),” Pan African MedicalJournal, vol. 24, article 156, 2016.
[18] A. A. Ovute, “Empowering Nigerian women for nationaldevelopment: state of the art, challenges and prospects,” Journalof Research in Business and Management, vol. 3, no. 1, pp. 4–10,2015.
[19] P. A. Afulani, M. Altman, J. Musana, and M. Sudhinaraset,“Conceptualizing pathways linking women’s empowerment andprematurity in developing countries,” BMC Pregnancy andChildbirth, vol. 17, no. S2, 2017.
[20] B. A. Oye-Adeniran, I. F. Adewole, K. A. Odeyemi, E. E.Ekanem, and A. V. Umoh, “Contraceptive prevalence among
young women in Nigeria,” Journal of Obstetrics & Gynaecology,vol. 25, no. 2, pp. 182–185, 2005.
[21] Z. He, G. Bishwajit, D. Zou, S. Yaya, Z. Cheng, and Y. Zhou,“Burden of common childhooddiseases in relation to improvedwater, sanitation, and hygiene (WASH) among Nigerian chil-dren,” International Journal of Environmental Research andPublic Health, vol. 15, no. 6, p. 1241, 2018.
[22] NAP (US), Use NRC (US) WG on FAC. Introduction, NationalAcademies Press (US), 1993.
[23] S. Babalola,O.Oyenubi, I. S. Speizer, L.Cobb,A.Akiode, andM.Odeku, “Factors affecting the achievement of fertility intentionsin urban Nigeria: analysis of longitudinal data,” BMC PublicHealth, vol. 17, no. 1, p. 492, 2017.
[24] Internet, “An Alarming North-South Divide,” https://www.proshareng.com/news/Nigeria-Economy.
[25] J. Klugman, L. Hanmer, S. Twigg, T. Hasan, J. McCleary-Sills,and J. Santamaria, Voice and Agency: Empowering Women andGirls for Shared Prosperity, The World Bank, Washington, DC,USA, 2014.
[26] F. P. C. Endong, “The female media producer as an advocateof women’s empowerment in nigeria: the cross river stateexperience,”Gender Studies, vol. 15, no. 1, pp. 167–182, 2017.
[27] B. U. Mberu and R. Holly, “Understanding subgroup fertilitydifferentials in Nigeria,” Population Review, vol. 53, no. 2, pp.23–46, 2014.
[28] R. Onoh, J. Egede, O. Umeora, I. Dimejesi, L. Lawani, and C.Iyoke, “Contraceptive prevalence and preference in a cohort ofsouth–east Nigerian women,” Patient Preference and Adherence,vol. 9, pp. 707–714, 2015.
[29] R. J. McCurdy, P. F. Schnatz, P. F. Schnatz, P. J.Weinbaum, and J.Zhu, “Contraceptive use in adolescents in Sub-Saharan Africa:evidence from Demographic and Health Surveys,” ConnecticutMedicine, vol. 78, no. 5, pp. 261–272, 2014.
[30] C. C. Okigbo, D. R. McCarraher, U. Gwarzo, G. Vance, andO. Chabikuli, “Unmet need for contraception among clientsof FP/HIV integrated services in Nigeria: the role of partneropposition,” African Journal of Reproductive Health, vol. 18, no.2, pp. 134–143, 2014.
[31] U. OSSAP-MDGs, Nigeria 2015 MillenniumDevelopment GoalsEnd-Point Report, OSSAP- MDGs, UNDP, DFID, 2015.
[32] NFMH, Federal Ministry of Health. Nigeria family planningblueprint (scale-up plan) 2014. Federal Ministry of Health,Nigeria, 2014.
[33] I. I. NPC, Nigeria Demographic and Health Survey 2013, NPCand ICF International, Abuja, Nigeria, 2013.

Stem Cells International
Hindawiwww.hindawi.com Volume 2018
Hindawiwww.hindawi.com Volume 2018
MEDIATORSINFLAMMATION
of
EndocrinologyInternational Journal of
Hindawiwww.hindawi.com Volume 2018
Hindawiwww.hindawi.com Volume 2018
Disease Markers
Hindawiwww.hindawi.com Volume 2018
BioMed Research International
OncologyJournal of
Hindawiwww.hindawi.com Volume 2013
Hindawiwww.hindawi.com Volume 2018
Oxidative Medicine and Cellular Longevity
Hindawiwww.hindawi.com Volume 2018
PPAR Research
Hindawi Publishing Corporation http://www.hindawi.com Volume 2013Hindawiwww.hindawi.com
The Scientific World Journal
Volume 2018
Immunology ResearchHindawiwww.hindawi.com Volume 2018
Journal of
ObesityJournal of
Hindawiwww.hindawi.com Volume 2018
Hindawiwww.hindawi.com Volume 2018
Computational and Mathematical Methods in Medicine
Hindawiwww.hindawi.com Volume 2018
Behavioural Neurology
OphthalmologyJournal of
Hindawiwww.hindawi.com Volume 2018
Diabetes ResearchJournal of
Hindawiwww.hindawi.com Volume 2018
Hindawiwww.hindawi.com Volume 2018
Research and TreatmentAIDS
Hindawiwww.hindawi.com Volume 2018
Gastroenterology Research and Practice
Hindawiwww.hindawi.com Volume 2018
Parkinson’s Disease
Evidence-Based Complementary andAlternative Medicine
Volume 2018Hindawiwww.hindawi.com
Submit your manuscripts atwww.hindawi.com