Persistent Memory Performance on vSphere 6 · database like Redis. v. Using vMotion to migrate VMs...
33
VMware, Inc. 3401 Hillview Avenue Palo Alto CA 94304 USA Tel 877-486-9273 Fax 650-427-5001 www.vmware.com Copyright © 2018 VMware, Inc. All rights reserved. This product is protected by U.S. and international copyright and intellectual property laws. VMware products are covered by one or more patents listed at http://www.vmware.com/go/patents. VMware is a registered trademark or trademark of VMware, Inc. in the United States and/or other jurisdictions. All other marks and names mentioned herein may be trademarks of their respective companies. Persistent Memory Performance on vSphere 6.7 Performance Study – August 13, 2018
Transcript of Persistent Memory Performance on vSphere 6 · database like Redis. v. Using vMotion to migrate VMs...

VMware, Inc. 3401 Hillview Avenue Palo Alto CA 94304 USA Tel 877-486-9273 Fax 650-427-5001 www.vmware.com
Copyright © 2018 VMware, Inc. All rights reserved. This product is protected by U.S. and international copyright and intellectual property
laws. VMware products are covered by one or more patents listed at http://www.vmware.com/go/patents. VMware is a registered trademark or trademark of VMware, Inc. in the United States and/or other jurisdictions. All other marks and names mentioned herein may be trademarks of their respective companies.
Persistent Memory Performance on vSphere 6.7 Performance Study – August 13, 2018

Persistent Memory Performance on vSphere 6.7: Performance Study | 2
Table of Contents 0. Introduction .............................................................................................................................................................................. 3
1. vSphere PMEM .......................................................................................................................................................................... 4
vSphere Host Configuration .................................................................................................................................................. 5
Virtual Machine Configuration .............................................................................................................................................. 6
2. Experimental Setup ................................................................................................................................................................ 8
3. Use-Cases of PMEM in vSphere .......................................................................................................................................... 9
i. I/O Performance with FIO ................................................................................................................................................... 9
Virtualization Overhead ................................................................................................................................................... 10
Bandwidth and Latency .................................................................................................................................................... 11
ii. Relational Database Performance Using Oracle ........................................................................................................ 13
iii. Scale-Out Performance Using Sysbench .................................................................................................................... 16
Single VM Results .............................................................................................................................................................. 17
Scale-Out Results ............................................................................................................................................................... 18
iv. PMEM-Aware Applications ............................................................................................................................................. 19
SQL Server and TOFL Optimization .............................................................................................................................. 19
VMware’s Modified Redis ................................................................................................................................................23
v. vMotion Performance ...................................................................................................................................................... 27
Oracle DB vMotion ........................................................................................................................................................... 27
Redis vMotion .................................................................................................................................................................... 28
4. Best Practices ....................................................................................................................................................................... 29
5. Conclusions ............................................................................................................................................................................ 29
6. Appendix ................................................................................................................................................................................ 30
A. HammerDB Oracle ........................................................................................................................................................... 30
B. Sysbench with MySQL ..................................................................................................................................................... 31
C. HammerDB SQL Server ................................................................................................................................................... 31
7. References ..............................................................................................................................................................................32

Persistent Memory Performance on vSphere 6.7: Performance Study | 3
0. Introduction Persistent memory (PMEM) is a new technology that has the characteristics of memory but retains data through power cycles. PMEM bridges the gap between DRAM and flash storage. PMEM offers several advantages over current technologies like:
• DRAM-like latency and bandwidth
• CPU can use regular load/store byte-addressable instructions
• Persistence of data across reboots and crashes
These characteristics make PMEM very attractive for a varied set of applications and scenarios.
Currently, there are two PMEM solutions available in the market:
1. NVDIMM-N by DELL EMC and HPE: NVDIMM-N is a type of DIMM that contains both DRAM and NAND-flash modules on the DIMM itself. Data is transferred between those two modules at startup, shutdown, or any power loss event. The DIMMs are backed by a battery power source on the mainboard in case of power loss. Currently, both HPE and DELL EMC are offering 16 GB NVDIMM-N's [1] [2] [3] [4].
2. Scalable PMEM by HPE: This combines HPE SmartMemory DIMMs with NVMe drives and battery backup to create logical NVDIMMs. Data is transferred between DIMMs and NVMe drives. This technology can be used to create large scale PMEM systems [5].
The rest of the paper is organized as follows:
1. We explain how PMEM can be configured and used in a vSphere environment.
2. We describe our experimental setup and various PMEM configurations used.
3. We show how applications with different characteristics can take advantage of PMEM in vSphere. Below are some of the use-cases:
i. How PMEM device limits can be achieved under vSphere with little to no overhead of virtualization. We show virtual-to-native ratio along with raw bandwidth and latency numbers from fio, an I/O microbenchmark.
ii. How traditional relational databases like Oracle can benefit from using PMEM in vSphere. iii. How scaling-out VMs in vSphere can benefit from PMEM. We used Sysbench with MySQL to show
such benefits. iv. How modifying applications (PMEM-aware) can get the best performance out of PMEM. We show
performance data from such applications, e.g., an OLTP database like SQL Server and in-memory database like Redis.
v. Using vMotion to migrate VMs with PMEM which is a host-local device just like NVMe SSDs. We also characterize in detail, vMotion performance of VMs with PMEM.
4. We outline some best practices on how to get the most out of PMEM in vSphere.
5. Finally, we conclude this paper with a summary.

Persistent Memory Performance on vSphere 6.7: Performance Study | 4
1. vSphere PMEM In this section, we describe how VMs can use PMEM in a vSphere environment. There are two ways of exposing PMEM to a VM:
1. vPMEMDisk: vSphere presents PMEM as a regular disk attached to the VM. No guest OS or application change is needed to leverage this mode. For example, legacy applications on legacy OSes can utilize this mode. Note that vPMEMDisk configuration is available only in vSphere and not in bare-metal OS.
2. vPMEM: vSphere presents PMEM as a NVDIMM device to the VM. Most of the latest operating systems (for example, Windows Server 2016 and CentOS 7.4) support NVDIMM devices and can expose them to the applications as block or byte-addressable devices. Applications can use vPMEM as a regular storage device by going through the thin layer of the direct-access (DAX) file system or by mapping a region from the device and accessing it directly in a byte-addressable manner. This mode can be used by legacy or newer applications running on newer OSes.
Figure 1 shows the details of the PMEM architecture in vSphere. More information about vSphere PMEM can be found at docs.vmware.com [6] and storagehub.vmware.com [7].
Figure 1. vSphere PMEM Architecture
Datastore PMEM Datastore
ESXi Host
VM
vPMEM
nvdimm-0 pmemdisk-0 Disk-0.vmdk
vRAM
Memory
NVDIMM
PCIe/SAS Memory Bus Memory Bus
vPMEMDisk
vSCSI
vDisk

Persistent Memory Performance on vSphere 6.7: Performance Study | 5
vSphere Host Configuration vSphere 6.7 identifies PMEM hardware and shows it in the hardware resources section of the host in vCenter as shown in Figure 2. The recognized PMEM hardware is mounted as a PMEM datastore as shown in Figure 3.
Figure 2. vSphere showing PMEM as a hardware resource

Persistent Memory Performance on vSphere 6.7: Performance Study | 6
Figure 3. vSphere showing PMEM datastore
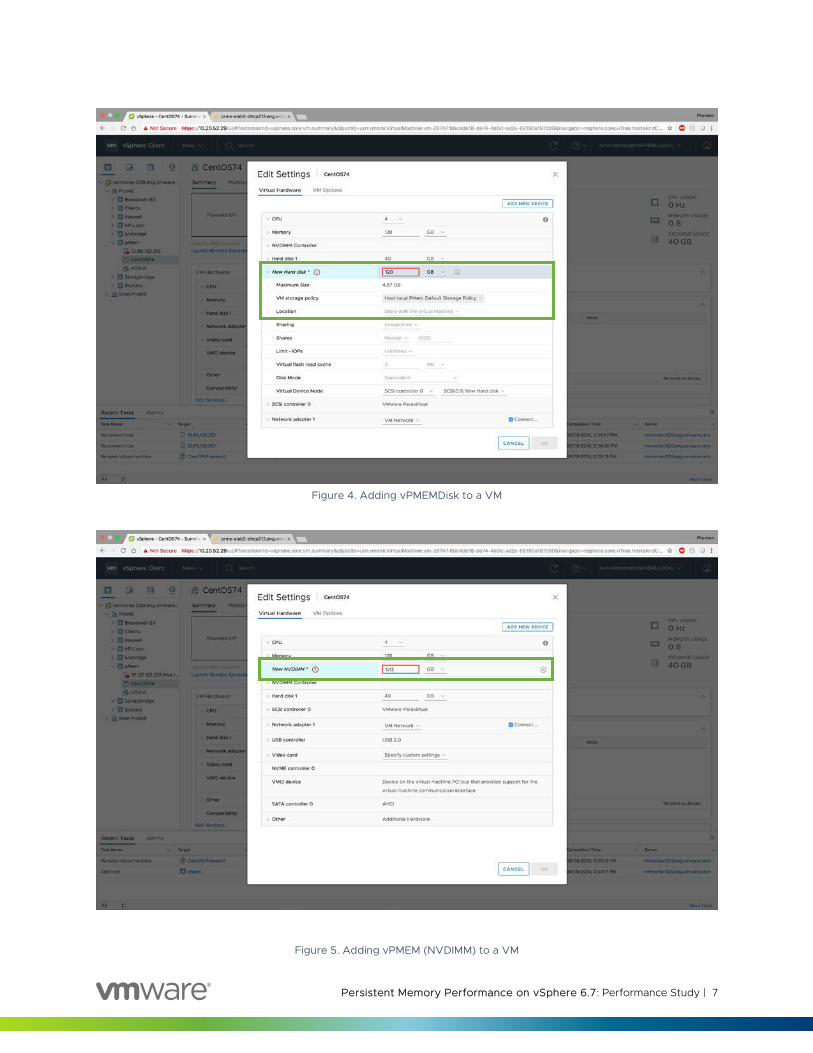
Virtual Machine Configuration 1. vPMEMDisk can be added to a VM like any regular disk as shown in Figure 4. Make sure VM Storage
Policy is set to Host-local PMem Default Storage Policy.
2. vPMEM can be added to a VM as new NVDIMM device as shown in Figure 5.
Persistent Memory Performance on vSphere 6.7: Performance Study | 7
Figure 4. Adding vPMEMDisk to a VM
Figure 5. Adding vPMEM (NVDIMM) to a VM

Persistent Memory Performance on vSphere 6.7: Performance Study | 8
2. Experimental Setup We did this performance study on both the PMEM platforms: HPE Scalable PMEM platform (Table 1) and Dell EMC NVDIMM-N PMEM platform (Table 2). Please note that performance is identical on both PMEM platforms since both are DRAM based solutions.
Platform HPE ProLiant DL380 Gen10
CPU 2 socket, 48 cores (96 threads)
Intel Xeon Platinum 8160 @ 2.10GHz
Memory 256 GB @ 2666 Mhz
PMEM 512 GB
Storage HPE NVMe SSD
MO001600KWJSN
SAN Violin Memory Array v6000 [8]
64 x 256 GB SLC flash modules
Network 40 GbE
ESXi 6.7 GA
Table 1. HPE Testbed (Scalable PMEM)
Platform Dell EMC PowerEdge R740xd
CPU 2 socket, 32 cores (64 Threads)
Intel Xeon Platinum 8153 @ 2.0 GHz
Memory 384 GB
PMEM 192 GB
Storage Dell EMC Express Flash NVMe PCIe SSD PM1725a
ESXi vSphere 6.7
Table 2. Dell EMC Testbed (NVDIMM-N)

Persistent Memory Performance on vSphere 6.7: Performance Study | 9
Note: All our measurements (SQL Server experiments were conducted on DELL EMC NVDIMM-N) were done using HPE Scalable PMEM with 512GB of PMEM in a 2-socket HPE 380 Gen 10 server. We believe that the same general performance trend would be seen on other 2- or 4-socket servers using NVDIMM-N technologies.
Configurations:
We compare performance of various workloads across 4 different configurations as shown in Table 3. Note that, vPMEM-aware configuration is applicable only to some workloads.
NVMe SSD Local NVMe SSD attached to VM via vNVMe adapter (Used as Baseline)
vPMEMDisk PMEM attached as a disk to the VM via vNVMe adapter
vPMEM PMEM attached as a NVDIMM device to the VM
vPMEM-aware Application is modified to take advantage of the new byte-addressable PMEM software paradigms [8].
Table 3. Test Configurations
3. Use-Cases of PMEM in vSphere
i. I/O Performance with FIO FIO is an I/O microbenchmark to measure I/O performance [10]. We used it to quantify the virtualization overhead and measure raw bandwidth and latency.
Highlights:
• Virtualization overhead of PMEM is less than 3%.
• The vPMEM-aware configuration can give up to 8x more bandwidth compared to that of an NVMe SSD.
• Latency with vPMEM configurations is less than 1 microsecond.
• The vPMEM-aware configuration can achieve bandwidth close to the device (memory) bandwidth.

Persistent Memory Performance on vSphere 6.7: Performance Study | 10
Configuration:
Table 4 gives the details of the FIO.
OS CentOS 7.4
CPU 4 vCPU
vRAM 16 GB
NVMe SSD 21 GB
vPMEMdisk 21 GB
vPMEM 21 GB
Table 4. FIO VM configuration
Table 5 gives the FIO parameters used.
Ioengines libaio (default) and libpmem (in vPMEM-aware)
Test cases random read, random read-write (50-50), random write
Threads 4 for throughput runs; 1 for latency run
File size 5 GB per thread
OIOs 16 for NVMe SSD; 4 for vPMEMDisk; 1 for vPMEM
Table 5. FIO workload configuration
Virtualization Overhead
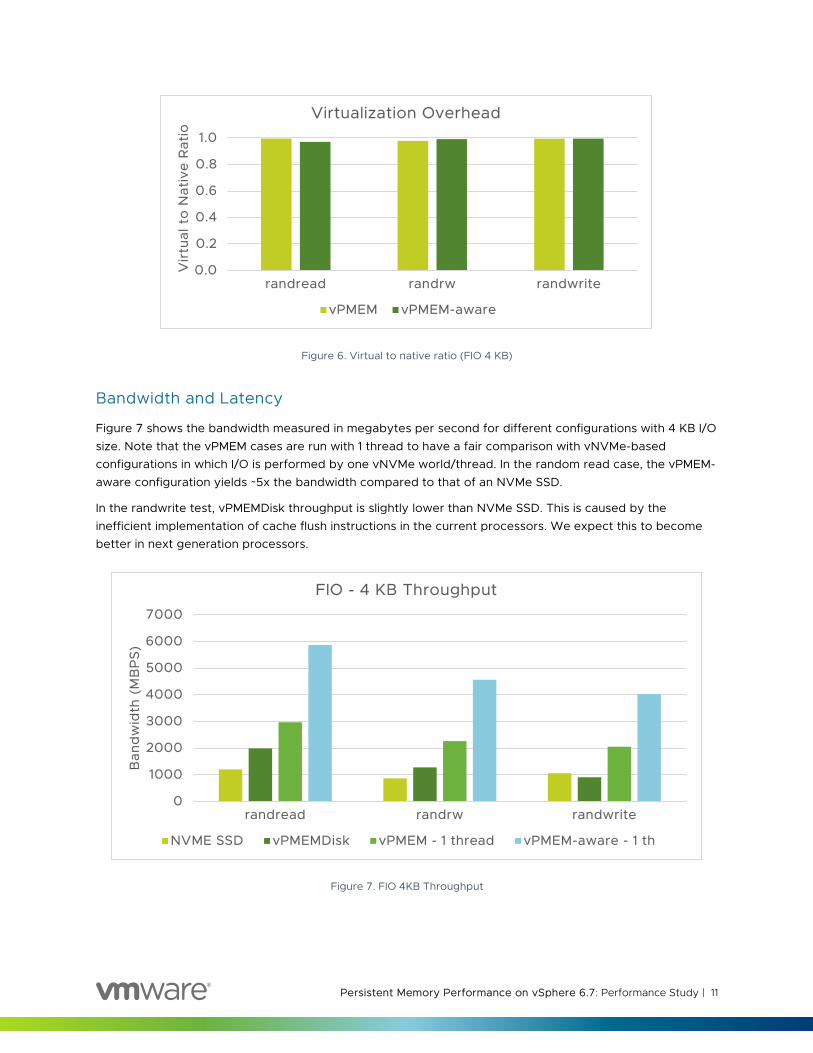
To quantify the virtualization overhead of PMEM, we compared FIO throughput on bare-metal installation of Cent OS and a Cent OS VM running on ESXi. Figure 6 shows the virtual to native ratio. In all the scenarios, we measured less than 3% overhead. We selected FIO to show virtualization overhead since microbenchmarks typically stress the system the most and are expected to show the maximum overhead when virtualized.
Persistent Memory Performance on vSphere 6.7: Performance Study | 11
Figure 6. Virtual to native ratio (FIO 4 KB)
Bandwidth and Latency
Figure 7 shows the bandwidth measured in megabytes per second for different configurations with 4 KB I/O size. Note that the vPMEM cases are run with 1 thread to have a fair comparison with vNVMe-based configurations in which I/O is performed by one vNVMe world/thread. In the random read case, the vPMEM-aware configuration yields ~5x the bandwidth compared to that of an NVMe SSD.
In the randwrite test, vPMEMDisk throughput is slightly lower than NVMe SSD. This is caused by the inefficient implementation of cache flush instructions in the current processors. We expect this to become better in next generation processors.
Figure 7. FIO 4KB Throughput
0.0
0.2
0.4
0.6
0.8
1.0
randread randrw randwrite
Vir
tual
to
Nat
ive
Rat
io
Virtualization Overhead
vPMEM vPMEM-aware
0
1000
2000
3000
4000
5000
6000
7000
randread randrw randwrite
Ban
dw
idth
(M
BP
S)
FIO - 4 KB Throughput
NVME SSD vPMEMDisk vPMEM - 1 thread vPMEM-aware - 1 th

Persistent Memory Performance on vSphere 6.7: Performance Study | 12
Figure 8 shows the bandwidth measured with 512 KB I/O. In the random read test, the vPMEM-aware case achieved more than 11 gigabytes per second of bandwidth using one thread, which is around 8x compared to NVMe SSD.
Figure 8. FIO 512KB Throughput
0
2,000
4,000
6,000
8,000
10,000
12,000
14,000
randread randrw randwrite
Ban
dw
idth
(M
BP
S)
FIO - 512 KB Throughput
NVME SSD vPMEMDisk vPMEM - 1 thread vPMEM-aware - 1 th

Persistent Memory Performance on vSphere 6.7: Performance Study | 13
Figure 9 shows the raw latency in microseconds with different configurations. Both vPMEM configurations yielded sub-microsecond latencies.
Figure 9. FIO 4KB Latency
For scenarios that demand more I/O bandwidth, we used more FIO I/O threads and observed that the bandwidth scales linearly. To measure the peak memory bandwidth on this system, we used STREAM [9] which reported 67 gigabytes per second using 8 threads. With FIO using 8 threads, we measured 66 gigabytes per second using the vPMEM-aware configuration.
ii. Relational Database Performance Using Oracle We used the hammerdb-2.23 [10] tool to benchmark Oracle Database (version 12c).
Highlights:
• 35% application performance improvement (Hammer-DB Transactions per minute) with vPMEM
• Up to 4.5x increase in Oracle IOPs
• 1.4x DB reads, 3x DB writes and up to ~17x increase in DB Log writes
• Up to more than 57x decrease in Oracle DB operations (read/write) latency
0
50
100
150
200
250
randread randrw randwrite
Tim
e (
mic
rose
c)FIO - 4 KB Latency
NVME SSD vPMEMDisk vPMEM vPMEM-aware
Persistent Memory Performance on vSphere 6.7: Performance Study | 14
Configuration:
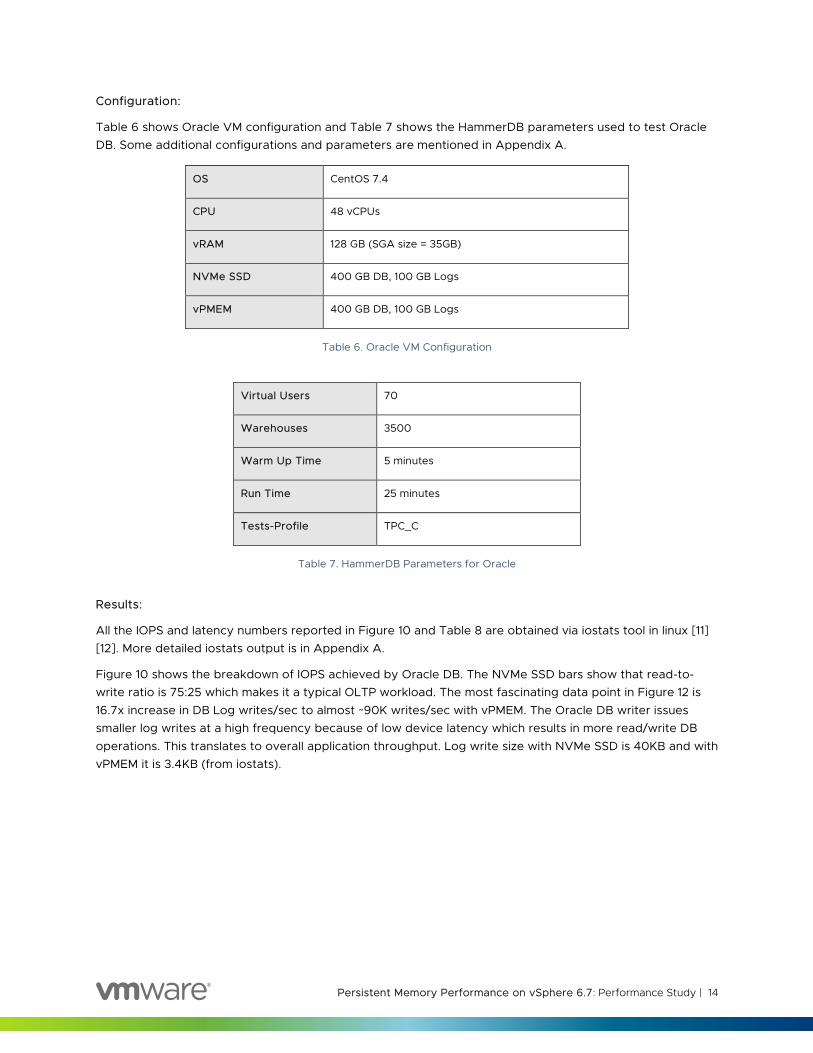
Table 6 shows Oracle VM configuration and Table 7 shows the HammerDB parameters used to test Oracle DB. Some additional configurations and parameters are mentioned in Appendix A.
OS CentOS 7.4
CPU 48 vCPUs
vRAM 128 GB (SGA size = 35GB)
NVMe SSD 400 GB DB, 100 GB Logs
vPMEM 400 GB DB, 100 GB Logs
Table 6. Oracle VM Configuration
Virtual Users 70
Warehouses 3500
Warm Up Time 5 minutes
Run Time 25 minutes
Tests-Profile TPC_C
Table 7. HammerDB Parameters for Oracle
Results:
All the IOPS and latency numbers reported in Figure 10 and Table 8 are obtained via iostats tool in linux [11] [12]. More detailed iostats output is in Appendix A.
Figure 10 shows the breakdown of IOPS achieved by Oracle DB. The NVMe SSD bars show that read-to-write ratio is 75:25 which makes it a typical OLTP workload. The most fascinating data point in Figure 12 is 16.7x increase in DB Log writes/sec to almost ~90K writes/sec with vPMEM. The Oracle DB writer issues smaller log writes at a high frequency because of low device latency which results in more read/write DB operations. This translates to overall application throughput. Log write size with NVMe SSD is 40KB and with vPMEM it is 3.4KB (from iostats).

Persistent Memory Performance on vSphere 6.7: Performance Study | 15
Figure 10. HammerDB with Oracle IOPS breakdown
Table 8 shows the dramatic decrease in latencies of DB read/write operations and Log writes. The minimum latency reported by iostats tool is 10 microsecs (0.01 milliseconds).
Config DB Reads (usecs)
DB Writes (usecs)
Log Writes (usecs)
NVME SSD 388 571 90
vPMEM < 10 < 10 < 10
Table 8. Hammer-DB with Oracle Latency breakdown (using iostat)
Figure 11 shows HammerDB throughput increase by 35% and the server being fully utilized (98% Guest CPU Utilization obtained from mpstats/iostats)
19,039
4,515 5,367
26,607
13,742
89,777
0
20,000
40,000
60,000
80,000
100,000
DB Reads/Sec DB Writes/sec DB Log Writes/sec
IOP
SHammerDB with Oracle IOPS Breakdown
NVME SSD vPMEM

Persistent Memory Performance on vSphere 6.7: Performance Study | 16
Figure 11. Hammer-DB Throughput gain with vPMEM
Note: We also increased virtual users to a value (80 users) where NVMe SSD achieved the maximum performance. Even when comparing 80 virtual users for NVMe SSD, vPMEM at 70 users was 29% better.
iii. Scale-Out Performance Using Sysbench This section shows how VMs can use PMEM in a scale-out fashion when traditional storage like SAN or SSDs become a bottleneck. We used Sysbench [15] which is a database performance benchmark against MySQL database to demonstrate the scaling benefits of PMEM.
Highlights:
• 4 VMs scale to 3.5x with vPMEM compared to 2x with NVMe SSD
• vPMEM throughput and latency are 5x compared to NVMe SSD in a single VM.
Configuration:
Table 9 gives the details of the VM.
OS CentOS 7.4
CPU 12 vCPU
vRAM 16 GB
NVMe SSD 128 GB
vPMEMdisk 128 GB
vPMEM 128 GB
Table 9. Sysbench VM configuration
1.00
1.35
68
98
0
20
40
60
80
100
0
0.2
0.4
0.6
0.8
1
1.2
1.4
1.6
NVME SSD vPMEM
% C
PU
Use
d
No
rmal
ized
Thr
oug
hput

Persistent Memory Performance on vSphere 6.7: Performance Study | 17
Table 10 gives the Sysbench parameters used.
DB Tables 6
Rows per table 90 M
DB Size 120 GB
Sysbench Threads 12
Tests oltp_read_only
oltp_read_write (75/25)
oltp_write_only
Table 10. Sysbench workload configuration
Single VM Results
Figure 12 shows the normalized throughput reported by Sysbench in different configurations. The vPMEM case yields up to 5.5x better throughput compared to NVMe SSD.
Figure 12. Sysbench Throughput
Figure 13 shows the normalized application-level 95th percentile latency reported by Sysbench in different configurations. The vPMEM case yields 5x better latency compared to NVMe SSD.
0
1
2
3
4
5
6
oltp_read_only oltp_read_write(75/25)
oltp_write_only
No
rmal
ize
d T
rans
/se
c
Sysbench - Throughput
NVME SSD vPMEMDISK vPMEM

Persistent Memory Performance on vSphere 6.7: Performance Study | 18
Figure 13. Sysbench latency
Scale-Out Results
We used multiple copies (two and four) of the same VM from Table 7. Figure 14 shows the scaling of multiple VMs in different configurations for oltp_read_write test. We observe that vPMEMDisk and vPMEM can scale to around 3.5x while NVMe SSD stops at 2x. We see similar trend in the other two tests (read_only and write_only).
Figure 14. Sysbench throughput scaling for oltp_read_write test
Figure 15 shows the latency scaling with multiple Sysbench VMs. We don’t observe any significant increase in latency when multiple VMs are running on vPMEMDisk and vPMEM, while NVMe SSD suffers more than 2x latency when four VMs are running.
0
0.2
0.4
0.6
0.8
1
1.2
oltp_read_only oltp_read_write(75/25)
oltp_write_only
No
rmal
ize
d 9
5 %
-ile
Lat
enc
y
Sysbench - Latency
NVME SSD vPMEMDISK vPMEM
00.5
11.5
22.5
33.5
4
1 VM 2 VMs 4 VMs
Re
lati
ve T
hro
ughp
ut
Sysbench Scaling - Throughput
NVME SSD vPMEMDISK vPMEM

Persistent Memory Performance on vSphere 6.7: Performance Study | 19
Figure 15. Sysbench latency scaling
iv. PMEM-Aware Applications We believe that, in order to achieve the maximum possible benefit from PMEM devices, applications need to be modified. PMEM-aware applications work in conjunction with direct access (DAX) mode where the NVDIMM device is mounted in the guest OS with DAX filesystem option. Applications can use vPMEM by mapping a region from the device and accessing it directly in a byte-addressable manner.
Examples of such modified applications are SQL Server using tail-of-the-log (TOFL) optimization [13] and VMware’s modified Redis [14].
SQL Server and TOFL Optimization
We used HammerDB v2.23 to test SQL Server 2016 with various configurations.
Highlights:
• Up to 16% increase in application performance using SQL TOFL optimization.
• Up to 22% increase in application performance using vPMEM on top of SQL TOFL.
• 93x decrease in LogFlushWaitTime
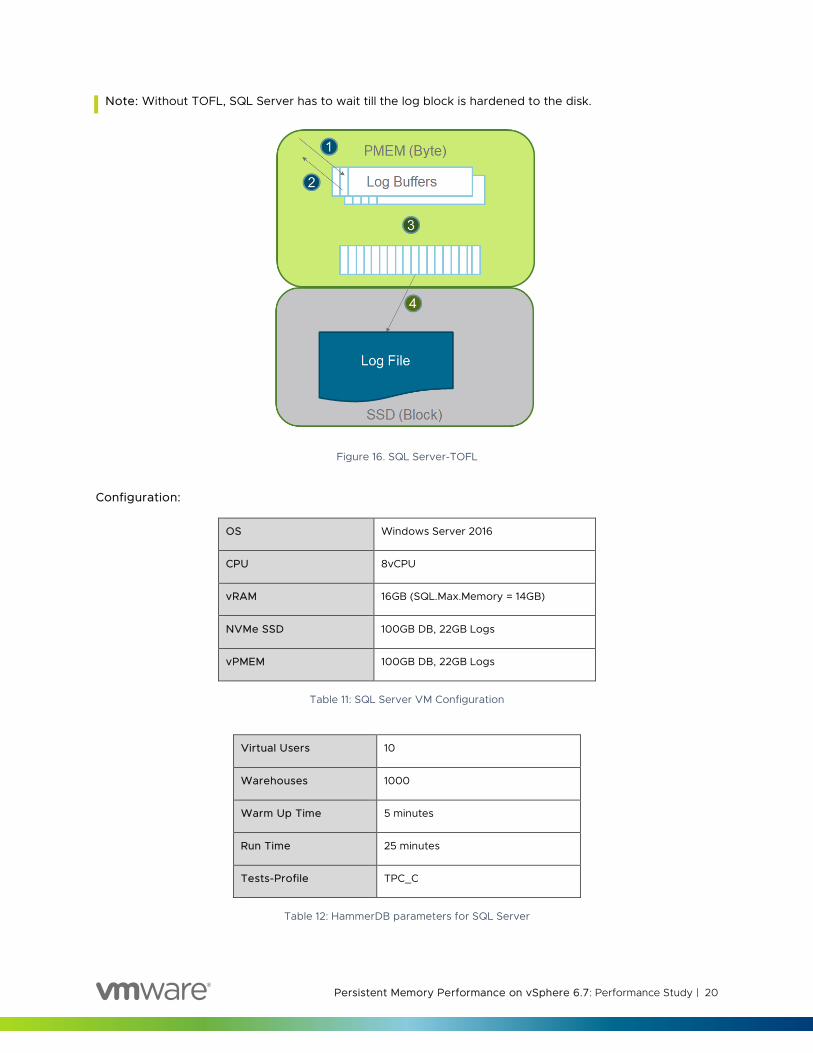
How SQL TOFL works:
SQL Server 2016 introduced an optimization known as tail-of-the-log where portion of the log buffer is mapped in PMEM instead of DRAM. Here are the steps involved in how TOFL works:
1. Logs records are copied persistently into the buffer.
2. Whenever a commit arrives, the transaction completes, returning control to SQL Server (since it is persistent already).
3. When the log block is full (typically 64 KB), it is closed-out, ready to be hardened to disk.
4. I/O is scheduled to persist the full block to disk.
0
0.5
1
1.5
2
2.5
1 VM 2 VMs 4 VMs
Rel
ativ
e La
tenc
y
Sysbench Scaling - Latency
NVME SSD vPMEMDISK vPMEM
Persistent Memory Performance on vSphere 6.7: Performance Study | 20
Note: Without TOFL, SQL Server has to wait till the log block is hardened to the disk.
Figure 16. SQL Server-TOFL
Configuration:
OS Windows Server 2016
CPU 8vCPU
vRAM 16GB (SQL.Max.Memory = 14GB)
NVMe SSD 100GB DB, 22GB Logs
vPMEM 100GB DB, 22GB Logs
Table 11: SQL Server VM Configuration
Virtual Users 10
Warehouses 1000
Warm Up Time 5 minutes
Run Time 25 minutes
Tests-Profile TPC_C
Table 12: HammerDB parameters for SQL Server

Persistent Memory Performance on vSphere 6.7: Performance Study | 21
We used five configurations to quantify the performance gains:
1. SSD – DB and Logs are on NVME SSD
2. Logs-vPMEMDisk – Only Logs are moved to vPMEMDisk (DB stays on SSD)
3. Logs-vPMEM – Only Logs are moved to vPMEM (DB stays on SSD)
4. TOFL (Tail-of-the-log) – Only portion of the log buffer (a.k.a TOFL) is moved to vPMEM DAX volume
5. vPMEM-TOFL – DB and Logs both are moved to vPMEM and portion of log buffer is on vPMEM DAX volume
Results:
The various numbers reported in Figure 17 to 18 and Table 13 are obtained using Windows perfmon counters and SQL Server perfmon events. More details about the counter descriptions can be found in Appendix C.
Figure 17 shows the IOPS breakdown for the different configurations. In the first three configurations, there is no SQL-specific PMEM change. It shows 20% increase in Log Writes/sec by just moving the Logs (22 GB) to vPMEM. This results in 12% increase in performance as shown in Figure 24. The reason for more Log writes is because LogFlushWaitTime is reduced by 4.5x to 65 msecs. In the TOFL configuration, only 20 MB of Log buffer is mapped as byte-addressable PMEM.
The LogFlushWaits/sec event in Figure 18. It reduced by 114x to a value of 53. This is because SQL Server doesn’t have to wait until the I/O is persisted on the disk. As soon as the commit arrives, the transaction is complete. The DB log writes/sec is just 340 as shown in Figure 18. The reason is that the perfmon counter does not capture direct writes (memory load/store) to the PMEM since it is in DAX mode. The log write size increased to 61 KB (3.6 KB in the SSD case) in TOFL. In the vPMEM-TOFL configuration, the LogFlushWaitTime reduced to 3.2 msecs, and the performance increased by 22% compared to baseline NVMe SSD case. The CPU utilization of the VM is 95% in the vPMEM-TOFL configuration as compared to baseline (81% CPU utilization).
Notes:
1. % Processor Time perfmon counter is used for CPU numbers.
2. LogFlushes/sec in Figure 18 is roughly equal to DB Log Writes/sec in Figure 17.
3. We do not show latency numbers because Windows perfmon latency counters cannot capture anything less than 10 milliseconds of latency.

Persistent Memory Performance on vSphere 6.7: Performance Study | 22
Figure 17. HammerDB with SQL Server IOPs breakdown
Figure 18. SQL Server Perfmon Flush Events
0
1000
2000
3000
4000
5000
6000
DB Reads/Sec DB Writes/sec DB Log Writes/sec
IOP
SSQL Server - IOPS Breakdown
SSD Logs-vPMEMDisk Logs-vPMEM TOFL vPMEM-TOFL
340 53371 640
1000
2000
3000
4000
5000
6000
7000
8000
LogFlushes/sec LogFlushWaits/secNo
of
flus
h e
vent
s p
er
seco
nd
SQL Server Flush events
SSD Logs-vPMEMDisk Logs-vPMEM TOFL vPMEM-TOFL

Persistent Memory Performance on vSphere 6.7: Performance Study | 23
Configuration LogFlushWaitTime (msecs)
SSD 296.4
Logs-vPMEMDisk 107.4
Logs-vPMEM 65
TOFL 9.5
vPMEM-TOFL 3.2
Table 13: SQL Server Perfmon Flush Time Event
Figure 19. HammerDB throughput gain with SQL Server
VMware’s Modified Redis
Redis is a popular open source, in-memory key-value store [13]. Redis can be used as a database, cache, or message broker. In this instance, we used Redis as a database with perfect consistency (sync every SET operation to backing storage), and compared it to the PMEM-aware Redis that is developed in-house by VMware, using the new PMEM software libraries [14]. PMEM-aware Redis offers perfect consistency by default because both SET and GET operations are done in PMEM as opposed to in DRAM like in the case of vanilla Redis.
1.001.10 1.12 1.16 1.22
0
0.2
0.4
0.6
0.8
1
1.2
1.4
No
rmal
ize
d T
hro
ughp
ut
HammerDB SQL Server Performance

Persistent Memory Performance on vSphere 6.7: Performance Study | 24
PMEM-aware Redis offers the following benefits:
• Better performance with persistence and perfect consistency for all operations. This makes a case for using PMEM-aware Redis as a primary database.
• Instant recovery from crash. PMEM-aware Redis does all operations to and from PMEM, which persists at crash. It does not need to load any data from disk to memory at initialization. On the other hand, vanilla Redis must load the database from disk to memory at initialization, which can take up to several minutes.
We used memtier_benchmark, which is an open source benchmarking tool for key-value stores to drive Redis [18].
Highlights:
• Redis throughput is 2.4x better in the vPMEM-aware case compared to NVMe SSD.
• The vPMEM-aware configuration yields 12x better latency.
• The vPMEM-aware configuration performs much better than vPMEM, making a case to modify applications
Configuration:
Table 14 gives the details about the Redis VM.
OS CentOS 7.4
CPU 4 vCPUs
vRAM 128 GB
NVMe SSD 128 GB
vPMEMdisk 128 GB
vPMEM 128 GB
Table 14. Redis VM configuration

Persistent Memory Performance on vSphere 6.7: Performance Study | 25
Table 15 shows the Redis parameters used.
DB Size 25M keys (120 GB in memory)
Data Size 4 KB
Driver memtier_benchmark
Throughput parameters
pipeline=4; clients=50; threads=4
Latency parameters pipeline=1; clients=1; threads=1
Tests 0% SETs; 20% SETs; 50% SETs; 80% SETs; 100% SETs
Table 15. Redis workload configuration
Results:
Figure 20 shows the normalized throughput reported by memtier_benchmark in different configurations. The 100% SETs case stresses the storage most in which the vPMEM-aware configuration, provided 2.4x better throughput. Moreover, vPMEM-aware throughput is 1.7x compared to vPMEM.
Figure 20. Redis throughput
Figure 21 shows the normalized latency per operation reported by memtier_benchmark. Again, in the 100% SETs case, latency with vPMEM-aware is 12x better than NVMe SSD and 2.8x better than vPMEM.
0.0
0.5
1.0
1.5
2.0
2.5
3.0
0 % SETS 20 % SETS 50% SETS 80 % SETS 100 % SETS
No
rmal
ize
d O
p/s
Redis - Throughput
NVME SSD vPMEMDISK vPMEM vPMEM-aware

Persistent Memory Performance on vSphere 6.7: Performance Study | 26
Figure 21. Redis latency
Figure 22 shows the crash recovery time in seconds. Note that, vPMEM-aware Redis recovers instantly.
Figure 22. Redis crash recovery time
0.0
0.2
0.4
0.6
0.8
1.0
1.2
0 % SETS 20 % SETS 50% SETS 80 % SETS 100 % SETS
Nar
mal
ize
d L
ate
ncy
Redis - Latency
NVME SSD vPMEMDISK vPMEM vPMEM-aware
242
120
83
00
50
100
150
200
250
300
NVME SSD vPMEMDISK vPMEM vPMEM-aware
Tim
e (
secs
)
Redis - Recovery Time
Persistent Memory Performance on vSphere 6.7: Performance Study | 27
v. vMotion Performance vSphere supports vMotion of both vPMEMDisk and vPMEM. vPMEMDisk vMotion is conducted as XvMotion, where both local storage and memory contents are transferred to another host. vPMEM vMotion is conducted as compute vMotion, where vPMEM is transferred as memory along with vRAM. Note that, PMEM is a host local storage and seamless live-migration like vMotion is only possible in vSphere environment (unlike bare-metal OS)
We used 2 identical hosts connected over 40 GbE network. We created 3 vmknics for vMotion over the 40 GbE physical NIC.
Oracle DB vMotion
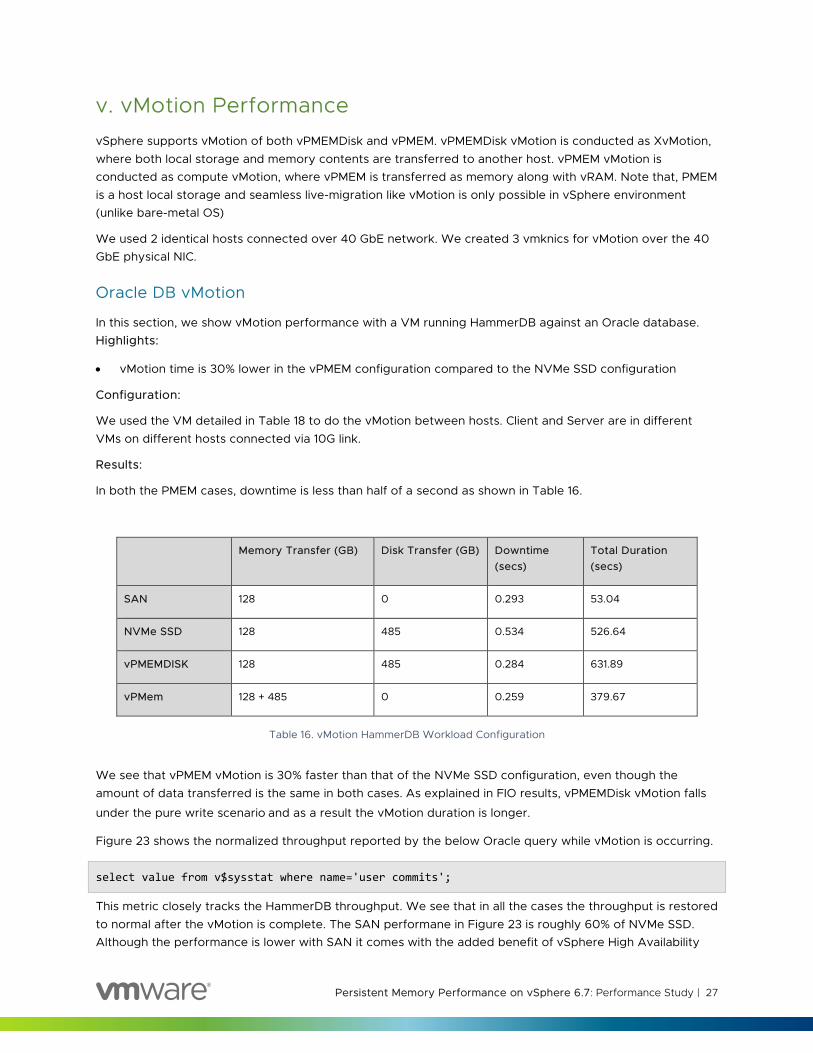
In this section, we show vMotion performance with a VM running HammerDB against an Oracle database. Highlights:
• vMotion time is 30% lower in the vPMEM configuration compared to the NVMe SSD configuration
Configuration:
We used the VM detailed in Table 18 to do the vMotion between hosts. Client and Server are in different VMs on different hosts connected via 10G link.
Results:
In both the PMEM cases, downtime is less than half of a second as shown in Table 16.
Memory Transfer (GB) Disk Transfer (GB) Downtime (secs)
Total Duration (secs)
SAN 128 0 0.293 53.04
NVMe SSD 128 485 0.534 526.64
vPMEMDISK 128 485 0.284 631.89
vPMem 128 + 485 0 0.259 379.67
Table 16. vMotion HammerDB Workload Configuration
We see that vPMEM vMotion is 30% faster than that of the NVMe SSD configuration, even though the amount of data transferred is the same in both cases. As explained in FIO results, vPMEMDisk vMotion falls
under the pure write scenario and as a result the vMotion duration is longer.
Figure 23 shows the normalized throughput reported by the below Oracle query while vMotion is occurring.
select value from v$sysstat where name='user commits';
This metric closely tracks the HammerDB throughput. We see that in all the cases the throughput is restored to normal after the vMotion is complete. The SAN performane in Figure 23 is roughly 60% of NVMe SSD. Although the performance is lower with SAN it comes with the added benefit of vSphere High Availability

Persistent Memory Performance on vSphere 6.7: Performance Study | 28
(HA). All other configurations (local storage) don’t have vSphere HA support. Interestingly, when vMotion is taking place, the throughput in the vPMem case is 13% better than the NVMe SSD case with no vMotion.
Figure 23. HammerDB vMotion performance
Redis vMotion
We used the Redis VM detailed in Table 17 for vMotion between the hosts. We added SAN configuration to get a baseline with compute vMotion. Table 13 gives the details of the Redis parameters used in this test.
DB Size 25M keys (120 GB in memory)
Data Size 4 KB
Driver memtier_benchmark
Parameters pipeline=4; clients=50; threads=4
Tests 50% SETs
Table 17. vMotion Redis workload configuration
Results:
Table 18 shows the amount of memory and disk transferred, along with VM downtime and total duration for vMotion. In the vPMEM case, both 128 GB of vRAM and 128 GB of vPMEM need to be transferred. In the vPMEM-aware case, vRAM is not touched by Redis and only few gigabytes of vRAM need to be transferred along with the 128 GB of vPMEM. Although the amount of memory (RAM or PMEM) transferred is the same in both SAN and vPMEM-aware cases, the total vMotion duration is higher in the vPMEM-aware case. We believe this is because memory is touched/dirtied at a higher rate in vPMEM-aware case and this results in more pre-copy-phase iterations of vMotion. Interested readers can learn more about vMotion details in vMotion Architecture, Best Practices, and Performance in vSphere 5.0 [16].
0
0.2
0.4
0.6
0.8
1
1.2
1.4
1.6
1 17 33 49 65 81 97
113
129
145
161
177
193
209
225
241
257
273
289
305
321
337
353
369
385
40
14
174
334
49 465 481
497 51
352
954
556
157
7
No
rmal
ized
Thr
oug
hput
Time (secs)
HammerDB vMotion Performance
SAN SSD PMEM

Persistent Memory Performance on vSphere 6.7: Performance Study | 29
Memory Transfer (GB)
Disk Transfer (GB) Downtime (secs)
Total Duration (secs)
SAN 128 0 0.128 58.91
NVMe SSD 128 128 0.123 161.93
vPMEMDISK 128 128 0.449 194.59
vPMem 128 + 128 0 0.305 108.52
vPMEM-aware 128 0 0.186 85.84
Table 18. vMotion Redis down time
Note: Spectre/Meltdown mitigations can impact the performance of a workload depending on the I/O rate and/or the frequency of system calls. 1
4. Best Practices Here are some of the best practices based on our performance testing:
1. If PMEM capacity is limited, first move the database logs to PMEM first to get performance benefits of PMEM.
2. Scale-out VMs with PMEM to get the most benefit out of the PMEM device in vSphere.
3. vPMEMDisk is slightly slower than SSD for write-only workloads. This is due to the inefficient implementation of Cache Flush instructions in current processors.
5. Conclusions In summary:
• vSphere can achieve close to PMEM device bandwidth and latency
• Virtualization overhead of PMEM in vSphere is less than 3%
• vSphere PMEM gives up to 8x throughput and improvement in micro benchmarks and up to 35% improvement in Tier-1 workloads compared to NVMe SSD.
• Scaling out VMs on vSphere PMEM can take full advantage of the device bandwidth.
• Performance of VMs with PMEM during vMotion is much better than NVMe SSD (or All-flash SAN) performance (even when there is no vMotion).
1 We use kernel 3.10.0-693.21 (patched) to measure the impact of Spectre/Meltdown mitigations. In FIO, we see a 38% loss in the vPMEM configuration and only a 7% loss in the vPMEM-aware (libpmem) configuration. The lower overhead in libpmem is because it is a user-space library. For OLTP workloads, like HammerDB with Oracle Database, we observe a less than 10% performance degradation with vPMEM.

Persistent Memory Performance on vSphere 6.7: Performance Study | 30
6. Appendix
A. HammerDB Oracle We used large pages at system boot and THP in Linux was disabled. We also set priority for LGWRT and DB WRT via this command:
chrt --rr -p 83 -$P
We figured out that this command was needed to get the best performance because when CPU is near saturation log writer does not get scheduled optimally resulting in sub-optimal performance.
HammerDB client and Oracle server are in the same VM for results in Section ii.
Iostats for pmem devices can be enabled via the following command.
$ echo 1 > /sys/block/pmem<n>/queue/iostats
I/Os that go through DAX paths (mounted using –o dax option) are not counted in iostat output. In this experiment, the -o dax option did not make a difference to performance, so we mounted the pmem devices without the –o dax option to collect detailed iostats for more insights.
The nvme0n1/pmem1 – nvme0n10/pmem10 have Oracle DB tables. Nvme0n11/pmem11 has the Oracle redo logs.
Device: rrqm/s wrqm/s r/s w/s rkB/s wkB/s avgrq-sz avgqu-sz await r_await w_await
nvme0n1 0.00 0.20 1959.90 439.17 15679.20 8526.13 20.18 0.89 0.37 0.35 0.49
nvme0n2 0.00 0.20 1993.73 475.53 15949.87 9099.73 20.29 0.92 0.37 0.34 0.50
nvme0n3 0.00 0.20 1888.13 474.13 15105.07 9939.47 21.20 0.93 0.39 0.35 0.57
nvme0n4 0.00 0.20 1864.33 451.40 14914.67 8845.87 20.52 0.90 0.39 0.34 0.59
nvme0n5 0.00 0.20 1861.33 449.87 14890.67 9002.13 20.68 0.89 0.39 0.35 0.55
nvme0n6 0.00 0.20 1862.23 457.00 14897.87 8779.20 20.42 0.91 0.39 0.35 0.57
nvme0n7 0.00 0.20 1841.60 443.93 14732.80 8446.93 20.28 0.91 0.40 0.35 0.61
nvme0n8 0.00 0.20 1857.67 435.93 14861.33 7655.73 19.63 0.91 0.40 0.34 0.62
nvme0n9 0.00 0.20 1925.17 444.00 15401.33 7873.33 19.65 0.93 0.39 0.35 0.60
nvme0n10 0.00 0.20 1989.57 448.10 15916.53 7865.87 19.51 0.96 0.39 0.34 0.61
nvme0n11 0.00 56.80 0.07 5367.10 0.03 206904.32 77.10 0.48 0.09 0.00 0.09
Device: rrqm/s wrqm/s r/s w/s rkB/s wkB/s avgrq-sz avgqu-sz await r_await w_await
pmem1 0.00 0.00 2776.40 1325.80 22211.20 13635.73 17.48 0.01 0.00 0.00 0.00
pmem2 0.00 0.00 2782.53 1338.67 22260.27 12730.40 16.98 0.01 0.00 0.00 0.00
pmem3 0.00 0.00 2733.27 1496.60 21866.13 15594.93 17.71 0.01 0.00 0.00 0.00
pmem4 0.00 0.00 2583.43 1426.67 20667.47 15173.87 17.88 0.01 0.00 0.00 0.00
pmem5 0.00 0.00 2590.70 1444.27 20725.60 14511.47 17.47 0.01 0.00 0.00 0.00
pmem6 0.00 0.00 2574.03 1390.80 20592.27 13338.13 17.12 0.01 0.00 0.00 0.00
pmem7 0.00 0.00 2667.43 1356.27 21339.47 12721.87 16.93 0.01 0.00 0.00 0.00
pmem8 0.00 0.00 2602.90 1318.87 20823.20 11549.87 16.51 0.01 0.00 0.00 0.00
Persistent Memory Performance on vSphere 6.7: Performance Study | 31
pmem9 0.00 0.00 2628.10 1344.07 21024.80 12040.27 16.65 0.01 0.00 0.00 0.00
pmem10 0.00 0.00 2672.37 1305.87 21378.93 11498.13 16.53 0.01 0.00 0.00 0.00
pmem11 0.00 0.00 0.00 89777.27 0.00 300545.35 6.70 0.09 0.00 0.00 0.00
B. Sysbench with MySQL The below iostats show the IO statistics when a single VM is running on NVMe SSD. Note that just one instance of Sysbench can exercise close to 550 MBPS from the storage device and scaling to 4 VMs need 2200 MBPS bandwidth.
read_write (79/21)
Device: rrqm/s wrqm/s r/s w/s rMB/s wMB/s avgrq-sz avgqu-sz await r_await w_await
nvme0n1 0.00 934.50 26331.50 6645.50 411.43 128.95 33.56 9.93 0.30 0.36 0.07
C. HammerDB SQL Server Table 19 describes the SQL Server 2016 [13].
Log Flush Wait Time Total wait time (in milliseconds) to flush the log. Indicates the wait time for log records to be hardened to disk.
Log Flush Waits/sec Number of commits per second waiting for the log flush.
Log Flush Write Time (ms)
Time in milliseconds for performing writes of log flushes that were completed in the last second.
Log Flushes/sec Number of log flushes per second.
Table 19. Description of Log Flush events
Persistent Memory Performance on vSphere 6.7: Performance Study | 32
7. References
[1] Hewlett Packard Enterprise. (2018) HPE NVDIMMs. https://www.hpe.com/us/en/product-catalog/servers/persistent-memory/pip.hpe-persistent-memory.1008649009.html
[2] Hewlett Packard Enterprise. (2018) https://www.hpe.com/us/en/servers/persistent-memory.html
[3] Dell EMC. Dell EMC NVDIMM-N Persistent Memory User Guide. https://www.dell.com/support/manuals/us/en/04/poweredge-r940/nvdimm-n_ug_pub/introduction?guid=guid-8884370c-5553-4089-b613-a3c570b56f0e&lang=en-us
[4] Dell EMC. (2018, April) Dell EMC NVDIMM-N Persistent Memory User Guide. https://topics-cdn.dell.com/pdf/poweredge-r740_users-guide3_en-us.pdf
[5] Hewlett Packard Enterprise. (2018, June) HPE Scalable Persistent Memory User. https://support.hpe.com/hpsc/doc/public/display?docId=emr_na-a00038915en_us
[6] VMware. (2018, March) What's New in Performance for vSphere 6.7? Persistent Memory. https://docs.vmware.com/en/vSphere/6.7/solutions/vSphere-6.7.2cd6d2a77980cc623caa6062f3c89362/GUID-B65C7840D2D42343A7630B03A47BF4FB.html
[7] VMware. (2018) vSphere support for Persistent Memory (PMem) NVDIMM. https://storagehub.vmware.com/t/vsphere-storage/vsphere-6-7-core-storage-1/pmem-persistant-memory-nvdimm-support-in-vsphere/
[8] Violin Systems. Violin 6600 All Flash Array. https://www.violinsystems.com/products/violin-6600/
[9] pmem.io. Persistent Memory Development Kit. https://pmem.io/pmdk/
[10] GitHub: fio. https://github.com/axboe/fio
[11] John McCalpin. STREAM: Sustainable Memory Bandwidth in High Performance Computers. https://www.cs.virginia.edu/stream/
[12] (2018) HammerDB. http://www.hammerdb.com/
[13] Michael Kerrisk. (2018, April) Linux User's Manual. http://man7.org/linux/man-pages/man1/iostat.1.html
[14] Sebastien Godard. iostat(1) - Linux man page. https://linux.die.net/man/1/iostat
[15] (2018) GitHub: Sysbench. https://github.com/akopytov/sysbench
Persistent Memory Performance on vSphere 6.7: Performance Study | 33
[16] Microsoft. (2016, November) How It Works (It Just Runs Faster): Non-Volatile Memory SQL Server Tail Of Log Caching on NVDIMM. https://blogs.msdn.microsoft.com/bobsql/2016/11/08/how-it-works-it-just-runs-faster-non-volatile-memory-sql-server-tail-of-log-caching-on-nvdimm/
[17] VMware. (2018) What Is Persistent Memory? https://code.vmware.com/persistent-memory-initiative
[18] Redis Labs. Redis. https://redis.io/
[19] Redis Labs. (2018) GitHub: memtier_benchmark. https://github.com/RedisLabs/memtier_benchmark
[20] (2011) vMotion Architecture, Best Practices, and Performance in vSphere 5.0. https://www.vmware.com/content/dam/digitalmarketing/vmware/en/pdf/techpaper/vmware-vmotion-performance-vsphere5.pdf
[21] Microsoft. (2017, March) SQL Server, Databases Object. https://docs.microsoft.com/en-us/sql/relational-databases/performance-monitor/sql-server-databases-object?view=sql-server-2016
About the Authors
Qasim Ali is a Staff Engineer II in the Performance team at VMware. He graduated with a PhD from Purdue University in 2009. Since then, he has been working on tuning vSphere's hypervisor and VMkernel stack (CPU, memory and Power). Currently he is focused on Persistent memory (PMEM) performance in vSphere. He enjoys the challenges of optimizing vSphere using the latest hardware enhancements and technologies. He is the author of many conference papers, patents and VMworld presentations.
Praveen Yedlapalli is a Sr. MTS in the ESX performance team. He focuses on the CPU and Memory
management in the ESX Kernel. He is actively working on quantifying and improving PMEM performance in
vSphere. Praveen has a PhD from Pennsylvania State University (2014) where he focused on improving CPU-
Memory bottlenecks. He is the author of many CPU/Memory publications and given talks at various academic conferences and past VMworld.
Acknowledgements
We would like to thank Tuyet Pham from the vSphere Performance team and Sreekanth Setty from the Outbound Performance team who helped us in conducting various experiments.