Perpetual Limited ABN 86 000 431 827 and its controlled ... · Lead Auditor's independence...
111
Title of Document goes here_1 SECTION HEAD TAB GOES HERE Perpetual Limited ABN 86 000 431 827 and its controlled entities FULL YEAR FINANCIAL STATEMENTS 30 June 2016 For personal use only
Transcript of Perpetual Limited ABN 86 000 431 827 and its controlled ... · Lead Auditor's independence...

Title of Document goes here_1
SECTION HEAD TAB GOES HERE
Perpetual Limited ABN 86 000 431 827 and its controlled entities
FULL YEAR FINANCIAL STATEMENTS 30 June 2016
For
per
sona
l use
onl
y

1
Directors' Report for the year ended 30 June 2016 The Directors present their report together with the consolidated financial report of Perpetual Limited, (‘Perpetual’ or the ‘Company’) and its controlled entities (the ‘consolidated entity’), for the year ended 30 June 2016 and the auditor's report thereon. Contents of the Directors' Report
Directors 2Company secretaries 4Directors' meetings 5Corporate responsibility statement 5Principal activities 5Review of operations 6Dividends 6State of affairs 7Events subsequent to reporting date 7Likely developments 7Environmental regulation 7Indemnification of Directors and officers 7Insurance 7Chief Executive Officer's and Chief Financial Officer's declaration 7
Remuneration Report 8Key Management Personnel 12Remuneration outcomes in FY16 13Executive remuneration changes for FY17 14The People and Remuneration Committee 15Use of external advisors 16Diversity and Inclusion 16Employee Benefits 17Remuneration principles 18Remuneration policy and practice 18Five year company performance 21Short-term incentives 22Long-term incentives 25Remuneration data 30Contract arrangements 34The New Variable Incentive Plan 36Remuneration Policy and data 38Key terms used in this report 42
Non-audit services provided by the external Auditor 43
Rounding off 43Lead Auditor's independence declaration 44
Page No
For
per
sona
l use
onl
y

2
Directors' Report for the year ended 30 June 2016 (continued) Directors The Directors of the Company at any time during or since the end of the financial year are: Peter B Scott, Chairman and Independent Director BE (Hons) MEngSc (Age 62) Appointed Director in July 2005 and Chairman on 26 October 2010. Mr Scott was formerly the Chief Executive Officer of MLC, an Executive General Manager of National Australia Bank and held a number of senior positions with Lend Lease. He is Chairman of Perpetual Equity Investment Company Limited and a Non-executive director of Transurban Group. Mr Scott is also an advisory board member of Igniting Change. He is Chairman of Perpetual's Nominations Committee. Mr Scott has more than 20 years of senior business experience in publicly listed companies and extensive knowledge of the wealth management industry. Listed company directorships held during the past three financial years: - Stockland Corporation Limited (from August 2005 to August 2016) - Perpetual Equity Investment Company Limited (from August 2014 to present) - Transurban Group (from March 2016 to present) Philip Bullock, Independent Director BA MBA GAICD Dip Ed (Age 63) Appointed Director in June 2010. Mr Bullock was formerly Vice President, Systems and Technology Group, IBM Asia Pacific, Shanghai, China. Prior to that he was Chief Executive Officer and Managing Director of IBM Australia and New Zealand. His career with IBM spanned almost 30 years in the Asia Pacific region. Mr Bullock is a Non-executive Director of Hills Limited and formerly of Healthscope Limited and CSG Limited. He also provided advice to the Federal Government, through a number of organisations, most notably as Chair of Skills Australia. He is a member of Perpetual's Audit, Risk and Compliance Committee and People and Remuneration Committee. Mr Bullock brings to the Board extensive management experience in Australia and Asia in technology, client relationships, marketing, talent development and government. Listed company directorships held during the past three financial years: - CSG Limited (from August 2009 to November 2015) - Hills Limited (from June 2014 to the present) Sylvia Falzon, Independent Director MIR (Hons) BBus GAICD SF Fin (Age 51) Appointed Director in November 2012. Ms Falzon has worked in the financial services industry for over 27 years and during that time has held senior executive positions responsible for institutional and retail funds management businesses, both domestically and internationally. Her roles have included Head of Business Development at Aviva Investors Australia, an equity partner at Alpha Investment Management and Chief Manager International Sales & Service at National Mutual Funds Management/AXA. Ms Falzon is currently a Non-executive Director of SAI Global Limited, Regis Healthcare Limited, Cabrini Health Ltd and the Museums Board of Victoria. She is Chairman of Perpetual’s People and Remuneration Committee and a member of Perpetual’s Investment Committee and Nominations Committee.
For
per
sona
l use
onl
y
3
Directors' Report for the year ended 30 June 2016 (continued) Directors (continued) Sylvia Falzon, Independent Director MIR (Hons) BBus GAICD SF Fin (Age 51) (continued) Ms Falzon brings to the Board her extensive knowledge and insight in the development of asset management businesses with a particular focus on marketing, sales/distribution, client service and operations including risk and compliance. Listed company directorships held during the past three financial years:
- SAI Global Limited (from October 2013 to present) - Regis Healthcare Limited (from September 2014 to present) Nancy Fox, Independent Director BA JD (Law) FAICD (Age 59) Appointed Director in September 2015. Ms Fox has more than 30 years’ experience in financial services, securitisation and risk management gained in Australia, the US and across Asia. A lawyer by training, she was Managing Director for Ambac Assurance Corporation from 2001 to 2011 and previously Managing Director of ABN Amro Australia from 1997 to 2001. She is currently a director of HCF Life, APA Ethane Limited and Kinetic Superannuation Ltd and also sits on the Boards of the Taronga Conservation Society Australia and the Australian Theatre for Young People. She is a member of Perpetual’s Audit, Risk and Compliance Committee and People and Remuneration Committee. Ms Fox brings to the Board a deep knowledge of developing and leading successful financial services businesses and extensive experience with securitisation, regulatory frameworks, risk management, and governance. Ian Hammond, Independent Director BA (Hon) FCA FCPA GAICD (Age 58) Appointed Director in March 2015. Mr Hammond was a partner at PricewaterhouseCoopers for 26 years and during that time, held a range of senior management positions including lead partner for several major financial institutions. He has previously been a member of the Australian Accounting Standards Board and represented Australia on the International Accounting Standards Board. Mr Hammond is a Non-executive Director of Citibank Australia and Stadium Australia Group and a board member of a number of not-for-profit organisations including Mission Australia and Chris O'Brien Lifehouse. He is a Chairman of Perpetual's Audit, Risk and Compliance Committee and a member of Perpetual’s Investment Committee and Nominations Committee. Mr Hammond has deep knowledge of the financial services industry and brings to the board expertise in financial reporting and risk management. P Craig Ueland, Independent Director BA (Hons and Distinction) MBA (Hons) CFA (Age 58)
Appointed Director in September 2012. Mr Ueland was formerly President and Chief Executive Officer of Russell Investments, a global leader in multi-manager investing. He previously served as Russell’s Chief Operating Officer, Chief Financial Officer, and Managing Director of International Operations, which he led from both London and the firm’s headquarters in the US. Earlier in his career he opened and headed Russell’s first office in Australia. Mr Ueland chairs the Endowment Investment Committee for The Benevolent Society, is a member of the board of the Stanford Australia Foundation and the Supervisory Board of OneVentures Innovation and Growth Fund II. He is Chairman of Perpetual’s Investment Committee and a member of Perpetual’s Audit, Risk and Compliance Committee and Nominations Committee. Mr Ueland brings to the Board detailed knowledge of global financial markets and the investment management industry, gleaned from more than 20 years as a senior executive of a major investment firm, along with a strong commitment to leadership development and corporate strategy development and execution.
For
per
sona
l use
onl
y

4
Directors' Report for the year ended 30 June 2016 (continued) Directors (continued)
Geoff Lloyd, Chief Executive Officer and Managing Director Barrister at Law LLM (Distinction) (UTS) Adv Mgt Program (Harvard) (Age 48) Mr Lloyd joined Perpetual in August 2010 and was appointed CEO and Managing Director in February 2012. In 2012, Mr Lloyd and his senior leadership team rolled out Perpetual’s Transformation 2015 strategy designed to simplify, refocus and grow Perpetual. Growth initiatives put in place as part of this strategy include the successful acquisition of The Trust Company in December 2013 and the launch of a new Global Equity capability in September 2014. Before being appointed CEO, Mr Lloyd was Group Executive of Private Wealth at Perpetual, where he led the development and implementation of the growth strategy for this business. He took on the additional responsibility of head of retail distribution in September 2011. Before commencing at Perpetual, Mr Lloyd held a number of senior roles at BT Financial Group and St George's Wealth Management business including General Manager, Advice and Private Banking and Group Executive Wealth Management. Mr Lloyd was appointed Chair of the Financial Services Council (FSC) in July 2016. Prior to this appointment he held a number of positions in the FSC including Co-Deputy Chairman, Deputy Chairman of the FSC’s Administration & Risk Board Committee, Deputy Chairman of the FSC’s Nominations Board Committee and Co-Chairman of the FSC’s Advice Board Committee. Mr Lloyd is an Advisory Board member of The Big Issue, and the Patron of the Financial Industry Community Aid Program. He is a patron of the Emerge Foundation and also sits on the University of Technology Sydney Law Advisory Board. Mr Lloyd has a Masters of Law (Distinction) from the University of Technology, Sydney and has completed the Harvard University Advanced Management Program. Directors who retired during the year Paul V Brasher, Independent Director BEc (Hons) FCA (Age 66) Appointed Director in November 2009. On 31 August 2015, Mr Brasher retired as a director of Perpetual Limited, as Chairman of Perpetual's Audit, Risk and Compliance Committee and as a member of the Nominations Committee and People and Remuneration Committee. Elizabeth M Proust AO, Independent Director BA (Hons) LLB FAICD (Age 65) Appointed Director in January 2006. On 5 November 2015, Ms Proust retired as a director of Perpetual Limited, as Chairman of Perpetual's People and Remuneration Committee and as a member of Perpetual's Audit Risk and Compliance Committee and Nominations Committee. Company secretaries Joanne Hawkins BCom LLB Grad Dip CSP FGIA GAICD Appointed Company Secretary in June 2003. Ms Hawkins is head of Perpetual's Legal, Compliance and Company Secretariat teams. Prior to joining Perpetual, Ms Hawkins was Assistant Company Secretary of Macquarie Bank and Ord Minnett and was Company Secretary, National Bank of the Solomon Islands. Ms Hawkins has also worked as a solicitor and legal adviser in New Zealand.
For
per
sona
l use
onl
y

5
Directors' Report for the year ended 30 June 2016 (continued) Company secretaries (continued) Glenda Charles Grad. Dip. Corp. Gov. ASX Listed Entities GIA (Cert) Joined Perpetual in August 1994. She was appointed Assistant Company Secretary of Perpetual in 1999 and Deputy Company Secretary in 2009. Ms Charles has over 20 years’ experience in company secretarial practice and administration and has worked in the financial services industry for over 30 years. Directors’ meetings The number of Directors’ meetings which Directors were eligible to attend (including meetings of Board Committees) and the number of meetings attended by each Director during the financial year to 30 June 2016 were:
Director
Eligible to attend
AttendedEligible to
attendAttended
Eligible to attend
AttendedEligible to
attendEligible to
attendAttended
P B Scott 10 9 - - - - 2 - -
P V Brasher 3 2 1 1 - - - 1 1
P Bullock 10 10 4 4 1 1 - 6 6
S Falzon 10 10 2 2 4 4 2 5 5
N Fox 7 7 4 4 - - - 4 4
I Hammond 10 10 6 6 3 3 2 - -
E M Proust 5 5 2 2 - - - 2 2
P C Ueland 10 9 6 6 4 4 2 - -
G Lloyd 10 10 - - - - - - -
* Paul Brasher resigned from the Perpetual Limited Board and the ARCC, PARC and Nominations Committee on 31 August 2015.
* Ian Hammond was appointed as chairman of the ARCC and a member of the Investment Committee and Nominations Committee from 31 August 2015.
* Sylvia Falzon retired from the ARCC and was appointed to the PARC on 28 September 2015.
* Philip Bullock was appointed to the ARCC and resigned from the Investment Committee on 28 September 2015.
* Nancy Fox was appointed as a director of Perpetual Limited effective 28 September 2015 and a member of the ARCC and PARC on the same date.
* Sylvia Falzon was appointed as chairman of the PARC and became a member of the Nominations Committee on 5 November 2015.
-
* Ian Hammond was appointed as director of Perpetual Limited effective 24 March 2015 and a member of the ARCC from 12 May 2015.
* Elizabeth Proust retired from the Perpetual Limited Board at the conclusion of the AGM on 5 November 2015 and from the ARCC, PARC and Nominations Committee on the same date.
-
2
People and Remuneration
Committee (PARC)Board
Audit, Risk and Compliance
Committee (ARCC)Investment Committee
Nominations Committee
-
2
2
Attended
2
-
-
Corporate Responsibility Statement Perpetual’s Corporate Responsibility Statement, which meets the requirements of ASX Listing Rule 4.10.3 is located on the Corporate Governance page of Perpetual’s website at https://www.perpetual.com.au/About/Corporate-Governance Principal activities
The principal activities of the consolidated entity during the financial year were funds management, portfolio management, financial planning, trustee, responsible entity and compliance services, executor services, investment administration and custody services.
There were no significant changes in the nature of activities of the consolidated entity during the year.
For
per
sona
l use
onl
y

6
Directors' Report for the year ended 30 June 2016 (continued)
Review of operations
A review of operations is included in the Operating and Financial Review section of the Annual Report.
For the financial year to 30 June 2016, Perpetual reported a net profit after tax of $132.0 million compared to the net profit after tax for the financial year to 30 June 2015 of $122.5 million. The reconciliation of net profit after tax to underlying profit after tax for the 2016 financial year is as follows:
122,484
Significant items after taxTrustCo integration costs - 11,327
Net recoveries1 (3,659) -
Gain on sale of business (153) (113)
128,193 133,6981 Relates to TrustCo.
Underlying profit after tax attributable to equity holders of Perpetual Limited
Net profit after tax attributable to equity holders of Perpetual Limited 132,005
30 June 2016 30 June 2015$'000 $'000
Underlying profit after tax (UPAT) attributable to equity holders of Perpetual Limited reflects an assessment of the result for the ongoing business of the consolidated entity as determined by the Board and management. UPAT has been calculated in accordance with the AICD/Finsia principles for reporting underlying profit and ASIC's Regulatory Guide 230 - Disclosing non-IFRS financial information. UPAT attributable to equity holders of Perpetual Limited has not been audited by our external auditors, however the adjustments to net profit after tax attributable to equity holders of Perpetual Limited have been extracted from the books and records that have been audited.
During the year, a change in the classification of realised gains or losses resulting from the disposal of Perpetual’s seed fund investments has been made. These activities form a part of the group’s operating model and the disposal of investments occurs on a regular basis. As such, it was determined that it was more appropriate to reflect these gains (or losses) as a part of UPAT rather than as significant items. Comparatives have been restated. Dividends
Dividends paid or provided by the Company to members since the end of the previous financial year were:
Date of payment
Declared and paid during the financial year 2016Final 2015 ordinary 25 Sep 2015Interim 2016 ordinary 24 Mar 2016Total
Declared after the end of the financial year 2016After balance date, the Directors declared the following dividend:
Final 2016 ordinary 28 Sep 2016
# All franked dividends declared or paid during the year were franked at a tax rate of 30 per cent and paid out of retained earnings.
60,547
58,218 Franked58,218 Franked116,436
Cents per share
Total amount$'000
130 60,547
Franked#/ Unfranked
Franked
125125
The financial effect of dividends declared after year end are not reflected in the 30 June 2016 financial statements and will be recognised in subsequent financial reports.
For
per
sona
l use
onl
y

7
Directors' Report for the year ended 30 June 2016 (continued)
State of affairs
There were no significant changes in the state of affairs of the consolidated entity during the financial year. Events subsequent to reporting date
The Directors are not aware of any other event or circumstance since the end of the financial year not otherwise dealt with in this report that has affected or may significantly affect the operations of the consolidated entity, the results of those operations or the state of affairs of the consolidated entity in subsequent financial years.
Likely developments
Information about the business strategies and prospects for future financial years of the consolidated entity are included in the Operating and Financial Review. Further information about business strategies, future prospects, likely developments in the operations of the consolidated entity and the expected results of those operations in future financial years has not been included in this report because disclosure of the information would be likely to result in unreasonable prejudice to the consolidated entity because the information is commercially sensitive.
Environmental regulation
The consolidated entity acts as trustee or custodian for a number of property trusts which have significant developments throughout Australia. These fiduciary operations are subject to environmental regulations under both Commonwealth and State legislation in relation to property developments. Approvals for commercial property developments are required by state planning authorities and environmental protection agencies. The licence requirements relate to air, noise, water and waste disposal. The responsible entity or manager of each of these property trusts is responsible for compliance and reporting under the government legislation.
The consolidated entity is not aware of any material non-compliance in relation to these licence requirements during the financial year.
The consolidated entity has determined that it is not required to register to report under the National Greenhouse and Energy Reporting Act 2007, which is Commonwealth environmental legislation that imposes reporting obligations on entities that reach reporting thresholds during the financial year.
Indemnification of Directors and officers
The Company and its controlled entities indemnify the current Directors and officers of the companies against all liabilities to another person (other than the Company or a related body corporate) that may arise from their position as Directors of the consolidated entity, except where the liabilities arise out of conduct involving a lack of good faith. The Company and its controlled entities will meet the full amount of any such liabilities, including costs and expenses.
Insurance
In accordance with the provisions of the Corporations Act 2001, the Company has a directors and officers' liability policy which covers all Directors and officers of the consolidated entity. The terms of the policy specifically prohibit disclosure of details of the amount of the insurance cover and the premium paid.
Chief Executive Officer's and Chief Financial Officer's Declaration
The CEO and Managing Director, and the CFO declared in writing to the Board, in accordance with section 295A of the Corporations Act 2001, that the financial records of the Company for the financial year have been properly maintained, and that the Company's financial reports for the year ended 30 June 2016 comply with accounting standards and present a true and fair view of the Company's financial condition and operational results. This statement is required annually.
For
per
sona
l use
onl
y

Directors’ Report for the year ended 30 June 2016 (continued)
Remuneration Report
8
Dear Shareholder This year I was delighted to be appointed to the position of Chairman, People and Remuneration Committee for your Board and accordingly am pleased to present our Remuneration Report for the year ended 30 June 2016. My appointment comes at an exciting time as we look to enhance our people agenda as a key enabler to execute on our Lead & Grow Strategy. Remuneration philosophy Our remuneration philosophy at Perpetual is designed to create value for our shareholders, clients and employees, to differentiate rewards based on performance in line with our risk management framework, and to provide competitive rewards that attract, motivate and retain talented people. FY16 Results In financial year 2016 (FY16) Perpetual delivered solid financial results in a challenging environment. We achieved a NPAT result of $132.0m being an 8% increase on our FY15 result. The Perpetual Board has assessed the FY16 performance for each category of the Company’s balanced scorecard of annual objectives, which are aligned to Perpetual’s long term strategic goals. Highlights of note are the results of our people engagement and Net Promoter Score (NPS). We are pleased to report both measures have increased significantly over the year despite difficult and volatile market conditions. Our people engagement score is positioned in the top quartile of organisations in Australia and 10% above our peers in financial services which is an outstanding result. We also achieved a strong increase in our client NPS. This has come about as a direct result of our dedicated focus on what matters most to our clients and creating a more valued client experience. We believe these measures are leading indicators underpinning our future growth. Employee Benefits Continued strong financial performance has enabled us to further improve our benefits to our people in areas we believe are meaningful and contribute to our ongoing ability to attract and retain talent. In addition to increasing employee superannuation contributions to 12% by 2020, this year we introduced superannuation contributions on the unpaid portion of parental leave. These undertakings reflect Perpetual’s strong belief that the purpose of our industry is to help Australians save for and live well in retirement, and we are pleased to be leading by example. We also enhanced our health benefits by offering a personal health check and establishing a mental health program to improve awareness and management of mental health conditions. New Performance and Reward Framework During the year, we also undertook a review of our performance and reward frameworks. We identified an opportunity to evolve our approach to be more meaningful, transparent and simpler for our people while driving greater alignment of our people to shareholder value creation. In FY17, two of our divisions will be involved in a pilot of a new Performance and Reward Framework aimed at creating more frequent performance and career discussions, and increasing the level of individual ownership and empowerment of performance and development. The pilot will inform our decision whether to roll out the new framework throughout Perpetual in FY18 and creates an opportunity for us to test and learn from new approaches.
In relation to our CEO and Group Executives, we have also introduced a new Variable Incentive Plan.
This new plan combines our existing short term incentive (STI) and long term Incentive (LTI)
arrangements into a simplified variable incentive. The primary purpose of the new plan underpins your
Board’s commitment to further align your shareholder experience with our CEO and Group Executives
through increased share ownership.
For
per
sona
l use
onl
y

Directors’ Report for the year ended 30 June 2016 (continued)
Remuneration Report (continued)
9
While full reporting of the new Variable Incentive Plan is not required until next year, we have taken the opportunity to provide details of the new arrangements in our report this year. Refer Section 7 on page 36. Our Remuneration Report has been prepared with the aim of providing you with important information and, as always, we welcome your feedback.
Sylvia Falzon Chairman, People and Remuneration Committee
For
per
sona
l use
onl
y

Directors’ Report for the year ended 30 June 2016 (continued)
Remuneration Report (continued)
10
This Report sets out the remuneration arrangements for all Key Management Personnel (KMP), being the CEO and Managing Director, and the Group Executives (Executives), and the Non-executive Directors of Perpetual Limited for the year ended 30 June 2016. The information in this Remuneration Report has been audited against the disclosure requirements of section 308(3C) of the Corporations Act 2001.
Table of contents
Section What it covers Page
1. Remuneration overview
1.1 Key Management Personnel Names and roles of the people whose remuneration arrangements are disclosed in this report.
12
1.2 Remuneration outcomes in FY16 Summary of the remuneration outcomes for the KMP in FY16.
13
1.3 Executive remuneration changes for FY17
Changes taking place to Executive remuneration in FY17, with further details in Section 7 of this Report.
14
2. Governance
2.1 The People and Remuneration Committee
Role of the committee and the terms of reference within which it operates.
15
2.2 Use of external advisors Use of the Committee’s external advisors. 16
3. Our People
3.1 Diversity and Inclusion Outline of Diversity and Inclusion at Perpetual. 16
3.2 Employee Benefits Overview of the range of benefits available to our employees.
17
4. Our remuneration philosophy
4.1 Remuneration principles Our guiding principles upon which our remuneration policy is designed.
18
4.2 Remuneration policy and practice How we implement our policy in practice – our risk management methodology, minimum shareholding guidelines, hedging and share trading policies, fixed remuneration review and how our asset manager remuneration is structured.
18
5. Aligning company performance and reward
5.1 Five year company performance Perpetual’s performance, share price and dividends paid over the past five years.
21
5.2 Short-term incentives FY16 measures and how we’ve performed against those measures.
The STI pool, how it’s determined, and outcomes delivered.
22
5.3 Long-term incentives Our LTI plans – the performance measures and how we have performed against those measures.
25
6. Data disclosures – Executives
For
per
sona
l use
onl
y

Directors’ Report for the year ended 30 June 2016 (continued)
Remuneration Report (continued)
11
6.1 Remuneration data Tables of the remuneration disclosures required by the Corporations Act, and in accordance with relevant Australian Accounting standards.
30
6.2 Contract arrangements Contractual arrangements of the CEO and termination arrangements of Executives.
34
7. Executive Remuneration Changes for FY17
7.1 The New Variable Incentive Plan Explanation of the New Variable Incentive Plan effective 1 July 2016.
36
8. Non-executive director remuneration
8.1 Remuneration Policy and data Remuneration policy, fee framework and remuneration disclosures for Non-executive Directors.
38
9. Key Terms
9.1 Key terms used in this Report Table of abbreviations and key terms used in this Report.
42
For
per
sona
l use
onl
y

Directors’ Report for the year ended 30 June 2016 (continued)
Remuneration Report (continued)
12
1. Remuneration overview
1.1. Key Management Personnel (KMP)
Below are Perpetual’s KMP this year:
Name Position Term as KMP in FY16
Geoff Lloyd Chief Executive Officer and Managing Director Full year
Christopher Green Group Executive, Perpetual Corporate Trust Full year
David Kiddie1 Group Executive, Perpetual Investments Commenced 22 February 2016
Gillian Larkins Chief Financial Officer Full year
Rebecca Nash Group Executive, People and Culture Full year
Mark Smith Group Executive, Perpetual Private Full year
Michael Gordon Group Executive, Perpetual Investments Ceased 24 February 2016
Peter Scott Chairman Full year
Philip Bullock Independent Director Full year
Sylvia Falzon Independent Director Full year
Nancy Fox Independent Director Commenced 28 September 2015
Ian Hammond Independent Director Full year
Craig Ueland Independent Director Full year
Paul Brasher Independent Director Ceased 31 August 2015
Elizabeth Proust Independent Director Ceased 5 November 2015
1. David Kiddie w as appointed as Group Executive, Perpetual Investments succeeding Michael Gordon.
Current Non-executive Directors
CEO and Managing Director
Current Group Executives
Former Group Executive
Former Non-executive Directors
For
per
sona
l use
onl
y

Directors’ Report for the year ended 30 June 2016 (continued)
Remuneration Report (continued)
13
1.2 Remuneration outcomes in FY16
A summary of the remuneration outcomes for the KMP for FY16 is set out below.
Remuneration Component FY16 outcomes
Fixed remuneration
CEO and Managing Director Over the last four years, Mr Lloyd, as CEO and Managing Director has led an outstanding transformation program at Perpetual, successfully acquired and integrated The Trust Company and has now launched our Lead & Grow strategy. This is on the back of continued growth year on year in NPAT, increasing employee engagement to top levels in Australian financial services and strong improvements in client advocacy.
In May 2015, Perpetual reviewed Executive remuneration as part of the annual remuneration review process to determine salaries for FY16. Increases across the team ranged from 0% to 5%. The CEO’s fixed remuneration was increased by 3% effective 1 September 2015.
In November 2015, Perpetual conducted an out of cycle review of the CEO’s remuneration following receipt of newly released market remuneration data from public reports of a defined peer group. Relevant benchmark information indicated that the CEO’s fixed remuneration was below market median and Perpetual sought to address this as part of the review. Consequently the Perpetual Board increased Mr Lloyd’s fixed remuneration by 7% to $1,250,000 effective 1 October 2015. The remuneration level now effectively recognises the skill and experience he brings to the role.
More information on the remuneration of the CEO and Managing Director, including a summary of contractual arrangements, is on page 34.
Group Executives Incumbent Group Executives were awarded average fixed remuneration increases of 2% in FY16 based on market salary movements (inclusive of employer superannuation contributions for FY16.
Short-term incentives
STI pool Given the 8% increase in NPAT from FY15 and performance against other measures in the Company balanced scorecard, Perpetual was able to fully fund the FY16 divisional scorecard outcomes.
A summary of the FY16 balanced scorecard, including an assessment of performance against the measures, is set out on page 22.
CEO and Managing Director Based on the Board’s assessment of the performance of the Managing Director, a short-term incentive of $1,320,362 was awarded to Geoff Lloyd. Of this, 40% (or $528,145) will be deferred in the form of Perpetual shares with vesting after two years subject to service conditions and claw-back provisions.
This equates to an achievement rate of 107% of his short-term incentive target for FY16, compared to an achievement rate of 103% awarded in FY15.
Group Executives The Board approved short-term incentive awards to Group Executives ranging between 91% and 116% of their respective targets, based on the recommendations of the CEO and Managing Director, 40% of the short-term incentive award for each Group Executive for FY16 will be deferred in the form of Perpetual shares with vesting after two years subject to service conditions and claw-back provisions. Details of STI outcomes for Group Executives are included in the remuneration tables on pages 25 and 30.
Long-term incentives
CEO and Managing Director Effective 1 October 2012 Geoff Lloyd was awarded an LTI grant (2012 LTI) of 37,383 shares for which vesting was subject to Relative TSR and EPS growth performance targets over a three year period.
For
per
sona
l use
onl
y

Directors’ Report for the year ended 30 June 2016 (continued)
Remuneration Report (continued)
14
Remuneration Component FY16 outcomes
100% of Mr Lloyd’s LTI grant vested on 1 October 2015 with Perpetual’s Relative TSR performance over the performance period ranked at the 78
th percentile and EPS
growth over the period being above 10%.
CEO and Managing Director (continued)
Details of the LTI arrangements at Perpetual are on page 25.
Group Executives As a result of the 2012 LTI vesting outcomes (as mentioned above for the CEO and Managing Director), Group Executives’ vestings were as follows:
13,806 shares vested to Mr Green
11,894 shares vested to Mr Smith
4,800 shares vested to Ms Larkins
4,237 shares vested to Ms Nash
Non-executive Director fees
The total remuneration available to Non-executive Directors remains at $2,250,000, as approved by shareholders at the 2006 Annual General Meeting.
Total fees paid to Non-executive Directors in FY16 were $1,285,450 which represented an increase of $55,392 from the total fees of $1,230,058 paid in FY15. This increase was a conscious decision to overlap service of departing Directors and ensure continuation of knowledge as new Directors joined the Perpetual Board.
Further detail on Non-executive Director remuneration is provided on page 38.
1.3 Executive Remuneration Changes for FY17
Following adoption of Perpetual’s Lead & Grow strategy, performance and reward arrangements across Perpetual were reviewed during the year. As a result of the review, a new Variable Incentive Plan for our Executives was introduced with effect from 1 July 2016. Whilst the new incentive plan does not impact on the FY16 remuneration arrangements disclosed in this Report, for the benefit of our shareholders, the new approach is detailed in Section 7 of this Report.
For
per
sona
l use
onl
y
Directors’ Report for the year ended 30 June 2016 (continued)
Remuneration Report (continued)
15
2. Governance
2.1 The People and Remuneration Committee
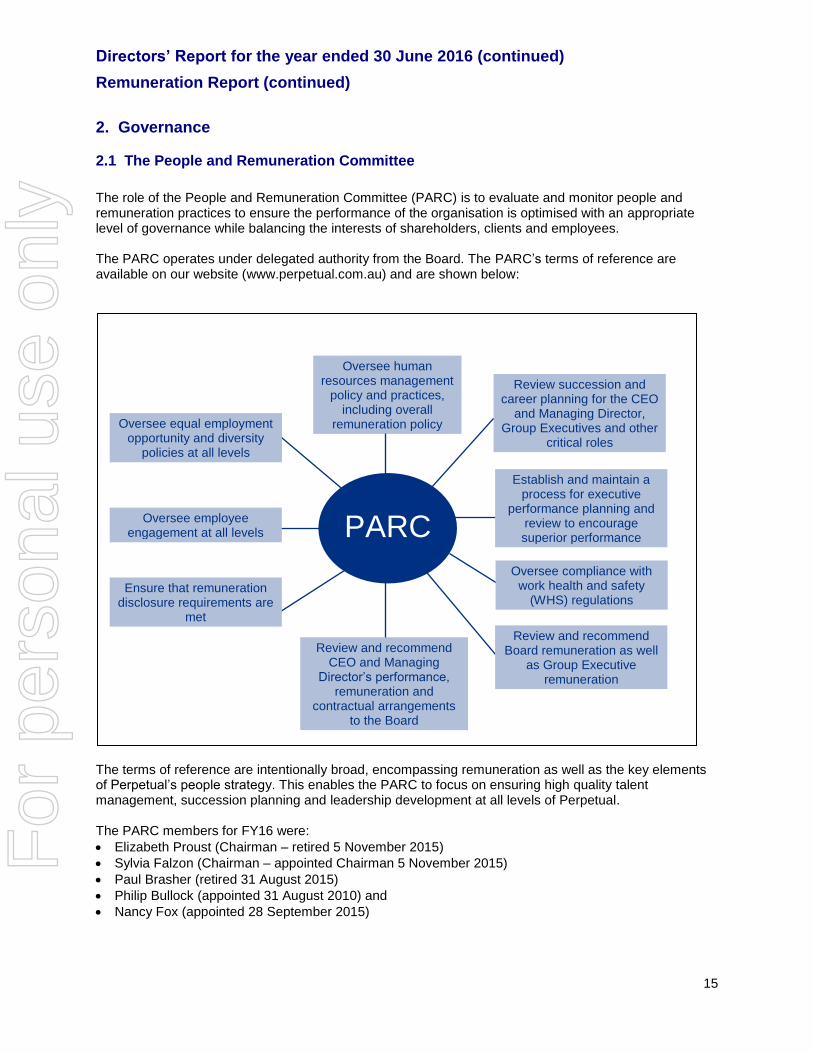
The role of the People and Remuneration Committee (PARC) is to evaluate and monitor people and remuneration practices to ensure the performance of the organisation is optimised with an appropriate level of governance while balancing the interests of shareholders, clients and employees. The PARC operates under delegated authority from the Board. The PARC’s terms of reference are available on our website (www.perpetual.com.au) and are shown below:
The terms of reference are intentionally broad, encompassing remuneration as well as the key elements of Perpetual’s people strategy. This enables the PARC to focus on ensuring high quality talent management, succession planning and leadership development at all levels of Perpetual. The PARC members for FY16 were:
Elizabeth Proust (Chairman – retired 5 November 2015)
Sylvia Falzon (Chairman – appointed Chairman 5 November 2015)
Paul Brasher (retired 31 August 2015)
Philip Bullock (appointed 31 August 2010) and
Nancy Fox (appointed 28 September 2015)
Oversee equal employment opportunity and diversity
policies at all levels
Oversee human resources management
policy and practices, including overall
remuneration policy
Review succession and career planning for the CEO
and Managing Director, Group Executives and other
critical roles
Establish and maintain a process for executive
performance planning and review to encourage superior performance
Oversee employee engagement at all levels
Ensure that remuneration disclosure requirements are
met
Review and recommend CEO and Managing
Director’s performance, remuneration and
contractual arrangements to the Board
Review and recommend Board remuneration as well
as Group Executive remuneration
PARC
Oversee compliance with work health and safety
(WHS) regulations
For
per
sona
l use
onl
y

Directors’ Report for the year ended 30 June 2016 (continued)
Remuneration Report (continued)
16
The PARC met ten times during the year (six times for committee meetings and four times for workshops including all Directors to reflect on and discuss the performance and reward framework changes). A standing invitation exists to all Directors to attend PARC meetings. Attendance at these meetings is set out on page 5 of the Directors’ Report. At the PARC’s invitation, the CEO and Managing Director and Group Executive People and Culture attended meetings, except where matters associated with their own performance evaluation, development and remuneration were considered. The PARC considers advice and views from those invited to attend meetings and draws on services from a range of external sources, including remuneration advisors.
2.2 Use of external advisors In March 2011, the PARC appointed PricewaterhouseCoopers (PwC) as its principal remuneration advisor to provide specialist advice on executive remuneration and other Group-wide remuneration matters. During the year PwC provided general information to the PARC in respect of Executive and Non-executive Director remuneration practices and trends. This information did not include any specific recommendations in relation to the remuneration or fees paid to KMP. In addition, PwC was engaged during the year to support the review of Perpetual’s Performance and Reward framework.
3. Our People
3.1 Diversity and Inclusion Perpetual has a long-standing commitment to diversity and inclusion and recognises the value of attracting and retaining employees with different backgrounds, knowledge, experiences and abilities. Perpetual strongly believes that promoting diversity amongst employees and creating an inclusive environment results in tangible improvements to corporate performance, and better results for shareholders, due to the benefits of diversity of thought. Perpetual has an established Diversity and Inclusion strategy that is reviewed and refreshed regularly to ensure continued progress and impact. The strategy includes three focus areas: Flexibility, Gender Equality and Cultural Diversity. Recognised as a key lever in driving a high performance environment, Perpetual’s continued commitment to workplace flexibility ensures employees can successfully balance life, family and client commitments, and the organisation can continue to attract and retain a diverse and inclusive workforce. To further support flexibility, in 2016, Flexibility is Perpetual was launched - a program focussed on embedding flexible work practices. Revised processes, tools, education and communication approaches were developed to support an ‘all roles flexible environment'. Perpetual’s increased focus on flexibility has resulted in an extremely positive experience for our people, with 81% of our people strongly believing that Perpetual cultivates a culture that embraces flexibility (2016 Employee Engagement Survey). This year has also seen further progress towards our target of achieving a minimum of 38% women in senior leader roles (currently 36%). For further information about Diversity and Inclusion at Perpetual, refer to the Corporate Responsibility Statement, 2016 which can found on Perpetual’s website: https://www.perpetual.com.au/About/Corporate-Governance.
For
per
sona
l use
onl
y

Directors’ Report for the year ended 30 June 2016 (continued)
Remuneration Report (continued)
17
3.2 Employee benefits
At Perpetual we are passionate about protecting and growing the wealth of all Australians and positioning them for financial security in retirement. With our strengthened business performance we are pleased to be able to extend improved benefits to our employees to help them reach their personal goals. A key part of the Company’s superannuation policy is to increase employer contributions to 12% by 2020 (by 0.5% increments applied annually). As highlighted in our report last year, effective 1 September 2015 all employees received the first 0.5% increase in employer superannuation contributions to 10%, with the next 0.5% increase to 10.5% to be effective 1 September 2016. During FY16 we introduced superannuation benefits for employees on parental leave. All eligible employees returning to work from parental leave will now receive superannuation payments on the unpaid portion of their parental leave, up to a maximum of 40 weeks. These initiatives are about helping our employees to build stronger superannuation balances. With the aim of increasing employee share ownership, last year Perpetual introduced the One Perpetual employee share grant program with the first grant of $1,000 being made to employees on 1 September 2015 following our strong financial performance. Enhancing our employee benefits portfolio has been a priority over the past twelve months as we strive to improve the wellbeing of our employees through our range of Wealth, Health and Lifestyle benefits outlined below.
For
per
sona
l use
onl
y

Directors’ Report for the year ended 30 June 2016 (continued)
Remuneration Report (continued)
18
4. Our remuneration philosophy and structure
Perpetual’s remuneration philosophy is designed to align with and support the achievement of our Lead & Grow strategy, whilst ensuring that remuneration outcomes are aligned with our shareholder interests and are market competitive. To that end, we have created a set of guiding principles that direct our remuneration approach.
4.1 Remuneration principles
Our remuneration policy is designed around the following guiding principles:
1. The remuneration structure should attract, motivate and retain the desired talent within Perpetual.
2. The remuneration structure should balance value creation for shareholders, clients and employees.
3. The remuneration structure should facilitate the meaningful accumulation of Perpetual shares that drives an ownership mentality.
4. The remuneration structure should embed sound risk management.
5. Remuneration structure should be simple, transparent and easily understood and administered.
6. The remuneration structure should be supported by a governance framework that avoids conflict of interest and ensures proper controls are in place.
The PARC has also adopted a number of practices that collectively contribute to each remuneration principle.
4.2 Remuneration policy and practice
Alignment with sound risk management
When determining the variable (or ‘at risk’) elements of remuneration, we ensure that risk management is a key performance metric using specific performance goals and targets. Sound risk management practices include:
deeming employees to be ineligible for the payment of STI if they exhibit poor risk behaviours
incorporating goals that are specifically related to risk management performance measures in individual employee scorecards; these goals are approved by the Board and cascade down to all employees
performing scenario testing on potential outcomes under any new incentive plans
regularly reviewing the alignment between remuneration outcomes and performance achievement for existing incentive plans
deferring a portion of STI into Perpetual shares to align remuneration outcomes with longer-term Company performance
including provisions in incentive plans for the Board under the recommendation of the PARC to adjust incentive payments downwards, if required, to protect Perpetual’s financial soundness, or to respond to significant unexpected or unintended consequences
including a provision for the Board under the recommendation of the PARC to ‘claw back’ deferred STI shares in certain circumstances, and
continuous monitoring of remuneration outcomes by the Board, the PARC and management, to ensure that results are promoting behaviours that support Perpetual’s long-term financial soundness and the desired culture.
For
per
sona
l use
onl
y
Directors’ Report for the year ended 30 June 2016 (continued)
Remuneration Report (continued)
19
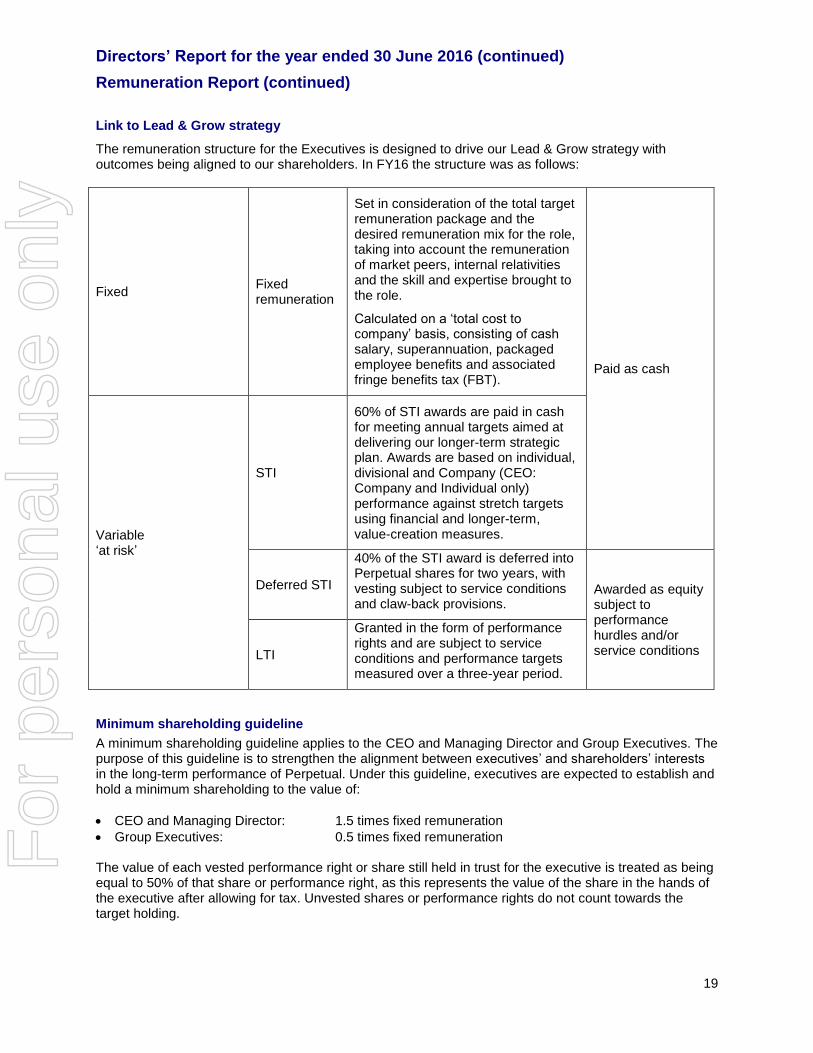
Link to Lead & Grow strategy
The remuneration structure for the Executives is designed to drive our Lead & Grow strategy with outcomes being aligned to our shareholders. In FY16 the structure was as follows:
Fixed Fixed remuneration
Set in consideration of the total target remuneration package and the desired remuneration mix for the role, taking into account the remuneration of market peers, internal relativities and the skill and expertise brought to the role.
Calculated on a ‘total cost to company’ basis, consisting of cash salary, superannuation, packaged employee benefits and associated fringe benefits tax (FBT).
Paid as cash
Variable ‘at risk’
STI
60% of STI awards are paid in cash for meeting annual targets aimed at delivering our longer-term strategic plan. Awards are based on individual, divisional and Company (CEO: Company and Individual only) performance against stretch targets using financial and longer-term, value-creation measures.
Deferred STI
40% of the STI award is deferred into Perpetual shares for two years, with vesting subject to service conditions and claw-back provisions.
Awarded as equity subject to performance hurdles and/or service conditions LTI
Granted in the form of performance rights and are subject to service conditions and performance targets measured over a three-year period.
Minimum shareholding guideline
A minimum shareholding guideline applies to the CEO and Managing Director and Group Executives. The purpose of this guideline is to strengthen the alignment between executives’ and shareholders’ interests in the long-term performance of Perpetual. Under this guideline, executives are expected to establish and hold a minimum shareholding to the value of:
CEO and Managing Director: 1.5 times fixed remuneration
Group Executives: 0.5 times fixed remuneration The value of each vested performance right or share still held in trust for the executive is treated as being equal to 50% of that share or performance right, as this represents the value of the share in the hands of the executive after allowing for tax. Unvested shares or performance rights do not count towards the target holding.
For
per
sona
l use
onl
y

Directors’ Report for the year ended 30 June 2016 (continued)
Remuneration Report (continued)
20
A five-year transition period, from the later of 1 July 2010 or the start of employment, gives executives reasonable time to meet their shareholding guideline. Where the guideline is not met after the required time period, executives may be restricted from trading vested shares. As at 30 June 2016, progress towards the minimum shareholding target for each Executive was as follows:
Value of eligible shareholdings as
at 30 June 20161
Value of minimum
shareholding guideline
Deadline to meet minimum
shareholding guideline
$ $
CEO and Managing Director
G Lloyd 1,248,362 1,875,000 6 February 2017
Group Executives
C Green 1,521,687 240,007 1 October 2013
D Kiddie - 375,000 22 February 2021
G Larkins - 347,000 3 October 2017
R Nash 82,281 295,483 15 August 2017
M Smith - 299,000 19 November 2017
1. Value is calculated through reference to the closing Perpetual share price at 30 June 2016 of $41.12.
Hedging and Share Trading Policy
Consistent with Corporations Act obligations, Perpetual’s Share Trading Policy prohibits employees and Directors from entering into hedging arrangements in relation to Perpetual securities. Perpetual employees and Directors cannot trade in financial products issued over Perpetual securities by third parties or trade in any associated products which limit the economic risk of holding Perpetual securities. Share dealing can only take place during agreed trading windows throughout the year and is subject to certain approvals (as set out below). Share dealing approval
Any share dealings, whether these shares are held personally or were acquired as part of remuneration, require prior approval. The table below shows the approval required:
Person wishing to deal in shares Approval required from
CEO and Managing Director Chairman
Director Chairman
Chairman Nominated Director
Group Executive CEO and Managing Director
An employee likely to have price-sensitive information CEO and Managing Director/Company Secretary
Fixed remuneration increases for FY17
Following a review of market fixed remuneration increase trends, a budget for fixed remuneration increases was set at 3% for all employees, including the Executives. The Board has reviewed the remuneration package for the Executives, and has decided to provide fixed remuneration increases averaging 2.3% (inclusive of the increased employer superannuation contributions) for FY17. F
or p
erso
nal u
se o
nly

Directors’ Report for the year ended 30 June 2016 (continued)
Remuneration Report (continued)
21
Asset manager remuneration
Asset manager remuneration is developed in consideration of the same principles that apply to all remuneration across Perpetual.
The strategy for asset manager remuneration differentiates between asset managers managing what the Company considers to be funds in a mature state as compared to those managing funds in the growth phase. The Company may also vary its practices for differing asset classes such as equities or credit.
In all cases, the Company seeks to align asset manager remuneration with longer-term value creation for our clients which in turn is expected to benefit shareholder outcomes. The remuneration arrangements for asset managers managing funds in the growth phase is structured to appropriately recognise and reward the importance of growth in revenue. For asset managers managing mature funds, the focus is more biased to rewarding longer-term investment performance as measured against the relevant benchmark.
Asset managers receive a significant proportion of their variable remuneration opportunity in the form of deferred pay which may vest over several years. Senior asset managers may elect to receive a percentage of their deferred incentives as a notional investment in the products they manage or as Perpetual shares. This arrangement further builds alignment with clients and/or shareholders over the longer term and aims to ensure that investment professionals have a long-term focus on investment performance and clear visibility of their long-term incentives.
Dividends are normally paid on unvested shares as share grants are usually earned through meeting targets in annual performance agreements; therefore, performance hurdles are already met. Where this is not the case, dividends accrue in a trust structure and are released when and if the shares vest.
The most senior asset managers can receive an annual long-term incentive grant in the form of performance rights subject to performance hurdles. No dividends accrue on these unvested grants as the performance hurdle has not been met.
5. Aligning Company performance and reward
5.1 Five year company performance
One of Perpetual’s remuneration guiding principles is the remuneration structure should balance value creation for our shareholders, clients and employees. This section demonstrates the strong alignment between Company performance and remuneration outcomes for Executives over the last five years. The following table shows the Company’s five-year performance.
30 June 2012 30 June 2013 30 June 2014 30 June 2015 30 June 2016
Net profit after tax reported $m 26.68 60.97 81.62 122.48 132.01
Earnings per share - NPAT1 $ 0.64 1.49 1.86 2.65 2.82
Closing share price $ 22.90 35.40 47.38 48.36 41.12
Total Dividends paid per ordinary share $ 0.90 1.30 1.75 2.40 2.50
1. In FY15 UPAT w as adopted as the primary scorecard measure. In FY16 this changed to NPAT based on feedback from key stakeholders.
Perpetual's five-year performanceYear end
For
per
sona
l use
onl
y

Directors’ Report for the year ended 30 June 2016 (continued)
Remuneration Report (continued)
22
5.2 Short-term incentives
5.2.1 Measuring performance
At the beginning of each financial year, the Board agrees the balanced scorecard goals for Perpetual and each division for the coming year. The scorecard is considered ‘balanced’ because it includes a range of short-term financial and longer-term value-creation measures. This approach aims to balance rewards for meeting financial objectives for the year and rewarding activities designed to deliver sustainable future profits. The authors of balanced scorecards, Robert Kaplan and David Norton (1992), identify balanced goals across four categories:
1. Financial perspective – How do we look to shareholders? 2. Customer perspective – How do customers see us? 3. Internal business perspective – What must we excel at? 4. Innovation and Learning perspective – Can we continue to improve and create value?
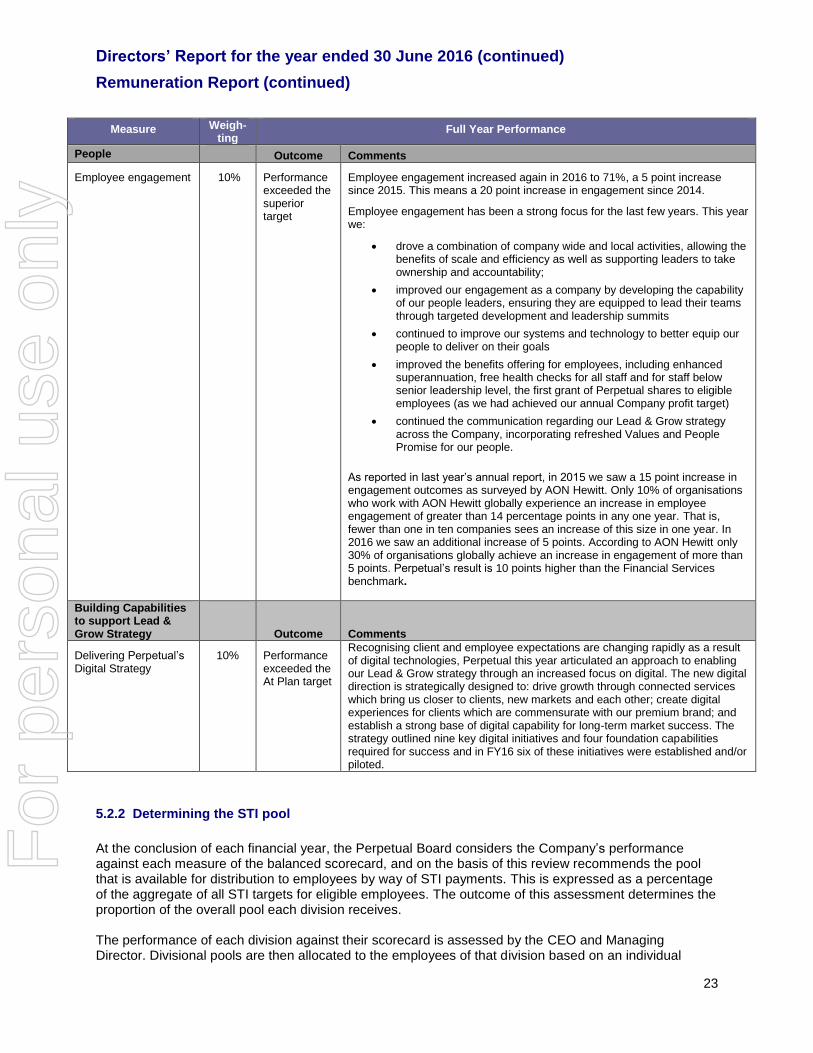
In FY16 Perpetual’s measures included financial, client advocacy, growth, people and building longer-term capabilities to support our Lead & Grow strategy. The appropriate weighting or focus across each category in any one year depends on the strategic priorities for Perpetual. Our balanced scorecard includes stretch targets approved by the Board, allowing the business to be assessed in the context of the operating environment. Financial performance remains a key performance indicator to ensure that STI outcomes under the STI plan are closely aligned with shareholder interests. The balanced scorecard measures for FY16 and performance against those measures are summarised below:
Measure Weigh-ting
Full Year Performance
Financial Outcome Comments
Delivery of net profit after tax (NPAT)
40% Performance exceeded At Plan target
Overall profit is above plan which is a strong result given equity markets have negatively impacted our financial performance.
Clients
Improve client advocacy – external net promoter score (NPS) performance
10% Performance exceeded the superior target
Client Net Promoter Score (NPS) increased again in 2016 to 31, reflecting the focused and disciplined approach to understanding client needs, and commitment to providing an outstanding client experience. All client segments in Perpetual Investments, Perpetual Private and Perpetual Corporate Trust were included in the independent research which noted that results were achieved against a backdrop of market volatility and uncertainty. Particularly in this environment, strongly performing Perpetual teams have delivered on the emotional as well as practical needs of clients who have heightened focus on consistency of delivery, integrity of relationship and quality of communication.
Growth Outcome Comments
Perpetual Corporate Trust (PCT) – New business Revenue
Perpetual Investments (PI) – Grow Revenue in Core Markets
Perpetual Private (PP) – Non Market Related Revenue
30% Performance was At Plan
Performance was below Threshold
Performance was At Plan
Our growth portfolio has benefitted from a more diversified mix, given headwinds in investment markets. We have seen strong new business growth in PCT managed fund services markets and in our non-FUA related revenues in PP. Our core product growth drivers in PI have faced challenges with some institutional clients rebalancing their portfolios. We are still making significant progress on establishing new lines of revenue in PI relating to Global Equities, Pure Credit Alpha and Diversified Real Return investment strategies in accordance with our Lead & Grow strategy. Activity is on track for these PI growth initiatives.
For
per
sona
l use
onl
y
Directors’ Report for the year ended 30 June 2016 (continued)
Remuneration Report (continued)
23
Measure Weigh-ting
Full Year Performance
People Outcome Comments
Employee engagement 10% Performance exceeded the superior target
Employee engagement increased again in 2016 to 71%, a 5 point increase since 2015. This means a 20 point increase in engagement since 2014.
Employee engagement has been a strong focus for the last few years. This year we:
drove a combination of company wide and local activities, allowing the benefits of scale and efficiency as well as supporting leaders to take ownership and accountability;
improved our engagement as a company by developing the capability of our people leaders, ensuring they are equipped to lead their teams through targeted development and leadership summits
continued to improve our systems and technology to better equip our people to deliver on their goals
improved the benefits offering for employees, including enhanced superannuation, free health checks for all staff and for staff below senior leadership level, the first grant of Perpetual shares to eligible employees (as we had achieved our annual Company profit target)
continued the communication regarding our Lead & Grow strategy across the Company, incorporating refreshed Values and People Promise for our people.
As reported in last year’s annual report, in 2015 we saw a 15 point increase in engagement outcomes as surveyed by AON Hewitt. Only 10% of organisations who work with AON Hewitt globally experience an increase in employee engagement of greater than 14 percentage points in any one year. That is, fewer than one in ten companies sees an increase of this size in one year. In 2016 we saw an additional increase of 5 points. According to AON Hewitt only 30% of organisations globally achieve an increase in engagement of more than 5 points. Perpetual’s result is 10 points higher than the Financial Services benchmark.
Building Capabilities to support Lead & Grow Strategy
Outcome Comments
Delivering Perpetual’s Digital Strategy
10% Performance exceeded the At Plan target
Recognising client and employee expectations are changing rapidly as a result of digital technologies, Perpetual this year articulated an approach to enabling our Lead & Grow strategy through an increased focus on digital. The new digital direction is strategically designed to: drive growth through connected services which bring us closer to clients, new markets and each other; create digital experiences for clients which are commensurate with our premium brand; and establish a strong base of digital capability for long-term market success. The strategy outlined nine key digital initiatives and four foundation capabilities required for success and in FY16 six of these initiatives were established and/or piloted.
5.2.2 Determining the STI pool
At the conclusion of each financial year, the Perpetual Board considers the Company’s performance against each measure of the balanced scorecard, and on the basis of this review recommends the pool that is available for distribution to employees by way of STI payments. This is expressed as a percentage of the aggregate of all STI targets for eligible employees. The outcome of this assessment determines the proportion of the overall pool each division receives. The performance of each division against their scorecard is assessed by the CEO and Managing Director. Divisional pools are then allocated to the employees of that division based on an individual
For
per
sona
l use
onl
y

Directors’ Report for the year ended 30 June 2016 (continued)
Remuneration Report (continued)
24
performance score, and target STI of the respective employees. Each year performance targets and goals are set for employees in consideration of the balanced scorecards for their division and the Company to ensure alignment of objectives.
5.2.3 Distributing the STI pool
Performance objectives are assessed throughout the year as part of the performance management process. At year end, an annual assessment of each employee’s performance is made and the STI is then allocated. Individual STI awards are determined through an assessment of overall Company performance against the Company scorecard, divisional performance against a divisional scorecard and individual performance, which includes an assessment of behavioural expectations for all employees. Employees must also meet risk and compliance requirements to be eligible to receive an STI payment. For the FY16 year, 80% of the CEO and Managing Director’s STI outcome was weighted to overall performance against the Company scorecard, with 20% weighted to individual measures. For Group Executives (except David Kiddie) 40% of their STI outcome was weighted to overall performance against the Company scorecard, with 40% weighted to the performance of their division and 20% weighted to individual measures. This equal focus on Company and divisional/individual performance ensures shared accountability for Company performance amongst Group Executives, balanced with divisional and individual priorities. It provides greater scope to differentiate the incentive outcomes for Group Executives to ensure a strong adjustment to individual performance contribution. As David Kiddie commenced in the second half of FY16, he was assessed separately by the CEO and Managing Director and PARC. The Senior Leadership Team (direct reports to Group Executives) also have a portion (30%) of their STI outcome weighted to overall Company scorecard performance. The remaining 70% is weighted to individual and divisional performance measures. The CEO and Managing Director makes recommendations to the PARC on STI allocations for the Group Executives, and these are subject to approval by the Board. The PARC makes recommendations to the Board on the STI allocation for the CEO and Managing Director, and this is also approved by the Board.
5.2.4 Delivering STI awards
STI payments are delivered in cash and deferred Perpetual shares. Cash payments are made in September following the end of the performance year less applicable tax and superannuation. Deferral arrangements
The STI plan requires that 40% of an executive’s STI award be delivered in the form of unvested Perpetual shares. Deferred STI shares may vest after a two-year vesting period, subject to service conditions and claw-back provisions. Dividends on deferred STI shares are paid during the vesting period as the performance criteria for awarding the STI have already been met. Termination of employment
In the event of the CEO and Managing Director or a Group Executive ceasing employment with the Company due to resignation, poor performance or dismissal, all unvested STI shares will be forfeited at the termination date. If an executive is made redundant or retires, dies or exits due to total and permanent disablement, unvested STI shares are retained by the Executive or their estate, with vesting subject to the original two-year period and claw-back provisions. This approach strengthens the alignment between executives’ and shareholders’ interests in the long-term performance of Perpetual, extending beyond each executive’s tenure.
For
per
sona
l use
onl
y

Directors’ Report for the year ended 30 June 2016 (continued)
Remuneration Report (continued)
25
Claw-back provisions
The Board retains a discretion to claw back deferred STI shares awarded to executives prior to the shares vesting if the Board becomes aware of any information that, had it been available at the time STI awards were determined, would have resulted in a different (or zero) STI amount being awarded.
5.2.5 Total STI outcome received for FY16
The table below provides the total STI outcomes (both the cash and deferred portions) received by the Executives for the FY16 performance year. STI awards have increased on an annualised basis from FY15 by 1.8% for the Executives. This is in the context of an 8% increase in NPAT over the same period. Note D Kiddie and M Gordon are excluded for the purposes of this calculation as neither participated for a full year. Name STI Cash STI Deferred Total STI
$ $ $
CEO and Managing Director
G Lloyd 792,217 528,145 1,320,362 107% 0%
Current Group Executives
C Green 296,072 197,381 493,453 103% 0%
D Kiddie 159,836 106,557 266,393 100% 0%
G Larkins 263,373 175,582 438,955 115% 0%
R Nash 185,090 123,394 308,484 116% 0%
M Smith 261,206 174,138 435,344 91% 9%
Former Group Executive
M Gordon - - - 0% 100%
Total 1,957,795 1,305,197 3,262,991 90%
1. Represents the total STI outcome for FY16 (including the deferred portion) as a percentage of target STI.
Percentage
Forfeited
2016 STI
(as % of Target)1
5.3 Long-term incentives
Long-term incentives (LTI) provide executives with remuneration delivered in equity if conditions are met over a three-year period. LTI awards are granted annually, which provides ongoing benefits to executives for increasing shareholder value and are a retention element for the team. This section explains LTI plans in place in FY16 and how they work.
5.3.1 Perpetual Limited Long-term Incentive Plan
Long-term incentives are provided to Executives and selected senior leaders through the Perpetual Limited Long-term Incentive Plan. This plan was introduced in February 2011.
Since 1 October 2012, LTI’s have been awarded to Executives in the form of performance rights. A performance right is a right to acquire a fully paid Perpetual share (or, subject to Board discretion, its cash value) at the end of a performance period, subject to tenure and perfomance hurdles for no consideration. This means that dividends are not received by the Executives on performance rights until they have vested and been converted into Perpetual shares. Performance rights are awarded at no cost to the participant.
For
per
sona
l use
onl
y

Directors’ Report for the year ended 30 June 2016 (continued)
Remuneration Report (continued)
26
Performance targets
LTI grants made to Executives vest subject to two performance measures directly linked to Company performance:
50% of each grant is subject to a relative total shareholder return (TSR) performance target; and
50% is subject to an earnings per share (EPS) growth target.
LTI grants are generally made on 1 October each year. Relative TSR performance target
The TSR performance target requires Perpetual’s TSR over the performance period to be equal to or better than the TSR of half of the comparator group, which consists of companies listed on the S&P/ASX 100 (excluding listed property trusts). This comparator group was chosen in the absence of a suitable peer group of direct competitors. For Relative TSR performance greater than median, a sliding scale applies to determine the vesting percentage. TSR vesting schedule
Perpetual’s TSR ranking relative to the comparator group
Percentage of shares and options that will vest
Less than median 0%
Median 50%
Greater than median but less than 75th percentile 2% for every one percentile increase in Perpetual’s relative position
Greater than 75th percentile 100%
TSR vesting scale
TSR is measured independently by Orient Capital and reported to the PARC. EPS performance target
The EPS performance target requires Perpetual’s EPS growth during the performance period to be equal to or greater than the target set by the Board for 100% of the grant to vest. This target, which is currently 10% per annum, may be reviewed by the Board from time to time.
Growth in EPS is defined as compound average annual growth in the Company’s earnings per share comprising basic earnings per share (after tax). The Board may adjust EPS for items such as those of a capital nature that do not reflect management and employee performance and day-to-day business operations and activities. The underlying principle for making EPS adjustments is that the vesting
For
per
sona
l use
onl
y

Directors’ Report for the year ended 30 June 2016 (continued)
Remuneration Report (continued)
27
outcome should reflect the contribution of participants and that the adjustments should not provide a disadvantage or advantage to participants. The aim is that the resulting EPS outcome fairly reflects management’s contribution to the improvement of EPS since the commencement of the performance period. The achievement of this performance target links the individual’s remuneration to the Company’s growth in earnings.
EPS vesting schedule
For LTI awarded to the Executives, the following vesting schedule applies:
Perpetual’s growth in EPS Percentage of shares that will vest
EPS growth less than or equal to 5% pa 0%
EPS growth between 5% pa and 10% pa 2% for every 0.1% of EPS growth above 5% pa
EPS growth at or above 10% pa 100%
EPS vesting scale
0%
10%
20%
30%
40%
50%
60%
70%
80%
90%
100%
0 5% 10% >10%
Pro
poro
rtio
n of
EP
S c
ompo
nent
elig
ible
to
vest
Perpetual's EPS Growth (% p.a.)No Vesting
Performance target testing and re-testing guidelines
A three-year performance testing period applies to TSR and EPS targets and performance is calculated and tested against the respective target on the third anniversary of the grant date. There is no re-testing of grants. Termination of employment
In the event of an Executive ceasing employment with the Company, all unvested shares and performance rights will be forfeited at the termination date, except as noted below:
On death, all unvested shares and performance rights are retained by the Executive’s estate, with vesting subject to the same performance conditions as if they had remained employed by Perpetual.
If an Executive is made redundant or retires, or resigns due to total and permanent disablement, unvested shares and performance rights granted within the past 12 months lapse immediately. Unvested shares and performance rights granted more than 12 months prior to termination are retained by the executive, with vesting subject to the same performance conditions as if they had remained employed by Perpetual.
For
per
sona
l use
onl
y

Directors’ Report for the year ended 30 June 2016 (continued)
Remuneration Report (continued)
28
This approach strengthens the alignment between executives’ and shareholders’ interest in the long-term performance of Perpetual, extending beyond the executives’ tenure. Treatment of LTI on change in control
If Perpetual were to be taken over or if there were a partial or full change in control, LTI awards may vest in part or in full at the discretion of the Board. Guiding principles have been developed to help the Board determine vesting outcomes that are consistent, fair and reasonable, and balance multiple stakeholder interests.
How LTI aligns to Company performance
The following table shows the vesting outcomes of all LTI issued to Executives with EPS and relative TSR hurdles (past and present) over the last six years. During FY16, the 2012 grant fully vested in respect of both the EPS growth hurdle and the TSR performance hurdle. This was the first time since the 2004 LTI grant (that vested in 2007) that grants relating to both the EPS hurdle and TSR hurdles have fully vested. These vesting outcomes reflect the improved Company performance since 2012.
HurdleGrant Date: 1 October 2010
Vesting Date: 1 October 2013
Grant Date: 1 October 2011
Vesting Date: 1 October 2014
Grant Date: 1 October 2012
Vesting Date: 1 October 2015
Grant Date: 1 October 2013
Vesting Date: 1 October 2016
Grant Date: 1 October 2014
Vesting Date: 1 October 2017
Grant Date: 1 October 2015
Vesting Date: 1 October 2018
EPS 0% 30% 100% yet to be tested yet to be tested yet to be tested
Relative TSR 88% 100% 100% yet to be tested yet to be tested yet to be tested
Annual LTI Grants over the last 6 years: vesting outcomes
For
per
sona
l use
onl
y

Directors’ Report for the year ended 30 June 2016 (continued)
Remuneration Report (continued)
29
5.3.2 Employee share plans Perpetual offers all employees the opportunity to participate in share plans. These are described below.
Open Plans Description
Perpetual Limited Long-term Incentive Plan
115 members
From February 2011, this is the primary plan to be used for LTI grants to eligible employees, including Executives.
One Perpetual Share Plan (OPSP)
575 members. This plan, introduced in FY15, awards eligible employees with annual grants of up to $1,000 worth of Perpetual shares subject to the Company meeting its profit target.
The first grant of shares was made 1 September 2015.
Plans closed to new issue Description
Tax Deferred Share Plan (TDSP)
13 members
This plan is used for awards made under the annual sales incentive plans for eligible employees within the Perpetual Private and Perpetual Corporate Trust teams.
The plan was previously used by employees, including Executives, to buy shares using a salary-sacrifice arrangement. The plan was closed to any new salary-sacrifice purchases during FY10.
Tax Exempt Share Plan (TESP)
28 members This plan was superseded by the One Perpetual Share Plan, with the final grant of shares under the TESP being 4 September 2014.
All employees could elect to sacrifice up to $1,000 of their cash STI payment into shares under the TESP. Shares acquired via this sacrifice were not subject to performance targets as they were acquired in lieu of a cash payment by the Company. The plan’s trading restrictions continue to apply until the earlier of three years from the date of grant or on termination of employment, before the shares can be released. Employees will hold shares under the TESP until the final vesting date in September 2017.
Non-executive Director Share Plan (NEDSP)
1 member
This plan was used only by Non-executive Directors and was closed to new purchases on 1 July 2009, following changes to taxation rules.
Dilution limits for share plans
Shares awarded under Perpetual’s employee share plans may be purchased on market or issued subject to Board discretion and the requirements of the Corporations Act 2001 and the ASX Listing Rules. As at 30 June 2016, the proportion of unvested shares and performance rights (excluding unallocated shares as a result of forfeitures) held in Perpetual’s employee share plans as a percentage of issued shares was 2%. This has remained flat compared to last year. The Board will manage the issue of shares under employee incentive plans to balance market based remuneration for employees with shareholder returns, subject to the relevant regulatory requirements. Refer to page 20 for detail on the share dealing approval process. Going forward, Perpetual will continue to purchase shares on market, which will minimise the dilutionary impact of the employee share plans on shareholders.
For
per
sona
l use
onl
y

Directors’ Report for the year ended 30 June 2016 (continued)
Remuneration Report (continued)
30
6. Data disclosures – Executives 6.1 Remuneration data Remuneration of CEO and Managing Director and Group Executives (statutory reporting)
Termination payments Total
Cash salary1 Cash STI2 Non-monetary
benefits3
Other4 Superannuation Other long- term
benefits6
Deferred STI7 Shares Performance
rights
Name $ $ $ $ $ $ $ $ $ $ $
CEO and Managing Director
G Lloyd
2016 1,095,630 792,217 101,452 20,930 26,585 22,430 506,011 0 805,971 0 3,371,226
2015 1,001,678 696,795 94,775 14,334 28,648 13,194 395,303 60,499 661,086 0 2,966,312
Current Group Executives
C Green
2016 455,756 296,072 0 (9,868) 20,155 19,906 199,942 0 283,890 0 1,265,853
2015 434,050 313,270 0 5,468 18,783 14,808 160,020 29,128 259,454 0 1,234,981
D Kiddie
2016 242,723 159,836 0 572,173 10,162 235 35,519 57,583 0 0 1,078,232
G Larkins
2016 663,874 263,373 0 12,956 26,585 5,100 175,771 0 202,795 0 1,350,454
2015 640,425 289,997 0 9,819 28,533 2,866 148,677 0 142,441 0 1,262,758
R Nash
2016 564,212 185,090 0 13,201 26,585 4,331 114,220 0 104,130 0 1,011,769
2015 557,977 151,720 0 29,805 28,648 2,592 99,534 0 80,136 0 950,412
M Smith
2016 574,779 261,206 0 (1,914) 20,155 4,298 180,470 0 383,269 0 1,422,263
2015 557,550 314,027 0 18,525 18,783 2,391 154,427 37,499 296,371 0 1,399,573
Former Group Executive
M Gordon
2016 273,598 0 0 26,500 22,547 (3,296) (184,908) (42,669) (184,829) 600,000 506,943
2015 547,618 230,918 0 23,570 33,738 2,210 142,993 121,606 138,485 0 1,241,138
Total 2016 3,870,572 1,957,795 101,452 633,978 152,774 53,004 1,027,025 14,914 1,595,226 600,000 10,006,740
Total 2015 3,739,298 1,996,727 94,775 101,521 157,133 38,061 1,100,954 248,732 1,577,973 0 9,055,174
Short-term benefits Post-employment benefits
1. Cash salary is the ordinary cash salary received in the year including payment for annual, long service, sick or other types of paid leave taken.
7. Deferred short-term incentive payments are costs incurred in FY16 for the deferred portion of the current and previous STI aw ards.
5. Share-based remuneration has been valued using the binomial method w hich takes into account the performance hurdles relevant to each issue of equity instruments. The value of each equity instrument has been provided by Pricew aterhouseCoopers.
Share-based remuneration is the amount expensed in the f inancial statements for the year and includes adjustments to reflect the most current expectation of vesting of LTI grants w ith non-market condition hurdles. For grants w ith non-market conditions
including earnings per share hurdles, the number of shares expected to vest is estimated at the end of each reporting period and the amount to be expensed in the f inancial statements is adjusted accordingly. For grants w ith market conditions such as Total
Shareholder Return hurdles, the number of shares expected to vest is not adjusted during the life of the grant and no adjustment is made to the amount expensed in the f inancial statements (except if service conditions are not met). The accounting treatment
of non-market and market conditions are is in accordance w ith accounting standards.
Equity-based benefits 5
2. Cash short-term incentive payments consist of cash payments to be made in September 2016 from the Group STI plan.
6. The expense value of accrued long service leave for FY16.
3. Non-monetary benefits represents those amounts salary sacrif iced from fixed remuneration to pay for benefits such as leased motor vehicles and car parking.
4. Other short-term benefits relate to:
- salary continuance and death and total and permanent disability insurance provided as part of the remuneration package;
- the value of accrued annual leave over 1 July 2015 to 30 June 2016; and
- for D Kiddie it also includes a sign-on bonus payable six months after date of commencement, relocation expenses for f lights, short-term accomodation and f inancial advice.
For
per
sona
l use
onl
y

Directors’ Report for the year ended 30 June 2016 (continued)
Remuneration Report (continued)
31
Remuneration components as a proportion of total remuneration The remuneration components below are determined based on the Remuneration of the Executives (statutory reporting) table on page 30.
STI % LTI %
G Lloyd 37% 39% 24% 100% 24%
C Green 38% 39% 23% 100% 23%
D Kiddie 50% 39% 11% 100% 0%
G Larkins 52% 33% 15% 100% 15%
R Nash 59% 30% 10% 100% 10%
M Smith 42% 31% 27% 100% 27%
This table includes fixed remuneration, STI and LTI. One-off payments such as D Kiddie's sign-on bonus are excluded.
CEO and Managing Director
Current Group Executives
Value of performance
rights as a proportion
of total remuneration
NameFixed
remuneration %
Performance linked benefits
Total %
Value of unvested remuneration that may vest in future years
Estimates of the maximum future cost of equity-based remuneration granted by the Company
1 should all
targets be met in the future.
30-Jun-17 30-Jun-18 30-Jun-19
Maximum Maximum Maximum
$ $ $
CEO and Managing Director
G Lloyd 895,554 503,236 108,309
Current Group Executives
C Green 343,894 184,279 39,409
D Kiddie 183,787 95,857 12,741
G Larkins 258,165 130,074 27,818
R Nash 133,524 70,168 15,300
M Smith 403,825 216,801 46,364
1. The minimum value of the grants is $nil if the performance targets are not met. The values above are determined in accordance
with accounting standards. The fair value of granted shares is recognised as an employee expense with a corresponding increase
in equity. Fair value is measured at grant date and amortised over the period during which employees become unconditionally
entitled to the shares.
For
per
sona
l use
onl
y

Directors’ Report for the year ended 30 June 2016 (continued)
Remuneration Report (continued)
32
Unvested share and performance rights holdings of the Executives
The table below summarises the share and performance rights holdings and movements by number granted to the CEO and Managing Director and Group Executives by Perpetual Limited, for the year ended 30 June 2016. For details of the fair valuation methodology, refer to Section 5-6 (ii) of the notes to and forming part of the financial statements.
Name Instrument Grant date Issue
price
Vesting date Held at 1 July
2015
Granted Forfeited Vested Held at 30 June
2016
Fair value per
instrument at
grant ($) TSR
Hurdle
Fair value per
instrument at
grant ($) non-
TSR hurdle
$
Number of
instruments
Number of
instruments $ $
CEO and Managing Director
G Lloyd Shares 1 October 2013 39.63 1 October 2015 4,946 - - 4,946 - N/A 39.63
Shares 4 September 2014 49.51 30 September 2016 10,611 - - - 10,611 N/A 49.51
Shares 1 September 2015 42.37 30 September 2017 - 10,963 - - 10,963 N/A 42.37
Performance rights 1 October 2012 23.54 1 October 2015 37,383 - - 37,383 - 14.38 23.54
Performance rights 1 October 2013 34.57 1 October 2016 25,455 - - - 25,455 22.65 34.57
Performance rights 1 October 2014 38.00 1 October 2017 29,815 - - - 29,815 21.82 38.00
Performance rights 1 October 2015 33.07 1 October 2018 - 35,319 - - 35,319 19.50 33.07
Aggregate Value1 1,632,502$ -$ 1,693,160$
Current Group Executives
D Kiddie Shares 22 February 2016 39.67 30 September 2017 - 5,041 - - 5,041 N/A 39.67
Shares 22 February 2016 39.67 30 September 2018 - 3,781 - - 3,781 N/A 39.67
Aggregate Value 349,969$ -$ -$
C Green Shares 1 October 2013 39.63 1 October 2015 1,958 - - 1,958 - N/A 39.63
Shares 4 September 2014 49.51 30 September 2016 3,910 - - - 3,910 N/A 49.51
Shares 1 September 2015 42.37 30 September 2017 - 4,929 - - 4,929 N/A 42.37
Performance rights 1 October 2012 23.54 1 October 2015 13,806 - - 13,806 - 14.38 23.54
Performance rights 1 October 2013 34.57 1 October 2016 9,401 - - - 9,401 22.65 34.57
Performance rights 1 October 2014 38.00 1 October 2017 11,184 - - - 11,184 21.82 38.00
Performance rights 1 October 2015 33.07 1 October 2018 - 12,851 - - 12,851 19.50 33.07
Aggregate Value 633,824$ -$ 630,560$
G Larkins Shares 1 October 2013 39.63 1 October 2015 2,379 - - 2,379 - N/A 39.63
Shares 4 September 2014 49.51 30 September 2016 3,199 - - - 3,199 N/A 49.51
Shares 1 September 2015 42.37 30 September 2017 - 4,562 - - 4,562 N/A 42.37
Performance rights 1 October 2012 23.54 1 October 2015 4,800 - - 4,800 - 14.38 23.54
Performance rights 1 October 2013 34.57 1 October 2016 6,682 - - - 6,682 22.65 34.57
Performance rights 1 October 2014 38.00 1 October 2017 7,894 - - - 7,894 21.82 38.00
Performance rights 1 October 2015 33.07 1 October 2018 - 9,071 - - 9,071 19.50 33.07
Aggregate Value 493,270$ -$ 287,160$
R Nash Shares 1 October 2013 39.63 1 October 2015 2,001 - - 2,001 - N/A 39.63
Shares 4 September 2014 49.51 30 September 2016 2,385 - - - 2,385 N/A 49.51
Shares 1 September 2015 42.37 30 September 2017 - 2,387 - - 2,387 N/A 42.37
Performance rights 1 October 2012 23.54 1 October 2015 4,237 - - 4,237 - 14.38 23.54
Performance rights 1 October 2013 34.57 1 October 2016 3,181 - - - 3,181 22.65 34.57
Performance rights 1 October 2014 38.00 1 October 2017 3,948 - - - 3,948 21.82 38.00
Performance rights 1 October 2015 33.07 1 October 2018 - 4,989 - - 4,989 19.50 33.07
Aggregate Value 266,123$ -$ 249,520$
M Smith Shares 1 October 2013 39.63 1 October 2015 2,422 - - 2,422 - N/A 39.63
Shares 4 September 2014 49.51 30 September 2016 3,189 - - - 3,189 N/A 49.51
Shares 1 September 2015 42.37 30 September 2017 - 4,941 - - 4,941 N/A 42.37
Performance rights 1 October 2012 23.54 1 October 2015 11,894 - - 11,894 - 14.38 23.54
Performance rights 1 October 2013 34.57 1 October 2016 14,463 - - - 14,463 22.65 34.57
Performance rights 1 October 2014 38.00 1 October 2017 13,158 - - - 13,158 21.82 38.00
Performance rights 1 October 2015 33.07 1 October 2018 - 15,119 - - 15,119 19.50 33.07
Aggregate Value 709,336$ -$ 572,640$
Former Group Executive
M Gordon Shares 1 July 2013 35.70 1 July 2015 4,482 - - 4,482 - N/A 35.70
Shares 1 July 2013 35.70 1 July 2016 2,241 - 2,241 - - N/A 35.70
Shares 1 October 2013 39.63 1 October 2015 1,884 - - 1,884 - N/A 39.63
Shares 4 September 2014 49.51 30 September 2016 4,046 - 4,046 - - N/A 49.51
Shares 1 September 2015 42.37 30 September 2017 - 3,633 3,633 - - N/A 42.37
Performance rights 1 October 2013 34.57 1 October 2016 10,124 - 10,124 - - 22.65 34.57
Performance rights 1 October 2014 38.00 1 October 2017 11,184 - 11,184 - - 21.82 38.00
Aggregate Value 153,930$ 1,267,232$ 298,137$
Number of instruments
1. Granted aggregate value is calculated by multiplying the number of shares by the issue price. Vested and forfeited aggregate value is calculated by multiplying the number of shares by the Perpetual closing
share price on the vesting date.
Movement during the year
For
per
sona
l use
onl
y

Directors’ Report for the year ended 30 June 2016 (continued)
Remuneration Report (continued)
33
Actual remuneration received
The table below provides a summary of actual remuneration received by the Executives during FY16. This includes:
fixed remuneration (consisting of cash salary, superannuation, packaged employee benefits and associated fringe benefits tax);
the cash component of short-term incentives awarded for performance in FY15 (paid September 2015);
the value of equity grants awarded in previous years which vested during the year;
cash dividends received during the year on unvested LTI shares received during the year; and
sign on and termination payments. This table differs from the remuneration table on page 30, which has been constructed in accordance with the requirements of the relevant accounting standards. It includes remuneration received on a cash basis rather than an accrual basis.
Name Total fixed
remuneration
STI cash1 Equity
vested
during year2
Dividends paid
on unvested
shares during
year3
Sign-on and
relocation
benefits4
Payments
made on
termination5
Total
$ $ $ $ $ $ $
CEO and Managing Director
G Lloyd 1,223,667 696,795 1,693,160 60,118 - - 3,673,740
Current Group Executives
C Green 475,911 313,270 630,560 24,545 - - 1,444,286
D Kiddie 252,885 - - 11,028 61,316 - 325,229
G Larkins 690,459 289,997 287,160 22,376 - - 1,289,992
R Nash 590,797 151,720 249,520 14,431 - - 1,006,468
M Smith 594,934 314,027 572,640 23,353 - - 1,504,954
Former Group Executive
M Gordon 296,145 230,918 298,160 14,755 - 300,000 1,139,978
Totals 4,124,798 1,996,727 3,731,200 170,605 61,316 300,000 10,384,646
4. D Kiddie's relocation expenses for f lights, short-term accomodation and financial advice. Subject to certain contractual obligations, D Kiddie's
sign-on bonus w ill be paid six months after commencement of employment in FY17.
1. Represents the cash portion of STI outcome for FY15 paid in September 2015.
3. Dividends paid during FY16 on FY15 deferred STI shares and for D Kiddie and M Gordon unvested sign-on tranches of shares
2. For G Lloyd, C Green, G Larkins, R Nash and M Smith this represents the value at vesting of the 2012 LTI grant made on 1 October 2012, and
the vesting of deferred STI shares granted 1 October 2013. These shares w ere valued at $40.00 being the closing market value of Perpetual
shares on the vesting date of 1 October 2015.
For M Gordon, this includes the value at vesting of the deferred STI shares vesting 1 October 2015 and the vesting of his sign-on equity grant that
vested 1 July 2015. These shares have been valued at $49.71, being the closing market value of Perpetual shares on the vesting date of 1 July
2015.
D Kiddie recently joined the organisation and had no vested shares or rights in FY16.
5. M Gordon received $300,000 as a termination payment, and w ill receive a further $300,000 in FY17 follow ing execution of contractual
obligations. F
or p
erso
nal u
se o
nly

Directors’ Report for the year ended 30 June 2016 (continued)
Remuneration Report (continued)
34
6.2 Contract arrangements Contract terms for the CEO and Managing Director
Contract details
Geoff Lloyd, Chief Executive Officer and Managing Director
Term of contract Open-ended
Fixed remuneration $1,250,000 per annum, reviewed in accordance with Perpetual’s policies.
STI
Target STI of 100% of fixed remuneration STI amounts are determined by the Board taking into account the executive’s performance against performance criteria determined by the Board annually. The performance criteria include threshold risk measures and behaviour objectives which must be met by the executive for any STI to be awarded. Subject to the Board’s discretion, the executive may be required to apply a proportion of his STI payment to acquire deferred STI shares.
LTI
From FY15, eligible to receive LTI grants of 100% of fixed remuneration provided by way of performance shares, performance rights or options in such proportions determined by the Board annually in its discretion.
Vesting of LTI grants is subject to performance targets determined by the Board and advised to the executive prior to the effective date of grant.
Termination of
employment
The agreement contains provisions for the termination of Mr Lloyd’s employment as follows: (a) Termination by Mr Lloyd on 12 months' notice in writing to the Board (or such shorter
period as may be agreed). In the event the Board agrees to a notice period of less than 12 months, the agreement will be subject to no entitlement to receive a payment of fixed remuneration (or any other remuneration or amount) in respect of any period after termination date. There is no entitlement for STI for that financial year; and unvested STI held as shares and all unvested LTI is forfeited.
(b) Termination by the Company on 12 months’ notice in writing (or such shorter period as
may be agreed). The executive is entitled to be considered for a STI payment for that financial year; and unvested STI held as shares and unvested LTI due to vest within two years of the termination date, will remain eligible for vesting, subject to satisfaction of performance conditions in due course. Unvested LTI due to be tested after two years of the termination date is forfeited.
(c) If the executive becomes incapacitated by illness or injury for an accumulated period of
three months in any 12-month period, the Company may terminate this agreement by giving 12 months’ notice in writing (or such shorter period as may be agreed). The executive is entitled to a pro-rata STI for that financial year; and unvested STI held as shares and unvested LTI due to vest within two years of the termination date, will remain eligible for vesting, subject to satisfaction of performance conditions in due course. Unvested LTI due to be tested after two years of the termination date is forfeited.
(d) Termination without notice following an agreed material diminution event. Upon such
termination, the Company must, within 7 days, pay the executive fixed remuneration in lieu of 12 months’ notice and a pro-rata STI for that financial year. Unvested STI held as shares and unvested LTI due to vest within two years of the termination date, will remain eligible for vesting, subject to satisfaction of performance conditions in due course. Unvested LTI due to be tested after two years of the termination date is forfeited.
For
per
sona
l use
onl
y

Directors’ Report for the year ended 30 June 2016 (continued)
Remuneration Report (continued)
35
Contract details
Geoff Lloyd, Chief Executive Officer and Managing Director
Termination of
employment
(continued)
(e) Termination by the Company for poor performance on six months’ notice in writing (or such shorter period as may be agreed) or termination by the Company without notice. There is no entitlement for STI for that financial year; and unvested STI held as shares and all unvested LTI is forfeited.
(f) Termination in the event of Mr Lloyd's death - his estate is entitled to pro-rata STI for
that financial year; and unvested STI held as shares and unvested LTI remain eligible for vesting subject to satisfaction of performance conditions in due course.
The agreement also provides that the Company may elect to make a payment in lieu of notice.
Termination terms for Group Executives
Term Who Conditions
Duration of contract All Group Executives Ongoing until notice is given by either party1
Notice to be provided by Group Executive to terminate the employment agreement
Chris Green 3 months
All other Group Executives 6 months
Notice to be provided by Perpetual to terminate the employment agreement for poor performance
All Group Executives 3 months
Notice to be provided by Perpetual to terminate the employment agreement without cause
Chris Green 3 months
All other Group Executives 6 months
Termination payments and/or benefits to be made on termination without cause
Payment in lieu of notice
All Group Executives Group Executives are entitled to payment in lieu of any unexpired part of the notice period.
STI
All Group Executives
Subject to the terms and conditions of the STI plan.
LTI
All Group Executives Subject to the terms of the offer and the LTI plan.
Termination for cause Payment in lieu of notice
Chris Green 3 months
All other Group Executives 6 months
For
per
sona
l use
onl
y

Directors’ Report for the year ended 30 June 2016 (continued)
Remuneration Report (continued)
36
Term Who Conditions
Termination for cause (continued)
STI
All Group Executives Subject to the terms and conditions of the STI plan.
LTI
All Group Executives Subject to the terms of the offer and LTI plan.
Post-employment restraints All Group Executives 12 months from the date on which notice of termination is given
1. D Kiddie is currently employed and sponsored on a 457 VISA which has a maximum duration of 4 years from commencement. This visa can be renewed at any time.
7. Executive remuneration changes for FY17
In late 2015, with the launch of our Lead & Grow strategy earlier that year, the Board decided it was timely to review our performance and reward arrangements across Perpetual. We asked ourselves:
Are our existing arrangements attracting, retaining and motivating key talent?
To what extent can the alignment of interest between performance and shareholder outcomes be strengthened? and
Is there a better way? Over a six month period, the Board undertook a review, under the guidance of the PARC and the Board appointed remuneration advisor, PwC. This extensive review resulted in the introduction of a new remuneration structure for the CEO and Managing Director and Group Executives for FY17 that will combine our existing short term and long term incentive arrangements into a simplified variable incentive plan. Whilst this does not impact the remuneration arrangements in this year’s Report, details of the new plan are summarised in this section for the benefit of our shareholders and other interested parties.
The intention of the new plan is to seek to maximise long-term value creation for shareholders while attracting, retaining and motivating our Executives to execute on our Lead & Grow strategy. We strongly believe the new plan will:
Better align Executives with shareholders via ownership of equity encouraging long term decision making.
Reinforce an ownership mentality by accelerating the accumulation of shares in executive’s hands subject to delivering the necessary performance requirements.
Achieve closer alignment of variable incentives to performance against key business metrics. We believe balanced scorecards remain essential in assessing the performance of the business through the market cycles.
Deliver greater differentiation of reward for over and underachievement against agreed targets
Reduce complexity and opacity.
Strengthen retention of our Executives. We believe there is motivational value in a variable pay framework, which provides both greater ‘line of sight’ and ability to influence the company’s performance outcome.
7.1 The new Variable Incentive Plan
Variable remuneration for our Executives currently consists of short term incentive (STI) and long term
incentive (LTI) plans. The proposed structure combines these elements into a single variable incentive
plan with long term deferral. The table over the page summarises key features of the plan changes.
For
per
sona
l use
onl
y

Directors’ Report for the year ended 30 June 2016 (continued)
Remuneration Report (continued)
37
Feature From (Old Plan) To (New Plan)
Remuneration components
Fixed
Cash STI
Deferred STI (equity)
LTI
Fixed
Single Variable Incentive (cash and equity)
Incentive Cap (% of target)
STI = 200%
LTI = 100%
Variable Incentive = 175%
Duration to access equity post grant
Deferred STI = 2 years
LTI = 3 years
Variable Incentive = 4 years
Performance hurdles
STI = Balanced Scorecard + compliance and behaviours
LTI = EPS and Relative TSR
Balanced Scorecard + compliance and behaviours
Performance Assessment Period
STI = 1 year
LTI = 3 years
Variable Incentive = 1 year
The initial variable incentive targets for current Executives will be set to the equivalent level of existing
STI targets and LTI awards on a ‘fair value’ basis. Fair value, as calculated by PwC, is a valuation
approach based on accepted methodologies and is consistent with accounting standards and disclosures
in the Remuneration Report. Fair value considers the probability of an LTI award vesting including
volatility, time to maturity, dividend yield and share price movement.
Approximately one third of the variable incentive outcome will be paid in cash at the end of the
performance year. The remaining two thirds of the variable incentive outcome will be delivered as share
rights, which will vest and be satisfied by the allocation of restricted shares, subject to ongoing
employment conditions, after two years. Restricted shares are subject to a holding lock for an additional
two years, with no risk of forfeiture other than for summary dismissal. Dividends will be payable to the
Executive in respect of restricted shares but not share rights.
As performance has been fully assessed to calculate the amount paid as a variable incentive, no
additional performance hurdles apply to the share rights or restricted shares.
Going forward, awards will be granted on a face value basis using a 5 day Volume Weighted Average
Price and likely to occur around each 1 September.
For
per
sona
l use
onl
y

Directors’ Report for the year ended 30 June 2016 (continued)
Remuneration Report (continued)
38
Remuneration mix The Executives will continue to have a significant portion of their remuneration linked to performance and at risk. For FY17, there continues to be a strong alignment to long-term incentives for the Executives, as Perpetual believes in meaningful equity ownership that increases shareholder alignment for this key group.
Total remuneration will continue to be set within consideration of Perpetual’s market peers. The table below shows the FY17 on-target remuneration mix (using full-time equivalent remuneration) for the Executives under the new plan.
Fixed Variable Incentive
(cash) Variable Incentive
(equity)
CEO and Managing Director 36% 22% 42%
Group Executives 38 - 60% 16 - 25% 24 - 40%
8. Non-executive Director remuneration
8.1 Remuneration policy and data
The Company’s Remuneration Policy for Non-executive Directors aims to ensure that we can attract and retain suitably skilled, experienced and committed individuals to serve your Board. Non-executive Directors do not receive performance-related remuneration and are not entitled to receive performance shares or options over Perpetual shares as part of their remuneration arrangements. Fee framework
Non-executive Directors receive a base fee. Except for the Chairman, they also receive fees for participating in Board Committees (other than the Nominations Committee), either as Chairman or as a member of a committee.
For
per
sona
l use
onl
y

Directors’ Report for the year ended 30 June 2016 (continued)
Remuneration Report (continued)
39
Non-executive Directors’ fees FY16 FY17
$ $
Chairman 300,000 300,000
Directors 150,000 150,000
Audit Risk and Compliance Committee Chairman 35,000 35,000
Audit Risk and Compliance Committee Member 17,000 17,000
People and Remuneration Committee Chairman1
30,000 35,000
People and Remuneration Committee Member1
15,000 17,000
Investment Committee Chairman 17,500 17,500
Investment Committee Member 10,000 10,000
Nominations Committee Member Nil Nil
1. In FY17, the fees for the Chairman and Members of the People and Remuneration Committee w ill be increased to the equivalent
fee level w ith those of the Audit, Risk and Compliance Committee. The fees above are inclusive of superannuation contributions, capped at the maximum prescribed under Superannuation Guarantee legislation. Non-executive Directors may receive employer superannuation contributions in one of Perpetual’s employee superannuation funds or in a complying fund of their choice. Non-executive Directors may also salary-sacrifice superannuation contributions out of their base fee if they so wish. Total remuneration available to Non-executive Directors of $2,250,000 was approved by shareholders at the 2006 Annual General Meeting. Total fees paid to Non-executive Directors in FY16 were $1,285,450. More details are provided on page 40. Retirement policy
Non-executive Directors who have held office for three years since their last appointment must retire and seek re-election at the Annual General Meeting. In order to revitalise the Board, Perpetual’s Non-executive Directors agree not to seek re-election after three terms of three years. However, the Board may invite a Non-executive Director to continue in office beyond nine years if there is a compelling reason and determined by the Board to be in the best interests of shareholders. No retirement benefits are paid to Non-executive Directors.
For
per
sona
l use
onl
y

Directors’ Report for the year ended 30 June 2016 (continued)
Remuneration Report (continued)
40
Remuneration of the Non-executive Directors (statutory reporting) Details of Non-executive Director remuneration are set out in the table below.
Short-term benefits Post employment benefits
Perpetual Board fees Superannuation Total
Name $ $ $
Current Non-executive Directors
P B Scott
2016 280,692 19,308 300,000
2015 269,217 18,783 288,000
P Bullock
2016 164,665 15,643 180,308
2015 154,338 14,662 169,000
S Falzon
2016 170,303 16,179 186,482
2015 156,164 14,836 171,000
N Fox
2016 126,043 11,974 138,017
2015 - - -
I Hammond
2016 169,322 25,085 194,407
2015 35,669 3,389 39,058
C Ueland
2016 149,500 35,000 184,500
2015 143,000 35,000 178,000
Former Non-executive Directors
P V Brasher
2016 30,441 2,892 33,333
2015 177,169 16,831 194,000
E M Proust
2016 62,468 5,935 68,403
2015 174,429 16,571 191,000
Total 20162 1,153,434 132,016 1,285,450
Total 2015 1,109,986 120,072 1,230,058
1. Non-executive Directors do not receive any non-cash benefits as part of their remuneration.
2. The total Non-executive Director fee increase from 2015 to 2016 w as due to a conscious decision to overlap service
of departing Directors and ensure continuation of know ledge as new Directors joined the Perpetual Board. Alignment with shareholder interests
The constitution requires Non-executive Directors to acquire a minimum of 500 Perpetual shares on appointment and hold a total of at least 1,000 shares when they have held office for three years. However, Non-Executive Directors are encouraged to hold ordinary Perpetual shares equivalent in value to 100% of their annual base fee within a reasonable period of their appointment.
For
per
sona
l use
onl
y

Directors’ Report for the year ended 30 June 2016 (continued)
Remuneration Report (continued)
41
The Non-executive Directors’ Share Purchase Plan (now closed) allowed Non-executive Directors to sacrifice up to 50% of their Directors fees to acquire shares in Perpetual. Shares acquired in this way are not subject to performance targets, as they are acquired in place of cash payments. Following changes to tax rules, this plan was closed on 1 July 2009. Shares are held in the plan until the earlier of ten years or retirement from the Board. Non-executive Directors do not receive share options. Directors’ holdings held directly or indirectly (for example, through a superannuation fund) are shown below. Perpetual Directors are required to comply with Perpetual’s Hedging and Share Trading policies. Non-executive Director shareholdings held directly or indirectly
Name
Balance at the start of
the year
Other changes during
the year
Balance at the end of
the year
P B Scott 6,646 237 6,883
P Bullock 3,063 187 3,250
S Falzon 2,267 138 2,405
N Fox - 2,000 2,000
I Hammond 3,750 - 3,750
C Ueland 3,000 - 3,000
Number of shares
For
per
sona
l use
onl
y

Directors’ Report for the year ended 30 June 2016 (continued)
Remuneration Report (continued)
42
9. Key terms used in this Report
9.1 Remuneration policy and data
Annualised target remuneration
The total remuneration calculated as the sum of fixed remuneration, short-term incentive (STI) at target and the face value of long-term incentive (LTI) grants.
Balanced scorecard The business performance measures agreed by the Board to assess Company performance for the purposes of determining the funding of the short-term incentive pool. More details are on pages 22-23.
EPS Earnings per share for the purpose of determining performance against LTI performance targets. When measuring the growth in EPS to determine the vesting of long-term incentive awards, we define EPS as net profit after tax divided by the average number of issued shares during the year. The Board may adjust EPS for items such as those of a capital nature that do not reflect management and employee performance and day-to-day business operations and activities. The underlying principles for making EPS adjustments is that the vesting outcome should reflect the contribution of participants and that the adjustments should not provide a disadvantage or advantage to participants.
Executives The CEO and Managing Director and the Group Executives.
Group Executives Direct reports of the CEO and Managing Director who are disclosed in this report.
KMP Key Management Personnel. Those people who have the authority and responsibility for planning, directing and controlling the Company’s activities, either directly or indirectly. Key Management Personnel disclosed in this Report are the CEO and Managing Director, Group Executives and Non-executive Directors of Perpetual.
LTI Long-term incentive. LTI seeks to align executive remuneration with sustainable shareholder wealth creation. More details are on page 25.
Market peers For the purposes of benchmarking remuneration practices and levels, Perpetual’s market peers refers to listed companies in the diversified financial services industry (excluding major banks and other financial services companies in the Standard & Poor’s (S&P)/ASX 20).
NPAT Net profit after tax. NPAT is the net profit after tax in accordance with the Australian Accounting Standards.
Orient Capital Independent adviser to Perpetual who provides assessment of Relative Total Shareholder Return performance based on Perpetual’s comparative peer group.
STI Short-term incentive. An incentive paid to employees for meeting annual targets aimed at delivering our longer-term strategic plan. Under the STI Plan employees may be paid a discretionary incentive (less applicable taxes and superannuation) based on their individual performance as well as business performance. For executives, a fixed portion of STI is paid in cash and a portion deferred into Perpetual shares. The Board retains discretion to claw back deferred STI shares in certain circumstances. More details are on page 22.
TSR Total shareholder return. TSR is defined as share price growth plus dividends paid over the measurement period. Dividends are assumed to be reinvested on the ex-dividend date. Note: Perpetual’s LTI hurdle is Relative TSR.
For
per
sona
l use
onl
y

43
Directors' Report for the year ended 30 June 2016 (continued)
Non-audit services provided by the External Auditor
Fees for non-audit services paid to KPMG in the current year were $35,000 (2015: $52,500).
The Board has a review process in relation to any non-audit services provided by the external auditor. The Board considered the non-audit services provided by the auditor and is satisfied that the provision of these non-audit services by the auditor is compatible with, and does not compromise, the auditor independence requirements of the Corporations Act 2001 for the following reasons:
all non-audit services are subject to the corporate governance procedures adopted by the Company and are reviewed by the Audit, Risk and Compliance Committee to ensure they do not impact the integrity and objectivity of the auditor, and
non-audit services provided do not undermine the general principles relating to auditor independence as set out in APES 110 Code of Ethics for Professional Accountants, as they do not involve reviewing or auditing the auditor’s own work, acting in a management or decision-making capacity for the Company, acting as an advocate for the Company or jointly sharing risks and rewards.
The Lead Auditor's independence declaration for the 30 June 2016 financial year is included at the end of this report.
Rounding off
The Company is of a kind referred to in ASIC Corporations Instrument 2016/191 dated 1 April 2016 and, in accordance with that Instrument, amounts in the financial report and the Directors' Report have been rounded off to the nearest thousand dollars, unless otherwise stated.
This report is made in accordance with a resolution of the Directors:
Peter Scott Geoff Lloyd Chairman Chief Executive Officer and Managing Director Sydney 25 August 2016
For
per
sona
l use
onl
y
44
Lead Auditor’s Independence Declaration under Section 307C of the Corporations Act 2001
To: the directors of Perpetual Limited
I declare that, to the best of my knowledge and belief, in relation to the audit for the financial year ended 30 June 2016 there have been:
(i) no contraventions of the auditor independence requirements as set out in the Corporations Act 2001 in relation to the audit; and
(ii) no contraventions of any applicable code of professional conduct in relation to the audit.
KPMG
Martin McGrath
Partner Sydney
25 August 2016
KPM_INI_01
PAR_SIG_01 PAR_NAM_01 PAR_POS_01 PAR_DAT_01 PAR_CIT_01
For
per
sona
l use
onl
y

45
Financial Statements of Perpetual Limited and its controlled entities for the year ended 30 June 2016
Table of contents
Primary statements Consolidated Statement of Profit or Loss and Other Comprehensive Income ................................................ 47 Consolidated Statement of Financial Position ................................................................................................. 48 Consolidated Statement of Changes in Equity ................................................................................................ 49 Consolidated Statement of Cash Flows ........................................................................................................... 50 Section 1 Group performance ........................................................................................................................................ 51 1-1 Operating segments ................................................................................................................................... 51 1-2 Revenue ..................................................................................................................................................... 54 1-3 Expenses ................................................................................................................................................... 54 1-4 Income taxes .............................................................................................................................................. 55 1-5 Earnings per share ..................................................................................................................................... 58 1-6 Dividends ................................................................................................................................................... 59 1-7 Net cash from operating activities .............................................................................................................. 60 Section 2 Operating assets and liabilities .................................................................................................................... 61 2-1 Business combinations .............................................................................................................................. 61 2-2 Receivables ................................................................................................................................................ 62 2-3 Other financial assets ................................................................................................................................ 62 2-4 Property, plant and equipment ................................................................................................................... 63 2-5 Intangibles .................................................................................................................................................. 64 2-6 Provisions ................................................................................................................................................... 66 2-7 Employee benefits ..................................................................................................................................... 68 Section 3 Capital management and financing .............................................................................................................. 69 3-1 Cash and cash equivalents ........................................................................................................................ 69 3-2 Borrowings ................................................................................................................................................. 69 3-3 Contributed equity ...................................................................................................................................... 70 3-4 Reserves .................................................................................................................................................... 71 3-5 Commitments and contingencies ............................................................................................................... 71 Section 4 Risk management........................................................................................................................................... 73 4-1 Financial risk management ........................................................................................................................ 73 Section 5 Other disclosures ........................................................................................................................................... 83 5-1 Structured products assets and liabilities .................................................................................................. 83 5-2 Parent entity disclosures ............................................................................................................................ 86 5-3 Controlled entities ...................................................................................................................................... 88 5-4 Unconsolidated structured entities ............................................................................................................. 91 5-5 Non-controlling interest .............................................................................................................................. 92 5-6 Share-based payments .............................................................................................................................. 93 5-7 Key management personnel and related parties ....................................................................................... 97 5-8 Auditor's remuneration ............................................................................................................................... 99 5-9 Subsequent events .................................................................................................................................... 99
For
per
sona
l use
onl
y
46
Financial Statements of Perpetual Limited and its controlled entities for the year ended 30 June 2016
Table of contents (continued) Section 6 Basis of preparation..................................................................................................................................... 100 6-1 Reporting entity ........................................................................................................................................ 100 6-2 Basis of preparation ................................................................................................................................. 100 6-3 Other significant accounting policies ....................................................................................................... 102 6-4 New standards and interpretations not yet adopted ................................................................................ 104 Directors' declaration ...................................................................................................................................... 106 Independent auditor’s report to the members of Perpetual Limited ............................................................... 107 Additional information Securities exchange and investor information ............................................................................................... 109
For
per
sona
l use
onl
y

47
Consolidated Statement of Profit or Loss and Other Comprehensive Income
for the year ended 30 June 2016
Section 2016 2015$'000 $'000
Revenue 1-2 507,729 510,877
Expenses 1-3 (321,608) (333,250)Financing costs (2,809) (3,472)
Net profit before tax 183,312 174,155
Income tax expense 1-4 (51,307) (50,352)
Net profit after tax 132,005 123,803
Other comprehensive income
Items that are or may be reclassified subsequently to profit or loss:Cash flow hedges - net change in fair value of effective portion - 317Foreign currency translation differences - foreign operations 54 36
(7,519) 4,807
191 63
(19) (2,047)Income tax on items that may be reclassified to profit or loss 1-4 2,204 (1,323)Other comprehensive income, net of income tax (5,089) 1,853
Total comprehensive income 126,916 125,656
Net profit after tax attributable to:132,005 122,484
Non-controlling interests - 1,319132,005 123,803
Total comprehensive income attributable to:Equity holders of Perpetual Limited 126,916 125,604Non-controlling interests - 52Total comprehensive income 126,916 125,656
Earnings per share1-5 290.8 273.7 1-5 284.3 265.3
Equity holders of Perpetual Limited
Loss on previously impaired available-for-sale financial assets reclassified to profit or loss upon disposal
Impairment of available-for-sale financial assets reclassified toprofit or loss
Available-for-sale financial assets - net change in fair value
Basic earnings per share – cents per share Diluted earnings per share – cents per share
The Consolidated Statement of Profit or Loss and Other Comprehensive Income is to be read in conjunction with the 'Notes to and forming part of the financial statements' set out on pages 51 to 105.
For
per
sona
l use
onl
y

48
Consolidated Statement of Financial Position as at 30 June 2016
Section 2016 2015$'000 $'000
AssetsCash and cash equivalents 3-1 278,230 289,356Receivables 2-2 88,156 91,435Structured products – EMCF assets 5-1 299,694 294,882Prepayments 12,129 10,736
Total current assets 678,209 686,409
Other financial assets Property, plant and equipment 2-4 24,832 15,348Intangibles 2-5 339,324 332,756Deferred tax assets 1-4 30,384 30,225Prepayments 5,067 6,550
Total non-current assets 475,100 436,921
Total assets 1,153,309 1,123,330
LiabilitiesPayables 38,523 37,167Structured products – EMCF liabilities 5-1 299,971 291,478Current tax liabilities 1-4 21,863 27,491
Employee benefits 2-7 49,871 48,584Provisions 2-6 1,570 6,019
Total current liabilities 411,798 410,739
Payables 3,568 -Borrowings 3-2 87,000 87,000Deferred tax liabilities 1-4 20,125 19,591Employee benefits 2-7 6,860 5,033Provisions 2-6 18,439 17,273
Total non-current liabilities 135,992 128,897
Total liabilities 547,790 539,636
Net assets 605,519 583,694
EquityContributed equity 3-3 493,465 481,888Reserves 3-4 17,165 23,482Retained earnings 94,889 78,324
Total equity attributable to equity holders of Perpetual Limited 605,519 583,694
Non-controlling interest - -
Total equity 605,519 583,694
75,493 52,0422-3
The Consolidated Statement of Financial Position is to be read in conjunction with the 'Notes to and forming part of the financial statements' set out on pages 51 to 105.F
or p
erso
nal u
se o
nly

49
Consolidated Statement of Changes in Equity for the year ended 30 June 2016
$'000Balance at 1 July 2015 551,926 (70,038) 14,865 8,617 78,324 583,694 - 583,694
Total comprehensive income/(expense) - - - (5,089) 132,005 126,916 - 126,916
Movement on treasury shares 829 10,748 (12,573) - 996 - - -Equity remuneration expense - - 11,345 - - 11,345 - 11,345Dividends paid to shareholders - - - - (116,436) (116,436) - (116,436)Balance at 30 June 2016 552,755 (59,290) 13,637 3,528 94,889 605,519 - 605,519
$'000Balance at 1 July 2014 555,296 (94,489) 26,766 5,497 51,701 544,771 11,631 556,402
Total comprehensive income/(expense) - - - 3,120 122,484 125,604 52 125,656
Movement on treasury shares (3,370) 24,451 (22,884) - 1,945 142 - 142Equity remuneration expense - - 10,983 - - 10,983 - 10,983Dividends paid to shareholders - - - - (97,806) (97,806) - (97,806)
Non-controlling interest - - - - - - (11,683) (11,683)Balance at 30 June 2015 551,926 (70,038) 14,865 8,617 78,324 583,694 - 583,694
Gross contributed
equity
Treasury share
reserve
Equity compensation
reserve
Retained earnings
Retained earnings
Equity compensation
reserve
Gross contributed
equity
Treasury share
reserve
Equity holders of Perpetual
Other reserves
Total
Total
Non-controlling
interest
Equity holders of Perpetual
Non-controlling
interest
Other reserves
The Consolidated Statement of Changes in Equity is to be read in conjunction with the 'Notes to and forming part of the financial statements' set out on pages 51 to 105.
For
per
sona
l use
onl
y

50
Consolidated Statement of Cash Flows for the year ended 30 June 2016
Section 2016 2015$'000 $'000
Cash flows from operating activitiesCash receipts in the course of operations 547,060 569,462Cash payments in the course of operations (346,022) (409,349)Dividends received 99 263Interest received 6,408 8,719Interest paid (2,809) (3,472)Income taxes paid (54,951) (36,392)Net cash from operating activities 1-7 149,785 129,231
Cash flows from investing activitiesPayments for property, plant, equipment and software (17,272) (15,812)Payments for investments (37,208) (57,706)Repayments of advances made under the Employee Share Purchase Plan - 117Payment for acquisition of business (5,767) -Proceeds from sale of property, plant and equipment - 38Proceeds from sale of businesses 153 1,523Proceeds from the sale of investments 15,619 53,032Net cash used in investing activities (44,475) (18,808)
Cash flows from financing activitiesSale of units in seed funds to non-controlling interests - (5,846)Dividends paid (116,436) (97,806)Net cash used in financing activities (116,436) (103,652)
Net (decrease)/increase in cash and cash equivalents (11,126) 6,771Cash and cash equivalents at 1 July 289,356 282,585
Cash and cash equivalents at 30 June 3-1 278,230 289,356
The Consolidated Statement of Cash Flows is to be read in conjunction with the 'Notes to and forming part of the financial statements' set out on pages 51 to 105.
For
per
sona
l use
onl
y

51
Notes to and forming part of the financial statements for the year ended 30 June 2016
Section 1 Group performance This section focuses on the results and performance of Perpetual as a consolidated entity. On the following pages you will find disclosures explaining Perpetual's results for the year, segmental information, taxation, earnings per share and dividend information. Where an accounting policy is specific to a single note, the policy is described in the section to which it relates.
1-1 Operating segments
An operating segment is a component of the consolidated entity that engages in business activities from which it may earn revenues and incur expenses, including revenues and expenses that relate to transactions with any of the consolidated entity's other components and for which discrete financial information is available. All operating segments' operating results are regularly reviewed by the consolidated entity's CEO to make decisions about resources to be allocated to the segment and assess their performance. Segment results that are reported to the CEO include items directly attributable to a segment as well as those that can be allocated on a reasonable basis. Unallocated items comprise mainly corporate assets, head office expenses, income tax expenses, assets and liabilities. The following summary describes the operations in each of the reportable segments: i. Services provided The consolidated entity operates in the financial services industry in Australia and Singapore and provides wealth management and corporate trust services. The major services from which the reportable segments derive revenue are: Perpetual Investments Manufacturer of financial products, management and investment of
monies on behalf of private, corporate, superannuation and institutional clients.
Perpetual Private Perpetual Private provides a wide range of investment and non-investment products and services. These include a comprehensive advisory service, portfolio management, philanthropic, executorial and trustee services to high net worth and emerging high net worth Australians. Perpetual Private also provides many of these services to charities, not for profit and other philanthropic organisations.
Perpetual Corporate Trust Perpetual Corporate Trust provides fiduciary services incorporating safe-keeping and recording of assets and transactions as custodian, responsible entity services, trustee services for securitisation, unit trusts, REITS and debt securities, data warehouse and investor reporting and registrar, or agent for corporate and financial services clients.
ii. Geographical information The consolidated entity operates in Australia and Singapore. The Singapore operation is not material. iii. Major customer The consolidated entity does not rely on any major customer. F
or p
erso
nal u
se o
nly

52
Notes to and forming part of the financial statements for the year ended 30 June 2016 1-1 Operating segments (continued)
Private Wealth
30 June 2016
External revenues 233,666 167,487 87,265 488,418Interest revenue 634 154 35 823Total revenue for reportable segment 234,300 167,641 87,300 489,241
(1,938) (9,656) (5,094) (16,688)Reportable segment net profit before tax 118,093 34,157 34,112 186,362Reportable segment assets 341,093 212,319 185,529 738,941Reportable segment liabilities (328,853) (25,158) (4,700) (358,711)Capital expenditure 436 1,282 1,692 3,410
30 June 2015
External revenues 246,514 166,235 82,458 495,207Interest revenue 1,168 299 35 1,502Total revenue for reportable segment 247,682 166,534 82,493 496,709
(1,477) (9,046) (4,074) (14,597)Reportable segment net profit before tax 125,606 37,464 31,256 194,326Reportable segment assets 345,741 204,381 191,662 741,784Reportable segment liabilities (317,438) (18,048) (9,020) (344,506)Capital expenditure 521 41 8,011 8,573
Perpetual
Investments1
$’000
Perpetual Private
$’000
Perpetual Corporate
Trust $’000
Total
$’000
Depreciation and amortisation
1Segment information for Perpetual Investments includes the Exact Market Cash Funds, refer to section 5-1(i).
Depreciation and amortisation
For
per
sona
l use
onl
y

53
Notes to and forming part of the financial statements for the year ended 30 June 2016
2016 2015$'000 $'000
1-1 Operating segments (continued)
RevenuesTotal revenue for reportable segments 489,241 496,709Add: Group and Support Services revenue 9,331 8,533Net gain on sale of investments 2,124 5,522Total revenue from continuing operations 500,696 510,764
Net profit before tax186,362 194,326
Financing costs (2,809) (3,472)Net recoveries 5,227 -Impairment of assets (191) (63)Gain on sale of business 153 113Net gain on sale of investments 2,124 5,522Gain on sale of property, plant and equipment - 15TrustCo integration costs - (15,882)Group and Support Services expense (7,554) (6,404)Net profit before tax 183,312 174,155
Total assetsTotal assets for reportable segments 738,941 741,784Group and Support Services assets 414,368 381,546Total assets 1,153,309 1,123,330
Total liabilities Total liabilities for reportable segments 358,711 344,506Group and Support Services liabilities 189,079 195,130Total liabilities 547,790 539,636
Reconciliations of reportable segment revenues, net profit before tax, total assets and liabilities
Total net profit before tax for reportable segments
For
per
sona
l use
onl
y

54
Notes to and forming part of the financial statements for the year ended 30 June 2016
2016 2015$'000 $'000
1-2 Revenue
Revenue from the provision of services 477,392 485,099Income from structured products 11,055 10,109Dividends 95 88Interest and unit trust distribution 10,030 9,946Net gain on sale of investments 2,124 5,522Revenue from continuing operations 500,696 510,764Recoveries 6,880 -Gain on sale of business 153 113
507,729 510,877
Accounting policies
Revenue is recognised at fair value of consideration received or receivable net of goods and services tax.
Revenue from the provision of services Revenue is earned from provision of services to customers outside the consolidated entity. Revenue is recognised when services are provided.
Income from structured products Income represents fees earned on managing the Exact Market Cash Funds.
Dividends Dividend income is recognised in profit or loss on the date the consolidated entity’s right to receive payment is established which, in the case of quoted securities, is the ex-dividend date.
Interest and unit trust distributions Interest income is recognised as it accrues taking into account the effective yield of the financial asset.
Unit trust distributions are recognised in profit or loss as they are received.
Net gain on sale of investments Net gain on sale of investments represents proceeds less costs on sale of available-for-sale assets.
Recoveries Represents recoveries from insurers.
2016 2015$'000 $'000
1-3 Expenses
Staff related expenses excluding equity remuneration expense 174,427 177,057Occupancy expenses 17,152 19,350Administrative and general expenses 95,706 103,595Distributions and expenses relating to structured products 6,496 7,936Equity remuneration expense 10,703 10,383Depreciation and amortisation expense 16,933 14,881Impairment of assets 191 63Gain on sale of property, plant and equipment - (15)
321,608 333,250
Accounting policies
Expenses are recognised at the fair value of the consideration paid or payable for services received.
For
per
sona
l use
onl
y

55
Notes to and forming part of the financial statements for the year ended 30 June 2016
2016 2015$'000 $'000
1-4 Income taxes
Current year tax expense
Current year tax expense 55,392 49,707
Adjustment for prior years (450) (26)
Research and development tax incentives from prior years (1,061) (411)
Total current tax expense impacting income taxes payable 53,881 49,270
Deferred tax expenseTemporary differences (2,574) 1,082Total income tax expenses (2,574) 1,082
Profit before tax for the year 183,312 174,155
Prima facie income tax expense calculated at 30% (2015: 30%) onprofit for the year 54,994 52,247
– Accounting gains on disposal of investments and businesses (689) (1,689)– Accounting impairment on assets 57 19– Prior year adjustments (1,511) (436)– Other non-assessable income and tax credits (1,887) (337)– Other non-deductible expenses 343 548Total 51,307 50,352
Income taxes payable at the beginning of the year 27,491 14,695Income taxes payable for the financial year 53,881 49,270Less: reclassification to deferred tax liabilities (4,594) -Less: tax paid during the year (54,951) (36,392)Add/Less: other adjustments 36 (82)Income taxes payable at the end of the year 21,863 27,491
Represented in the Statement of Financial Position by:Current tax liabilities 21,863 27,491
Effective tax rate (ETR) 28% 29%
Bases of calculation of ETRThe ETR is calculated as income tax expense divided by profit before tax for the year.
Explanation of variance to the legislated 30% tax rate
The consolidated entity operates in Australia and Singapore. The Singapore operation is not material to the consolidated entity and has no material impact on the calculation of the ETR.
The consolidated entity's effective tax rate for the year was 28% (2015: 29%). The 2% reduction in the effective tax rate compared to the legislated 30% is mainly attributed to the Research and Development incentives claimed in respect of the prior year and to the utilisation of previously unrecognised realised capital tax losses to offset realised capital gains distributed from unit trust investments during the year.
For
per
sona
l use
onl
y

56
Notes to and forming part of the financial statements for the year ended 30 June 2016 1-4 Income taxes (continued) Bases of calculation of ETR (continued)
Capital tax (gains)/losses calculated at 30% tax in Australia The total tax benefits of realised capital tax losses are $32,336,000 (2015: $34,992,000), comprising $2,709,000 (2015: $2,392,000) recognised in deferred tax assets and $29,627,000 (2015: $32,600,000) not recognised in deferred tax assets. These are net realised tax capital gains and losses incurred in the current and/or prior year and are available to be utilised by the Australian income tax consolidated group in future years.
Movement in deferred tax balances
Balance 1 July 2015
Recognised in profit or
loss
Recognised in other
comprehensive income
Acquired in business
combinations Other1
Balance 30 June
2016$'000 $'000 $'000 $'000 $'000 $'000
Deferred tax assetsProvisions and accruals 9,485 (465) - - - 9,020Capital expenditure deductible over five years 1,565 (691) - - 95 969Employee benefits 16,085 780 - 139 - 17,004Property, plant and equipment 263 (75) - - - 188Realised net capital losses 2,392 317 - - - 2,709Unrealised net capital losses - 11 102 - - 113Other items 435 (54) - - - 381Deferred tax assets 30,225 (177) 102 139 95 30,384
Deferred tax liabilitiesIntangible assets (15,953) 2,552 - (698) (3,073) (17,172)Unrealised net capital gains (3,634) (7) 2,102 - - (1,539)Property, plant and equipment - 204 - - (1,616) (1,412)Other items (4) 2 - - - (2)Deferred tax liabilities (19,591) 2,751 2,102 (698) (4,689) (20,125)
Net deferred tax assets 10,634 2,574 2,204 (559) (4,594) 10,259
2016
1Reclassification from current tax liabilities.
For
per
sona
l use
onl
y

57
Notes to and forming part of the financial statements for the year ended 30 June 2016
1-4 Income taxes (continued) Movement in deferred tax balances
Balance
1 July 20141Recognised in
profit or loss
Recognised in other
comprehensive income
Acquired in business
combinationsBalance
30 June 2015$'000 $'000 $'000 $'000 $'000
Deferred tax assetsProvisions and accruals 10,653 (1,168) - - 9,485
Capital expenditure deductible over five years 2,449 (884) - - 1,565Structured products - interest received in advance 861 (861) - - -Employee benefits 15,914 171 - - 16,085Property, plant and equipment 737 (474) - - 263Realised net capital losses 2,511 (119) - - 2,392Unrealised net capital losses 99 (4) (95) - -Other items 558 (123) - - 435Deferred tax assets 33,782 (3,462) (95) - 30,225
Deferred tax liabilitiesIntangible assets (17,973) 2,020 - - (15,953)Unrealised net capital gains (2,407) 1 (1,228) - (3,634)Other items (363) 359 - - (4)Deferred tax liabilities (20,743) 2,380 (1,228) - (19,591)
Net deferred tax assets 13,039 (1,082) (1,323) - 10,6341Prior year comparatives were restated to reflect the fair value adjustments to the purchase price allocation of TrustCo during the measurement year.
2015
Accounting policies Income tax expense comprises current and deferred tax. Income tax expense is recognised in the net profit or loss except to the extent that it relates to items recognised directly in equity, in which case it is recognised in other comprehensive income. Current tax is the expected tax payable on the taxable income for the year, using tax rates enacted or substantially enacted at reporting date and any adjustment to tax payable in respect of previous years. Deferred tax is recognised in respect of temporary differences between carrying amounts of assets and liabilities for financial reporting purposes and amounts used for taxation purposes. Deferred tax is not recognised for the following temporary differences:
the initial recognition of goodwill the initial recognition of assets or liabilities that affect neither accounting nor taxable profit differences relating to investments in subsidiaries to the extent that they probably will not
reverse in the foreseeable future.
Deferred tax is measured at the tax rates that are expected to be applied to the temporary differences when they reverse, based on the laws that have been enacted or substantively enacted by the reporting date. A deferred tax asset is recognised to the extent that it is probable that future taxable profits will be available against which temporary differences can be utilised. Deferred tax assets are reviewed at each balance date and are reduced to the extent that it is no longer probable that the related tax benefit will be realised. Deferred tax assets and liabilities are netted when there is a legally enforceable right to offset current tax assets and liabilities and when the deferred tax balances relate to the same taxation authority. Current tax assets and tax liabilities are offset where the entity has a legally enforceable right to offset and intends either to settle on a net basis, or to realise the asset and settle the liability simultaneously.
For
per
sona
l use
onl
y

58
Notes to and forming part of the financial statements for the year ended 30 June 2016
1-4 Income taxes (continued) Accounting policies (continued) Additional income taxes that arise from the distribution of dividends are recognised at the same time as the liability to pay the related dividend is recognised. Perpetual Limited and its wholly owned Australian entities elected to form an income tax consolidated group as of 1 July 2002. As a consequence, all members of the tax consolidated group are taxed as a single entity and governed by a tax funding agreement. Under the agreement, all wholly owned Australian entities fully compensate Perpetual Limited for any current income tax payable assumed and are compensated by Perpetual Limited for any current tax receivable and deferred tax assets relating to unused tax losses or unused tax credits that are transferred to Perpetual Limited under the income tax consolidation legislation. The funding amounts are determined by reference to the amounts recognised in the members’ financial statements.
2016 2015
1-5 Earnings per share
290.8 273.7 Diluted earnings per share 284.3 265.3
$'000 $'000
132,005 122,484
Weighted average number of ordinary shares (basic) 45,390,402 44,759,022
1,041,334 1,408,072
46,431,736 46,167,094
Number of shares
Effect of dilutive potential ordinary shares (including those subject to performance rights)Weighted average number of ordinary shares (diluted)
Cents per share
Basic earnings per share
Net profit after tax attributable to equity holders of Perpetual Limited
Accounting policies The consolidated entity presents basic and diluted earnings per share (EPS) data for its ordinary shares. Basic EPS is calculated by dividing the net profit or loss attributable to ordinary shareholders of the Company by the weighted average number of ordinary shares outstanding during the period, adjusted for shares held by the Company's employee share plan trust. Diluted EPS is determined by dividing the net profit or loss attributable to ordinary shareholders by the weighted average number of ordinary shares outstanding, adjusted for shares held by the Company's sponsored employee share plan trust and for the effects of all dilutive potential ordinary shares, which comprise shares and options/rights granted to employees under long-term incentive and retention plans. F
or p
erso
nal u
se o
nly

59
Notes to and forming part of the financial statements for the year ended 30 June 2016
1-6 Dividends
Cents per share
Total amount $'000
Franked / Unfranked
Date of payment
2016Final 2015 ordinary 125 58,218 Franked 25 Sep 2015Interim 2016 ordinary 125 58,218 Franked 24 Mar 2016Total amount 250 116,436
2015Final 2014 ordinary 95 44,246 Franked 3 Oct 2014Interim 2015 ordinary 115 53,560 Franked 27 Mar 2015Total amount 210 97,806
All franked dividends declared or paid during the year were franked at a tax rate of 30 per cent and paid out of retained earnings. The Company introduced a Dividend Reinvestment Plan (DRP) in May 2009. The DRP is optional and offers ordinary shareholders in Australia and New Zealand the opportunity to acquire fully paid ordinary shares, without transaction costs. Shareholders can elect to participate in or terminate their involvement in the DRP at any time. Subsequent events Since the end of the financial year, the Directors declared the following dividend. The dividend has not been provided for and there are no tax consequences.
Cents per share
Total amount1
$'000Franked /
UnfrankedDate of
payment
Final 2016 ordinary 130 60,547 Franked 28 Sep 20161Calculation based on the ordinary shares on issue as at 30 June 2016.
The financial effect of this dividend has not been brought to account in the financial statements for the year ended 30 June 2016 and will be recognised in subsequent financial reports.
2016 2015Dividend franking account $'000 $'000
45,932 46,488Amount of franking credits available to shareholders for subsequent financial years
The above available amounts are based on the balance of the dividend franking account at 30 June 2016 adjusted for franking credits that will arise from the payment of the current tax liabilities, and franking credits that will arise from the receipt of dividends recognised as receivables by the tax consolidated group at the year end. The ability to utilise the franking credits is dependent upon there being sufficient available profits to declare dividends. The impact on the dividend franking account of dividends proposed after the balance date, but not recognised as a liability, is to reduce it to $19,983,000 (2015: $21,537,000). Accounting policies Dividends are recognised as a liability in the year in which they are declared.
For
per
sona
l use
onl
y

60
Notes to and forming part of the financial statements for the year ended 30 June 2016
2016 2015$'000 $'000
1-7 Net cash from operating activities
Profit for the year 132,005 122,484
Items classified as investing/financing activities:
Profit on sale of investments (2,124) (5,522)
Reinvestment of dividends and unit distributions (2,646) (9,640)
Working capital acquired from business combination (128) -
Leave liabilities acquired from business combination (454) -
Net deferred tax recognised from business combinations (559) -Fair value adjustment to identifiable net assets from finalisation of purchase price allocation - 9,548
Gain from sale of business (153) (113)
Gain on sale of property, plant and equipment - (15)
Non-cash items:
Depreciation and amortisation 16,933 14,881
Equity remuneration expense 11,345 10,983
Transfer to foreign currency translation reserve 54 36
Mark to market movements on available-for-sale including minority interest (7,550) (793)
Impairment of available-for-sale securities 191 63
(Increase)/decrease in assets
Receivables 3,279 (5,937)
Prepayments 90 (1,372)
Net structured products assets - (1,931)
Deferred tax assets (159) 3,557
Assets held for sale - 1,119
Cash flow hedge reserve - 221
Increase/(decrease) in liabilities
Payables 4,924 (5,848)
Provisions (3,283) (14,405)
Derivative liabilities - (191)
Liabilities held for sale - (111)
Current tax liabilities (5,628) 12,796
Deferred tax liabilities 534 (1,152)
Employee benefits 3,114 573
Net cash from operating activities 149,785 129,231
Reconciliation of profit for the year to net cash from operating activities
For
per
sona
l use
onl
y

61
Notes to and forming part of the financial statements for the year ended 30 June 2016
Section 2 Operating assets and liabilities This section shows the assets used to generate Perpetual's trading performance and the liabilities incurred as a result. Liabilities relating to the Group’s financing activities are addressed in Section 3.
2-1 Business combinations Fintuition Group On 10 December 2015, Perpetual acquired 100% of Fintuition and its related brands (collectively referred to as the Fintuition Group) including the Private Practice, one of Australia’s leading business, financial and lifestyle educators for medical specialists. The acquisition of the Fintuition Group extends the consolidated entity’s ability to offer its breadth of services across accounting, tax, estate planning and financial advice to the medical sector and is directly aligned with the Lead & Grow Strategy. During the year, in accordance with AASB3 Business Combinations, the Company completed its purchase price allocation. This acquisition was not material to the Group’s assets or results. Accounting policies Business combinations are accounted for using the acquisition method as at the acquisition date, which is the date on which control is transferred to the consolidated entity. In assessing control, the consolidated entity takes into consideration potential voting rights that currently are exercisable. The consolidated entity measures goodwill at the acquisition date as:
the fair value of the consideration transferred; plus the recognised amount of any non-controlling interests in the acquiree; plus if the business combination is achieved in stages, the fair value of the existing equity interest in the
acquiree; less the net recognised amount (generally fair value) of the identifiable assets acquired and liabilities
assumed. When the excess is negative, a bargain purchase gain is recognised immediately in profit or loss. The consideration transferred does not include amounts related to the settlement of pre-existing relationships. Such amounts are generally recognised in profit or loss.
Costs related to the acquisition, other than those associated with the issue of debt or equity securities, that the consolidated entity incurs in connection with a business combination are expensed as incurred.
Any contingent consideration payable is recognised at fair value at the acquisition date. If the contingent consideration is classified as equity, it is not remeasured and settlement is accounted for within equity. Otherwise, subsequent changes to the fair value of the contingent consideration are recognised in profit or loss.
When share-based payment awards (replacement awards) are required to be exchanged for awards held by the acquiree's employees (acquiree's awards) and related to past services, then all or a portion of the amount of the acquirer's replacement award is included in measuring the consideration transferred in the business combination. This determination is based on the market-based value of the replacement awards compared with the market-based value of the acquiree's awards and the extent to which the replacement awards relate to past and/or future service.
For
per
sona
l use
onl
y

62
Notes to and forming part of the financial statements for the year ended 30 June 2016
2016 2015$'000 $'000
2-2 Receivables
CurrentTrade receivables 86,611 85,065Less : Provision for doubtful debts (3,400) (1,382)
83,211 83,683Other receivables 4,945 7,752
88,156 91,435
Balance as at beginning of the year 1,382 1,591Doubtful debts provided for during the year 2,285 -Receivables written off during the year as uncollectible (267) (209)Balance as at end of the year 3,400 1,382
Movements in the provision for doubtful debts are as follows:
Movements in the provision for doubtful debts have been recognised in Administrative and general expenses in section 1-3. Amounts charged to the provision account are generally written off when there is no expectation of additional recoveries. Accounting policies Receivables comprise trade and other receivables. Trade and other receivables are recognised initially at fair value and subsequently measured at amortised cost using the effective interest rate method, less an allowance for impairment. Collectability of trade receivables is reviewed on an ongoing basis and at balance date, specific impairment losses are recorded for any doubtful debts.
2016 2015$'000 $'000
2-3 Other financial assets
Non-currentListed equity securities available-for-sale – at fair value 2,083 2,014Unlisted unit trusts available-for-sale – at fair value 72,965 49,617Other 445 411
75,493 52,042
Accounting policies Available-for-sale financial assets The consolidated entity’s investments in equity securities and unlisted unit trusts are classified as available-for-sale financial assets. Refer to section 4-1(a).
For
per
sona
l use
onl
y

63
Notes to and forming part of the financial statements for the year ended 30 June 2016
2-4 Property, plant and equipment
Plant and equipment
Leasehold improvements
Project work in
progress Total$'000 $'000 $'000 $'000
Year ended 30 June 2016Cost 8,803 36,074 8,220 53,097Accumulated depreciation (6,261) (22,004) - (28,265)
Carrying amount 2,542 14,070 8,220 24,832
MovementBalance as at 1 July 2015 2,769 11,996 583 15,348Additions 748 2,194 10,216 13,158Transfers from work in progress - 2,579 (2,579) -Depreciation (975) (2,699) - (3,674)Disposals - - - -
Balance as at 30 June 2016 2,542 14,070 8,220 24,832
Accounting policies Recognition and measurement Property, plant and equipment are measured at cost or deemed cost less accumulated depreciation and impairment losses. Where parts of an item of property, plant and equipment have different useful lives, they are accounted for as separate items of property, plant and equipment. Project work in progress Work in progress is measured at cost and relates to assets not yet available for use. Depreciation Depreciation is recognised on a straight-line basis over the estimated useful lives of each part of an item of property, plant and equipment. The estimated useful lives for the current and comparative periods are as follows: plant and equipment: 4 - 10 years leasehold improvements: 3 - 15 years. The residual value, useful life and depreciation method applied to an asset are reassessed at least annually.
For
per
sona
l use
onl
y

64
Notes to and forming part of the financial statements for the year ended 30 June 2016
2-5 Intangibles
Goodwill
$'000Customer contracts
Capitalised software
Project work in
progressOther Total
276,959 55,688 56,140 1,975 1,913 392,675 - (22,407) (29,368) - (1,576) (53,351)
276,959 33,281 26,772 1,975 337 339,324
Balance at 1 July 2015 267,031 37,389 18,366 9,970 - 332,756Business combinations 9,928 1,988 - - 337 12,253
- - 164 7,410 - 7,574 - - 15,405 (15,405) - - - (6,096) (7,163) - - (13,259)
- - - - - -
276,959 33,281 26,772 1,975 337 339,324
267,031 53,700 40,571 9,970 1,576 372,848- (16,311) (22,205) - (1,576) (40,092)
267,031 37,389 18,366 9,970 - 332,756
267,031 43,357 18,433 2,645 60 331,526 - - 43 12,394 - 12,437 - - 5,069 (5,069) - - - (5,968) (5,179) - (60) (11,207) - - - - - -
267,031 37,389 18,366 9,970 - 332,756
Intangible assets
At costAccumulated amortisation
Carrying amount
Year ended 30 June 2016
AdditionsTransfersAmortisation expense
Disposals
Balance as at 30 June 2016
Year ended 30 June 2015
At costAccumulated amortisation
Carrying amount
Disposals
Balance as at 30 June 2015
Balance at 1 July 2014AdditionsTransfersAmortisation expense
For
per
sona
l use
onl
y

65
Notes to and forming part of the financial statements for the year ended 30 June 2016
2-5 Intangibles (continued)
2016 2015$'000 $'000
Goodwill Impairment TestingThe following cash-generating units have significant carrying amounts of goodwill:
146,490 136,562Perpetual Corporate Trust 126,973 126,973Australian Equities (Perpetual Investments) 3,496 3,496
276,959 267,031
Perpetual Private
The recoverable amount has been determined on a consistent basis across each cash-generating unit (CGU) by using their value in use. The following assumptions have been applied across each CGU:
The value in use is estimated based on the net present value of future cash flow projections to be realised from each of the CGU’s over the next three years plus a terminal value;
The discount rates used in the current year ranged from 12.0% to 13.5% (2015: 11.9% to 13.4%). The forecast cash flows used in impairment testing are based on assumptions as to the level of profitability for each business over a projected three year period. These forecasted cash flows are based on the 2017-2019 Business Plan which has been approved by the Board. The main drivers of revenue growth are the value of funds under management (FUM) in the Australian Equities CGU, funds under advice (FUA) in the Perpetual Private CGU and securitisation and capital flows in the Perpetual Corporate Trust CGU. A terminal value with a growth rate of 2.5% has also been applied. Other than the normal operating changes linked to ongoing business initiatives, the assumptions do not include the effects of any future restructuring to which the consolidated entity is not yet committed or of future cash outflows by the consolidated entity which will improve or enhance the consolidated entity’s performance. At the reporting date, there is no reasonable change in key assumptions that could cause the carrying amount to exceed the recoverable amount. The estimated recoverable amount is greater than the carrying value for each CGU. For the estimated recoverable amount to be equal to the carrying amount, the discount rate would have to increase from 12.0% to 23.0% (2015: 11.9% to 21.7%). Accounting policies Goodwill Goodwill that arises upon the acquisition of subsidiaries is included in intangible assets (refer to section 2-1). Goodwill represents the excess of acquisition cost over the fair value of the consolidated entity’s share of the net identifiable assets of the acquired subsidiary or associate at the date of acquisition. Goodwill is allocated to cash-generating units and is not amortised, but tested for impairment annually. Goodwill is measured at cost less accumulated impairment losses. Gains and losses on the disposal of an entity include the carrying amount of goodwill relating to the entity sold. Amortisation For those intangible assets which are amortised, the amortisation is calculated over the cost of the asset, or another amount substituted for cost, less its residual value.
For
per
sona
l use
onl
y

66
Notes to and forming part of the financial statements for the year ended 30 June 2016
2-5 Intangibles (continued) Accounting policies (continued) Amortisation (continued) The estimated useful lives in the current and comparative periods are as follows:
capitalised software: 2.5 - 7 years customer contracts and relationships acquired: 5 - 10 years
Amortisation methods, useful lives and residual values are reviewed at each financial year end and adjusted if appropriate. Software Certain internal and external costs directly incurred in acquiring and developing software have been capitalised and are amortised over their useful lives. Development costs include only those costs directly attributable to the development phase and are only recognised following completion of a technical feasibility study and where the consolidated entity has an intention and ability to use the asset. Costs incurred on software maintenance are expensed as incurred. Other intangible assets Other intangible assets acquired by the consolidated entity, which have finite useful lives, are stated at cost less accumulated amortisation and impairment losses. Subsequent expenditure Subsequent expenditure is capitalised only when it increases future economic benefits embodied in the specific asset to which it relates. All other expenditure is expensed as incurred.
2-6 Provisions
2016 2015$'000 $'000
Current
Insurance and legal provision 563 3,791Operational process review provision 449 1,041Lease expense provision 522 1,187Other provisions 36 -
1,570 6,019
Non-currentLease expense provision 18,439 17,273
18,439 17,273
For
per
sona
l use
onl
y

67
Notes to and forming part of the financial statements for the year ended 30 June 2016
2-6 Provisions (continued)
$'000
Carrying amount at
1 July 2015
Additional provision
made
Unused amounts reversed
Payments made
Carrying amount at
30 June 2016
3,791 82 (1,409) (1,901) 563
1,041 696 (192) (1,096) 449
18,460 13,155 - (12,654) 18,961
- 36 - - 36
23,292 13,969 (1,601) (15,651) 20,009
Insurance and legal provision
Operational process review provision
Lease expense provision
Total provision
Other provisions
Accounting policies A provision is recognised in the Statement of Financial Position when the consolidated entity has a present legal or constructive obligation as a result of a past event that can be measured reliably and it is probable that an outflow of economic benefits will be required to settle the obligation. Management exercise judgement in estimating provision amounts. It may be possible, based on existing knowledge, that outcomes in the next annual reporting period differ from amounts provided and may require adjustment to the carrying amount of the liability affected. Provisions are determined by discounting the expected future cash flows at a pre-tax rate that reflects current market assessments of the time value of money and, where appropriate, the risks specific to the liability. The unwinding of the discount is recognised as a finance cost. Insurance Provision for insurance recognises incurred but not reported claims. These provisions are measured at the cost that the consolidated entity expects to incur in settling the claim. Legal provision A provision for litigation is recognised when reported litigation claims arise and are measured at the cost that the consolidated entity expects to incur in settling the claim. Operational process review A provision for operational process reviews is recognised when operational errors are identified and represents the cost that the consolidated entity expects to incur in rectification and restitution costs. Lease expense A provision for lease expense represents the difference between the cash amount paid and the amount recognised as an expense. The provision is expected to be realised over the term of the underlying lease.
For
per
sona
l use
onl
y

68
Notes to and forming part of the financial statements for the year ended 30 June 2016
2-7 Employee benefits
$'000 Current Non-current Current Non-currentProvision for annual leave 5,495 - 5,431 -Provision for long service leave 4,465 3,347 4,450 2,940Other employee benefits1 39,295 3,513 35,472 2,093Restructuring provision 616 - 3,231 -
49,871 6,860 48,584 5,033
1 Short-term incentives and deferred STI.
2016 2015
The non-current portion of the long service leave provision has been discounted using a rate of 3.3 per cent (2015: 3.3 per cent) which is based on the 10 year corporate bond rate.
The number of full time equivalent employees at 30 June 2016 was 883 (2015: 866).
$'000
Carrying amount at
1 July 2015
Additional provision
made
Unused amounts reversed
Payments made
Carrying amount at
30 June 2016
Restructuring provision 3,231 - (838) (1,777) 616
Accounting policies Short-term employee benefits Short-term employee benefits are expensed as the related service is provided. A liability is recognised for the amount expected to be paid if the consolidated entity has a present legal or constructive obligation to pay this amount as a result of past service provided by the employee and the obligation can be estimated reliably. Other long-term employee benefits The consolidated entity’s net obligation in respect of long-term employee benefits is the amount of future benefit that employees have earned in return for their service in the current and prior periods. That benefit is discounted to determine its present value. Remeasurements are recognised in profit or loss in the period in which they arise. Restructuring A provision for restructuring is recognised when the consolidated entity has approved a detailed and formal restructuring plan and the restructuring has either commenced or has been announced publicly. Future operating costs are not provided for.
For
per
sona
l use
onl
y

69
Notes to and forming part of the financial statements for the year ended 30 June 2016
Section 3 Capital management and financing This section outlines how Perpetual manages its capital structure and related financing costs, including its balance sheet liquidity and access to capital markets. Perpetual's objectives when managing capital are to safeguard its ability to continue as a going concern, to continue to provide returns to shareholders and benefits to other stakeholders, and to reduce the cost of capital.
2016 2015$'000 $'000
3-1 Cash and cash equivalents
263,030 238,146Deposits at call - 4,334Short-term deposits 15,200 46,876
278,230 289,356
Bank balances
Short-term deposits represent rolling 30 day term deposits. In accordance with the consolidated entity’s Group Policy - Treasury, the consolidated entity mainly holds cash and cash equivalents to support its regulatory capital requirements of $160 million as at 30 June 2016 (2015: $176.7 million).
2016 2015
$'000 $'000
3-2 Borrowings
The consolidated entity has access to the following line of credit:
87,000 87,000
43,000 43,000
130,000 130,000
Total facility used (Non-current)
Facility unused
Total facility
The $43 million unused bank facility may be drawn at any time at the discretion of the consolidated entity. The floating rate bank bill facility is unsecured and had a weighted average floating interest rate of 3.21 per cent at 30 June 2016, inclusive of the undrawn line fee (2015: 3.46 per cent). Repayment of the existing facility of $87 million is due on 31 October 2017. The consolidated entity has agreed to various debt covenants including shareholders' funds as a specified percentage of total assets, a minimum amount of shareholders' funds, a maximum ratio of gross debt to EBITDA, a minimum interest cover and a maximum amount of structured product liabilities. The consolidated entity is in compliance with the covenants at 30 June 2016. Should the consolidated entity not satisfy any of these covenants, the outstanding balance of the loans may become due and payable. The consolidated entity's bank facility is subject to annual review and management intends to refinance the existing facility for a further period prior to the due date.
For
per
sona
l use
onl
y

70
Notes to and forming part of the financial statements for the year ended 30 June 2016 3-2 Borrowings (continued) Accounting policies Borrowings are initially recognised at fair value net of transaction costs incurred. Subsequent to initial recognition, interest-bearing borrowings are stated at amortised cost. The financial liability under the facility has a fair value equal to its carrying amount. Interest-bearing borrowings are removed from the Consolidated Statement of Financial Position when the obligation specified in the contract is discharged, cancelled or expired. Financing costs comprise interest payments on borrowings and derivative financial instruments calculated using the effective interest method, and unwinding of discounts on provisions.
2016 2015$'000 $'000
3-3 Contributed equity
Fully paid ordinary shares 46,574,426 (2015: 46,574,426) 552,755 551,926Treasury shares 981,300 (2015: 1,477,623) (59,290) (70,038)
493,465 481,888
Numberof shares $'000
Number of shares $'000
Movements in share capitalBalance at beginning of year 45,096,803 481,888 44,046,969 460,807Shares issued: - Movement on treasury shares 496,323 11,577 1,049,834 21,081Balance at end of year 45,593,126 493,465 45,096,803 481,888
2016 2015
The Company does not have authorised capital or par value in respect of its issued shares. Terms and conditions Holders of ordinary shares are entitled to receive dividends as declared from time to time and are entitled to one vote per share at shareholders' meetings. In the event of winding up of the Company, ordinary shareholders rank after creditors and are fully entitled to any surplus capital. Accounting policies Ordinary shares Ordinary shares are classified as equity. Incremental costs directly attributable to the issue of ordinary shares are recognised as a deduction from equity, net of any tax effects. Repurchase of share capital (treasury shares) When share capital recognised as equity is repurchased or held by employee share plans and subject to vesting conditions, the amount of the consideration paid, including directly attributable costs, is recognised as a deduction from equity. When treasury shares are sold or reissued subsequently, the amount received is recognised as an increase in equity.
For
per
sona
l use
onl
y

71
Notes to and forming part of the financial statements for the year ended 30 June 2016
2016 2015$'000 $'000
3-4 Reserves
General reserve 103 103Available-for-sale reserve 3,335 8,478Foreign currency translation reserve 90 36
3,528 8,617Equity compensation reserve 13,637 14,865
17,165 23,482
Accounting policies Available-for-sale reserve The available-for-sale reserve represents movements in the fair value of shares and unit trusts. When these assets are sold or considered impaired, the cumulative gain or loss that had been recognised directly in equity is recycled to profit or loss. Equity compensation reserve The equity compensation reserve represents the value of the Company's own shares held by an equity compensation plan that the consolidated entity is required to include in the consolidated financial statements. This reserve will be reversed against share capital when the underlying shares vest to the employee. No gain or loss is recognised in profit or loss on the purchase, sale, issue or cancellation of the consolidated entity's own equity instruments.
2016 2015$'000 $'000
3-5 Commitments and contingencies (a) Commitments
Capital expenditure commitmentsContracted but not provided for and payable within one year 6,670 3,842
Operating lease commitments predominantly related to premisesAt 30 June, the future minimum lease payments under non-cancellable leases were payable as follows:
Not later than one year 15,755 14,755Later than one year and not later than five years 56,643 52,731Later than five years 48,169 52,105
120,567 119,591
Accounting policies Operating leases Operating lease payments are recognised as an expense in profit or loss on a straight-line basis over the term of the lease. Incentives received by the consolidated entity on entering a lease agreement are recognised on a straight-line basis over the term of the lease. The difference between the cash amount paid and the amount recognised as an expense is recognised as a lease provision (refer to section 2-6). The provision is expected to be realised over the term of the underlying leases.
For
per
sona
l use
onl
y

72
Notes to and forming part of the financial statements for the year ended 30 June 2016
2016 2015$'000 $'000
3-5 Commitments and contingencies (continued) (b) Contingencies
Contingent liabilities
1,000 1,000
10,000 10,000
1,796 1,796
Bank guarantee issued in respect of the lease of premises of Perpetual Limited 1,289 1,58114,085 14,377
Bank guarantee in favour of the Australian Securities and Investments Commission in relation to the provision of responsible entity services and custodial services
Bank guarantee issued in respect of the lease of premises of The Trust Company Limited
Bank guarantee in favour of the ASX Settlement and Transfer Corporation Pty Limited with respect to trading activities
In the ordinary course of business, contingent liabilities exist in respect of claims and potential claims against entities in the consolidated entity. The consolidated entity does not consider that the outcomes of any such claims known to exist at the date of this report, either individually or in aggregate, are likely to have a material effect on its operations or financial position. Banksia In December 2012, a class action commenced for damages against The Trust Company (Nominees) Limited (TrustCo) in its capacity as trustee for the debentures issued by Banksia Securities Limited (Banksia) and other defendants including Banksia Securities Limited, Cherry Fund Limited, RSD Chartered Accountants and the directors of both Banksia Securities Limited and Cherry Fund Limited. Liquidator’s proceedings commenced in May 2015 against TrustCo. TrustCo is strongly defending the actions. Accounting policies Contingent liabilities A contingent liability is a possible obligation arising from past events that may be incurred subject to the outcome of an uncertain future event not wholly within the consolidated entity's control.
For
per
sona
l use
onl
y

73
Notes to and forming part of the financial statements for the year ended 30 June 2016
Section 4 Risk management Perpetual's activities expose it to a variety of financial and non-financial risks. Financial risks include credit risk, liquidity risk and market risks (including currency risk, interest rate risk and price risk). Key financial exposures are operational risk and a failure to meet regulatory compliance obligations. The nature of the financial risk exposures arising from financial instruments, the objectives, policies and processes for managing these risks, and the methods used to measure them are detailed below.
4-1 Financial risk management
Perpetual recognises that risk is part of doing business and that the ongoing management of risk is critical to its success. The approach to managing risk is articulated in the Risk Management Framework. The Risk Management Framework is supported by the Risk Group, who are responsible for the design and maintenance of the framework, establishing and maintaining group wide risk management policies, and providing regular risk reporting to the Board, the Audit, Risk and Compliance Committee (ARCC) and the Group Executive Leadership Team. This framework is approved by the Perpetual Board of Directors (the Board) and is reviewed for adequacy and appropriateness on an annual basis. The Board regularly monitors the overall risk profile of the consolidated entity and sets the risk appetite for the consolidated entity, usually in conjunction with the annual planning process. The Board is responsible for ensuring that management has appropriate processes in place for managing all types of risk, ranging from financial risk to operational risk. To assist in providing ongoing assurance and comfort to the Board, responsibility for risk management oversight has been delegated to the ARCC. The main functions of this Committee are to oversee the consolidated entity’s accounting policies and practices, the integrity of financial statements and reports, the scope, quality and independence of external audit arrangements, the monitoring of the internal audit function, the effectiveness of risk management policies and the adequacy of insurance programs. This Committee is also responsible for monitoring overall legal and regulatory compliance. The activities of the consolidated entity expose it to the following financial risks: credit risk, liquidity risk and market risk. These are distinct from the financial risks borne by customers which arise from financial assets managed by the consolidated entity in its role as fund manager, trustee and responsible entity. The risk management approach to, and exposures arising from, the Exact Market Cash Funds (EMCF) are disclosed in section 5-1. i. Credit risk Credit risk refers to the risk that a customer or counterparty to a financial instrument will fail to meet its contractual obligations resulting in financial loss to the consolidated entity. Credit risk arises principally from the consolidated entity’s cash and trade receivables. The consolidated entity mitigates its credit risk by ensuring cash deposits are held with high credit quality financial institutions and other highly liquid investments are held with trusts operated by the entity. The maximum exposure of the consolidated entity to credit risk on financial assets which have been recognised on the Consolidated Statement of Financial Position is the carrying amount, net of any provision for doubtful debts. The table below outlines the consolidated entity's maximum exposure to credit risk as at reporting date.
2016 2015
$'000 $'000
Cash and cash equivalents 278,230 289,356
Trade receivables 83,211 83,683
Other receivables and other financial assets 5,390 8,163
Available-for-sale listed equity securities and unlisted unit trusts 75,048 51,631
For
per
sona
l use
onl
y

74
Notes to and forming part of the financial statements for the year ended 30 June 2016
4-1 Financial risk management (continued) i. Credit risk (continued)
Credit risk is managed on a functional basis across the various business segments. As a result of the swap agreements between the EMCF and the consolidated entity, the consolidated entity consolidates EMCF and is hence exposed to credit risk on its exposure to the $300 million (2015: $295 million) of underlying investments held by the EMCF. The maximum exposure would only be realised in the unlikely event that the recoverable value of all the underlying investments held by the EMCF decline to $nil. Further details of the credit risk relating to the EMCF are disclosed in section 5-1. (a) Investments held by incubation funds Perpetual incubates new investment strategies through the establishment of seed funds for the purpose of building investment track records and developing asset management skills before releasing products to Perpetual’s investors. Exposure to credit risk arises on the consolidated entity's financial assets held by the incubation funds mainly being deposits with financial institutions and derivative financial instruments. The exposure to credit risk is monitored on an ongoing basis by the funds' investment managers and managed in accordance with the investment mandate of the funds. Credit risk is not considered to be significant to the incubation funds as investments held by the funds are predominantly equity securities. (b) Other financial assets The consolidated entity's exposure to trade receivables is influenced mainly by the individual characteristic of each customer. Trade receivables are managed by the accounts receivable department. Outstanding fees and receivables are monitored on a daily basis and an aged debtors report is prepared and monitored by Group Finance. Management assesses the credit quality of customers by taking into account their financial position, past experience and other factors. Credit risk further arises in relation to financial guarantees given to wholly owned subsidiaries. Such guarantees are only provided in exceptional circumstances and are subject to specific Board approval and are monitored on a quarterly basis as part of the consolidated entity's regulatory reporting. The consolidated entity held cash and cash equivalents of $278 million at 30 June 2016 (2015: $289 million). The cash and cash equivalents are held with bank and financial institution counterparties, which are rated ‘A’ or higher, based on Standard & Poor’s rating. The credit quality of financial assets that are neither past due nor impaired is assessed by reference to external credit ratings, if available, or to historical information on counterparty default rates. The tables below provide an aged analysis of the financial assets which were past due but not impaired:
Less than
30 days$'000
30 to 60 days
$'000
60 to 90 days
$'000
Morethan
90 days$'000
Total$'000
Less than
30 days$'000
30 to 60 days
$'000
60 to 90 days
$'000
Morethan
90 days$'000
Total$'000
1,777 1,383 695 4,486 8,341 2,351 766 936 5,425 9,478Trade and other receivables
30 June 2016 30 June 2015
For
per
sona
l use
onl
y

75
Notes to and forming part of the financial statements for the year ended 30 June 2016
4-1 Financial risk management (continued) i. Credit risk (continued) (b) Other financial assets (continued) The nominal values of financial assets which were impaired and have been provided for are as follows:
2016 2015
$'000 $'000
Trade and other receivables 3,400 1,382
3,142 3,142
6,542 4,524
Structured products - loans receivable
The impaired financial assets relate mainly to independent customers and investors who are in unexpectedly difficult economic situations, where the consolidated entity is of the view that the full carrying value of the receivable cannot be recovered. The consolidated entity does not hold any collateral against the trade and other receivables. The structured products - loan receivable balance represents a provision for all outstanding receivables from investors in respect of PPI loans (refer to section 5-1 for further information).
ii. Liquidity risk Liquidity risk is the risk that the financial obligations of the consolidated entity cannot be met as and when they fall due without incurring significant costs. The consolidated entity’s approach to managing liquidity is to maintain a level of cash or liquid investments sufficient to meet its ongoing financial obligations. The consolidated entity has a robust liquidity risk framework in place which is principally driven by the Capital Management Review (refer to section 4-1(v) for further information). At 30 June 2016, total base capital requirements were $179 million ($160 million for operational risk, $13 million for credit risk and $6 million for market risk), compared to $340 million of available liquid funds. The $160 million operational risk requirement supports regulatory capital which is mainly held in cash and cash equivalents as referred to in section 3-1. The consolidated entity manages liquidity risk by continually monitoring forecast and actual cash flows, and by matching the maturity profiles of financial assets and liabilities. Surplus funds are generally only invested in instruments that are tradeable in highly liquid markets. In addition, a three year forecast of liquid assets, cash flows and balance sheet is reviewed by the Board on a semi-annual basis as part of the Capital Management Review to ensure there is sufficient liquidity within the consolidated entity. The repayment of the existing utilised facility of $87 million is due on 31 October 2017 (refer to section 3-2 for further information).
For
per
sona
l use
onl
y

76
Notes to and forming part of the financial statements for the year ended 30 June 2016
4-1 Financial risk management (continued) ii. Liquidity risk (continued) The tables below show the maturity profiles of the financial liabilities for the consolidated entity. These have been calculated using the contractual undiscounted cash flows.
Less than 1 year
1 to 5 years
Total Less than
1 year1 to 5 years
Total
$'000 $'000 $'000 $'000 $'000 $'000
Liabilities
Payables 38,523 - 38,523 37,167 - 37,167
Borrowings - 87,000 87,000 - 87,000 87,000
38,523 87,000 125,523 37,167 87,000 124,167
30 June 2016 30 June 2015
There are no financial liabilities maturing in more than five years as at 30 June 2016 (2015: $nil).
iii. Market risk Market risk is the risk that changes in market prices – such as foreign exchange rates, interest rates and equity prices – will affect the consolidated entity’s income or the value of its holdings of financial instruments. The objective of market risk management is to manage and control market risk exposures within acceptable parameters, while optimising the return. The consolidated entity is subject to the following market risks: (a) Currency risk The exposure to currency risk arises when financial instruments are denominated in a currency that is not the functional currency of the entity and are of a monetary nature. A significant proportion of the monetary financial instruments held by the consolidated entity, being liquid assets, receivables, borrowings and payables are denominated in Australian dollars. The consolidated entity was exposed to currency risk relating to the Singapore operation. The exposure to currency risk arising from this operation is immaterial. Hence the gains/(losses) arising from the translation of the controlled entities’ financial statements into Australian dollars are not considered in this note. Investments held in listed securities and unlisted unit trusts including incubation funds are of a non-monetary nature and therefore are not exposed to currency risk. The currency risk relating to non-monetary assets and liabilities is a component of price risk and arises as the value of the securities denominated in other currencies fluctuates with changes in exchange rates.
For
per
sona
l use
onl
y

77
Notes to and forming part of the financial statements for the year ended 30 June 2016
4-1 Financial risk management (continued)
iii. Market risk (continued)
(b) Interest rate risk Interest rate risk is the risk to the consolidated entity’s earnings and capital arising from changes in market interest rates. The financial instruments held that are impacted by interest rate risk consist of cash and borrowings. The consolidated entity's exposure to interest rate risk arises predominantly on the $130 million NAB facility on which $87 million is drawn (refer to section 3-2). This loan facility is rolled on a one month, three month or six month term.
The consolidated entity's exposure to interest rate risk for the financial assets and liabilities is set out as follows:
Non-interestbearing
$'000 $'000 $'000 $'000
At 30 June 2016
Financial assetsCash and cash equivalents 263,030 15,200 - 278,230
Receivables 1,293 - 86,863 88,156
Other financial assets - 2 75,491 75,493
264,323 15,202 162,354 441,879
Financial liabilitiesPayables - - 38,523 38,523
Borrowings 87,000 - - 87,000
87,000 - 38,523 125,523
At 30 June 2015
Financial assetsCash and cash equivalents 263,156 26,200 - 289,356Receivables 1,310 - 90,125 91,435Other financial assets - 2 52,040 52,042
264,466 26,202 142,165 432,833
Financial liabilitiesPayables - - 37,167 37,167
Borrowings 87,000 - - 87,000
87,000 - 37,167 124,167
Floating interest
rate
Fixed interest
rateTotal
For
per
sona
l use
onl
y

78
Notes to and forming part of the financial statements for the year ended 30 June 2016
4-1 Financial risk management (continued)
iii. Market risk (continued) (b) Interest rate risk (continued) The table below demonstrates the impact of a 1 per cent change in interest rates, with all other variables held constant, on the net profit after tax and equity of the consolidated entity.
+/- 1 per cent
30 June 2016 30 June 2015Impact on net profit
after taxImpact on Impact on net
profit after taxImpact on
equity equity$'000 $'000 $'000 $'000
1,250/(1,250) 1,250/(1,250) 1,251/(1,251) 1,251/(1,251)
The impact on profit after tax for the year would be mainly as a result of an increase/(decrease) in interest revenue earned on cash and cash equivalents.
(c) Market risks arising from Funds Under Management and Funds Under Advice The consolidated entity’s revenue is significantly dependent on Funds Under Management (FUM) and Funds Under Advice (FUA) which are influenced by equity market movements. Management calculates the expected impact on revenue for each 1 per cent movement in the ASX All Ordinaries Index. Based on the level of this index at the end of 30 June 2016 (5,310.40), a 1 per cent movement in the market changes annualised revenue by approximately $2.25 million to $2.75 million. It is worth noting this movement is not linear to the overall value of the market. This means that as the market reaches higher or lower levels, a 1 per cent movement may have a larger or smaller effect on revenue as FUM and FUA are comprised of both equity market and non-equity market-sensitive asset classes. (d) Market risks arising from incubation funds The consolidated entity is exposed to equity price risk on investments held by its incubation funds. The funds may also be exposed, to a small extent, to the other risks which influence the value of those shares or units (including foreign exchange rates and interest rates). The PI division’s Investment Review Committee is responsible for reviewing and recommending new incubation strategies and ensuring management has appropriate processes and systems in place for managing investment risk for each fund. The funds' specialist asset managers aim to manage the impact of price risks through the use of consistent and carefully considered investment guidelines. Risk management techniques are used in the selection of investments, including derivatives, which are only acquired if they meet specified investment criteria. Daily monitoring of trade restrictions and derivative exposure against limits is undertaken with any breach of these restrictions reported to the General Manager - Risk and Internal Audit. These funds may be party to derivative financial instruments in the normal course of business in order to hedge exposure to fluctuations in foreign exchange rates, interest rates and equity indices in accordance with the funds' investment guidelines. The impact on the consolidated profit after tax of a potential change in the returns of the funds in which the consolidated entity invested at year end is not material. The potential change has been determined using historical analysis and management’s assessment of an appropriate rate of return. The analysis is based on the assumption that the returns on asset classes have moved, with all other variables held constant and that the relevant change occurred as at the reporting date. However, actual movements in the risk may be greater or less than anticipated due to a number of factors, including unusually large market shocks resulting from changes in the performance of economies, markets and securities in which the funds invest. As a result, historic variations in risk variables are not a definitive indicator of future variations in the risk variables.
For
per
sona
l use
onl
y

79
Notes to and forming part of the financial statements for the year ended 30 June 2016
4-1 Financial risk management (continued)
iii. Market risk (continued) (d) Market risks arising from incubation funds (continued) The incubation funds may be exposed to currency risk and interest rate risk. Their investment managers may enter into derivative contracts (such as forwards, swaps, options and futures) through approved counterparties to manage this risk. However, the use of these contracts must be consistent with the investment strategy and restrictions of each incubation fund, and agreed acceptable level of risk. These funds are also exposed to interest rate risk on cash holdings. Interest income from cash holdings is earned at variable interest rates and investments in cash holdings are at call. (e) Market risks arising from the Exact Market Cash Funds The consolidated entity is further subject to market risks through the Exact Market Cash Funds (EMCF). The funds were established with the purpose of providing an exact return utilising the UBS Bank Bill Index (the benchmark index) to investors. The impact of the EMCF on the consolidated entity’s financial results is dependent on the performance of the fund relative to the benchmark. The risk management approach to, and exposures arising from, the EMCF are disclosed in section 5-1. iv. Fair value The following tables present the consolidated entity's assets and liabilities measured and recognised at fair value, by valuation method, at 30 June 2016. The different levels have been defined as follows:
Level 1: quoted prices in active markets for identical assets and liabilities; Level 2: inputs other than quoted prices included within Level 1 that are observable for the asset or liability,
either directly or indirectly; and Level 3: inputs for the asset or liability that are not based on observable market data.
Level 1 Level 2 Level 3 Total
$'000 $'000 $'000 $'000
At 30 June 2016
Financial assetsAvailable-for-sale listed equity securities 2,083 - - 2,083Available-for-sale unlisted unit trusts - 72,965 - 72,965Structured products - EMCF assets 48,396 251,298 - 299,694
50,479 324,263 - 374,742
Level 1 Level 2 Level 3 Total
$'000 $'000 $'000 $'000
At 30 June 2015
Financial assetsAvailable-for-sale listed equity securities 2,014 - - 2,014Available-for-sale unlisted unit trusts - 49,617 - 49,617Structured products - EMCF assets - 294,882 - 294,882
2,014 344,499 - 346,513
For
per
sona
l use
onl
y

80
Notes to and forming part of the financial statements for the year ended 30 June 2016
4-1 Financial risk management (continued) iv. Fair value (continued) The fair value of financial instruments traded in active markets (such as publicly traded derivatives, and trading and available-for-sale securities) is based on quoted market prices at the reporting date. The quoted market price used for financial assets held by the consolidated entity is the last traded price. Marketable shares included in other financial assets are traded in an organised financial market and their fair value is the current quoted last traded price for an asset. The carrying amounts of bank term deposits and receivables approximate fair value. The fair value of investments in unlisted shares in other corporations is determined by reference to the underlying net assets and an assessment of future maintainable earnings and cash flows of the respective corporations. The fair value of financial instruments that are not traded in an active market (for example, over-the-counter derivatives) is determined using valuation techniques. The estimates of fair value where valuation techniques are applied are subjective and involve the exercise of judgement. Changing one or more of the assumptions applied in valuation techniques to reasonably possible alternative assumptions may impact on the amounts disclosed. The carrying amount of financial assets and financial liabilities, less any impairment, approximates their fair value, except for those outlined in the table below, which are stated at amortised cost.
Fair Fair
value value
$'000 $'000 $'000 $'000
Structured products – EMCF liabilities 299,971 299,694 291,478 294,882
2016 2015
Carrying amount
Carrying amount
v. Capital risk management A Capital Management Review is carried out on a semi-annual basis and is submitted to the Board for review and approval. The Group Policy – Treasury ensures that the level of financial conservatism is appropriate for the Company's businesses including acting as custodian and manager of clients' assets and operation as a trustee company. This policy also aims to provide business stability and accommodate the growth needs of the consolidated entity. This policy comprises three parts: (a) Dividend policy Dividends paid to shareholders are typically in the range of 80-100 per cent of the consolidated entity's net profit after tax attributable to members of the Company, which is in line with the historical dividend range paid to shareholders. In certain circumstances, the Board may declare a dividend outside that range. (b) Review of capital and distribution of excess capital A review of the consolidated entity’s capital base is performed at least semi-annually and excess capital that is surplus to the consolidated entity’s current requirements may potentially be returned to shareholders in the absence of a strategically aligned, value accretive investment opportunity. (c) Gearing policy The current gearing policy aims to target an investment grade credit rating by maintaining a corporate debt to capital ratio corporate debt/(corporate debt + equity) of 30% or less and EBITDA interest cover (EBITDA/interest expense) of more than 10 times. Based on the corporate debt of $87.0 million, the gearing ratio is 12.6% as at 30 June 2016 (2015: 13.0%) and well within the stated gearing policy. The EBIT interest cover ratio for the consolidated entity as at 30 June 2016 was 66 times (2015: 51 times).
For
per
sona
l use
onl
y

81
Notes to and forming part of the financial statements for the year ended 30 June 2016
4-1 Financial risk management (continued) Accounting policies The consolidated entity initially recognises loans and receivables and deposits on the date that they are originated. All other financial assets (including assets designated at fair value through profit or loss) are recognised initially on the trade date at which the consolidated entity becomes a party to the contractual provisions of the instrument. Financial liabilities (including liabilities designated at fair value through profit or loss) are recognised initially on the trade date at which the consolidated entity becomes a party to the contractual provisions of the instrument. The consolidated entity derecognises a financial liability when its contractual obligations are discharged or cancelled or expire. (a) Available-for-sale financial assets These assets are initially recognised at fair value plus any directly attributable transaction costs. Subsequent to initial recognition, they are measured at fair value and changes therein, other than impairment losses, are recognised in other comprehensive income. When an investment is derecognised, the cumulative gain or loss in equity is transferred to profit or loss. The fair value of financial instruments classified as available-for-sale is their quoted bid price at the reporting date. (b) Investments at fair value through profit or loss Investments are classified at fair value through profit or loss if they are held for trading or designated as such upon initial recognition. The consolidated entity’s derivative instruments within asset management incubation funds are classified as held for trading financial assets. On initial recognition, attributable transaction costs are recognised in profit or loss when incurred. Financial instruments designated at fair value through profit or loss are measured at fair value and changes recognised in profit or loss.
(c) Loans Loans are recognised initially at fair value plus any directly attributable transaction costs. Subsequent to initial recognition, loans and receivables are measured at amortised cost using the effective interest method less impairment losses. The consolidated entity derecognises a financial asset when the contractual rights to the cash flows from the asset expire, or it transfers the rights to receive the contractual cash flows on the financial asset in a transaction in which substantially all the risks and rewards of ownership of the financial asset are transferred. Any interest in transferred financial assets that is created or retained by the consolidated entity is recognised as a separate asset or liability. Financial assets and liabilities are offset and the net amount presented in the Consolidated Statement of Financial Position when, and only when, the consolidated entity has a legal right to offset the amounts and intends either to settle on a net basis or to realise the asset and settle the liability simultaneously. (d) Derivative financial instruments The consolidated entity holds derivative financial instruments within incubation funds to hedge its interest rate, foreign exchange and market risk exposures. On initial designation of the hedge, the consolidated entity formally documents the relationship between the hedging instrument and the hedged item, including the risk management objectives and strategy in undertaking the hedge transaction, together with the methods that will be used to assess the effectiveness of the hedging relationship. The consolidated entity makes an assessment, both at the inception of the hedge relationship as well as on an ongoing basis, whether the hedging instruments are expected to be ‘highly effective’ in offsetting the changes in the fair value or cash flows of the respective hedged items during the period for which the hedge is designated, and whether the actual results of each hedge are within a range of 80-125 per cent. For a cash flow hedge of a forecast transaction, the transaction should be highly probable to occur and should present an exposure to variations in cash flows that could ultimately affect reported net income. Derivatives are recognised initially at fair value. Attributable transaction costs are recognised in profit or loss when incurred.
For
per
sona
l use
onl
y

82
Notes to and forming part of the financial statements for the year ended 30 June 2016
4-1 Financial risk management (continued)
Accounting policies (continued) (e) Financial guarantee contracts Financial guarantee contracts are recognised as a financial liability at the time the guarantee is issued. Financial guarantees are given to wholly owned subsidiaries, within the consolidated entity. Such guarantees are only provided in exceptional circumstances and are subject to specific Board approval and are monitored on a quarterly basis as part of the consolidated entity's regulatory reporting.
The liability is initially measured at fair value and subsequently at the higher of the amount determined in accordance with AASB 137 Provisions, Contingent Liabilities and Contingent Assets and the amount initially recognised less cumulative amortisation, where appropriate. Where guarantees in relation to loans or other payables of subsidiaries are provided for no compensation, the fair values are accounted for as contributions and recognised as part of the cost of the investment.
For
per
sona
l use
onl
y
83
Notes to and forming part of the financial statements for the year ended 30 June 2016
Section 5 Other disclosures This section contains other miscellaneous disclosures that are required by accounting standards.
2016 2015$'000 $'000
5-1 Structured products assets and liabilities i. Exact Market Cash Funds
Current assetsPerpetual Exact Market Cash Fund 199,006 189,627Perpetual Exact Market Cash Fund No. 2 100,688 105,255
299,694 294,882
Current liabilitiesPerpetual Exact Market Cash Fund 199,106 186,629Perpetual Exact Market Cash Fund No. 2 100,865 104,849
299,971 291,478
The Exact Market Cash Funds' current asset balances reflect the fair value of the net assets held by the funds. The current liabilities balances represent the consolidated entity's obligation to the funds' investors. The difference between the current assets and current liabilities balance has been recorded in equity in the available-for-sale-reserve. The Perpetual Exact Market Cash Fund (EMCF 1) was established with the purpose of providing an exact return that matched the UBS Bank Bill rate (the benchmark index), or a variant thereon, to investors. The fund's ability to pay the benchmark return to the investors is guaranteed by the consolidated entity. The National Australia Bank has provided the EMCF 1 product with a guarantee to the value of $3 million (2015: $3 million) to be called upon in the event that the consolidated entity is unable to meet its obligations. Due to the guaranteed benchmark return to investors, the consolidated entity is exposed to the risk that the return of the EMCF 1 differs from that of the benchmark. The return of the EMCF 1 is affected by risks to the underlying investments in the EMCF 1 portfolio, which are market, liquidity and credit risks. The underlying investments of the fund are valued on a hold to maturity basis for unit pricing purposes, which is consistent with the way in which Perpetual manages the portfolio. The Perpetual Exact Market Cash Fund No. 2 (EMCF 2) was established to provide an exact return that matches the benchmark index to investors in the fund. It has a similar structure to EMCF 1, but in addition, there are specific rules that govern the withdrawal of funds. The investments held by EMCF 2 are recorded at fair value within the fund and in the consolidated entity's financial statements. National Australia Bank has provided the fund with a guarantee to the value of $1.5 million (2015: $1.5 million) to be called upon in the event that Perpetual does not meet its obligations. EMCF 1 and EMCF 2 (EMCF) use professional investment managers to manage the impact of the above risks by using prudent investment guidelines and investment processes. The investment manager explicitly targets low volatility and aims to achieve this through a quality-screening process that is designed to assess the likelihood of default and difficult trading patterns during periods of rapid systematic risk reduction.
For
per
sona
l use
onl
y

84
Notes to and forming part of the financial statements for the year ended 30 June 2016 5-1 Structured products assets and liabilities (continued) i. Exact Market Cash Funds (continued) There is a clearly defined mandate for the inclusion of sectors and issuances. In periods of risk reduction, diversification may be narrowly focused on cash and highly liquid investment-grade assets. At times of higher risk tolerance, appropriate diversification should be expected. Interest rate exposure is limited to +/- 90 days versus the benchmark. The portfolio is constructed with the goal of having a diversified portfolio of securities, while largely retaining the low-risk characteristics of a cash investment. Liquidity risk of EMCF is managed by maintaining a level of cash or liquid investments in the portfolio which are sufficient to meet a level and pattern of investor redemptions (consistent with past experience), distributions or other of the fund's financial obligations. This is complemented by a dynamic portfolio management process that ensures liquidity is increased when there is an expectation of a deterioration in market conditions. Cash flow forecasts are prepared for the funds, including the consideration of the maturity profile of the securities, interest and other income earned by the funds, and projected investor flows based on historical trends and future expectations. Furthermore, the credit quality of financial assets is managed by the EMCF using Standard & Poor’s rating categories or equivalent, in accordance with the investment mandate of the EMCF. The EMCF’s exposure in each credit rating category is monitored on a daily basis. This review process allows assessment of potential losses as a result of risks and the undertaking of corrective actions. The investment managers have undertaken to restrict the asset portfolio of the underlying funds to securities, deposits or obligations with a Standard & Poor’s or equivalent 'BBB-' fund credit quality rating or higher. The investment managers of the underlying funds invested by the EMCF enter into a variety of derivative financial instruments such as credit default swaps and foreign exchange forwards in the normal course of business in order to mitigate credit risk exposure and to hedge fluctuations in foreign exchange rates. Details of the assets held by the underlying funds are set out below: 30 June 2016 AAA to A+ to BBB+ to Total
AA- A- BBB-$'000 $'000 $'000 $'000
Corporate bonds 70,545 87,987 6,429 164,961Mortgage and asset backed securities 89,671 - - 89,671Cash 45,062 - - 45,062
205,278 87,987 6,429 299,694
30 June 2015 AAA to A+ to BBB+ to TotalAA- A- BBB-
$'000 $'000 $'000 $'000
Corporate bonds 68,878 89,757 5,209 163,844Mortgage and asset backed securities 118,325 - - 118,325Cash 13,331 16 - 13,347
200,534 89,773 5,209 295,516
For
per
sona
l use
onl
y
85
Notes to and forming part of the financial statements for the year ended 30 June 2016
5-1 Structured products assets and liabilities (continued)
i. Exact Market Cash Funds (continued) The table below demonstrates the impact of a 1 per cent change in the fair value of the underlying assets of the EMCF, due to market price movements, based on the values at reporting date.
2016 2015$'000 $'000
1 per cent increase 3,000 2,9551 per cent decrease (3,000) (2,955)
The actual impact of a change in the fair value of the underlying assets of the EMCF on the consolidated profit before tax is dependent on the performance of the fund relative to the benchmark index. If the fund’s performance is below the benchmark return, then the consolidated entity will be obliged to make payments to the investor. Conversely, if the fund’s performance is higher than the benchmark, then the benefit of the higher performance accrues to the consolidated entity. Any variance between the consolidated entity’s current assets EMCF balance and the consolidated entity’s current liabilities EMCF balance would be reflected in reserves, except in the case of a credit default which would impact the consolidated profit before tax. Accounting policies The EMCF product, consisting of two funds (EMCF 1 and EMCF 2), is consolidated as the consolidated entity is exposed to variable returns and has the power to affect those returns. The swap agreements result in the benchmark rate of return being paid to the unit holders in the fund. The swap agreements are inter-company transactions between a subsidiary of the Company and the funds and are eliminated on consolidation. Assets and liabilities of the EMCF product are disclosed separately on the face of the Consolidated Statement of Financial Position as structured product assets and structured product liabilities. The benchmark return generated by the EMCF product and distributions to unit holders are disclosed in section 1-3 Expenses as distributions and expenses related to structured products. The financial assets represented by the structured products assets balance are accounted for in accordance with the underlying accounting policies of the consolidated entity. These consist of investments accounted for at fair value as available-for-sale financial assets.
ii. Perpetual Protected Investments The Perpetual Protected Investments structured product series (the PPI product) was terminated during the prior year. A provision of $3,142,000 is recognised for all outstanding receivables from investors as at 30 June 2016 (2015: $3,142,000).
For
per
sona
l use
onl
y

86
Notes to and forming part of the financial statements for the year ended 30 June 2016
2016 2015$'000 $'000
5-2 Parent entity disclosures As at, and throughout, the financial year ended 30 June 2016 the parent entity of the consolidated entity was Perpetual Limited. Result of the parent entityProfit for the year 181,793 144,728Other comprehensive (expense)/income (2,446) 4,586Total comprehensive income for the year 179,347 149,314
Financial position of the parent entity at year endCurrent assets 251,114 208,995Total assets 897,361 858,191
Current liabilities 197,040 236,469Total liabilities 224,898 259,986
Total equity of the parent entity comprising:Share capital 493,466 481,888Reserves 18,416 22,089Retained earnings 160,581 94,228Total equity 672,463 598,205
Parent entity contingencies The Directors are of the opinion that provisions are not required in respect of these matters, as it is not probable that a future sacrifice of economic benefits will be required or the amount is not capable of reliable measurement.
2016 2015$'000 $'000
Uncalled capital of the controlled entities 12,450 7,100
In the ordinary course of business, contingent liabilities exist in respect of claims and potential claims against the parent entity. The parent entity does not consider that the outcome of any such claims known to exist at the date of this report, either individually or in aggregate, are likely to have a material effect on its operations or financial position.
For
per
sona
l use
onl
y

87
Notes to and forming part of the financial statements for the year ended 30 June 2016
2016 2015$'000 $'000
5-2 Parent entity disclosures (continued) Operating lease commitmentsAt 30 June, the future minimum lease payments under non-cancellable leases were payable as follows.
Not later than one year 8,498 7,425Later than one year and not later than five years 38,010 32,837Later than five years 45,223 49,710
91,731 89,972
Operating leases are predominantly related to premises. Parent entity guarantees The Company's policy is to provide financial guarantees only to wholly owned subsidiaries and it has provided financial guarantees in respect of:
Guarantee to secure a $130,000,000 bank facility ($87,000,000 is utilised) of a controlled entity amounting to $130,000,000 (2015: $130,000,000).
No liability was recognised by the Company in relation to these guarantees as the fair value of these guarantees is considered to be immaterial. The Company does not expect the financial guarantees to be called upon.
For
per
sona
l use
onl
y
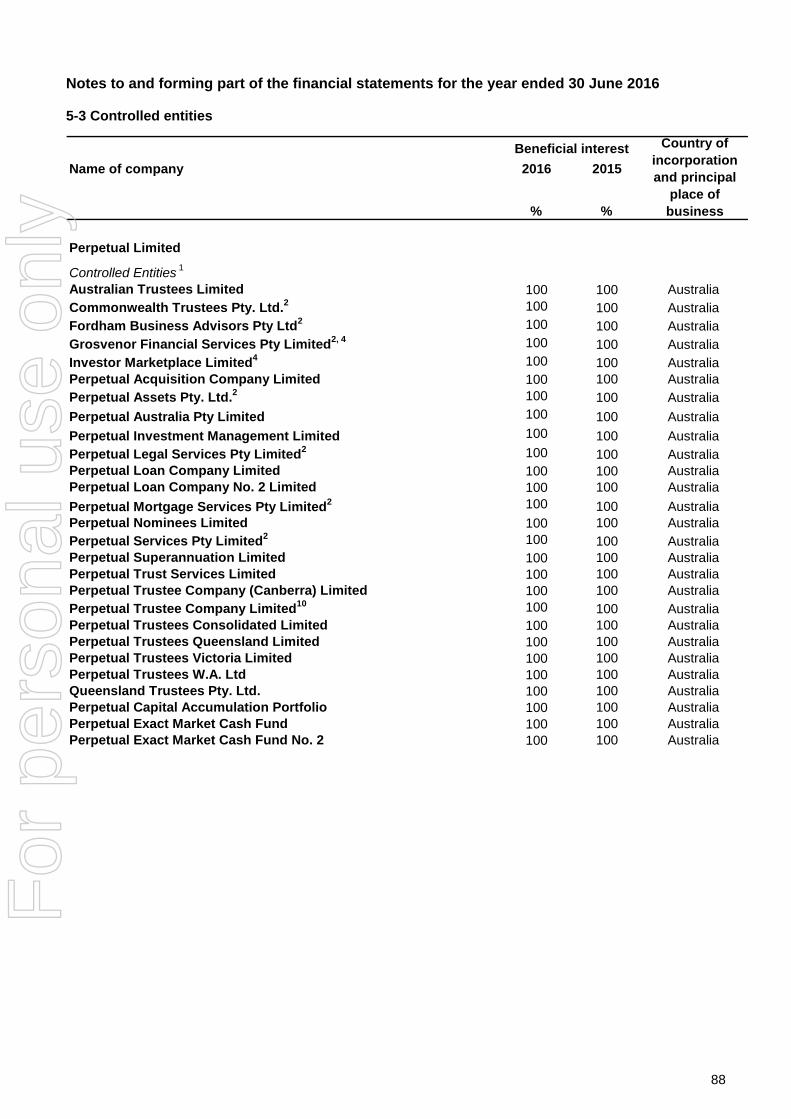
88
Notes to and forming part of the financial statements for the year ended 30 June 2016
5-3 Controlled entities
Name of company 2016 2015
% %
Perpetual Limited
Controlled Entities 1
Australian Trustees Limited 100 100 Australia Commonwealth Trustees Pty. Ltd.2 100 100 Australia Fordham Business Advisors Pty Ltd2 100 100 Australia Grosvenor Financial Services Pty Limited2, 4 100 100 Australia Investor Marketplace Limited4 100 100 Australia Perpetual Acquisition Company Limited 100 100 Australia Perpetual Assets Pty. Ltd.2 100 100 Australia
Perpetual Australia Pty Limited 100 100 Australia
Perpetual Investment Management Limited 100 100 Australia Perpetual Legal Services Pty Limited2 100 100 Australia Perpetual Loan Company Limited 100 100 Australia Perpetual Loan Company No. 2 Limited 100 100 Australia
Perpetual Mortgage Services Pty Limited2 100 100 Australia Perpetual Nominees Limited 100 100 Australia Perpetual Services Pty Limited2 100 100 Australia Perpetual Superannuation Limited 100 100 Australia Perpetual Trust Services Limited 100 100 Australia Perpetual Trustee Company (Canberra) Limited 100 100 Australia Perpetual Trustee Company Limited10 100 100 Australia Perpetual Trustees Consolidated Limited 100 100 Australia Perpetual Trustees Queensland Limited 100 100 Australia Perpetual Trustees Victoria Limited 100 100 Australia Perpetual Trustees W.A. Ltd 100 100 Australia Queensland Trustees Pty. Ltd. 100 100 Australia Perpetual Capital Accumulation Portfolio 100 100 Australia Perpetual Exact Market Cash Fund 100 100 Australia Perpetual Exact Market Cash Fund No. 2 100 100 Australia
Beneficial interest Country of incorporation and principal
place of business
For
per
sona
l use
onl
y

89
Notes to and forming part of the financial statements for the year ended 30 June 2016
5-3 Controlled entities (continued)
Name of company 2016 2015
% %
Entities under the control of Fordham Business Advisors Pty LtdGarnet Investment Management Pty Ltd2,5 - 100 Australia
Entities under the control of Grosvenor Financial Services Pty LimitedPerpetual Tax and Accounting Pty Ltd 100 100 Australia
Entities under the control of Perpetual Acquisition Company LimitedThe Trust Company Limited 100 100 AustraliaFintuition Pty Limited2,8 100 - Australia Fintuition Unit Trust8 100 - Australia Fintuition Institute Pty Limited2,8 100 - Australia Fintuition Institute Unit Trust8 100 - Australia Skinner Macarounas Pty Limited2,8 100 - Australia
Entities under the control of Perpetual Assets Pty LimitedPerpetual Asset Management Ltd.4 100 100 Australia
Entities under the control of Perpetual Trustee Company Limited Perpetual Corporate Trust Limited 100 100 Australia Perpetual Custodians Ltd 100 100 Australia P.T. Limited 100 100 Australia
Entities under the control of Perpetual Trustees Consolidated LimitedPerpetual Custodian Nominees Pty Ltd2, 4 100 100 Australia
Entities under the control of P.T. LimitedPerpetrust Nominees Proprietary Limited2 100 100 Australia
Entities under the control of The Trust Company LimitedPerpetual (Asia Holdings) Pte. Ltd.6 100 100 SingaporeThe Trust Company (Australia) Limited 100 100 AustraliaThe Trust Company (FCNL) Pty Limited4 100 100 AustraliaThe Trust Company (Real Estate) Pty Limited2 100 100 AustraliaThe Trust Company (UTCCL) Limited 100 100 AustraliaTrust Company (Hong Kong) Limited 100 100 Hong Kong
Entities under the control of The Trust Company (Australia) LimitedThe Trust Company (Nominees) Limited 100 100 AustraliaThe Trust Company (PTAL) Limited 100 100 AustraliaThe Trust Company (PTCCL) Limited4 100 100 AustraliaThe Trust Company (RE Services) Limited 100 100 Australia
Beneficial interest Country of incorporation and principal
place of business
For
per
sona
l use
onl
y

90
Notes to and forming part of the financial statements for the year ended 30 June 2016
5-3 Controlled entities (continued)
Name of company 2016 2015
% %
Entities under the control of Perpetual (Asia Holdings) Pte. Ltd.6
Perpetual (Asia) Limited7 100 100 Singapore
Entities under the control of The Trust Company (RE Services) LimitedBanano Pty Ltd2,5 - 100 AustraliaThe Trust Company (Sydney Airport) Limited 100 100 AustraliaGPTA - 750 Collins Street Pty Limited2,5 - 100 Australia
Entities under the control of The Trust Company (Nominees) LimitedThe Trust Company (Legal Services) Pty Limited2,4,9 100 49 Australia
AssociatesLoan RQ Ltd3 26 28 Australia
5 Garnet Investment Management Pty Ltd, Banano Pty Ltd and GPTA - 750 Collins Street Pty Limited were deregistered on 15 July 2015.6 Perpetual (Asia Holdings) Pte. Ltd was formerly known as The Trust Company (Asia Holdings) Pte.Ltd.7 Perpetual (Asia) Limited was formerly known as The Trust Company (Asia) Limited.
9100% ownership was transferred to The Trust Company (Nominees) Limited on the 22nd April 2016.
Beneficial interest Country of incorporation and principal
place of business
4 The following companies were deregistered - Perpetual Custodian Nominees Pty Ltd, The Trust Company (PTCCL) Limited and The Trust Company (FCNL) Pty Limited on 24 July 2016, Grosvenor Financial Services Pty Limited, Investor Marketplace Limited and The Trust Company (Legal Services) Pty Limited on 27 July 2016 and Perpetual Asset Management Limited on 3 August 2016.
2 A small proprietary company as defined by the Corporations Act 2001 and is not required to be audited for statutory purposes.3 In August 2012, Perpetual Limited entered into a joint venture agreement and held 45% of Loan RQ Ltd. (previously Loan RQ Pty. Ltd.) The carrying amount of this investment is $nil (2015: $nil).
1 Entities in bold are directly owned by Perpetual Limited.
8 Acquired by Perpetual Acquisition Company Limited on 10 December 2015.
10 Perpetual Trustee Company Limited has a branch operation in New Zealand known as Perpetual Trustee Company Limited (New Zealand branch).
For
per
sona
l use
onl
y

91
Notes to and forming part of the financial statements for the year ended 30 June 2016
5-4 Unconsolidated structured entities
Perpetual Limited and its subsidiaries have interests in various structured entities that are not consolidated. A structured entity is an entity that has been designed so that voting or similar rights are not the dominant factor in deciding who controls the entity, such as when any voting rights relate to administrative tasks only and the relevant activities are directed by means of contractual arrangements. Perpetual has an interest in a structured entity when the Company has a contractual or non-contractual involvement that exposes it to variable returns from the performance of the entity. The Company’s interest includes investments held in securities or units issued by these entities and fees earned from management of the assets within these entities. Information on the Company’s interests in unconsolidated structured entities as at 30 June is as follows:
Carrying amount
Maximum exposure
to loss1
$'000 $'000
Year ended 30 June 2016
Statement of Financial Position line itemOther financial assets - non-current 72,945 68,063
Year ended 30 June 2015
Statement of Financial Position line itemCash and cash equivalents 8,510 8,510Other financial assets - non-current 49,482 40,939
57,992 49,449
Investment funds - Company managed
1 The maximum exposure to loss is the maximum loss that could be recorded through comprehensive income as a result of the involvement with these entities.
Company managed investment funds The Company has investments in managed investment funds through the asset management subsidiaries. Control over these managed investment funds may exist since the Company has power over the activities of the fund. However, these funds have not been consolidated because the Company does not have the ability to affect the level of returns and is not exposed to significant variability in returns from the funds. The Company earns management fees from the management of these investment funds which are commensurate with the services provided and are reported in revenue from the provision of services. Management fees are generally based on the value of the assets under management. Therefore, the fees earned are impacted by the composition of the assets under management and fluctuations in financial markets. The revenue earned is included in gross revenue from fees and commissions in section 1-2. Investment funds are investment vehicles that consist of a pool of funds collected from several investors for the purpose of investing in securities such as money market instruments, debt securities, equity securities and other similar assets. For all investment funds, the Company’s maximum exposure to loss is equivalent to the cost of the investment in the fund. Investment funds are generally financed through the issuance of fund units. F
or p
erso
nal u
se o
nly

92
Notes to and forming part of the financial statements for the year ended 30 June 2016
5-5 Non-controlling interest
The following table summarises the information relating to each subsidiary of the consolidated entity that has a material non-controlling interest (NCI), before any intra-group eliminations.
Consolidated entity2016 2015 2016 2015$'000 $'000 $'000 $'000
Revenue - 2,956 - 121 Profit - 2,581 - (125)
Other comprehensive income/(expense) (OCI) - (3,341) - (42) -
Total comprehensive income - (760) - (167)
Profit allocated to NCI - 1,440 - (121)OCI allocated to NCI - (1,255) - (12)
Cash flows from operating activities - (4,343) - (147)Cash flows from investment activities - 2,936 - 2 Cash flows from financing activities (dividends to NCI: nil) - - - -
Net increase in cash and cash equivalents - (1,407) - (145)
Perpetual Resource Fund
Perpetual Wholesale Dynamic Fixed Income
Fund
The Perpetual Resource Fund and the Perpetual Wholesale Dynamic Fixed Income Fund are no longer members of the consolidated entity.
For
per
sona
l use
onl
y

93
Notes to and forming part of the financial statements for the year ended 30 June 2016
5-6 Share-based payments
i. Employee share purchase and option plans (a) Long-term Incentive Plan (LTI) The LTI plan was introduced for the purpose of making future long-term incentive grants to executives. The issue price of performance share grants is the weighted average of the prices at which shares traded on the Australian Securities Exchange (ASX) for the five days up to the date of issue. Shares are either purchased on market or issued by the Company. The issue price of performance rights with no performance conditions (apart from services) is the same as for performance shares; however, discounted for dividends forgone over the vested period. The issue price for performance rights with performance conditions is determined as described in (ii) below. (b) Tax Exempt Share Plan (TESP) Under the TESP, eligible employees are able to salary sacrifice up to $1,000 of short-term incentive payments to acquire an equivalent value of Perpetual shares. These shares cannot be sold or transferred until the earlier of three years after the date of allocation or the time the participant ceases to be an employee of Perpetual. Shares will be acquired in ordinary trading on the ASX or issued by Perpetual. Executives are not eligible to participate in this plan. This plan was discontinued in September 2014 and no further issues have been made under this plan. (c) Tax Deferred Share Plan (TDSP) Under the TDSP, eligible employees are able to salary sacrifice all or part of their short-term incentive payment to acquire an equivalent value of Perpetual shares. Shares are acquired in the ordinary course of trading on the ASX. Executives have the opportunity to participate in this plan. Shares acquired under this plan by executive directors and executives are not subject to performance hurdles because they are acquired on a salary or bonus sacrifice basis. (d) Employee Share Purchase Plan (ESPP) The ESPP provided eligible employees with a non-recourse interest free loan, for a period not exceeding 10 years, to purchase shares under the plan. The invitation was open to employees who commenced permanent employment with Perpetual prior to 1 June 2004 with an offer to purchase a minimum number of shares equivalent in value to $1,000 and a maximum number of shares equivalent in value to $4,000. The issue price under the plan was the weighted average of the prices at which shares were traded on the ASX for the five days up to the date of issue. The shares vest when the loan is fully repaid. This plan was discontinued on 10 December 2004 and no further issues have been made under this plan. (e) Non-executive Directors' Share Purchase Plan Under the non-executive directors’ share purchase plan, each non-executive director could sacrifice up to 50 per cent of their director’s fees to acquire shares in the Company. The shares are purchased four times throughout the year at market value and have a disposal restriction of 10 years, or when the director ceases to be a director of the Company. This plan was used only by non-executive directors and was closed to new purchases on 1 July 2009. F
or p
erso
nal u
se o
nly

94
Notes to and forming part of the financial statements for the year ended 30 June 2016
5-6 Share-based payments (continued)
i. Employee share purchase and option plans (continued) (f) Executive Share Plan (ESP) The ESP formed part of the structure for short and long-term variable remuneration components paid to employees. Grants under the plan for short-term performance were made on achievement of specific performance goals. Long-term grants vest after periods of between three and five years, and may include the achievement of specific performance hurdles. The issue price of grants of shares is the weighted average of the prices at which shares were traded on the ASX for the five days up to the date of issue. Shares were issued by the Company to satisfy the grants made to eligible employees. While shares are held by the ESP, employees receive dividends and have voting rights. No further issues have been made under this since February 2011. (g) Deferred Share Plan (DSP) The DSP forms part of the structure for short-term and long-term variable remuneration components paid to eligible employees of the Australian business. Grants under the plan vest subject to the achievement of specific performance hurdles and service. The issue price of grants is the weighted average of the prices at which shares traded on the ASX for the five days up to the date of issue. Shares are either purchased on market or issued by the Company to satisfy grants made to eligible employees. While shares are held by the DSP, eligible employees have voting rights and receive dividends directly or reinvest dividends into Perpetual shares. (h) One Perpetual Share Plan (OPSP) The OPSP awards eligible employees with annual grants of up to $1,000 worth of Perpetual shares subject to the Company meeting its profit target. Shares granted under the OPSP cannot be sold or transferred until the earlier of three years from the date the shares are allocated or cessation of employment. Employees who are granted shares have full dividend and voting rights during this time. For financial accounting purposes, shares granted under the OPSP are deemed to vest immediately because there is no risk of forfeiture. Accordingly, the fair value of the grant is recognised as an expense on the date the shares are granted with the corresponding entry directly in equity. (i) Details of the movement in employee shares Of share grants under the OPSP and LTI plan in the 2016 financial year, all shares were reissued from the forfeited share pool at market price. Dividends on employee shares are either received directly by the employees or held in the share plan bank account depending on the likelihood of the shares vesting. During the year, $10,702,687 (2015: $10,383,166) of amortisation relating to performance shares was recognised as an expense with the corresponding entry directly in equity. The following table illustrates the movement in employee shares during the financial year:
NumberOpening balance
1 July
Vested shares
Forfeited shares
Granted shares
Closing balance at
30 June
1,477,623 (496,323) (268,553) 268,553 981,300
2,527,457 (1,049,186) (131,592) 130,944 1,477,623
2016
2015
For
per
sona
l use
onl
y

95
Notes to and forming part of the financial statements for the year ended 30 June 2016
5-6 Share-based payments (continued) ii. Performance rights During the year, the Company granted $10,450,784 (30 June 2015: $7,315,520) performance rights in accordance with the LTI plan. Performance rights do not receive dividends or have voting rights until they have vested and been converted into Perpetual shares. The number of performance rights granted is determined by dividing the value of the LTI grant value by the VWAP of Perpetual shares traded on the ASX in the five business days up to the grant date, discounted for the non-payment of dividends during the performance period, as calculated by an independent external adviser.
30 June 2016
Grant date
Vest date
Expiry date
TSR hurdle or non-TSR hurdle
Issue price
1 July 2015
Granted Forfeited Vested Outstanding at 30 June 2016
Jul 2012 Jul 2015 Jul 2019 Non TSR $20.36 65,441 - - (65,441) -
Oct 2012 Oct 2015 Oct 2019 TSR $14.38 33,659 - - (33,659) -
Oct 2012 Oct 2015 Oct 2019 Non TSR $23.54 38,461 - - (38,461) -
Oct 2013 Oct 2015 Oct 2020 Non TSR $34.57 2,603 - - (2,603) -
Oct 2013 Oct 2016 Oct 2020 TSR $22.65 34,651 - (5,062) - 29,589
Oct 2013 Oct 2016 Oct 2020 Non TSR $34.57 117,862 - (13,880) (7,230) 96,752
Mar 20141Feb 2016 Mar 2021 Non TSR $34.57 1,446 - - (1,446) -
Oct 2014 Oct 2017 Oct 2017 TSR $21.82 38,592 - (5,592) - 33,000
Oct 2014 Oct 2017 Oct 2017 Non TSR $38.00 124,384 - (16,313) (2,561) 105,510
Oct 20141Oct 2016 Oct 2020 Non TSR $34.57 1,157 - - - 1,157
Oct 20142Feb 2016 Mar 2021 Non TSR $34.57 925 - - (925) -
Mar 20151Oct 2016 Oct 2020 Non TSR $34.57 145 - - - 145
Aug 20151Oct 2016 Oct 2020 Non TSR $34.57 - 2,892 - - 2,892
Aug 20153Oct 2017 Oct 2021 Non TSR $38.00 - 789 - - 789
Oct 2015 Oct 2018 Sep 2022 TSR $19.50 - 38,672 - - 38,672
Oct 2015 Oct 2018 Sep 2022 Non TSR $33.07 - 289,287 (17,038) (192) 272,057
459,326 331,640 (57,885) (152,518) 580,5631 Valuation date 1 October 2013.2 Valuation date 1 March 2014.3 Valuation date 1 October 2014.
Movement in number of performance rights granted
For
per
sona
l use
onl
y
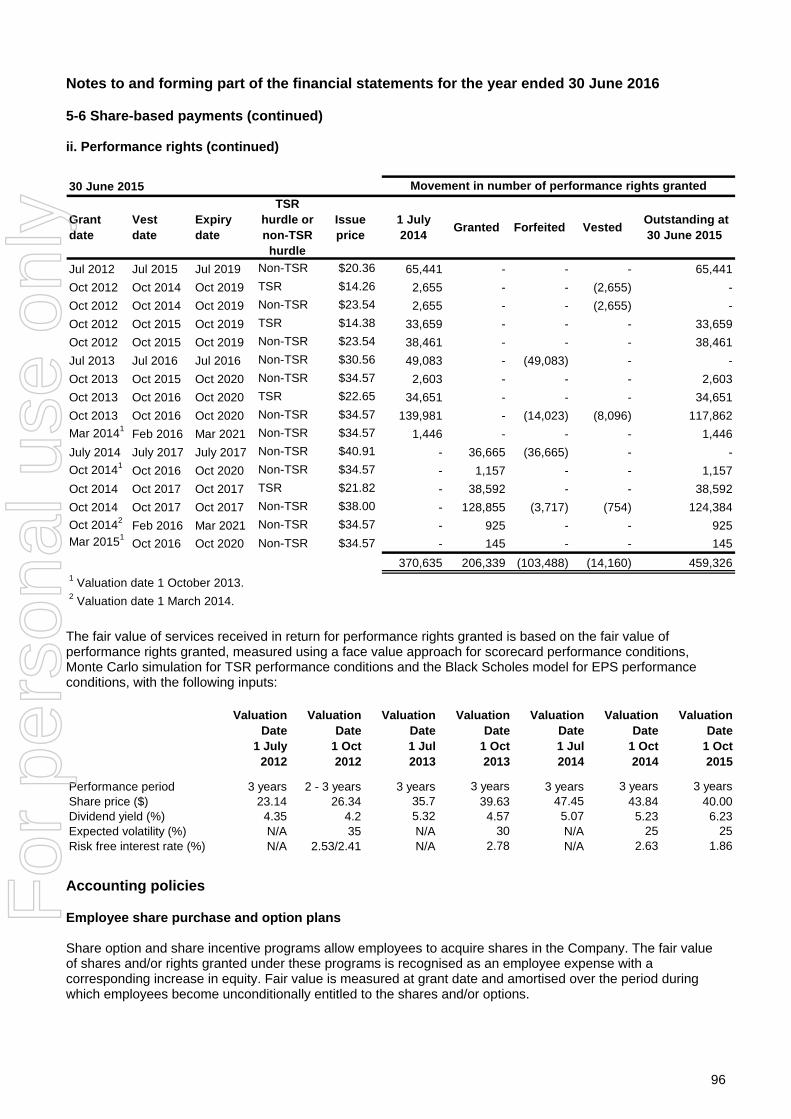
96
Notes to and forming part of the financial statements for the year ended 30 June 2016
5-6 Share-based payments (continued) ii. Performance rights (continued)
30 June 2015
Grant date
Vest date
Expiry date
TSR hurdle or non-TSR hurdle
Issue price
1 July 2014
Granted Forfeited Vested Outstanding at 30 June 2015
Jul 2012 Jul 2015 Jul 2019 Non-TSR $20.36 65,441 - - - 65,441
Oct 2012 Oct 2014 Oct 2019 TSR $14.26 2,655 - - (2,655) -
Oct 2012 Oct 2014 Oct 2019 Non-TSR $23.54 2,655 - - (2,655) -
Oct 2012 Oct 2015 Oct 2019 TSR $14.38 33,659 - - - 33,659
Oct 2012 Oct 2015 Oct 2019 Non-TSR $23.54 38,461 - - - 38,461
Jul 2013 Jul 2016 Jul 2016 Non-TSR $30.56 49,083 - (49,083) - -
Oct 2013 Oct 2015 Oct 2020 Non-TSR $34.57 2,603 - - - 2,603
Oct 2013 Oct 2016 Oct 2020 TSR $22.65 34,651 - - - 34,651
Oct 2013 Oct 2016 Oct 2020 Non-TSR $34.57 139,981 - (14,023) (8,096) 117,862
Mar 20141Feb 2016 Mar 2021 Non-TSR $34.57 1,446 - - - 1,446
July 2014 July 2017 July 2017 Non-TSR $40.91 - 36,665 (36,665) - -
Oct 20141Oct 2016 Oct 2020 Non-TSR $34.57 - 1,157 - - 1,157
Oct 2014 Oct 2017 Oct 2017 TSR $21.82 - 38,592 - - 38,592
Oct 2014 Oct 2017 Oct 2017 Non-TSR $38.00 - 128,855 (3,717) (754) 124,384
Oct 20142Feb 2016 Mar 2021 Non-TSR $34.57 - 925 - - 925
Mar 20151Oct 2016 Oct 2020 Non-TSR $34.57 - 145 - - 145
370,635 206,339 (103,488) (14,160) 459,3261 Valuation date 1 October 2013.2 Valuation date 1 March 2014.
Movement in number of performance rights granted
The fair value of services received in return for performance rights granted is based on the fair value of performance rights granted, measured using a face value approach for scorecard performance conditions, Monte Carlo simulation for TSR performance conditions and the Black Scholes model for EPS performance conditions, with the following inputs:
Valuation Date
1 July 2012
Valuation Date
1 Oct 2012
Valuation Date 1 Jul 2013
Valuation Date
1 Oct 2013
Valuation Date 1 Jul 2014
Valuation Date
1 Oct 2014
Valuation Date
1 Oct 2015
Performance period 3 years 2 - 3 years 3 years 3 years 3 years 3 years 3 yearsShare price ($) 23.14 26.34 35.7 39.63 47.45 43.84 40.00Dividend yield (%) 4.35 4.2 5.32 4.57 5.07 5.23 6.23Expected volatility (%) N/A 35 N/A 30 N/A 25 25Risk free interest rate (%) N/A 2.53/2.41 N/A 2.78 N/A 2.63 1.86
Accounting policies
Employee share purchase and option plans Share option and share incentive programs allow employees to acquire shares in the Company. The fair value of shares and/or rights granted under these programs is recognised as an employee expense with a corresponding increase in equity. Fair value is measured at grant date and amortised over the period during which employees become unconditionally entitled to the shares and/or options.
For
per
sona
l use
onl
y
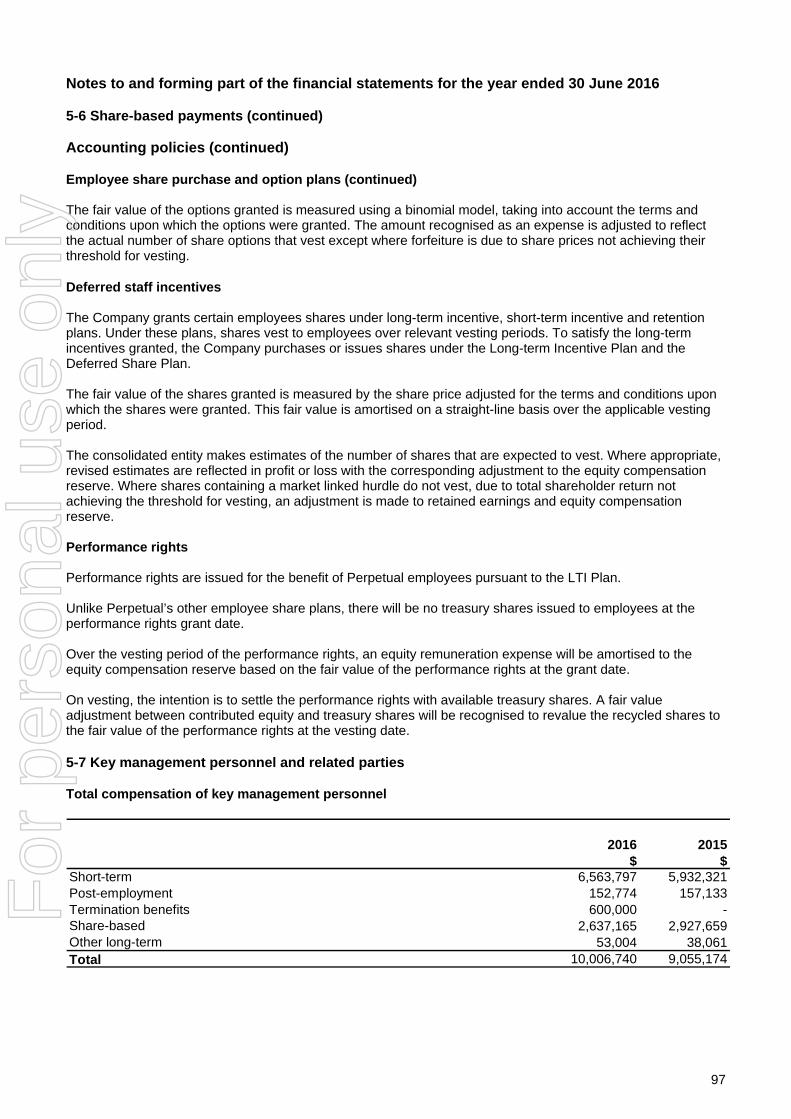
97
Notes to and forming part of the financial statements for the year ended 30 June 2016
5-6 Share-based payments (continued) Accounting policies (continued)
Employee share purchase and option plans (continued) The fair value of the options granted is measured using a binomial model, taking into account the terms and conditions upon which the options were granted. The amount recognised as an expense is adjusted to reflect the actual number of share options that vest except where forfeiture is due to share prices not achieving their threshold for vesting.
Deferred staff incentives The Company grants certain employees shares under long-term incentive, short-term incentive and retention plans. Under these plans, shares vest to employees over relevant vesting periods. To satisfy the long-term incentives granted, the Company purchases or issues shares under the Long-term Incentive Plan and the Deferred Share Plan. The fair value of the shares granted is measured by the share price adjusted for the terms and conditions upon which the shares were granted. This fair value is amortised on a straight-line basis over the applicable vesting period. The consolidated entity makes estimates of the number of shares that are expected to vest. Where appropriate, revised estimates are reflected in profit or loss with the corresponding adjustment to the equity compensation reserve. Where shares containing a market linked hurdle do not vest, due to total shareholder return not achieving the threshold for vesting, an adjustment is made to retained earnings and equity compensation reserve. Performance rights Performance rights are issued for the benefit of Perpetual employees pursuant to the LTI Plan. Unlike Perpetual’s other employee share plans, there will be no treasury shares issued to employees at the performance rights grant date. Over the vesting period of the performance rights, an equity remuneration expense will be amortised to the equity compensation reserve based on the fair value of the performance rights at the grant date. On vesting, the intention is to settle the performance rights with available treasury shares. A fair value adjustment between contributed equity and treasury shares will be recognised to revalue the recycled shares to the fair value of the performance rights at the vesting date.
5-7 Key management personnel and related parties
Total compensation of key management personnel
2015
$Short-term 5,932,321Post-employment 157,133Termination benefits -Share-based 2,927,659Other long-term 38,061Total 9,055,17410,006,740
2,637,16553,004
600,000152,774
6,563,797
2016$
For
per
sona
l use
onl
y

98
Notes to and forming part of the financial statements for the year ended 30 June 2016
5-7 Key management personnel and related parties (continued) Related party disclosures Executives have not entered into material contracts with the Company or a member of the consolidated entity since the end of the previous financial year and there were no material contracts involving key management personnel’s’ interests existing at year end. Controlled entities and associates The consolidated entity has a related party relationship with its key management personnel (see Remuneration Report). Business transactions with related parties are on normal commercial terms and conditions no more favourable than those available to other parties unless otherwise stated.
For
per
sona
l use
onl
y
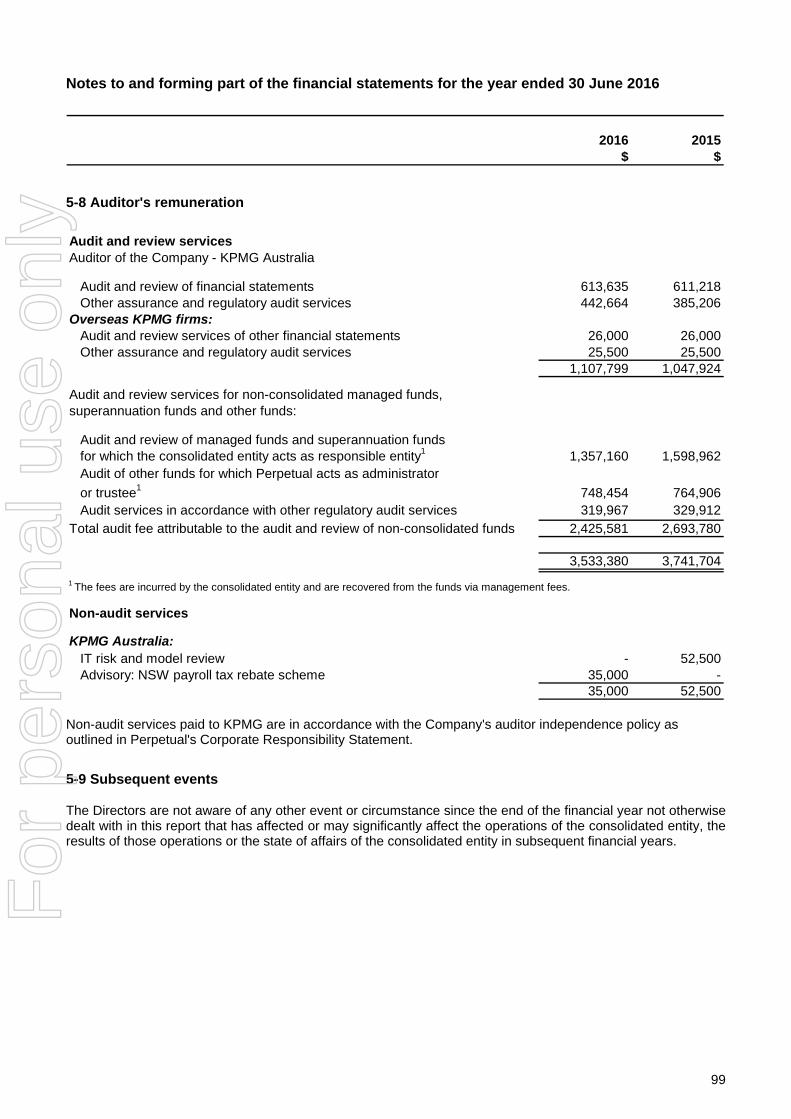
99
Notes to and forming part of the financial statements for the year ended 30 June 2016
2016 2015$ $
5-8 Auditor's remuneration
Audit and review servicesAuditor of the Company - KPMG Australia
Audit and review of financial statements 613,635 611,218Other assurance and regulatory audit services 442,664 385,206
Overseas KPMG firms:Audit and review services of other financial statements 26,000 26,000Other assurance and regulatory audit services 25,500 25,500
1,107,799 1,047,924
Audit and review of managed funds and superannuation funds1,357,160 1,598,962
748,454 764,906Audit services in accordance with other regulatory audit services 319,967 329,912
Total audit fee attributable to the audit and review of non-consolidated funds 2,425,581 2,693,780
3,533,380 3,741,704
Non-audit services
KPMG Australia:IT risk and model review - 52,500Advisory: NSW payroll tax rebate scheme 35,000 -
35,000 52,500
1 The fees are incurred by the consolidated entity and are recovered from the funds via management fees.
for which the consolidated entity acts as responsible entity1
Audit of other funds for which Perpetual acts as administrator
or trustee1
Audit and review services for non-consolidated managed funds, superannuation funds and other funds:
Non-audit services paid to KPMG are in accordance with the Company's auditor independence policy as outlined in Perpetual's Corporate Responsibility Statement.
5-9 Subsequent events
The Directors are not aware of any other event or circumstance since the end of the financial year not otherwise dealt with in this report that has affected or may significantly affect the operations of the consolidated entity, the results of those operations or the state of affairs of the consolidated entity in subsequent financial years.
For
per
sona
l use
onl
y

100
Notes to and forming part of the financial statements for the year ended 30 June 2016
Section 6 Basis of preparation This section sets out Perpetual's accounting policies that relate to the financial statements as a whole. Where an accounting policy is specific to a single note, the policy is described in the note to which it relates. This section also shows new accounting standards, amendments and interpretations, and whether they are effective in 2016 or later years. We explain how these changes are expected to impact the financial position and performance of Perpetual.
6-1 Reporting entity Perpetual Limited (‘the Company’) is domiciled in Australia. The consolidated financial report of the Company as at and for the year ended 30 June 2016 comprises the Company and its controlled entities (together referred to as ‘the consolidated entity’) and the consolidated entity’s interests in associates. Perpetual is a for-profit entity and primarily involved in funds management, portfolio management, financial planning, trustee, responsible entity and compliance services, executor services, investment administration and custody services. The financial report was authorised for issue by the Directors on 25 August 2016. The Company is a public company listed on the Australian Securities Exchange (code: PPT), incorporated in Australia and operating in Australia and Singapore. The consolidated annual report for the consolidated entity as at and for the year ended 30 June 2016 is available at www.perpetual.com.au.
6-2 Basis of preparation
i. Statement of compliance The financial report is a general purpose financial report prepared in accordance with Australian Accounting Standards adopted by the Australian Accounting Standards Board (AASB) and the Corporations Act 2001. The financial report of the consolidated entity also complies with International Financial Reporting Standards (IFRS) adopted by the International Accounting Standards Board (IASB). ii. Basis of preparation The consolidated financial statements have been prepared on a historical cost basis, except for available-for-sale financial assets which are measured at fair value. Non-current assets are stated at the lower of carrying amount or fair value less selling costs. The consolidated financial statements are presented in Australian dollars, which is the functional currency of the majority of the consolidated entity. The Company is of a kind referred to in ASIC Corporations Instrument 2016/191 dated 1 April 2016 and in accordance with that Instrument, all financial information presented in Australian dollars has been rounded to the nearest thousand unless otherwise stated. Use of judgements and estimates In preparing these consolidated financial statements, management has made judgements, estimates and assumptions that affect the application of the consolidated entity’s accounting policies and the reported amounts of assets, liabilities, income and expenses. Actual results may differ from these estimates. Estimates and underlying assumptions are reviewed on an ongoing basis. Revisions to accounting estimates are recognised prospectively.
For
per
sona
l use
onl
y
101
Notes to and forming part of the financial statements for the year ended 30 June 2016
6-2 Basis of preparation (continued)
ii. Basis of preparation (continued)
(a) Judgements
Information about critical judgements in applying accounting policies in accordance with Australian Accounting Standard AASB 10 Consolidated Financial Statements is included in section 5-3 Controlled entities. (b) Assumptions and estimation uncertainties
Information about assumptions and estimation uncertainties that have a significant risk of resulting in a material adjustment within the year ended 30 June 2016 are included in the following notes:
Section 1-4 Income taxes Section 2-5 Intangibles Section 2-6 Provisions Section 2-7 Employee benefits Section 3-5 Commitments and contingencies Section 5-1 Structured products assets and liabilities Section 5-6 Share-based payments Measurement of fair values A number of the consolidated entity’s accounting policies and disclosures require the measurement of fair values for both financial and non-financial assets and liabilities. The consolidated entity has an established control framework with respect to the measurement of fair values. This includes overseeing all significant fair value measurements. Significant unobservable inputs and valuation adjustments are regularly reviewed. If third party information, such as broker quotes or pricing services, is used to measure fair values, an assessment is made of the evidence obtained from the third parties. This is used to support the conclusion that such valuations meet the requirements of IFRS, including the level in the fair value hierarchy in which such valuations should be classified. Significant valuation issues are reported to the Audit, Risk and Compliance Committee. When measuring the fair value of an asset or a liability, the consolidated entity uses market observable data as far as possible. Fair values are categorised into different levels in a fair value hierarchy based on the inputs used in the valuation techniques as follows:
Level 1: quoted prices (unadjusted) in active markets for identical assets or liabilities. Level 2: inputs other than quoted prices included in Level 1 that are observable for the asset or
liability, either directly (i.e. as prices) or indirectly (i.e. derived from prices). Level 3: inputs for the asset or liability that are not based on observable market data
(unobservable inputs). If the inputs used to measure the fair value of an asset or a liability might be categorised in different levels of the fair value hierarchy, then the fair value measurement is categorised in its entirety in the same level of the fair value hierarchy as the lowest level input that is significant to the entire measurement. The consolidated entity recognises transfers between levels of the fair value hierarchy at the end of the reporting period during which the change has occurred. Further information about the assumptions made in measuring fair values is included in the following notes: Section 2-7 Employee benefits Section 4-1 Financial risk management Section 5-1 Structured products assets and liabilities Section 5-6 Share-based payments
For
per
sona
l use
onl
y

102
Notes to and forming part of the financial statements for the year ended 30 June 2016
6-3 Other significant accounting policies Significant accounting policies have been included in the relevant notes to which the policies relate. Other significant accounting policies are listed below: i. Basis of consolidation (a) Subsidiaries
Subsidiaries are entities controlled by the consolidated entity. The consolidated entity controls an entity when it is exposed to, or has rights to, variable returns from its involvement with the entity and has the ability to affect those returns through its power over the entity. The financial statements of subsidiaries are included in the consolidated financial statements from the date control commences until the date control ceases. (b) Transactions eliminated on consolidation
Intra-group balances and transactions, and any unrealised income and expenses arising from intra-group transactions, are eliminated in preparing consolidated financial statements. Unrealised gains arising from transactions with associates are eliminated against the investment to the extent of the consolidated entity’s interest in the associate. Unrealised losses are eliminated in the same way as unrealised gains, but only to the extent that there is no evidence of impairment. Gains and losses are recognised when the contributed assets are consumed or sold by the associates or, if not consumed or sold, when the consolidated entity’s interest in such entities is disposed of. ii. Foreign currency (a) Foreign currency transactions and balances
Foreign currency transactions are translated into the functional currency using the exchange rates prevailing at the dates of the transactions. Foreign exchange gains and losses resulting from the settlement of such transactions and from the translation at year end exchange rates of monetary assets and liabilities denominated in foreign currencies are recognised in the profit or loss. Translation differences on financial assets and liabilities carried at fair value are reported as part of their fair value gain or loss. Translation differences on non-monetary financial assets and liabilities such as equities held at fair value through profit or loss are recognised in profit or loss as part of the fair value gain or loss. Translation differences on non-monetary financial assets such as equities classified as available-for-sale financial assets are included in the available-for-sale reserve in equity. (b) Foreign operations The results and financial position of subsidiaries that have a functional currency different from the presentation currency are translated into Australian dollars as follows: Assets and liabilities for each statement of financial position presented are translated at the
closing rate at the date of that statement of financial position. Income and expenses for each statement of comprehensive income are translated at average
exchange rates (unless this is not a reasonable approximation of the cumulative effect of the rates prevailing on the transaction dates, in which case income and expenses are translated at the dates of the transactions).
Foreign currency differences are recognised in other comprehensive income. When a foreign operation is disposed of, in part or in full, the relevant amount in the foreign currency translation reserve is transferred to profit or loss or to non-controlling interest as part of the profit or loss on disposal.
For
per
sona
l use
onl
y

103
Notes to and forming part of the financial statements for the year ended 30 June 2016 6-3 Other significant accounting policies (continued) iii. Payables Payables are non-interest-bearing and are stated at amortised cost, with the exception of contingent consideration recognised in business combinations, which is recorded at fair value at the acquisition date. Contingent consideration recognised in business combinations is classified as a financial liability and is subsequently remeasured to fair value with changes in fair value recognised in profit or loss. iv. Impairment (a) Financial assets (including receivables) A financial asset not carried at fair value through profit or loss is assessed at each reporting date to determine whether there is any objective evidence of impairment. A financial asset is considered to be impaired if objective evidence indicates that one or more events have had a negative effect on the estimated future cash flows of that asset. Objective evidence that financial assets (including equity securities) are impaired can include default or delinquency by a debtor, restructuring of an amount due to the consolidated entity on terms that the consolidated entity would not consider otherwise, indications that a debtor or issuer will enter bankruptcy and the disappearance of an active market for a security. In addition, for an investment in an equity security, a significant or prolonged decline in fair value below its cost is objective evidence of impairment. The consolidated entity considers evidence of impairment for receivables and held-to-maturity investment securities at both a specific asset and collective level. All individually significant receivables and held-to-maturity investment securities are assessed for specific impairment. All individually significant receivables and held-to-maturity investment securities found not to be specifically impaired are then collectively assessed for any impairment that has been incurred but not yet identified. Receivables and held-to-maturity investment securities that are not individually significant are collectively assessed for impairment by grouping together receivables and held-to-maturity investment securities with similar risk characteristics. An impairment loss in respect of a financial asset measured at amortised cost is calculated as the difference between its carrying amount and the present value of the estimated future cash flows discounted at the asset's original effective interest rate. Losses are recognised in profit or loss and reflected in an allowance account against receivables. Interest on the impaired asset continues to be recognised through the unwinding of the discount. When a subsequent event causes the amount of impairment loss to decrease, the decrease in impairment loss is reversed through profit or loss. Impairment losses on available-for-sale investment securities are recognised by transferring the cumulative loss that has been recognised in other comprehensive income, and presented in the available-for-sale reserve in equity, to profit or loss. The cumulative loss that is removed from other comprehensive income and recognised in profit or loss is the difference between the acquisition cost, net of any principal repayment and amortisation, and the current fair value, less any impairment loss previously recognised in profit or loss. If, in a subsequent period, the fair value of an impaired available-for-sale debt security increases and the increase can be related objectively to an event occurring after the impairment loss was recognised in profit or loss, then the impairment loss is reversed, with the amount of the reversal recognised in profit or loss. However, any subsequent recovery in the fair value of an impaired available-for-sale equity security is recognised in other comprehensive income.
For
per
sona
l use
onl
y
104
Notes to and forming part of the financial statements for the year ended 30 June 2016
6-3 Other significant accounting policies (continued)
iv. Impairment (continued) (b) Non-financial assets The carrying amounts of the consolidated entity’s non-financial assets, other than deferred tax assets (see section 1-4), are reviewed at each reporting date to determine whether there is any indication of impairment. If any such indication exists, the asset’s recoverable amount is estimated. For goodwill and intangible assets that have indefinite lives or that are not yet available for use, recoverable amount is estimated at each reporting date. The recoverable amount of an asset or cash-generating unit is the greater of its value in use and its fair value less costs to sell. In assessing value in use, the estimated future cash flows are discounted to their present value using a pre-tax discount rate that reflects current market assessments of the time value of money and the risks specific to the asset. For the purpose of impairment testing, assets that cannot be tested individually are grouped together into the smallest group of assets that generates cash inflows from continuing use that are largely independent of the cash inflows of other assets or groups of assets (the ‘cash-generating unit’ or CGU). Subject to an operating segment ceiling test, for the purposes of goodwill impairment testing, CGUs to which goodwill has been allocated are aggregated so that the level at which impairment is tested reflects the lowest level at which goodwill is monitored for internal reporting purposes. The consolidated entity's corporate assets do not generate separate cash inflows. If there is an indication that a corporate asset may be impaired, then the recoverable amount is determined for the CGU to which the corporate asset belongs. An impairment loss is recognised if the carrying amount of an asset or its cash-generating unit exceeds its recoverable amount. Impairment losses are recognised in the Statement of Comprehensive Income. Impairment losses recognised in respect of cash-generating units are allocated first to reduce the carrying amount of any goodwill allocated to the units and then, to reduce the carrying amount of the other assets in the unit on a pro rata basis. An impairment loss in respect of goodwill is not reversed. In respect of other assets, impairment losses recognised in prior periods are assessed at each balance sheet date for any indications that the loss has decreased or no longer exists. An impairment loss is reversed if there has been a change in the estimates used to determine the recoverable amount. An impairment loss is reversed only to the extent that the asset’s carrying amount does not exceed the carrying amount that would have been determined, net of depreciation or amortisation, if no impairment loss had been recognised.
6-4 New standards and interpretations not yet adopted A number of new accounting standards and amendments have been issued but are not yet effective. The consolidated entity has not elected to early adopt any of these new standards or amendments in this financial report. (a) AASB 9 Financial Instruments AASB 9, published in July 2014, replaces the existing guidance in AASB 139 Financial Instruments: Recognition and Measurement. AASB 9 includes revised guidance on the classification and measurement of financial instruments, including a new expected credit loss model for calculation impairment on financial assets, and the new general hedge accounting requirements. It also carries forward the guidance on recognition and derecognition of financial instruments from AASB 139. AASB 9 is effective for annual reporting periods beginning on or after 1 January 2018, with early adoption permitted.
For
per
sona
l use
onl
y

105
Notes to and forming part of the financial statements for the year ended 30 June 2016 6-4 New standards and interpretations not yet adopted (continued) (b) AASB 15 Revenue from Contracts with Customers AASB 15 establishes a comprehensive framework for determining whether, how much and when revenue is recognised. It replaces existing revenue recognition guidance, including AASB 118 Revenue, AASB 111 Construction Contracts and IFRIC 13 Customer Loyalty Programmes. AASB 15 is effective for annual reporting periods beginning on or after 1 January 2018, with early adoption permitted. (c) AASB 16 Leases AASB 16 introduces new requirements for the recognition of lease assets and lease liabilities in the Consolidated Statement of Financial Position. The classification of the lease liability and lease asset will be determined with reference to the period over which the consolidated entity is expected to benefit from the lease and will be disclosed as current or non-current accordingly. The new standard is also likely to result in a reduction in the consolidated entity’s occupancy expenses as lease costs will instead be allocated against the lease liability. The lease asset will be amortised over the life of the lease resulting in a depreciation and amortisation charge. The depreciation and amortisation charge is expected to approximate the reduction in occupancy expenses. The consolidated entity will disclose the unwinding of the discount on the lease liability as a financing cost in the Consolidated Statement of Profit or Loss and Other Comprehensive Income. AASB 16 will be effective for annual periods beginning on or after 1 January 2019. Early application is permitted, provided the new revenue standard, AASB 15 Revenue from Contracts with Customers, has been applied, or is applied at the same date as AASB 16. These new standards and amendments, when applied in future periods, are not expected to have a material impact on the financial position or performance of the consolidated entity.
For
per
sona
l use
onl
y

106
Directors' declaration
1. In the opinion of the Directors of Perpetual Limited (the ‘Company’):
(a) the consolidated financial statements and notes set out on pages 47 to 105, and the Remuneration Report in the Directors' Report, are in accordance with the Corporations Act 2001, including:
(i) giving a true and fair view of the consolidated entity's financial position as at 30 June 2016 and
of its performance for the financial year ended on that date; and
(ii) complying with Australian Accounting Standards and the Corporations Regulations 2001;
(b) the financial report also complies with International Financial Reporting Standards as disclosed in section 6-2(i);
(c) there are reasonable grounds to believe that the consolidated entity will be able to pay its debts as and when they become due and payable.
2. The Directors have been given the declarations required by Section 295A of the Corporations Act 2001 from the Chief Executive Officer and the Chief Financial Officer for the financial year ended 30 June 2016.
Signed in accordance with a resolution of the Directors: Dated at Sydney this 25th day of August 2016.
Peter Scott Geoff Lloyd Director Director
For
per
sona
l use
onl
y

107
KPMG, an Australian partnership and a member firm of the KPMG network of independent member firms affiliated with KPMG International Cooperative (“KPMG International”), a Swiss entity.
Liability limited by a scheme approved under Profession Standards Legislation.
Independent auditor’s report to the members of Perpetual Limited
Report on the financial report
We have audited the accompanying financial report of Perpetual Limited (the Company), which comprises the consolidated statement of financial position as at 30 June 2016, and consolidated statement of profit and loss and other comprehensive income, consolidated statement of changes in equity and consolidated statement of cash flows for the year ended on that date, notes to the financial statements (sections 1 to 6) comprising a summary of significant accounting policies and other explanatory information and the directors’ declaration of the Group comprising the Company and the entities it controlled at the year’s end or from time to time during the financial year.
Directors’ responsibility for the financial report
The directors of the Company are responsible for the preparation of the financial report that gives a true and fair view in accordance with Australian Accounting Standards and the Corporations Act 2001 and for such internal control as the directors determine is necessary to enable the preparation of the financial report that is free from material misstatement whether due to fraud or error. In section 6-2, the directors also state, in accordance with Australian Accounting Standard AASB 101 Presentation of Financial Statements, that the financial statements of the Group comply with International Financial Reporting Standards.
Auditor’s responsibility
Our responsibility is to express an opinion on the financial report based on our audit. We conducted our audit in accordance with Australian Auditing Standards. These Auditing Standards require that we comply with relevant ethical requirements relating to audit engagements and plan and perform the audit to obtain reasonable assurance whether the financial report is free from material misstatement.
An audit involves performing procedures to obtain audit evidence about the amounts and disclosures in the financial report. The procedures selected depend on the auditor’s judgement, including the assessment of the risks of material misstatement of the financial report, whether due to fraud or error. In making those risk assessments, the auditor considers internal control relevant to the Group’s preparation of the financial report that gives a true and fair view in order to design audit procedures that are appropriate in the circumstances, but not for the purpose of expressing an opinion on the effectiveness of the Group’s internal control. An audit also includes evaluating the appropriateness of accounting policies used and the reasonableness of accounting estimates made by the directors, as well as evaluating the overall presentation of the financial report.
We performed the procedures to assess whether in all material respects the financial report presents fairly, in accordance with the Corporations Act 2001 and Australian Accounting Standards, a true and fair view which is consistent with our understanding of the Group’s financial position and of its performance.
We believe that the audit evidence we have obtained is sufficient and appropriate to provide a basis for our audit opinion.
For
per
sona
l use
onl
y

108
Independence
In conducting our audit, we have complied with the independence requirements of the Corporations Act 2001.
Auditor’s opinion In our opinion:
(a) the financial report of the Group is in accordance with the Corporations Act 2001, including:
(i) giving a true and fair view of the Group’s financial position as at 30 June 2016 and of its performance for the year ended on that date; and
(ii) complying with Australian Accounting Standards and the Corporations Regulations 2001.
(b) the financial report also complies with International Financial Reporting Standards as disclosed in section 6-2.
Report on the remuneration report
We have audited the remuneration report included in pages 8 to 42 of the directors’ report for the year ended 30 June 2016. The directors of the Company are responsible for the preparation and presentation of the remuneration report in accordance with Section 300A of the Corporations Act 2001. Our responsibility is to express an opinion on the remuneration report, based on our audit conducted in accordance with auditing standards.
Auditor’s opinion
In our opinion, the remuneration report of Perpetual Limited for the year ended 30 June 2016, complies with Section 300A of the Corporations Act 2001.
KPMG
Martin McGrath Partner Sydney 25 August 2016
PAR_SIG_01 PAR_NAM_01 PAR_POS_01 PAR_DAT_01 PAR_CIT_01
For
per
sona
l use
onl
y
109
Securities exchange and investor information
2016 Annual General Meeting
The 2016 Annual General Meeting of the Company will be held at Perpetual’s offices, Level 18, 123 Pitt Street, Sydney on 3 November 2016 commencing at 10:00 am.
Securities exchange listing
The ordinary shares of Perpetual Limited are listed on the Australian Securities Exchange under the ASX code PPT, with Sydney being the home exchange. Details of trading activity are published in most daily newspapers.
Substantial shareholders
There are no substantial holders in Perpetual Limited as at 29 July 2016.
Distribution schedule of holdingsas at 29 July 2016
Number of holders
Number of shares
1 – 1,000 shares 22,457 8,353,1121,001 – 5,000 shares 5,242 10,774,1815,001 – 10,000 shares 452 3,195,17310,001 – 100,000 shares 289 6,328,154 100,001 and over shares 28 17,923,806Total 28,468 46,574,426
Twenty largest shareholders as at 29 July 2016
Number of Percentage ofName ordinary shares issued capitalHSBC Custody Nominees (Australia) Limited¹ 3,277,281 7.04%JP Morgan Nominees Australia Limited1 2,670,242 5.73%Citicorp Nominees Pty Limited1 2,549,916 5.47%National Nominees Limited1 1,360,048 2.92%Milton Corporation Limited 1,359,278 2.92%Australian Foundation Investment Company Limited 1,061,110 2.28%BNP Paribas Noms Pty Ltd1 616,134 1.32%Washington H Soul Pattinson & Co Ltd 613,143 1.32%Carlton Hotel Ltd 402,213 0.86%Australian United Investment Company Limited 400,000 0.86%Queensland Trustees Pty Ltd (Long Term Incentive Plan)1,2 379,331 0.81%Enbeear Pty Ltd 368,841 0.79%Queensland Trustees Pty Ltd (Executive Share Plan)1,2 352,550 0.76%Diversified United Investment Limited 300,000 0.64%Queensland Trustees Pty Ltd (Deferred Share Plan)1,2 242,884 0.52%Argo Investments Limited 238,905 0.51%Josseck Pty Limited 207,416 0.45%Citicorp Nominees Pty Limited (CFS Inv. A/c)1 205,605 0.44%BKI Investment Company Limited 181,751 0.39%Navigator Australia Ltd1 167,316 0.36%Total 16,953,964 36.39%1 Held in capacity as executor, trustee or agent.2 The total number of shares held by Queensland Trustees Pty Limited as trustee of the various Employee Share Plans is 974,765 shares.
For
per
sona
l use
onl
y

110
Securities exchange and investor information (continued) Other information
Perpetual Limited, incorporated and domiciled in Australia, is a publicly listed company limited by shares.
Voting rights
Under the Company's Constitution, each member present at a general meeting (whether in person, by proxy, attorney or corporate representative) is entitled:
1. on a show of hands to one vote, and 2. on a poll to one vote for each share held.
If a member is present in person, any proxy of that member is not entitled to vote.
Voting by proxy
Voting by proxy allows shareholders to express their views on the direction and management of the economic entity without attending a meeting in person.
Shareholders who are unable to attend the 2016 Annual General Meeting are encouraged to complete and return the proxy form that accompanies the notice of meeting enclosed with this report.
On-market buy back
There is no current on-market buy back.
Final dividend
The final dividend of 130 cents per share will be paid on 28 September 2016 to shareholders entitled to receive dividends and registered on 6 September 2016, being the record date.
Enquiries
If you have any questions about your shareholding or matters such as dividend payments, tax file numbers or change of address you are invited to contact the Company’s share registry office below, or visit its website at www.linkmarketservices.com.au or email [email protected].
Link Market Services Limited Perpetual Shareholder Information Line: 1A Homebush Bay Drive 1300 732 806 Rhodes, NSW 2138 Fax: (02) 9287 0303
Locked Bag A14 Sydney South NSW 1235
Any other enquiries which you may have about the Company can be directed to the Company’s registered office, or visit the Company’s website at www.perpetual.com.au Principal registered office Level 18 Tel: (02) 9229 9000 123 Pitt Street Fax: (02) 8256 1461 Sydney NSW 2000
Company Secretary Joanne Hawkins
Website address: www.perpetual.com.au
For
per
sona
l use
onl
y