PERKEMBANGAN TRIWULANAN INDONESIA ECONOMIC … filePEREKONOMIAN INDONESIA. INDONESIA ECONOMIC...
62
December 2012 Policies in focus INDONESIA ECONOMIC QUARTERLY
-
Upload
vuongxuyen -
Category
Documents
-
view
214 -
download
0
Transcript of PERKEMBANGAN TRIWULANAN INDONESIA ECONOMIC … filePEREKONOMIAN INDONESIA. INDONESIA ECONOMIC...
December 2012
Policies in focus
INDONESIA ECONOMIC QUARTERLY
Juli 2012
Investing in Indonesia’s Institutionsfor Inclusive and Sustainable Development
Bangkit menghadapi tantangan saat ini dan ke depan
PERKEMBANGAN TRIWULANANPEREKONOMIAN INDONESIA
INDONESIA ECONOMIC QUARTERLY Policies in focus
December 2012

Preface
The Indonesia Economic Quarterly reports on and synthesizes the past three months’ key
developments in Indonesia’s economy. It places them in a longer-term and global context, and assesses the implications of these developments and other changes in policy for the outlook for Indonesia’s economic and social welfare. Its coverage ranges from the macroeconomy to financial markets to indicators of human welfare and development. It is intended for a wide audience, including policy makers, business leaders, financial market participants, and the community of analysts and professionals engaged in Indonesia’s evolving economy.
This Indonesia Economic Quarterly was prepared and compiled by the macro and fiscal policy cluster of the World Bank’s Jakarta office, under the guidance of Sector Manager and Lead Economist, Jim Brumby, Economic Advisor and Lead Economist, Ndiame Diop and Senior Economist, Ashley Taylor. The team included Magda Adriani (commodity prices), Shakira Jones (real sector), Fitria Fitrani (trade), Faya Hayati (prices), Brendan Coates (capital account and financial sector), Ahya Ihsan (fiscal) and Alex Sienaert. Additional contributions were received from Kiyoshi Taniguchi (Food Law), Moez Miaouiand Stefan Handoyo (corporate governance), Edgar Janz, Vivi Alatas and Astrid Savitri(minimum wages), Fook Chuan Eng and Iwan Gunawan (Jakarta flood mitigation), Jon Jellema (village infrastructure survey) and David Lawrence (disaster recovery). Alex Sienaert, Arsianti, and Ashley Taylor shared the editing and production. Yue Man Lee, Soekarno Wirokartono, Chris Manning, Sjamsu Rahardja, Bill Wallace, Arlan Rahman, Anita Kendrick, Shamima Khan, Sudarno Sumarto and Mark Vothknecht provided detailed comments and input. Dini Sari Djalal, Farhana Asnap, Indra Irnawan, Jerry Kurniawan, Nugroho, Marcellinus Winata and Randy Salim organized the dissemination and Titi Ananto, Sylvia Njotomihardjo, and Nina Herawati provided valuable administrative support. This report is a product of the staff of the International Bank for Reconstruction and Development / The World Bank, supported by funding from the Australian Government -AusAID under the Support for Enhanced Macroeconomic and Fiscal Policy Analysis (SEMEFPA) program. The findings, interpretations, and conclusions expressed in this report do not necessarily reflect the views of the Executive Directors of The World Bank or the governments they represent, AusAID or the Australian Government. The World Bank does not guarantee the accuracy of the data included in this work. The boundaries, colors, denominations, and other information shown on any map in this work do not imply any judgment on the part of The World Bank concerning the legal status of any territory or the endorsement or acceptance of such boundaries. Cover and chapter photographs are copyright PT. Unilever. All rights reserved. For more World Bank analysis of Indonesia’s economy:
For information about the World Bank and its activities in Indonesia, please visit www.worldbank.org/id In order to be included on an email distribution list for this Quarterly series and related publications, please contact [email protected]. For questions and comments relating to this publication, please contact [email protected].
Table of contents
Executive Summary: Policies in focus iv
A. ECONOMIC AND FISCAL UPDATE 1
1. Global economic growth remains weak, likely improving only modestly in 2013 1 2. Indonesia’s economy continues to grow robustly, moderating slightly in Q3 2 3. Exports are still under pressure but capital inflows have been strong 6 4. Inflation softness continues but cost-push pressures emerge for 2013 8 5. Foreign investor portfolio flows return while credit growth moderates 11 6. Fiscal deficit widens on rising subsidy spending and subdued revenue growth 14 7. Policymakers face an array of external and domestic risks in 2013 19
B. SOME RECENT DEVELOPMENTS IN INDONESIA’S ECONOMY 21
1. Will rising minimum wages affect job creation in Indonesia 21 a. Minimum wage level and employment protection legislation in Indonesia.............................. 22 b. Effects of minimum wage increases on job creation ................................................................. 24 c. Changes in the process for setting minimum wages ................................................................. 25 d. Adopting a long-term view on job creation and worker protection .......................................... 25
2. Building Jakarta’s resilience to frequent flooding 27 a. The severity of flooding has increased, imposing significant costs ........................................ 27 b. Weather patterns, urbanization, subsidence and climate change all play a role… ................. 28 c. …but actions can be taken to improve Jakarta’s resilience to floods ...................................... 30
C. INDONESIA 2014 AND BEYOND: A SELECTIVE LOOK 32
1. Indonesia’s successes in disaster reconstruction and preparedness 32 a. The challenges posed by the Aceh, Nias and Java disasters were unprecedented ................ 32 b. Multi-donor funds supported Government-led relief and reconstruction efforts .................... 33 c. Applying the lessons that Indonesia has learned on disaster recovery ....................................... 35
2. Village infrastructure for basic service delivery 37 a. What is the Village Infrastructure Census and why is it necessary? ........................................ 37 b. The VIC combines a range of indicators to provide Supply Readiness Indices ...................... 37 c. Health Service Supply Readiness is highest in Java and Bali .................................................. 39 d. …with similar spatial patterns for Education Supply Readiness… .......................................... 40 e. …and both are highly correlated with Transportation Supply Readiness ............................... 41 f. Extensions and policy applications ............................................................................................. 43
APPENDIX: A SNAPSHOT OF INDONESIAN ECONOMIC INDICATORS 44
LIST OF FIGURES
Figure 1: Investment growth has so far remained resilient to the downturn in commodity prices and exports .................................................................................................................... vi
Figure 2: Increases for 2013 may well push minimum wages higher relative to regional neighbors ..................................................................................................................... viii
Figure 3: Improved conditions in the US and a bottoming-out in China but no upturn yet for the Euro Area or Japan ........................................................................................................ 2
Figure 4: Commodities remain well off their highs, though some have gained in recent months 2 Figure 5: Real GDP growth moderated to 6.2 percent year-on-year in the third quarter of 2012… 2 Figure 6: …while nominal GDP growth dipped to its lowest level since September 2009 as GDP
deflator growth slowed .................................................................................................. 2 Figure 7: Private consumption and investment continue to be the key drivers of growth ............. 4 Figure 8: Manufacturing continued to perform strongly in the third quarter while services
growth moderated .......................................................................................................... 4 Figure 9: Inventory levels appear elevated ......................................................................................... 4 Figure 10: The balance of payments returned to a small surplus in the third quarter of 2012 ...... 6 Figure 11: Exports remain under pressure… ..................................................................................... 7 Figure 12: …while portfolio inflows have picked up again ................................................................ 7 Figure 13: Headline and core inflation remain at historically low levels .......................................... 8 Figure 14: The Rupiah has weakened considerably, though less so on a trade-weighted basis 11 Figure 15: The bond market rallied strongly this quarter while equities have fluctuated since
mid-October… .............................................................................................................. 12 Figure 16: …and Rupiah depreciation has been moderate in real terms and compared with other
commodity exporters ................................................................................................... 12 Figure 17: Credit growth has slowed since May............................................................................... 12 Figure 18: The Budget deficit through October expanded on higher energy subsidy spending . 14 Figure 19: Revenue collection has moderated on the back of continued weaker income tax and
non-tax revenue receipts ............................................................................................. 14 Figure 20: The volume of subsidized fuel continues to rise in the absence of fuel subsidy
reform ............................................................................................................................ 16 Figure 21: Excess subsidized fuel use relative to quota is centered in densely populated cities,
mining, and border areas ............................................................................................. 16 Figure 22: After 10 months of 2012, some of the budget allocations remaining to be spent are
significant ..................................................................................................................... 17 Figure 23: Capital and subsidies spending set to increase in 2013 ............................................... 18 Figure 24: Increases for 2013 will likely push Indonesia’s minimum wages above regional
neighbors ...................................................................................................................... 21 Figure 25: Indonesia’s workforce is highly informal… .................................................................... 23 Figure 26: …but for those in the formal sector, minimum wages signal increases for all ........... 23 Figure 27: Non-compliance tends to increase with rising minimum wages… ............................... 24 Figure 28: …and small-sized firms tend to be less compliant ........................................................ 24 Figure 29: The 2007 flood caused sizeable financial damage but much greater economic
losses… ......................................................................................................................... 28 Figure 30: …and these economic losses were focused on larger industrial firms ....................... 28 Figure 31: Densely-populated slum areas were heavily affected by the 2007 flood ..................... 29 Figure 32: The 2007 flood would have been less severe if existing facilities were fully
functioning .................................................................................................................... 30 Figure 33: A strategic framework for effective disaster reconstruction ......................................... 34 Figure 34: Health Supply Readiness is higher in Java and Bali and falls in eastern Indonesia ... 39 Figure 35: The spatial pattern of Education Supply Readiness is similar to that for health ........ 40 Figure 36: Areas with poor supply of health or education services tend to also have poor
accessibility by public transport ................................................................................. 42 Figure 37: Half of the sub-districts in the Papuan provinces do not have any mobile phone
signal ............................................................................................................................. 42 Figure 38: The quality of primary school teachers can vary markedly even within sub-districts 42
LIST OF APPENDIX FIGURES
Appendix Figure 1: Quarterly and annual GDP growth ................................................................... 44 Appendix Figure 2: Contributions to GDP expenditures ................................................................. 44 Appendix Figure 3: Contributions to GDP production ..................................................................... 44 Appendix Figure 4: Motor cycle and motor vehicle sales ............................................................... 44 Appendix Figure 5: Consumer indicators ......................................................................................... 44 Appendix Figure 6: Industrial production indicators ....................................................................... 44 Appendix Figure 7: Real trade flows ................................................................................................. 45 Appendix Figure 8: Balance of Payments ......................................................................................... 45 Appendix Figure 9: Goods trade balance ......................................................................................... 45 Appendix Figure 10: Reserves and capital inflows .......................................................................... 45 Appendix Figure 11: Indonesia’s major term of trade indices and other commodities ............... 45 Appendix Figure 12: Inflation and monetary policy ......................................................................... 45 Appendix Figure 13: Monthly breakdown of CPI .............................................................................. 46 Appendix Figure 14: Inflation among neighboring countries ......................................................... 46 Appendix Figure 15: Domestic and international rice prices .......................................................... 46 Appendix Figure 16: Poverty and unemployment rate .................................................................... 46 Appendix Figure 17: Regional equity indices ................................................................................... 46 Appendix Figure 18: Dollar index and Rupiah exchange rate ......................................................... 46 Appendix Figure 19: 5-year local currency government bond yields ............................................. 47 Appendix Figure 20: Sovereign USD Bond EMBI spreads .............................................................. 47 Appendix Figure 21: International commercial bank lending ......................................................... 47 Appendix Figure 22: Banking sector indicators ............................................................................... 47 Appendix Figure 23: Government debt ............................................................................................. 47 Appendix Figure 24: External debt .................................................................................................... 47
LIST OF TABLES
Table 1: Commodity prices remain historically high in nominal terms but recent performance has been mixed .............................................................................................................. v
Table 2: Under the baseline scenario Indonesia’s growth is projected at 6.3 percent in 2013 .... vii Table 3: Under the baseline scenario GDP growth of 6.1 percent is projected for 2012, rising to
6.3 percent in 2013 ......................................................................................................... 5 Table 4: Budget disbursement rates through end-October remain relatively low......................... 15 Table 5: The fiscal deficit will expand in 2012 on higher energy subsidy spending and a
moderation in revenue collection ............................................................................... 19 Table 6: Worker productivity lags behind ......................................................................................... 21 Table 7: The composite Supply Readiness Indices include a range of indicators for health,
education and transportation ...................................................................................... 38 Table 8: Some of the gaps in Health Service Supply Readiness are striking, such as access to
secondary health care.................................................................................................. 40 Table 9: The Education Supply Readiness Gaps indicates the need for to improve physical
quality of supply ........................................................................................................... 41
LIST OF APPENDIX TABLES Appendix Table 1: Budget outcomes and projections ..................................................................... 48 Appendix Table 2: Balance of Payments .......................................................................................... 48 Appendix Table 3: Indonesia’s development indicators at a glance .............................................. 49
LIST OF BOXES Box 1: Indonesia’s new Food Law ....................................................................................................... 8 Box 2: Why has the depreciating Rupiah not had a greater impact on inflation? ........................ 11 Box 3: Developments in Indonesia’s corporate governance framework ....................................... 13 Box 4: Labor regulations: a “plateau” effect .................................................................................... 24 Box 5: The impact of the major 2007 flood on Jakarta .................................................................... 28 Box 6: Rekompak – community-led reconstruction of settlements after disaster ........................ 34 Box 7: A note on reliability in the Supply Readiness Rankings ...................................................... 38

Executive summary: Policies in focus
Global economic conditions have been weak and are improving only slowly
As 2012 draws to a close, global economic conditions appear to be improving, but at a slow and uneven pace. In the third quarter, growth in the US picked up, while China’s economy continued to slow, though its GDP still expanded 7.4 percent year-on-year. The economies of the Euro Area and Japan contracted. More recent data, for the fourth quarter, are mixed. Manufacturing data and purchasing managers’ indices have disappointed in the US and indicate continued sluggishness in Europe, notably in Germany and France. But there are also encouraging indications that China’s economy and export-oriented industrial production across Asia are now gathering pace. This mixed economic backdrop, suggesting a slow improvement in the global economy but not by enough to call into question accommodative monetary policy across high income economies, has kept financial markets generally well supported. Emerging market equities and sovereign credit spreads have fluctuated since September, but the overall trend since mid-year has been towards higher stock prices and tighter spreads.
This weakness has hurt Indonesia’s export performance…
Like other commodity exporters, Indonesia has clearly felt the effects of the weaker global economy in 2012 through the trade channel. Exports in the year to October were down 6.2 percent in USD terms compared with the same period in 2011, while import demand has continued to grow. Consequently, the cumulative goods trade balance in 2012 through October reached a deficit of USD 500 million, compared with a surplus of USD 26 billion in the first ten months of 2011. This deterioration has weighed on the Rupiah, which is down 6.0 percent on a trade-weighted basis in 2012.
…with commodity-related exports affected by continued weakening in global prices
Much of the decline in exports can be attributed to weaker commodity prices, many of which remain under pressure (Table 1). Palm oil prices have dropped particularly sharply in recent months, with average prices in November down 16 percent from September. Crude oil and natural gas prices have gained since mid-year. There are some signs that the marked decline in coal prices, down 24 percent since end-2011, has stabilized but past declines may still weigh on future export performance. Industrial metal prices, notably copper, have recovered from their mid-year lows, but weakened somewhat in November.
Table 1: Commodity prices remain historically high in nominal terms but recent performance has been mixed (USD dollar commodity prices, percentage change; export share, percent)
Change to November 2012 from:
Export share*
Jan-05
Dec-11
Sept-12
Coal 56.6 -24.3 -6.6 14.0
Natural gas
49.7 4.6 8.8
11.6
Palm oil 102.5 -20.7 -15.8 9.0
Crude oil 147.7 1.7 -3.2 6.5
Rubber 151.3 -12.1 -2.1 4.5
Copper 143.3 1.9 -4.7 2.5
Note: Australian coal, World Bank global natural gas index, Malaysia palm oil, Brent crude, Singapore-traded rubber, London-traded copper; *Export share is for January-July 2012 Source: BPS, World Bank and staff calculations
vi
However, economic growth as a whole has proven robust
Global economic weakness and elevated uncertainty in 2012 have not prevented Indonesia’s economy from growing robustly. This was evident in the third quarter, when real GDP rose by 6.2 percent year-on-year. This was only slightly lower than 6.4 percent year-on-year in the second quarter, though the pace of expansion was also down on a quarter-on-quarter seasonally adjusted basis. Growth continues to be powered by strong private demand, with private consumption, a consistent source of growth, expanding 5.7 percent year-on-year in the third quarter, up from 5.2 percent in the second quarter.
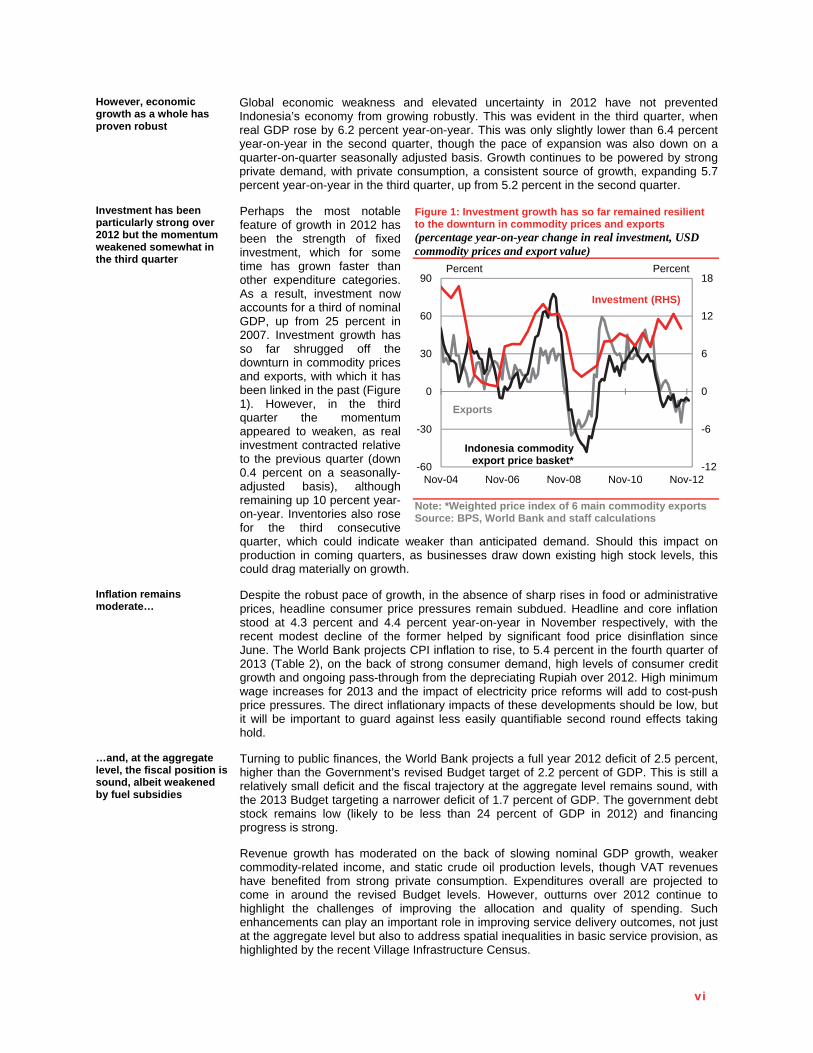
Investment has been particularly strong over 2012 but the momentum weakened somewhat in the third quarter
Perhaps the most notable feature of growth in 2012 has been the strength of fixed investment, which for some time has grown faster than other expenditure categories. As a result, investment now accounts for a third of nominal GDP, up from 25 percent in 2007. Investment growth has so far shrugged off the downturn in commodity prices and exports, with which it has been linked in the past (Figure 1). However, in the third quarter the momentum appeared to weaken, as real investment contracted relative to the previous quarter (down 0.4 percent on a seasonally-adjusted basis), although remaining up 10 percent year-on-year. Inventories also rose for the third consecutive quarter, which could indicate weaker than anticipated demand. Should this impact on production in coming quarters, as businesses draw down existing high stock levels, this could drag materially on growth.
Figure 1: Investment growth has so far remained resilient to the downturn in commodity prices and exports (percentage year-on-year change in real investment, USD commodity prices and export value)
Note: *Weighted price index of 6 main commodity exports Source: BPS, World Bank and staff calculations
Inflation remains moderate…
Despite the robust pace of growth, in the absence of sharp rises in food or administrative prices, headline consumer price pressures remain subdued. Headline and core inflation stood at 4.3 percent and 4.4 percent year-on-year in November respectively, with the recent modest decline of the former helped by significant food price disinflation since June. The World Bank projects CPI inflation to rise, to 5.4 percent in the fourth quarter of 2013 (Table 2), on the back of strong consumer demand, high levels of consumer credit growth and ongoing pass-through from the depreciating Rupiah over 2012. High minimum wage increases for 2013 and the impact of electricity price reforms will add to cost-push price pressures. The direct inflationary impacts of these developments should be low, but it will be important to guard against less easily quantifiable second round effects taking hold.
…and, at the aggregate level, the fiscal position is sound, albeit weakened by fuel subsidies
Turning to public finances, the World Bank projects a full year 2012 deficit of 2.5 percent, higher than the Government’s revised Budget target of 2.2 percent of GDP. This is still a relatively small deficit and the fiscal trajectory at the aggregate level remains sound, with the 2013 Budget targeting a narrower deficit of 1.7 percent of GDP. The government debt stock remains low (likely to be less than 24 percent of GDP in 2012) and financing progress is strong. Revenue growth has moderated on the back of slowing nominal GDP growth, weaker commodity-related income, and static crude oil production levels, though VAT revenues have benefited from strong private consumption. Expenditures overall are projected to come in around the revised Budget levels. However, outturns over 2012 continue to highlight the challenges of improving the allocation and quality of spending. Such enhancements can play an important role in improving service delivery outcomes, not just at the aggregate level but also to address spatial inequalities in basic service provision, as highlighted by the recent Village Infrastructure Census.
-12
-6
0
6
12
18
-60
-30
0
30
60
90
Nov-04 Nov-06 Nov-08 Nov-10 Nov-12
PercentPercent
Investment (RHS)
Exports
Indonesia commodity export price basket*
vi i
Budget disbursements of capital and material expenditures are still behind their targets, despite strong nominal growth. Most notably, the opportunity cost of energy subsidies continues to rise. World Bank projections are that fuel subsidies will exceed IDR 200 trillion for 2012 (or 20 percent of total government spending, excluding regional transfers). This is significantly above the IDR 165 trillion cost of fuel subsidies in 2011. Strong domestic consumption has pushed up the quota of subsidized fuel and costs have been driven up by the rise in Rupiah-denominated fuel prices. Subsidies are also adding to pressures on the trade balance through the imports of refined products.
Strong growth of above 6 percent is the base case for 2013 but risks remain skewed to the downside…
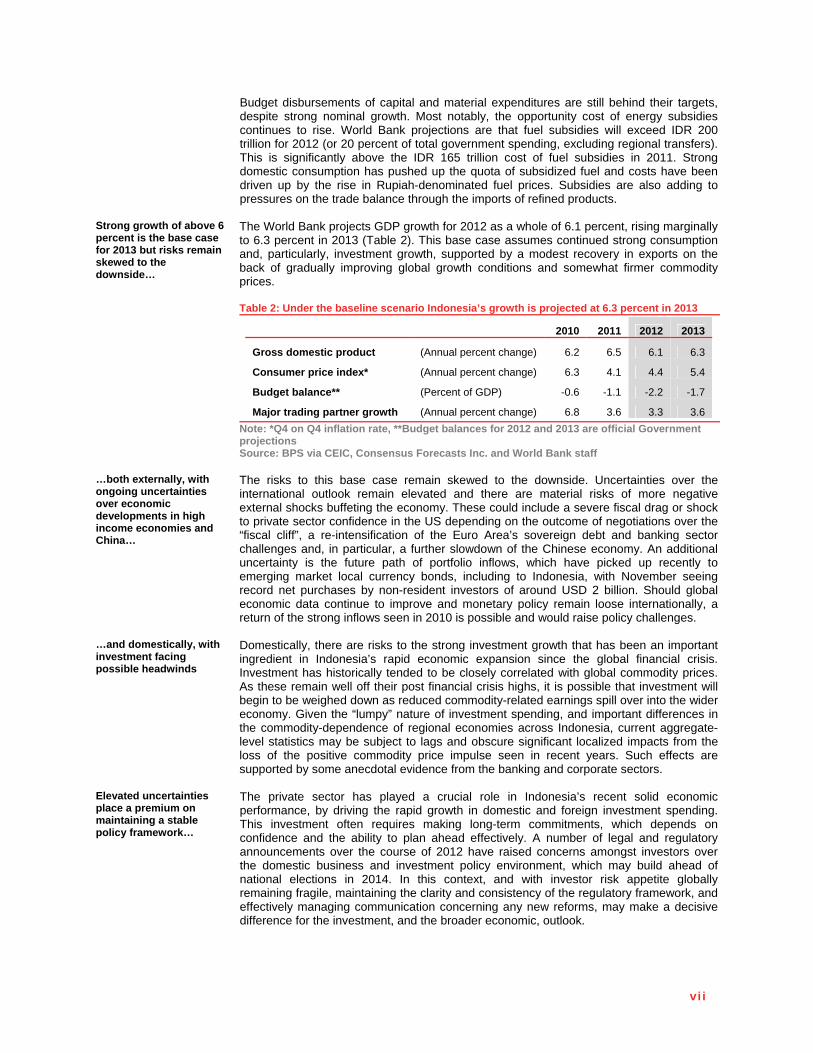
The World Bank projects GDP growth for 2012 as a whole of 6.1 percent, rising marginally to 6.3 percent in 2013 (Table 2). This base case assumes continued strong consumption and, particularly, investment growth, supported by a modest recovery in exports on the back of gradually improving global growth conditions and somewhat firmer commodity prices. Table 2: Under the baseline scenario Indonesia’s growth is projected at 6.3 percent in 2013
2010 2011 2012 2013
Gross domestic product (Annual percent change) 6.2 6.5 6.1 6.3
Consumer price index* (Annual percent change) 6.3 4.1 4.4 5.4
Budget balance** (Percent of GDP) -0.6 -1.1 -2.2 -1.7
Major trading partner growth (Annual percent change) 6.8 3.6 3.3 3.6
Note: *Q4 on Q4 inflation rate, **Budget balances for 2012 and 2013 are official Government projections Source: BPS via CEIC, Consensus Forecasts Inc. and World Bank staff
…both externally, with ongoing uncertainties over economic developments in high income economies and China…
The risks to this base case remain skewed to the downside. Uncertainties over the international outlook remain elevated and there are material risks of more negative external shocks buffeting the economy. These could include a severe fiscal drag or shock to private sector confidence in the US depending on the outcome of negotiations over the “fiscal cliff”, a re-intensification of the Euro Area’s sovereign debt and banking sector challenges and, in particular, a further slowdown of the Chinese economy. An additional uncertainty is the future path of portfolio inflows, which have picked up recently to emerging market local currency bonds, including to Indonesia, with November seeing record net purchases by non-resident investors of around USD 2 billion. Should global economic data continue to improve and monetary policy remain loose internationally, a return of the strong inflows seen in 2010 is possible and would raise policy challenges.
…and domestically, with investment facing possible headwinds
Domestically, there are risks to the strong investment growth that has been an important ingredient in Indonesia’s rapid economic expansion since the global financial crisis. Investment has historically tended to be closely correlated with global commodity prices. As these remain well off their post financial crisis highs, it is possible that investment will begin to be weighed down as reduced commodity-related earnings spill over into the wider economy. Given the “lumpy” nature of investment spending, and important differences in the commodity-dependence of regional economies across Indonesia, current aggregate-level statistics may be subject to lags and obscure significant localized impacts from the loss of the positive commodity price impulse seen in recent years. Such effects are supported by some anecdotal evidence from the banking and corporate sectors.
Elevated uncertainties place a premium on maintaining a stable policy framework…
The private sector has played a crucial role in Indonesia’s recent solid economic performance, by driving the rapid growth in domestic and foreign investment spending. This investment often requires making long-term commitments, which depends on confidence and the ability to plan ahead effectively. A number of legal and regulatory announcements over the course of 2012 have raised concerns amongst investors over the domestic business and investment policy environment, which may build ahead ofnational elections in 2014. In this context, and with investor risk appetite globally remaining fragile, maintaining the clarity and consistency of the regulatory framework, and effectively managing communication concerning any new reforms, may make a decisive difference for the investment, and the broader economic, outlook.
vi i i
…which balances the welfare of different groups of workers and the outlook for employment and investment
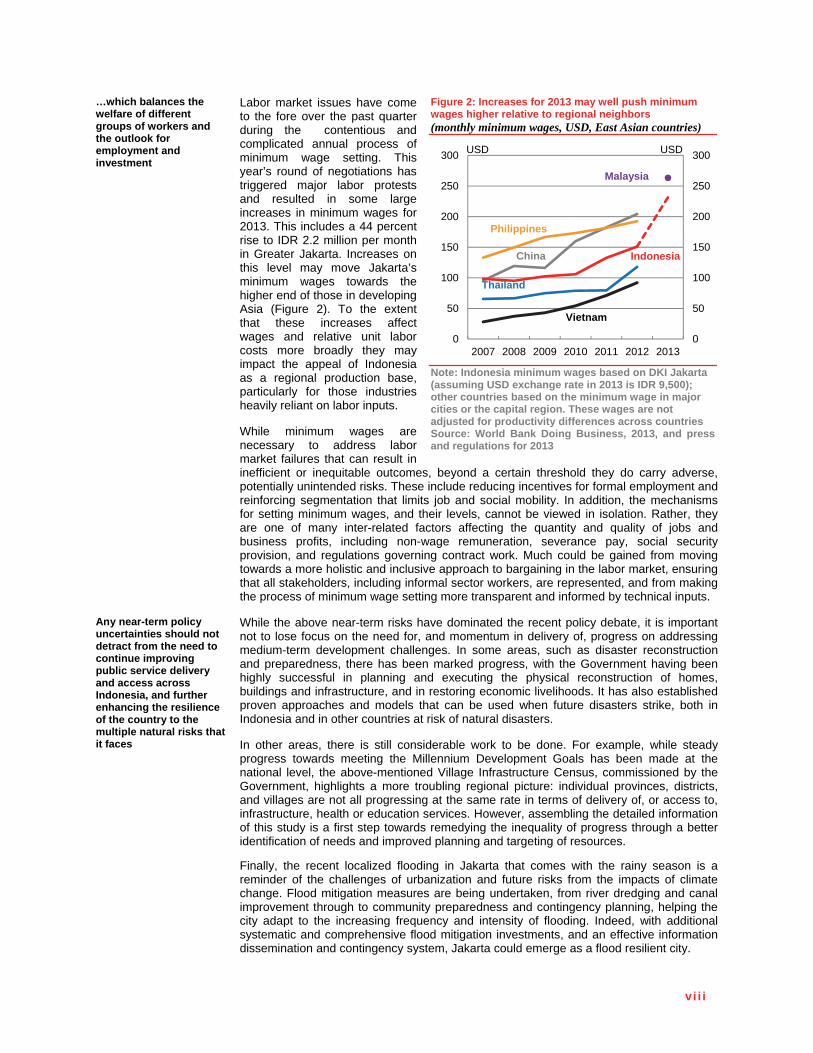
Labor market issues have come to the fore over the past quarter during the contentious and complicated annual process of minimum wage setting. This year’s round of negotiations has triggered major labor protests and resulted in some large increases in minimum wages for 2013. This includes a 44 percent rise to IDR 2.2 million per month in Greater Jakarta. Increases on this level may move Jakarta’s minimum wages towards the higher end of those in developing Asia (Figure 2). To the extent that these increases affect wages and relative unit labor costs more broadly they may impact the appeal of Indonesia as a regional production base, particularly for those industries heavily reliant on labor inputs. While minimum wages are necessary to address labor market failures that can result in inefficient or inequitable outcomes, beyond a certain threshold they do carry adverse, potentially unintended risks. These include reducing incentives for formal employment and reinforcing segmentation that limits job and social mobility. In addition, the mechanisms for setting minimum wages, and their levels, cannot be viewed in isolation. Rather, they are one of many inter-related factors affecting the quantity and quality of jobs and business profits, including non-wage remuneration, severance pay, social security provision, and regulations governing contract work. Much could be gained from moving towards a more holistic and inclusive approach to bargaining in the labor market, ensuring that all stakeholders, including informal sector workers, are represented, and from making the process of minimum wage setting more transparent and informed by technical inputs.
Figure 2: Increases for 2013 may well push minimum wages higher relative to regional neighbors (monthly minimum wages, USD, East Asian countries)
Note: Indonesia minimum wages based on DKI Jakarta (assuming USD exchange rate in 2013 is IDR 9,500); other countries based on the minimum wage in major cities or the capital region. These wages are not adjusted for productivity differences across countries Source: World Bank Doing Business, 2013, and press and regulations for 2013
Any near-term policy uncertainties should not detract from the need to continue improving public service delivery and access across Indonesia, and further enhancing the resilience of the country to the multiple natural risks that it faces
While the above near-term risks have dominated the recent policy debate, it is important not to lose focus on the need for, and momentum in delivery of, progress on addressing medium-term development challenges. In some areas, such as disaster reconstruction and preparedness, there has been marked progress, with the Government having been highly successful in planning and executing the physical reconstruction of homes, buildings and infrastructure, and in restoring economic livelihoods. It has also established proven approaches and models that can be used when future disasters strike, both in Indonesia and in other countries at risk of natural disasters. In other areas, there is still considerable work to be done. For example, while steady progress towards meeting the Millennium Development Goals has been made at the national level, the above-mentioned Village Infrastructure Census, commissioned by the Government, highlights a more troubling regional picture: individual provinces, districts, and villages are not all progressing at the same rate in terms of delivery of, or access to, infrastructure, health or education services. However, assembling the detailed information of this study is a first step towards remedying the inequality of progress through a better identification of needs and improved planning and targeting of resources.
Finally, the recent localized flooding in Jakarta that comes with the rainy season is a reminder of the challenges of urbanization and future risks from the impacts of climate change. Flood mitigation measures are being undertaken, from river dredging and canal improvement through to community preparedness and contingency planning, helping the city adapt to the increasing frequency and intensity of flooding. Indeed, with additional systematic and comprehensive flood mitigation investments, and an effective information dissemination and contingency system, Jakarta could emerge as a flood resilient city.
0
50
100
150
200
250
300
0
50
100
150
200
250
300
2007 2008 2009 2010 2011 2012 2013
USDUSD
China Indonesia
Malaysia
Philippines
Thailand
Vietnam
I n d o n e s i a E c o n o m i c Q u a r t e r l y P o l i c i e s i n f o c u s
THE WORLD BANK | BANK DUNIA December 20121
A. ECONOMIC AND FISCAL UPDATE
1. Global economic growth remains weak, likely improving only modestly in 2013
Global economic momentum is improving, but slowly and unevenly
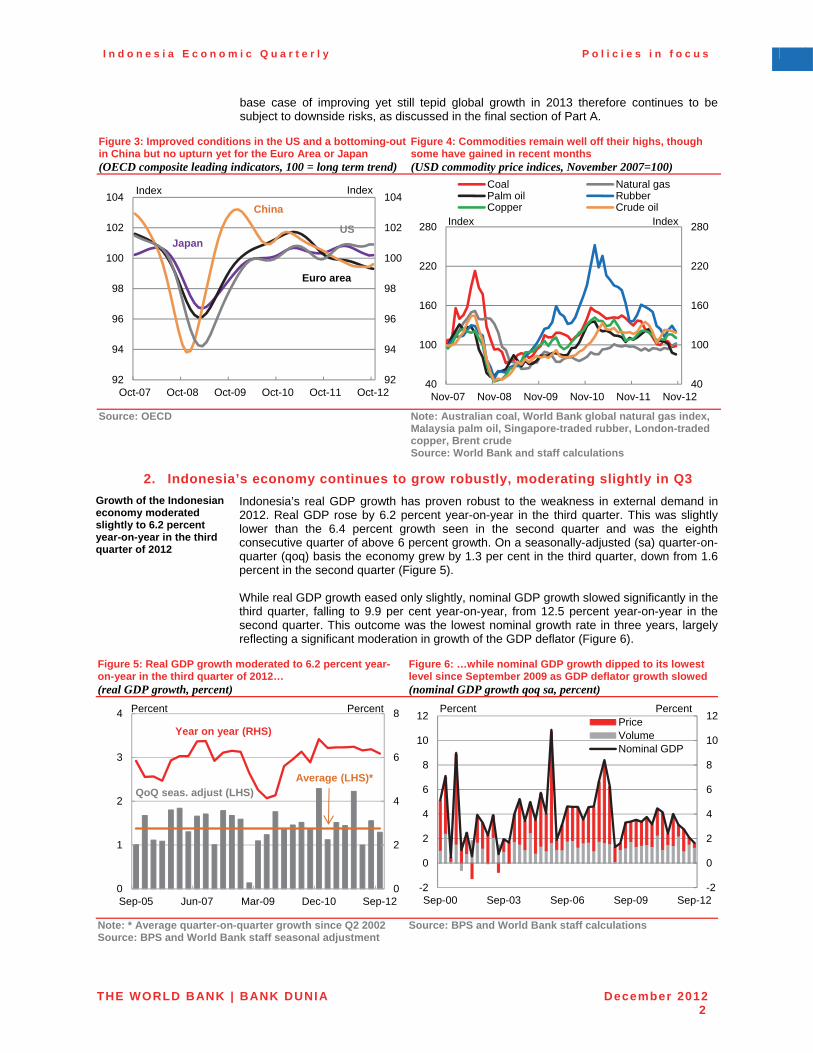
As the end of 2012 approaches, the modest firming in global economic conditions anticipated in the October IEQ appears to be underway, but the improvement continues to be slow and uneven. In the US, third quarter GDP growth rose to 2.7 percent at a seasonally adjusted annualized rate (saar), sharply higher than 1.3 percent (saar) in the second quarter and a significant upward revision from the initial estimate of 2 percent. In contrast, China’s economy continued to slow in the third quarter on a year-on-year basis, but still grew by 7.4 percent year-on-year, and there are encouraging signs, such as from industrial output, that some acceleration in growth is underway. Less positively, however, the Euro Area is still struggling to emerge from its shallow but protracted recession, with third quarter GDP flat-lining at -0.2 percent (saar) amidst concerns that both Germany, the regional growth engine, and France, are slowing. Japan’s economy also shrank by 3.5 percent (saar) in the third quarter of 2012.
Coupled with accommodative policies, this has been enough to support financial markets
Economic data have been mixed since the October IEQ and are certainly not pointing to a strong enough near-term pickup in global growth to call accommodative monetary policy into question (Figure 3). Meanwhile, the debt crisis in the Euro Area lingers on but fears over an imminent sovereign funding and banking crisis have abated since August, following policy action by the European Central Bank. This mix has capped most developed-market bond yields at historically low levels, stabilized financial conditions in the Euro Area, and been quite supportive for risk appetite, triggering significant inflows to emerging market debt and equities. Consequently, while financial markets have fluctuated since the October IEQ, equity prices remain well above their mid-year lows and sovereign credit spreads have tightened back to levels last seen in mid-2011.
Commodity price movements have been mixed
In line with the hesitant nature of the global growth recovery, the recent performance of international commodity prices has been mixed, and the prices of many of Indonesia’s key exports remain under pressure (Figure 4). Palm oil prices have dropped particularly sharply, with average prices in November down 16 percent from September, to bring the decline for 2012 through November to 21 percent. Crude oil and natural gas prices have gained since mid-year and there are some signs that the marked decline in coal prices has stabilized, though prices remain on the order of 20 percent lower in 2012. Industrial metal prices, notably copper, have recovered somewhat from their mid-year lows, but tended to give up some gains in November.
2013 should be a better year for global growth, but perhaps not by much, and downside risks remain
Looking ahead to 2013, the outlook remains for a gradual improvement in the global economy, with the World Bank expecting growth in Indonesia’s major trading partners to rise by 0.3 percent from 2012, to 3.6 percent. The pace of the recovery from the financial crisis in high income economies, many of which are still weighed down by high debt burdens, resulting in private sector deleveraging and fiscal consolidation, is expected to remain slow. Much therefore depends on China, where the risk of a further slowdown, while not the base case, remains. In both the US and the Euro Area there is also a clear chance of more adverse scenarios unfolding, as negotiations continue in the US over avoiding the tax increases and spending cuts imposed by current legislation (the “fiscal cliff”), and Europe treads a difficult path towards debt sustainability in the periphery. The
I n d o n e s i a E c o n o m i c Q u a r t e r l y P o l i c i e s i n f o c u s
THE WORLD BANK | BANK DUNIA December 20122
base case of improving yet still tepid global growth in 2013 therefore continues to be subject to downside risks, as discussed in the final section of Part A.
Figure 3: Improved conditions in the US and a bottoming-out in China but no upturn yet for the Euro Area or Japan (OECD composite leading indicators, 100 = long term trend)
Figure 4: Commodities remain well off their highs, though some have gained in recent months (USD commodity price indices, November 2007=100)
Source: OECD Note: Australian coal, World Bank global natural gas index,
Malaysia palm oil, Singapore-traded rubber, London-traded copper, Brent crude Source: World Bank and staff calculations
2. Indonesia’s economy continues to grow robustly, moderating slightly in Q3
Growth of the Indonesian economy moderated slightly to 6.2 percent year-on-year in the third quarter of 2012
Indonesia’s real GDP growth has proven robust to the weakness in external demand in 2012. Real GDP rose by 6.2 percent year-on-year in the third quarter. This was slightly lower than the 6.4 percent growth seen in the second quarter and was the eighth consecutive quarter of above 6 percent growth. On a seasonally-adjusted (sa) quarter-on-quarter (qoq) basis the economy grew by 1.3 per cent in the third quarter, down from 1.6 percent in the second quarter (Figure 5). While real GDP growth eased only slightly, nominal GDP growth slowed significantly in the third quarter, falling to 9.9 per cent year-on-year, from 12.5 percent year-on-year in the second quarter. This outcome was the lowest nominal growth rate in three years, largely reflecting a significant moderation in growth of the GDP deflator (Figure 6).
Figure 5: Real GDP growth moderated to 6.2 percent year-on-year in the third quarter of 2012… (real GDP growth, percent)
Figure 6: …while nominal GDP growth dipped to its lowest level since September 2009 as GDP deflator growth slowed (nominal GDP growth qoq sa, percent)
Note: * Average quarter-on-quarter growth since Q2 2002 Source: BPS and World Bank staff seasonal adjustment
Source: BPS and World Bank staff calculations
92
94
96
98
100
102
104
92
94
96
98
100
102
104
Oct-07 Oct-08 Oct-09 Oct-10 Oct-11 Oct-12
IndexIndex
JapanUS
Euro area
China
40
100
160
220
280
40
100
160
220
280
Nov-07 Nov-08 Nov-09 Nov-10 Nov-11 Nov-12
IndexIndex
Coal Natural gasPalm oil RubberCopper Crude oil
0
2
4
6
8
0
1
2
3
4
Sep-05 Jun-07 Mar-09 Dec-10 Sep-12
Percent Percent
QoQ seas. adjust (LHS)
Year on year (RHS)
Average (LHS)*
-2
0
2
4
6
8
10
12
-2
0
2
4
6
8
10
12
Sep-00 Sep-03 Sep-06 Sep-09 Sep-12
PriceVolumeNominal GDP
Percent Percent
I n d o n e s i a E c o n o m i c Q u a r t e r l y P o l i c i e s i n f o c u s
THE WORLD BANK | BANK DUNIA December 20123
Growth in domestic demand moderated but remained strong…
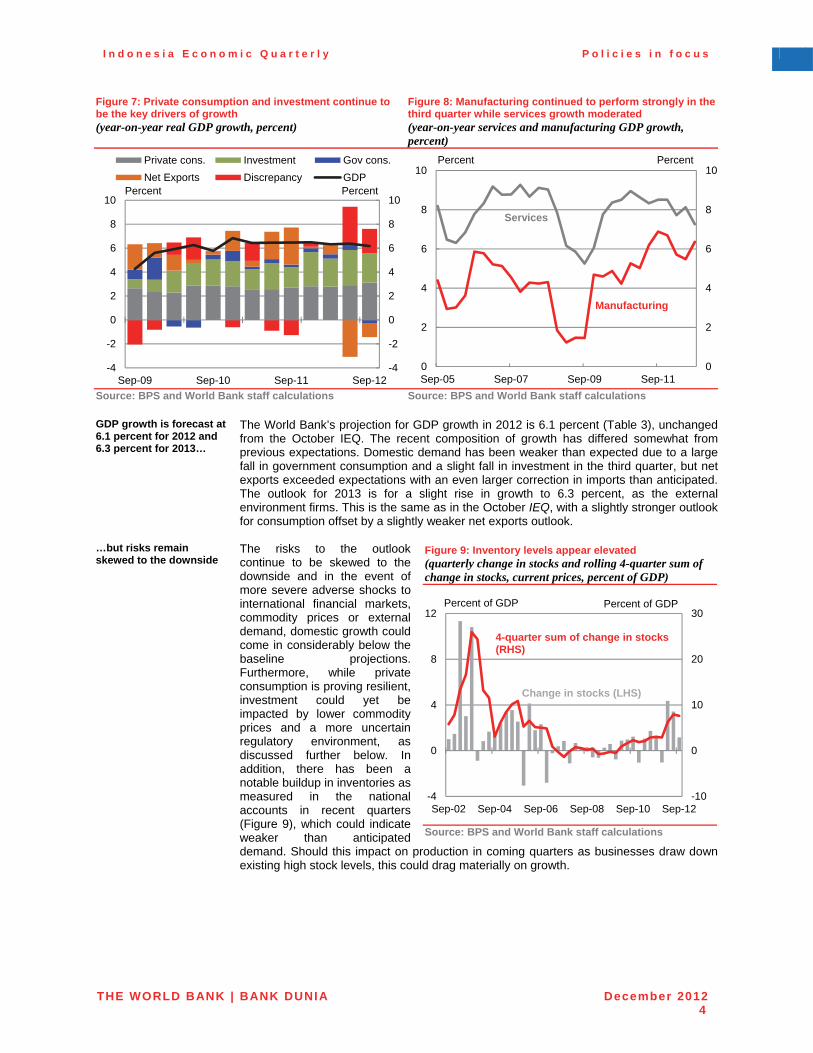
In real terms, growth in domestic demand moderated in the third quarter to 6.1 percent year-on-year, down from 7.4 percent year-on-year in the second quarter. Private consumption and investment continue to be the engines of Indonesia’s solid economic growth performance (Figure 7). Government consumption registered a surprisingly large fall in the quarter, down 3.2 percent year-on-year, driven by weakness in government material expenditures.
…with investment growth moderating…
The level of investment spending remained high, up 10 percent year-on-year in the third quarter. However, investment did contract in seasonally adjusted quarter on quarter terms by 0.4 percent. This sequential contraction was largely driven by falls in spending on foreign transportation, machinery and equipment, consistent with the weakness in capital goods imports seen in the quarter. Building investment (which accounts for 84 percent of total investment) continued to grow solidly in the third quarter, up 8.0 per cent year-on-year, in line with the solid growth seen in cement sales.
…and private consumption picking up
In contrast to the sharp drop in government consumption and moderation in investment, private consumption growth picked up in the third quarter, increasing by 5.7 percent year-on-year. There were strong increases in both food and non-food consumption. Bank Indonesia surveys indicate that consumer confidence hit all-time highs during the quarter.
Exports remained under pressure and imports contracted sharply
In contrast with previous quarters, net external demand actually supported quarterly growth in the third quarter; net exports added 2.3 percentage points to seasonally adjusted quarter-on-quarter growth. However, this was because continuing weakness in exports was more than offset by a sharp fall in imports in the third quarter. Exports of goods and services remained under pressure, falling by 2.4 percent in seasonally-adjusted quarter-on-quarter terms. Imports contracted unexpectedly sharply, dropping 8.7 percent in seasonally-adjusted quarter-on-quarter terms. This drop in imports was the first quarterly fall in imports since the first quarter of 2009 and is likely the result in part of therecent weakness in exports, as weaker exports tend to reduce the need to import capital and intermediate inputs (see July 2012 IEQ).
Growth on the production side was driven by the manufacturing sector…
On the production side, the manufacturing sector performed strongly, while growth in the service sectors moderated (Figure 8). Growth in the manufacturing sector picked up to 6.4 per cent year-on-year in the third quarter, compared to 5.5 per cent year-on-year in the second quarter. This was supported by strong performances from domestic-oriented sectors such as food, beverages and tobacco (up 10.4 percent year-on-year) and fertilizers, chemicals and rubber (up 15.4 percent year-on-year). Oil and gas manufacturing, however, fell by 5.0 percent year on year. The mining sector, excluding oil and gas, grew by only 4.6 percent year-on-year and contracted in sequential terms (-3.5 percent qoq sa).
…while the performance of the services sector was mixed
Growth in the services sectors moderated somewhat but was still solid at 7.3 percent year-on-year, compared to 8.1 year-on-year in the second quarter. Communications andtransport remained one of the strongest of the service sectors (up 10.5 per cent year-on-year). There was some moderation in the trade, hotel and restaurant sector in the quarter.
High frequency indicators are consistent with continued robust growth
High frequency indicators are broadly consistent with continued robust growth. There has been sustained strong growth in motor vehicle sales. Motor cycle sales, which have been under pressure since the start of the year, stabilized in September and October. On the production side, cement sales and industrial production have shown some signs of improvement in recent months, although the data remain noisy.
I n d o n e s i a E c o n o m i c Q u a r t e r l y P o l i c i e s i n f o c u s
THE WORLD BANK | BANK DUNIA December 20124
Figure 7: Private consumption and investment continue to be the key drivers of growth (year-on-year real GDP growth, percent)
Figure 8: Manufacturing continued to perform strongly in the third quarter while services growth moderated (year-on-year services and manufacturing GDP growth, percent)
Source: BPS and World Bank staff calculations Source: BPS and World Bank staff calculations
GDP growth is forecast at 6.1 percent for 2012 and 6.3 percent for 2013…
The World Bank’s projection for GDP growth in 2012 is 6.1 percent (Table 3), unchangedfrom the October IEQ. The recent composition of growth has differed somewhat from previous expectations. Domestic demand has been weaker than expected due to a large fall in government consumption and a slight fall in investment in the third quarter, but net exports exceeded expectations with an even larger correction in imports than anticipated. The outlook for 2013 is for a slight rise in growth to 6.3 percent, as the external environment firms. This is the same as in the October IEQ, with a slightly stronger outlook for consumption offset by a slightly weaker net exports outlook.
…but risks remain skewed to the downside
The risks to the outlook continue to be skewed to the downside and in the event of more severe adverse shocks to international financial markets, commodity prices or external demand, domestic growth could come in considerably below the baseline projections. Furthermore, while private consumption is proving resilient, investment could yet be impacted by lower commodity prices and a more uncertain regulatory environment, as discussed further below. In addition, there has been a notable buildup in inventories as measured in the national accounts in recent quarters (Figure 9), which could indicate weaker than anticipated demand. Should this impact on production in coming quarters as businesses draw down existing high stock levels, this could drag materially on growth.
Figure 9: Inventory levels appear elevated (quarterly change in stocks and rolling 4-quarter sum of change in stocks, current prices, percent of GDP)
Source: BPS and World Bank staff calculations
-4
-2
0
2
4
6
8
10
-4
-2
0
2
4
6
8
10
Sep-09 Sep-10 Sep-11 Sep-12
Private cons. Investment Gov cons.
Net Exports Discrepancy GDPPercent Percent
0
2
4
6
8
10
0
2
4
6
8
10
Sep-05 Sep-07 Sep-09 Sep-11
Manufacturing
Percent
Services
Percent
-10
0
10
20
30
-4
0
4
8
12
Sep-02 Sep-04 Sep-06 Sep-08 Sep-10 Sep-12
4-quarter sum of change in stocks (RHS)
Change in stocks (LHS)
Percent of GDP Percent of GDP
I n d o n e s i a E c o n o m i c Q u a r t e r l y P o l i c i e s i n f o c u s
THE WORLD BANK | BANK DUNIA December 20125
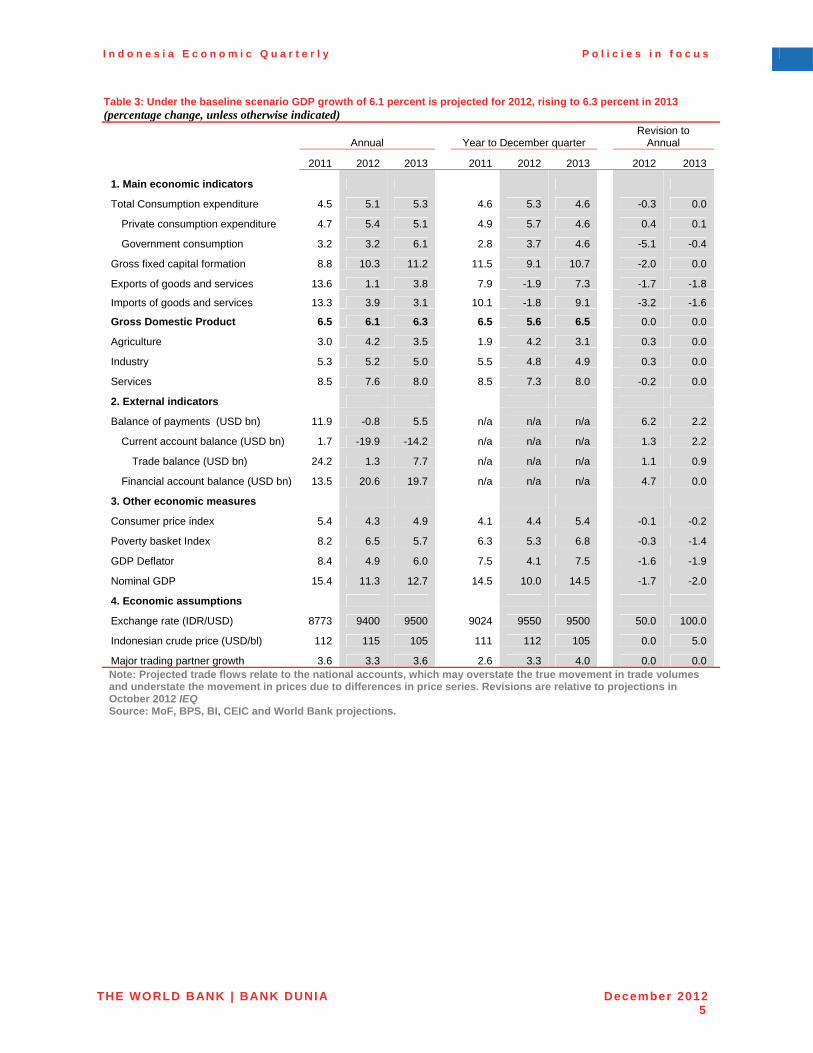
Table 3: Under the baseline scenario GDP growth of 6.1 percent is projected for 2012, rising to 6.3 percent in 2013 (percentage change, unless otherwise indicated)
Annual Year to December quarter Revision to
Annual
2011 2012 2013 2011 2012 2013 2012 2013
1. Main economic indicators
Total Consumption expenditure 4.5 5.1 5.3 4.6 5.3 4.6 -0.3 0.0
Private consumption expenditure 4.7 5.4 5.1 4.9 5.7 4.6 0.4 0.1
Government consumption 3.2 3.2 6.1 2.8 3.7 4.6 -5.1 -0.4
Gross fixed capital formation 8.8 10.3 11.2 11.5 9.1 10.7 -2.0 0.0
Exports of goods and services 13.6 1.1 3.8 7.9 -1.9 7.3 -1.7 -1.8
Imports of goods and services 13.3 3.9 3.1 10.1 -1.8 9.1 -3.2 -1.6
Gross Domestic Product 6.5 6.1 6.3 6.5 5.6 6.5 0.0 0.0
Agriculture 3.0 4.2 3.5 1.9 4.2 3.1 0.3 0.0
Industry 5.3 5.2 5.0 5.5 4.8 4.9 0.3 0.0
Services 8.5 7.6 8.0 8.5 7.3 8.0 -0.2 0.0
2. External indicators
Balance of payments (USD bn) 11.9 -0.8 5.5 n/a n/a n/a 6.2 2.2
Current account balance (USD bn) 1.7 -19.9 -14.2 n/a n/a n/a 1.3 2.2
Trade balance (USD bn) 24.2 1.3 7.7 n/a n/a n/a 1.1 0.9
Financial account balance (USD bn) 13.5 20.6 19.7 n/a n/a n/a 4.7 0.0
3. Other economic measures
Consumer price index 5.4 4.3 4.9 4.1 4.4 5.4 -0.1 -0.2
Poverty basket Index 8.2 6.5 5.7 6.3 5.3 6.8 -0.3 -1.4
GDP Deflator 8.4 4.9 6.0 7.5 4.1 7.5 -1.6 -1.9
Nominal GDP 15.4 11.3 12.7 14.5 10.0 14.5 -1.7 -2.0
4. Economic assumptions
Exchange rate (IDR/USD) 8773 9400 9500 9024 9550 9500 50.0 100.0
Indonesian crude price (USD/bl) 112 115 105 111 112 105 0.0 5.0
Major trading partner growth 3.6 3.3 3.6 2.6 3.3 4.0 0.0 0.0 Note: Projected trade flows relate to the national accounts, which may overstate the true movement in trade volumes and understate the movement in prices due to differences in price series. Revisions are relative to projections in October 2012 IEQ Source: MoF, BPS, BI, CEIC and World Bank projections.
I n d o n e s i a E c o n o m i c Q u a r t e r l y P o l i c i e s i n f o c u s
THE WORLD BANK | BANK DUNIA December 20126
3. Exports are still under pressure but capital inflows have been strong
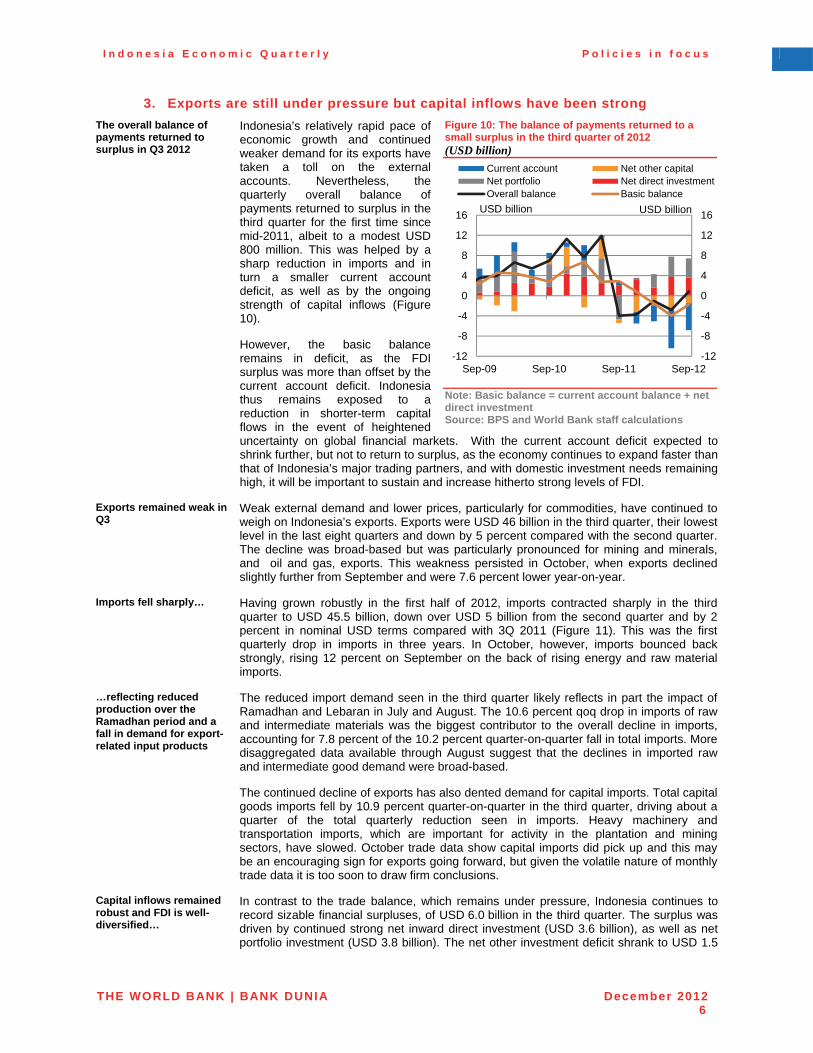
The overall balance of payments returned to surplus in Q3 2012
Indonesia’s relatively rapid pace of economic growth and continued weaker demand for its exports have taken a toll on the external accounts. Nevertheless, the quarterly overall balance of payments returned to surplus in the third quarter for the first time since mid-2011, albeit to a modest USD 800 million. This was helped by a sharp reduction in imports and in turn a smaller current account deficit, as well as by the ongoing strength of capital inflows (Figure 10). However, the basic balance remains in deficit, as the FDI surplus was more than offset by the current account deficit. Indonesia thus remains exposed to a reduction in shorter-term capital flows in the event of heightened uncertainty on global financial markets. With the current account deficit expected to shrink further, but not to return to surplus, as the economy continues to expand faster than that of Indonesia’s major trading partners, and with domestic investment needs remaining high, it will be important to sustain and increase hitherto strong levels of FDI.
Figure 10: The balance of payments returned to a small surplus in the third quarter of 2012 (USD billion)
Note: Basic balance = current account balance + net direct investment Source: BPS and World Bank staff calculations
Exports remained weak in Q3
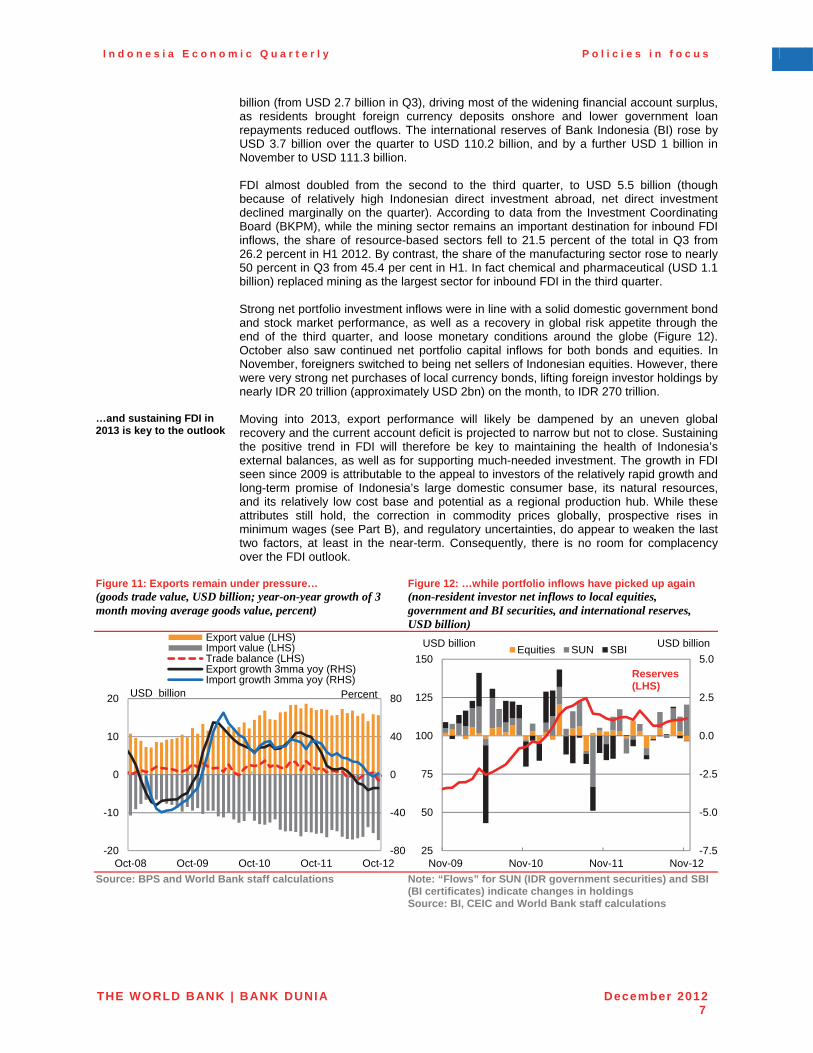
Weak external demand and lower prices, particularly for commodities, have continued to weigh on Indonesia’s exports. Exports were USD 46 billion in the third quarter, their lowest level in the last eight quarters and down by 5 percent compared with the second quarter. The decline was broad-based but was particularly pronounced for mining and minerals, and oil and gas, exports. This weakness persisted in October, when exports declined slightly further from September and were 7.6 percent lower year-on-year.
Imports fell sharply… Having grown robustly in the first half of 2012, imports contracted sharply in the third quarter to USD 45.5 billion, down over USD 5 billion from the second quarter and by 2 percent in nominal USD terms compared with 3Q 2011 (Figure 11). This was the first quarterly drop in imports in three years. In October, however, imports bounced back strongly, rising 12 percent on September on the back of rising energy and raw material imports.
…reflecting reduced production over the Ramadhan period and a fall in demand for export-related input products
The reduced import demand seen in the third quarter likely reflects in part the impact of Ramadhan and Lebaran in July and August. The 10.6 percent qoq drop in imports of raw and intermediate materials was the biggest contributor to the overall decline in imports, accounting for 7.8 percent of the 10.2 percent quarter-on-quarter fall in total imports. More disaggregated data available through August suggest that the declines in imported raw and intermediate good demand were broad-based. The continued decline of exports has also dented demand for capital imports. Total capital goods imports fell by 10.9 percent quarter-on-quarter in the third quarter, driving about a quarter of the total quarterly reduction seen in imports. Heavy machinery and transportation imports, which are important for activity in the plantation and mining sectors, have slowed. October trade data show capital imports did pick up and this may be an encouraging sign for exports going forward, but given the volatile nature of monthly trade data it is too soon to draw firm conclusions.
Capital inflows remained robust and FDI is well-diversified…
In contrast to the trade balance, which remains under pressure, Indonesia continues to record sizable financial surpluses, of USD 6.0 billion in the third quarter. The surplus was driven by continued strong net inward direct investment (USD 3.6 billion), as well as netportfolio investment (USD 3.8 billion). The net other investment deficit shrank to USD 1.5
-12
-8
-4
0
4
8
12
16
-12
-8
-4
0
4
8
12
16
Sep-09 Sep-10 Sep-11 Sep-12
Current account Net other capitalNet portfolio Net direct investmentOverall balance Basic balance
USD billion USD billion
I n d o n e s i a E c o n o m i c Q u a r t e r l y P o l i c i e s i n f o c u s
THE WORLD BANK | BANK DUNIA December 20127
billion (from USD 2.7 billion in Q3), driving most of the widening financial account surplus, as residents brought foreign currency deposits onshore and lower government loan repayments reduced outflows. The international reserves of Bank Indonesia (BI) rose by USD 3.7 billion over the quarter to USD 110.2 billion, and by a further USD 1 billion in November to USD 111.3 billion. FDI almost doubled from the second to the third quarter, to USD 5.5 billion (though because of relatively high Indonesian direct investment abroad, net direct investment declined marginally on the quarter). According to data from the Investment Coordinating Board (BKPM), while the mining sector remains an important destination for inbound FDI inflows, the share of resource-based sectors fell to 21.5 percent of the total in Q3 from 26.2 percent in H1 2012. By contrast, the share of the manufacturing sector rose to nearly 50 percent in Q3 from 45.4 per cent in H1. In fact chemical and pharmaceutical (USD 1.1 billion) replaced mining as the largest sector for inbound FDI in the third quarter. Strong net portfolio investment inflows were in line with a solid domestic government bond and stock market performance, as well as a recovery in global risk appetite through the end of the third quarter, and loose monetary conditions around the globe (Figure 12). October also saw continued net portfolio capital inflows for both bonds and equities. In November, foreigners switched to being net sellers of Indonesian equities. However, there were very strong net purchases of local currency bonds, lifting foreign investor holdings by nearly IDR 20 trillion (approximately USD 2bn) on the month, to IDR 270 trillion.
…and sustaining FDI in 2013 is key to the outlook
Moving into 2013, export performance will likely be dampened by an uneven global recovery and the current account deficit is projected to narrow but not to close. Sustaining the positive trend in FDI will therefore be key to maintaining the health of Indonesia’s external balances, as well as for supporting much-needed investment. The growth in FDI seen since 2009 is attributable to the appeal to investors of the relatively rapid growth and long-term promise of Indonesia’s large domestic consumer base, its natural resources, and its relatively low cost base and potential as a regional production hub. While these attributes still hold, the correction in commodity prices globally, prospective rises in minimum wages (see Part B), and regulatory uncertainties, do appear to weaken the last two factors, at least in the near-term. Consequently, there is no room for complacency over the FDI outlook.
Figure 11: Exports remain under pressure… (goods trade value, USD billion; year-on-year growth of 3 month moving average goods value, percent)
Figure 12: …while portfolio inflows have picked up again (non-resident investor net inflows to local equities, government and BI securities, and international reserves, USD billion)
Source: BPS and World Bank staff calculations Note: “Flows” for SUN (IDR government securities) and SBI (BI certificates) indicate changes in holdings Source: BI, CEIC and World Bank staff calculations
-80
-40
0
40
80
-20
-10
0
10
20
Oct-08 Oct-09 Oct-10 Oct-11 Oct-12
Export value (LHS)Import value (LHS)Trade balance (LHS)Export growth 3mma yoy (RHS)Import growth 3mma yoy (RHS)
USD billion Percent
-7.5
-5.0
-2.5
0.0
2.5
5.0
25
50
75
100
125
150
Nov-09 Nov-10 Nov-11 Nov-12
Equities SUN SBIUSD billion
Reserves (LHS)
USD billion
I n d o n e s i a E c o n o m i c Q u a r t e r l y P o l i c i e s i n f o c u s
THE WORLD BANK | BANK DUNIA December 20128
4. Inflation softness continues but cost-push pressures emerge for 2013
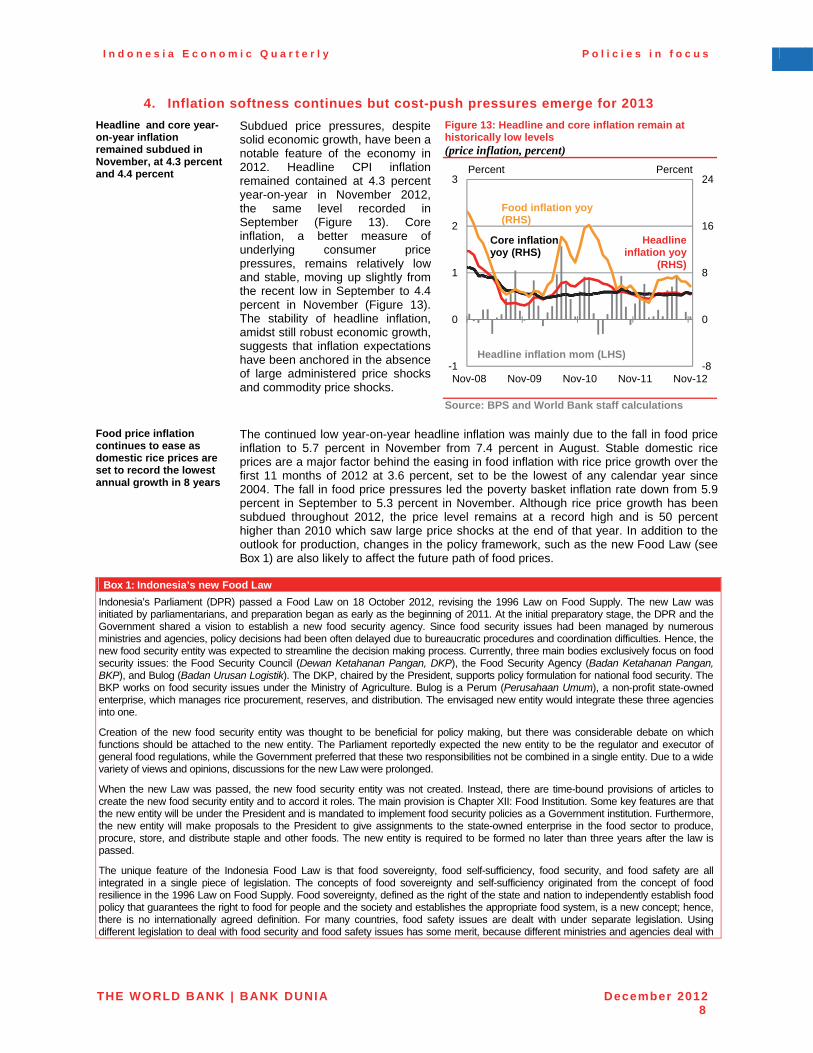
Headline and core year-on-year inflation remained subdued in November, at 4.3 percent and 4.4 percent
Subdued price pressures, despite solid economic growth, have been a notable feature of the economy in 2012. Headline CPI inflation remained contained at 4.3 percent year-on-year in November 2012, the same level recorded in September (Figure 13). Core inflation, a better measure of underlying consumer price pressures, remains relatively low and stable, moving up slightly from the recent low in September to 4.4 percent in November (Figure 13). The stability of headline inflation, amidst still robust economic growth, suggests that inflation expectations have been anchored in the absence of large administered price shocks and commodity price shocks.
Figure 13: Headline and core inflation remain at historically low levels (price inflation, percent)
Source: BPS and World Bank staff calculations
Food price inflation continues to ease as domestic rice prices are set to record the lowest annual growth in 8 years
The continued low year-on-year headline inflation was mainly due to the fall in food price inflation to 5.7 percent in November from 7.4 percent in August. Stable domestic rice prices are a major factor behind the easing in food inflation with rice price growth over the first 11 months of 2012 at 3.6 percent, set to be the lowest of any calendar year since 2004. The fall in food price pressures led the poverty basket inflation rate down from 5.9 percent in September to 5.3 percent in November. Although rice price growth has been subdued throughout 2012, the price level remains at a record high and is 50 percent higher than 2010 which saw large price shocks at the end of that year. In addition to the outlook for production, changes in the policy framework, such as the new Food Law (seeBox 1) are also likely to affect the future path of food prices.
Box 1: Indonesia’s new Food Law
Indonesia’s Parliament (DPR) passed a Food Law on 18 October 2012, revising the 1996 Law on Food Supply. The new Law was initiated by parliamentarians, and preparation began as early as the beginning of 2011. At the initial preparatory stage, the DPR and the Government shared a vision to establish a new food security agency. Since food security issues had been managed by numerous ministries and agencies, policy decisions had been often delayed due to bureaucratic procedures and coordination difficulties. Hence, the new food security entity was expected to streamline the decision making process. Currently, three main bodies exclusively focus on food security issues: the Food Security Council (Dewan Ketahanan Pangan, DKP), the Food Security Agency (Badan Ketahanan Pangan, BKP), and Bulog (Badan Urusan Logistik). The DKP, chaired by the President, supports policy formulation for national food security. The BKP works on food security issues under the Ministry of Agriculture. Bulog is a Perum (Perusahaan Umum), a non-profit state-owned enterprise, which manages rice procurement, reserves, and distribution. The envisaged new entity would integrate these three agencies into one.
Creation of the new food security entity was thought to be beneficial for policy making, but there was considerable debate on which functions should be attached to the new entity. The Parliament reportedly expected the new entity to be the regulator and executor of general food regulations, while the Government preferred that these two responsibilities not be combined in a single entity. Due to a wide variety of views and opinions, discussions for the new Law were prolonged.
When the new Law was passed, the new food security entity was not created. Instead, there are time-bound provisions of articles to create the new food security entity and to accord it roles. The main provision is Chapter XII: Food Institution. Some key features are that the new entity will be under the President and is mandated to implement food security policies as a Government institution. Furthermore, the new entity will make proposals to the President to give assignments to the state-owned enterprise in the food sector to produce, procure, store, and distribute staple and other foods. The new entity is required to be formed no later than three years after the law is passed.
The unique feature of the Indonesia Food Law is that food sovereignty, food self-sufficiency, food security, and food safety are all integrated in a single piece of legislation. The concepts of food sovereignty and self-sufficiency originated from the concept of food resilience in the 1996 Law on Food Supply. Food sovereignty, defined as the right of the state and nation to independently establish food policy that guarantees the right to food for people and the society and establishes the appropriate food system, is a new concept; hence, there is no internationally agreed definition. For many countries, food safety issues are dealt with under separate legislation. Using different legislation to deal with food security and food safety issues has some merit, because different ministries and agencies deal with
-8
0
8
16
24
-1
0
1
2
3
Nov-08 Nov-09 Nov-10 Nov-11 Nov-12
Core inflation yoy (RHS)
Headline inflation yoy
(RHS)
Headline inflation mom (LHS)
Percent Percent
Food inflation yoy (RHS)
I n d o n e s i a E c o n o m i c Q u a r t e r l y P o l i c i e s i n f o c u s
THE WORLD BANK | BANK DUNIA December 20129
food security and food safety. The new Law’s strong focus on food safety is inherited from the 1996 Law on Food Supply.
The new Law mandates the Government to intervene significantly in the food market and food sector to achieve self-sufficiency and food security. For example, Article 23 stipulates the Government to manage national food reserves. Article 51 obliges the government to regulate food trading to stabilize staple food supply and prices. Article 55 further mandates the Government to stabilize supply and prices of staple food at the producer and consumer level. This contrasts with the 1996 Law, in which the Government’s involvement for food trade, particularly food imports, is mostly limited to food safety issues.
While it remains to be seen how the legislation will be implemented, these are roles associated with potentially sizable government interventions in the food market for the sake of food security. Consumers’ welfare could be undermined due to higher food prices if there was an attempt to achieve food security and food self-sufficiency through government intervention to limit food trade and increase reserves. In fact, the international experience suggests that increasing agricultural productivity and investment are the keys to achieving sustainable food security.
Note: For more information, see OECD Review of Agricultural Policies: Indonesia 2012 (October 2012)
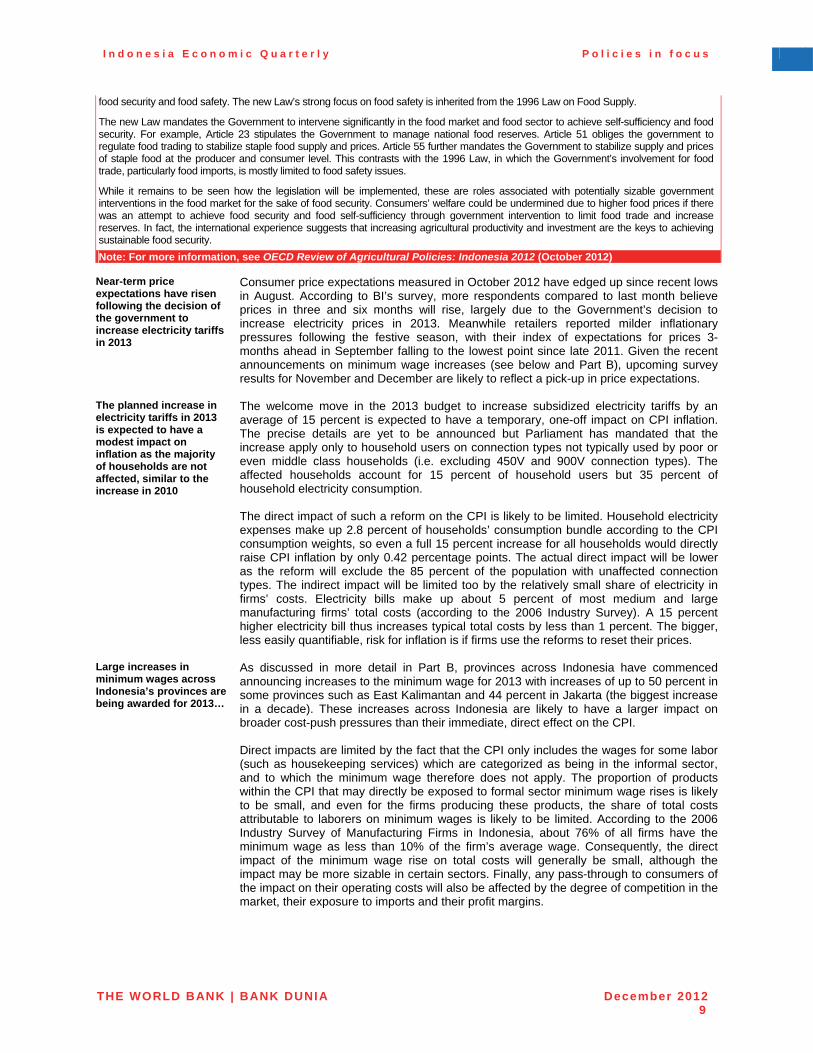
Near-term price expectations have risen following the decision of the government to increase electricity tariffs in 2013
Consumer price expectations measured in October 2012 have edged up since recent lows in August. According to BI’s survey, more respondents compared to last month believe prices in three and six months will rise, largely due to the Government’s decision to increase electricity prices in 2013. Meanwhile retailers reported milder inflationary pressures following the festive season, with their index of expectations for prices 3-months ahead in September falling to the lowest point since late 2011. Given the recent announcements on minimum wage increases (see below and Part B), upcoming survey results for November and December are likely to reflect a pick-up in price expectations.
The planned increase in electricity tariffs in 2013 is expected to have a modest impact on inflation as the majority of households are not affected, similar to the increase in 2010
The welcome move in the 2013 budget to increase subsidized electricity tariffs by an average of 15 percent is expected to have a temporary, one-off impact on CPI inflation. The precise details are yet to be announced but Parliament has mandated that the increase apply only to household users on connection types not typically used by poor or even middle class households (i.e. excluding 450V and 900V connection types). The affected households account for 15 percent of household users but 35 percent of household electricity consumption. The direct impact of such a reform on the CPI is likely to be limited. Household electricity expenses make up 2.8 percent of households’ consumption bundle according to the CPI consumption weights, so even a full 15 percent increase for all households would directly raise CPI inflation by only 0.42 percentage points. The actual direct impact will be lower as the reform will exclude the 85 percent of the population with unaffected connection types. The indirect impact will be limited too by the relatively small share of electricity in firms’ costs. Electricity bills make up about 5 percent of most medium and large manufacturing firms’ total costs (according to the 2006 Industry Survey). A 15 percent higher electricity bill thus increases typical total costs by less than 1 percent. The bigger, less easily quantifiable, risk for inflation is if firms use the reforms to reset their prices.
Large increases in minimum wages across Indonesia’s provinces are being awarded for 2013…
As discussed in more detail in Part B, provinces across Indonesia have commenced announcing increases to the minimum wage for 2013 with increases of up to 50 percent in some provinces such as East Kalimantan and 44 percent in Jakarta (the biggest increase in a decade). These increases across Indonesia are likely to have a larger impact on broader cost-push pressures than their immediate, direct effect on the CPI. Direct impacts are limited by the fact that the CPI only includes the wages for some labor (such as housekeeping services) which are categorized as being in the informal sector, and to which the minimum wage therefore does not apply. The proportion of products within the CPI that may directly be exposed to formal sector minimum wage rises is likely to be small, and even for the firms producing these products, the share of total costs attributable to laborers on minimum wages is likely to be limited. According to the 2006 Industry Survey of Manufacturing Firms in Indonesia, about 76% of all firms have the minimum wage as less than 10% of the firm’s average wage. Consequently, the direct impact of the minimum wage rise on total costs will generally be small, although the impact may be more sizable in certain sectors. Finally, any pass-through to consumers of the impact on their operating costs will also be affected by the degree of competition in the market, their exposure to imports and their profit margins.
I n d o n e s i a E c o n o m i c Q u a r t e r l y P o l i c i e s i n f o c u s
THE WORLD BANK | BANK DUNIA December 201210
…and there is a risk these rises feed into increased wages across the informal and formal sectors, causing cost-push inflation
The largest risk to inflation comes from increased wage demands of employees across the informal and formal sectors, should well-publicized minimum wage increases filter into wage-setting in the rest of the economy. As highlighted in Part B, a 10 percent increase in the minimum wage is associated with a 3 percent increase in average wages for all employees in the same year. Should general wage levels respond in a similar fashion to prior minimum wage increases, there may be a more pervasive impact on business costs, leading to upward retail price adjustments. In addition, the large rise in the purchasing power of those employees who benefit from significant pay increases could boost demand for retail consumables such as food, processed food, clothing and tobacco.
CPI inflation is projected to ease to 4.4 percent year-on-year in the final quarter of 2012, around the center of BI’s target range of 4.5 ± 1 percent, and to move slightly higher in 2013 where the upside risks have increased
With only one month remaining to be reported for CPI inflation in 2012, the final quarter is likely to see inflation easing relative to the previous quarter to 4.4 percent year-on-year, reflecting falling food inflation on the back of low rice price growth and slower consumer credit throughout 2012. The forecast will place year-end CPI inflation in 2012 around the center of Bank Indonesia’s target range of 4.5 ± 1 percent. CPI inflation for whole-year 2012 is projected to be 4.3 percent. In 2013, inflation is projected to move up to 4.9 percent for the year as a whole, on the back of strong consumer demand, still high levels of consumer credit growth and ongoing pass-through from the depreciation to date of the exchange rate. Box 2 provides more detail on the potential cost-push impact of the exchange rate on inflation. Minimum wage and electricity tariff rises add upside risks to the inflation outlook. The slated increase in administered electricity tariffs will lead to a measureable direct impact on inflation in 2013 with the composition and staging of its introduction key in determining the overall inflationary impact on the CPI and GDP deflator in 2013. At this stage, awaiting full details of the implementation of the electricity tariff increases, its impact is not included in these baseline forecasts. Poverty basket inflation forecasts are lower than in the October IEQ, at5.3 percent year-on-year in Q4 2012 and 6.8 percent year-on-year in Q4 2013.
GDP deflator growth has fallen to lows last seen in 1999 as price growth eased across most sectors
In the third quarter, for the first time in over 8 years, the broad level of prices in the economy, as measured by the GDP deflator, rose at a slower pace than CPI inflation. GDP deflator inflation grew by 3.5 percent year-on-year in Q3 2012, the slowest rate since 1999. Most sectors saw a slowdown in inflation or were flat, with the largest falls in the services sector which dropped from 15 percent year-on-year in Q2 to 1.8 percent year-on-year in Q3. Mining sector inflation fell from 13.6 percent to 7.8 percent year-on-year overthe same period on the back falling commodity prices. Following two consecutively low quarters of growth, GDP deflator inflation in 2012 is projected to only grow by 4.9 percent for the year as a whole, the slowest since the series commenced in 1993, contributing to the notable reduction in nominal GDP growth highlighted above. In 2013, annual GDP deflator growth is expected to pick up from its current lows, reaching 6.0 percent on the back of faster economic growth and continued strong credit conditions, but remaining well below the 14 percent average seen in the 4 years prior to the global financial crisis.
I n d o n e s i a E c o n o m i c Q u a r t e r l y P o l i c i e s i n f o c u s
THE WORLD BANK | BANK DUNIA December 201211
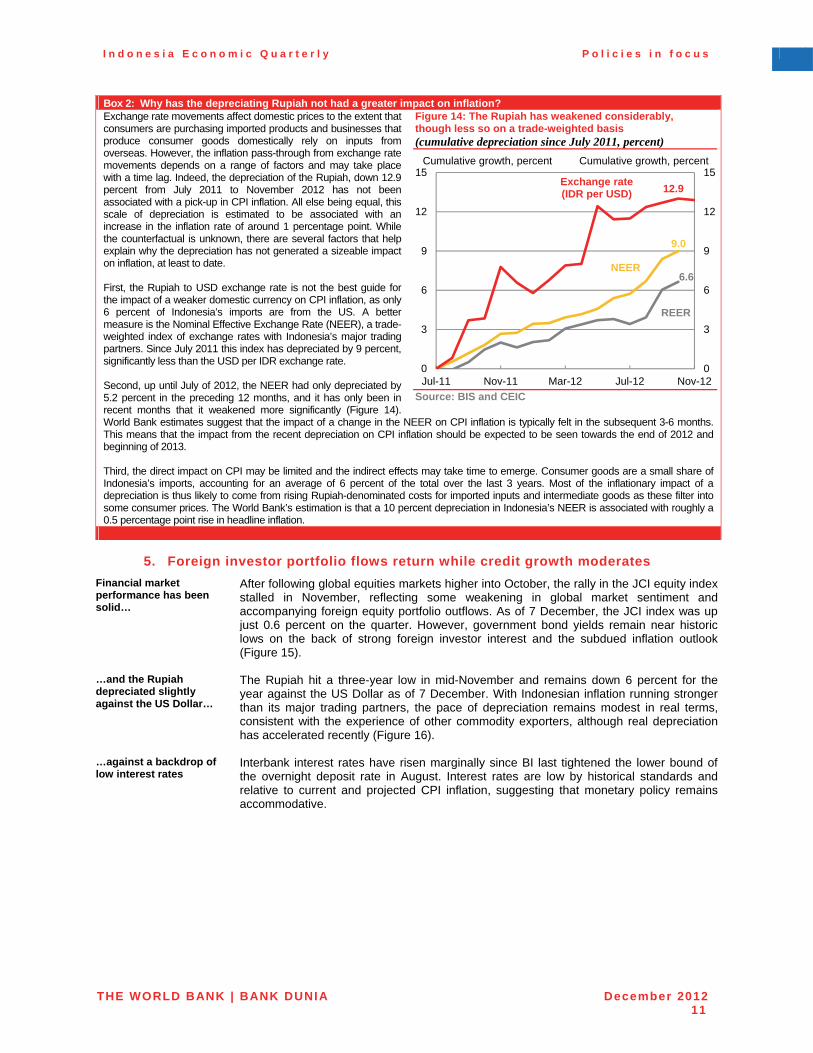
Box 2: Why has the depreciating Rupiah not had a greater impact on inflation?Exchange rate movements affect domestic prices to the extent that consumers are purchasing imported products and businesses that produce consumer goods domestically rely on inputs from overseas. However, the inflation pass-through from exchange rate movements depends on a range of factors and may take place with a time lag. Indeed, the depreciation of the Rupiah, down 12.9 percent from July 2011 to November 2012 has not been associated with a pick-up in CPI inflation. All else being equal, this scale of depreciation is estimated to be associated with an increase in the inflation rate of around 1 percentage point. While the counterfactual is unknown, there are several factors that help explain why the depreciation has not generated a sizeable impact on inflation, at least to date. First, the Rupiah to USD exchange rate is not the best guide for the impact of a weaker domestic currency on CPI inflation, as only 6 percent of Indonesia’s imports are from the US. A better measure is the Nominal Effective Exchange Rate (NEER), a trade-weighted index of exchange rates with Indonesia’s major trading partners. Since July 2011 this index has depreciated by 9 percent, significantly less than the USD per IDR exchange rate. Second, up until July of 2012, the NEER had only depreciated by 5.2 percent in the preceding 12 months, and it has only been in recent months that it weakened more significantly (Figure 14). World Bank estimates suggest that the impact of a change in the NEER on CPI inflation is typically felt in the subsequent 3-6 months. This means that the impact from the recent depreciation on CPI inflation should be expected to be seen towards the end of 2012 and beginning of 2013. Third, the direct impact on CPI may be limited and the indirect effects may take time to emerge. Consumer goods are a small share of Indonesia’s imports, accounting for an average of 6 percent of the total over the last 3 years. Most of the inflationary impact of a depreciation is thus likely to come from rising Rupiah-denominated costs for imported inputs and intermediate goods as these filter into some consumer prices. The World Bank’s estimation is that a 10 percent depreciation in Indonesia’s NEER is associated with roughly a 0.5 percentage point rise in headline inflation.
Figure 14: The Rupiah has weakened considerably, though less so on a trade-weighted basis (cumulative depreciation since July 2011, percent)
Source: BIS and CEIC
5. Foreign investor portfolio flows return while credit growth moderates
Financial market performance has been solid…
After following global equities markets higher into October, the rally in the JCI equity index stalled in November, reflecting some weakening in global market sentiment and accompanying foreign equity portfolio outflows. As of 7 December, the JCI index was up just 0.6 percent on the quarter. However, government bond yields remain near historic lows on the back of strong foreign investor interest and the subdued inflation outlook(Figure 15).
…and the Rupiah depreciated slightly against the US Dollar…
The Rupiah hit a three-year low in mid-November and remains down 6 percent for the year against the US Dollar as of 7 December. With Indonesian inflation running stronger than its major trading partners, the pace of depreciation remains modest in real terms, consistent with the experience of other commodity exporters, although real depreciation has accelerated recently (Figure 16).
…against a backdrop of low interest rates
Interbank interest rates have risen marginally since BI last tightened the lower bound of the overnight deposit rate in August. Interest rates are low by historical standards and relative to current and projected CPI inflation, suggesting that monetary policy remains accommodative.
9.0
6.6
12.9
0
3
6
9
12
15
0
3
6
9
12
15
Jul-11 Nov-11 Mar-12 Jul-12 Nov-12
Cumulative growth, percent Cumulative growth, percent
Exchange rate (IDR per USD)
NEER
REER
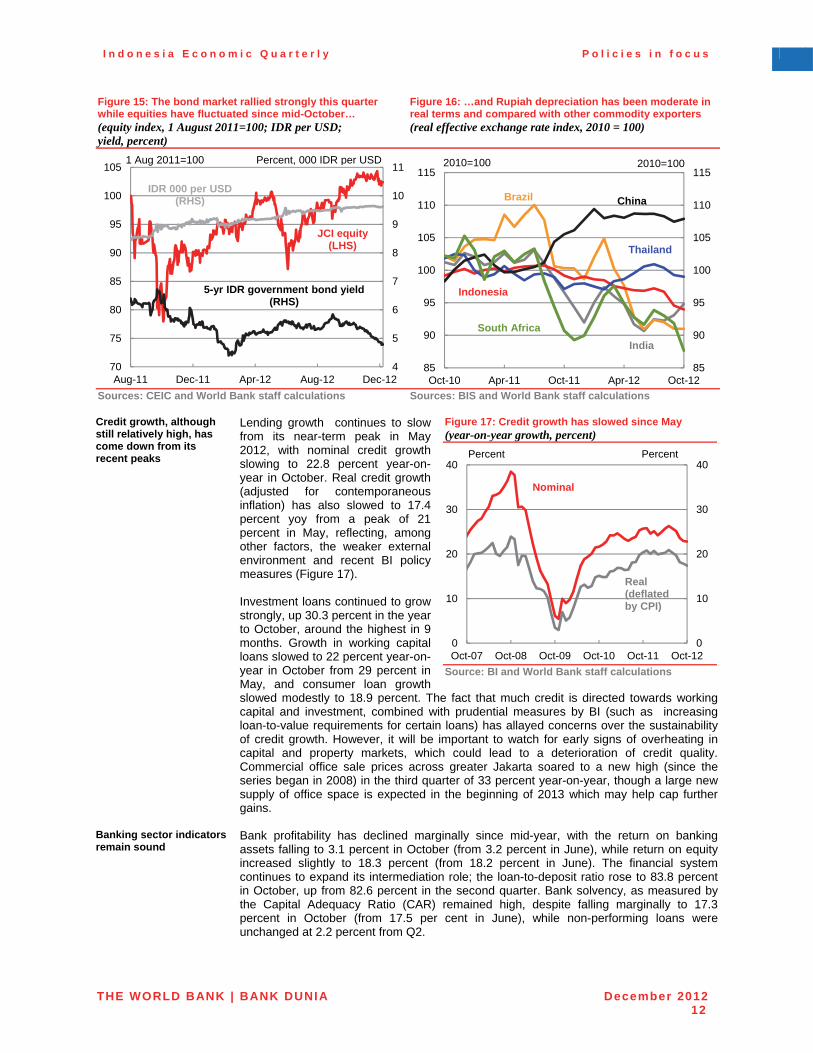
I n d o n e s i a E c o n o m i c Q u a r t e r l y P o l i c i e s i n f o c u s
THE WORLD BANK | BANK DUNIA December 201212
Figure 15: The bond market rallied strongly this quarter while equities have fluctuated since mid-October… (equity index, 1 August 2011=100; IDR per USD; yield, percent)
Figure 16: …and Rupiah depreciation has been moderate in real terms and compared with other commodity exporters (real effective exchange rate index, 2010 = 100)
Sources: CEIC and World Bank staff calculations Sources: BIS and World Bank staff calculations
Credit growth, although still relatively high, has come down from its recent peaks
Lending growth continues to slow from its near-term peak in May 2012, with nominal credit growth slowing to 22.8 percent year-on-year in October. Real credit growth (adjusted for contemporaneous inflation) has also slowed to 17.4 percent yoy from a peak of 21 percent in May, reflecting, among other factors, the weaker external environment and recent BI policy measures (Figure 17). Investment loans continued to grow strongly, up 30.3 percent in the year to October, around the highest in 9 months. Growth in working capital loans slowed to 22 percent year-on-year in October from 29 percent in May, and consumer loan growth slowed modestly to 18.9 percent. The fact that much credit is directed towards working capital and investment, combined with prudential measures by BI (such as increasing loan-to-value requirements for certain loans) has allayed concerns over the sustainability of credit growth. However, it will be important to watch for early signs of overheating in capital and property markets, which could lead to a deterioration of credit quality.Commercial office sale prices across greater Jakarta soared to a new high (since the series began in 2008) in the third quarter of 33 percent year-on-year, though a large new supply of office space is expected in the beginning of 2013 which may help cap further gains.
Figure 17: Credit growth has slowed since May (year-on-year growth, percent)
Source: BI and World Bank staff calculations
Banking sector indicators remain sound
Bank profitability has declined marginally since mid-year, with the return on banking assets falling to 3.1 percent in October (from 3.2 percent in June), while return on equity increased slightly to 18.3 percent (from 18.2 percent in June). The financial system continues to expand its intermediation role; the loan-to-deposit ratio rose to 83.8 percentin October, up from 82.6 percent in the second quarter. Bank solvency, as measured by the Capital Adequacy Ratio (CAR) remained high, despite falling marginally to 17.3 percent in October (from 17.5 per cent in June), while non-performing loans were unchanged at 2.2 percent from Q2.
4
5
6
7
8
9
10
11
70
75
80
85
90
95
100
105
Aug-11 Dec-11 Apr-12 Aug-12 Dec-12
1 Aug 2011=100 Percent, 000 IDR per USD
IDR 000 per USD (RHS)
JCI equity(LHS)
5-yr IDR government bond yield (RHS)
85
90
95
100
105
110
115
85
90
95
100
105
110
115
Oct-10 Apr-11 Oct-11 Apr-12 Oct-12
China
India
Indonesia
Thailand
2010=100 2010=100
South Africa
Brazil
0
10
20
30
40
0
10
20
30
40
Oct-07 Oct-08 Oct-09 Oct-10 Oct-11 Oct-12
Percent Percent
Nominal
Real (deflated by CPI)
I n d o n e s i a E c o n o m i c Q u a r t e r l y P o l i c i e s i n f o c u s
THE WORLD BANK | BANK DUNIA December 201213
Corporate profit growth remains strong, except in the mining sector
Strong domestic consumption continues to buoy corporate sector profitability as household purchasing power rises. However, with the outlook for resource sectors remaining subdued, bank and leasing companies have been reducing their exposures to the mining sector in recent months, with year-on-year credit growth to the sector slowing to 20 percent in October, from 50 percent in January.
Box 3: Developments in Indonesia’s corporate governance framework
A number of initiatives currently underway in Indonesia may lead to major enhancements in corporate governance practices in the near future. These enhancements will contribute to financial stability and could boost investor confidence.1
The need for improvement is clear. For example, the 2012 Corporate Governance Watch report, issued by the Asian Corporate Governance Association (ACGA)2 indicated that Indonesia continues to lag behind its neighbours in the area of corporate governance, with Indonesia’s ranking falling back to the last place among the eleven Asian countries surveyed.
As stated by Mr. Mas Achmad Daniri, Chairman of KNKG, the National Committee on Governance3, the challenge for Indonesian companies to address this relatively poor performance is to make corporate governance principles part of their corporate culture, since businesses still tend to follow a compliance or check-list based approach. On the other hand, Mr. Daniri indicated “companies interact with other stakeholders, including regulators. Therefore, it is very important that corporate governance and public governance reform must go hand-in-hand”.4 Major developments in corporate governance have occurred in the past ten years as demonstrated, says Mr. Daniri by the “The Annual Report Award (ARA), an annual initiative started in 2001, [for awarding] improved reporting standards. The annual reporting standard in Indonesia can now be considered on par with international best practices. So far, ARA has attracted about 180 companies, both listed and non-listed companies from the banking and non-banking institutions as well as state-owned enterprises (SOEs), to compete for prestigious awards for the best annual report in various categories”.
As the national producer of global and sector-wide Good Corporate Governance codes with a mandate to propagate the acceptance and application of good corporate governance principles in Indonesia, KNKG has undertaken a major update of the banking Code of Good Corporate Governance which was initially issued in 2004. The updated format is expected to be released in January 2013.
At the regional level, the Indonesian government, together with five other ASEAN member countries (Malaysia, the Philippines, Singapore, Thailand and Vietnam) under the ASEAN Capital Market Forum (ACMF), has agreed to launch and adopt a common questionnaire that will be used for an ASEAN Corporate Governance Scorecard which has been supported by the Asian Development Bank since 2010. This move anticipates the eventual inter-connection of the participating ASEAN stock exchanges. The scorecard may be used not only as a benchmark for listed companies on the regional level but also as an instrument for policy makers to identify weaknesses and enhance the regulatory framework. For example, this scorecard has been the basis of a CG Conference Award in Indonesia organized by the IICD, Indonesia Institute for Corporate Governance Directorship on the 22 November 2012.
On the regulatory level, the Ministry of Finance has issued a new regulation on good corporate governance for insurance companies5 aimed at improving the governance structure and practices of the industry. In addition, as discussed in previous IEQs, OJK (Otoritas Jasa Keuangan), a new integrated supervisory authority, will take over the supervision and regulator function of Bapepam-LK, the current capital market regulator, on 31 December 2012, as well as the banking supervisory functions of Bank Indonesia on 31 December 2013. This new regulatory setup provides an opportunity to scale up the promotion and implementation of good corporate governance practices.
BI announces a number of new banking regulations
On the regulatory front, Bank Indonesia has initiated a number of banking sector reforms intended to support financial system stability, the resilience and competitiveness of banks, and promote intermediation. Among the most significant changes, BI announced the introduction of a multiple licensing regime linking banks' ability to expand banking services to the level of their Tier-1 capital base. The rules will be implemented from March 2013 with a transition period of 3 years for commercial banks and 5 years for regional development banks, and are expected to trigger more consolidation in the banking sector. All banks will also be required to lend at least 20 percent of their portfolios to micro, and small- and medium-scale firms. These lending requirements could impact lending growth as banks adjust to the new regulations. However, the lead time of six years for full implementation should mitigate this, and micro and SME lending is required to reach only 5 percent of total lending by end-2013.
1 OECD Economic Outlook, Volume 2011/2 2 CG Watch 2012: Market Ratings. September 2012, ACGA Ltd 3 www.knkg-indonesia.com 4 Extracts from an interview held in October 2012 with the International Finance Corporation (IFC)
Corporate Governance Team 5 Ministry of Finance regulation No: 152/PMK.010/2012, 3 October 2012
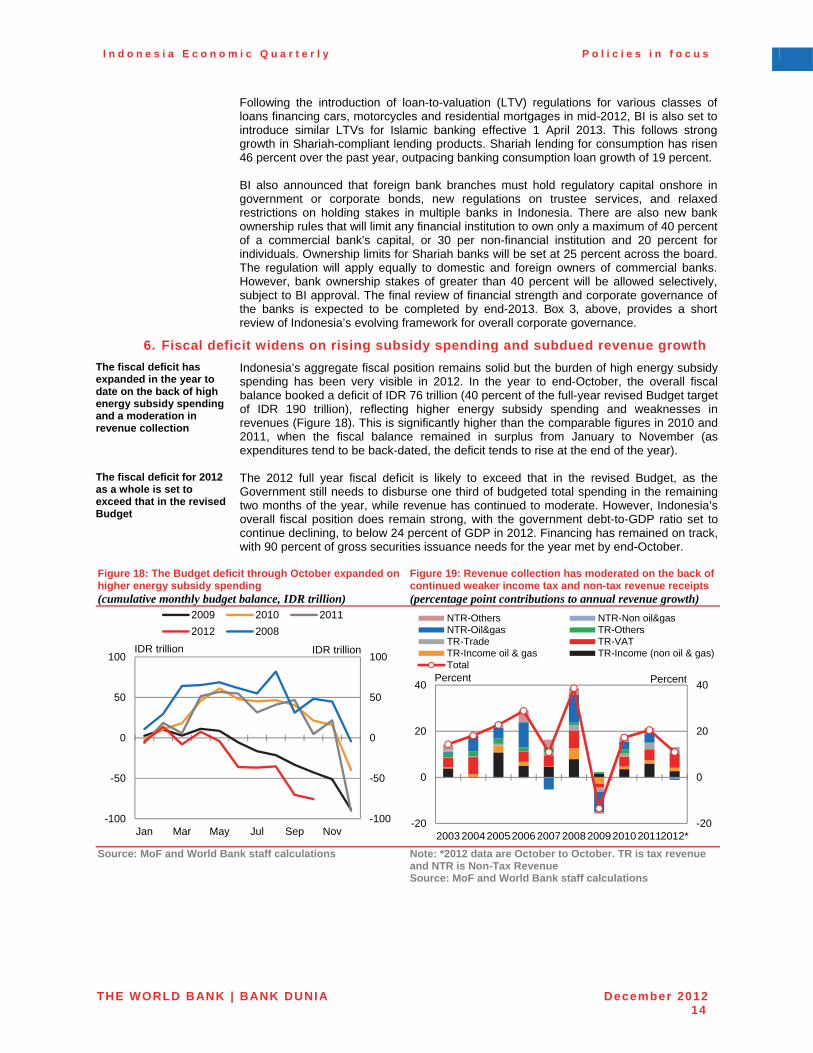
I n d o n e s i a E c o n o m i c Q u a r t e r l y P o l i c i e s i n f o c u s
THE WORLD BANK | BANK DUNIA December 201214
Following the introduction of loan-to-valuation (LTV) regulations for various classes of loans financing cars, motorcycles and residential mortgages in mid-2012, BI is also set to introduce similar LTVs for Islamic banking effective 1 April 2013. This follows strong growth in Shariah-compliant lending products. Shariah lending for consumption has risen 46 percent over the past year, outpacing banking consumption loan growth of 19 percent. BI also announced that foreign bank branches must hold regulatory capital onshore in government or corporate bonds, new regulations on trustee services, and relaxed restrictions on holding stakes in multiple banks in Indonesia. There are also new bank ownership rules that will limit any financial institution to own only a maximum of 40 percentof a commercial bank's capital, or 30 per non-financial institution and 20 percent for individuals. Ownership limits for Shariah banks will be set at 25 percent across the board. The regulation will apply equally to domestic and foreign owners of commercial banks. However, bank ownership stakes of greater than 40 percent will be allowed selectively, subject to BI approval. The final review of financial strength and corporate governance of the banks is expected to be completed by end-2013. Box 3, above, provides a short review of Indonesia’s evolving framework for overall corporate governance.
6. Fiscal deficit widens on rising subsidy spending and subdued revenue growth
The fiscal deficit has expanded in the year to date on the back of high energy subsidy spending and a moderation in revenue collection
Indonesia’s aggregate fiscal position remains solid but the burden of high energy subsidy spending has been very visible in 2012. In the year to end-October, the overall fiscal balance booked a deficit of IDR 76 trillion (40 percent of the full-year revised Budget target of IDR 190 trillion), reflecting higher energy subsidy spending and weaknesses in revenues (Figure 18). This is significantly higher than the comparable figures in 2010 and 2011, when the fiscal balance remained in surplus from January to November (as expenditures tend to be back-dated, the deficit tends to rise at the end of the year).
The fiscal deficit for 2012 as a whole is set to exceed that in the revised Budget
The 2012 full year fiscal deficit is likely to exceed that in the revised Budget, as the Government still needs to disburse one third of budgeted total spending in the remainingtwo months of the year, while revenue has continued to moderate. However, Indonesia’s overall fiscal position does remain strong, with the government debt-to-GDP ratio set to continue declining, to below 24 percent of GDP in 2012. Financing has remained on track, with 90 percent of gross securities issuance needs for the year met by end-October.
Figure 18: The Budget deficit through October expanded on higher energy subsidy spending (cumulative monthly budget balance, IDR trillion)
Figure 19: Revenue collection has moderated on the back of continued weaker income tax and non-tax revenue receipts (percentage point contributions to annual revenue growth)
Source: MoF and World Bank staff calculations Note: *2012 data are October to October. TR is tax revenue and NTR is Non-Tax Revenue Source: MoF and World Bank staff calculations
-100
-50
0
50
100
-100
-50
0
50
100
Jan Mar May Jul Sep Nov
IDR trillion
2009 2010 2011
2012 2008
IDR trillion
-20
0
20
40
-20
0
20
40
2003 200420052006 20072008 2009201020112012*
PercentPercent
NTR-Others NTR-Non oil&gasNTR-Oil&gas TR-OthersTR-Trade TR-VATTR-Income oil & gas TR-Income (non oil & gas)Total
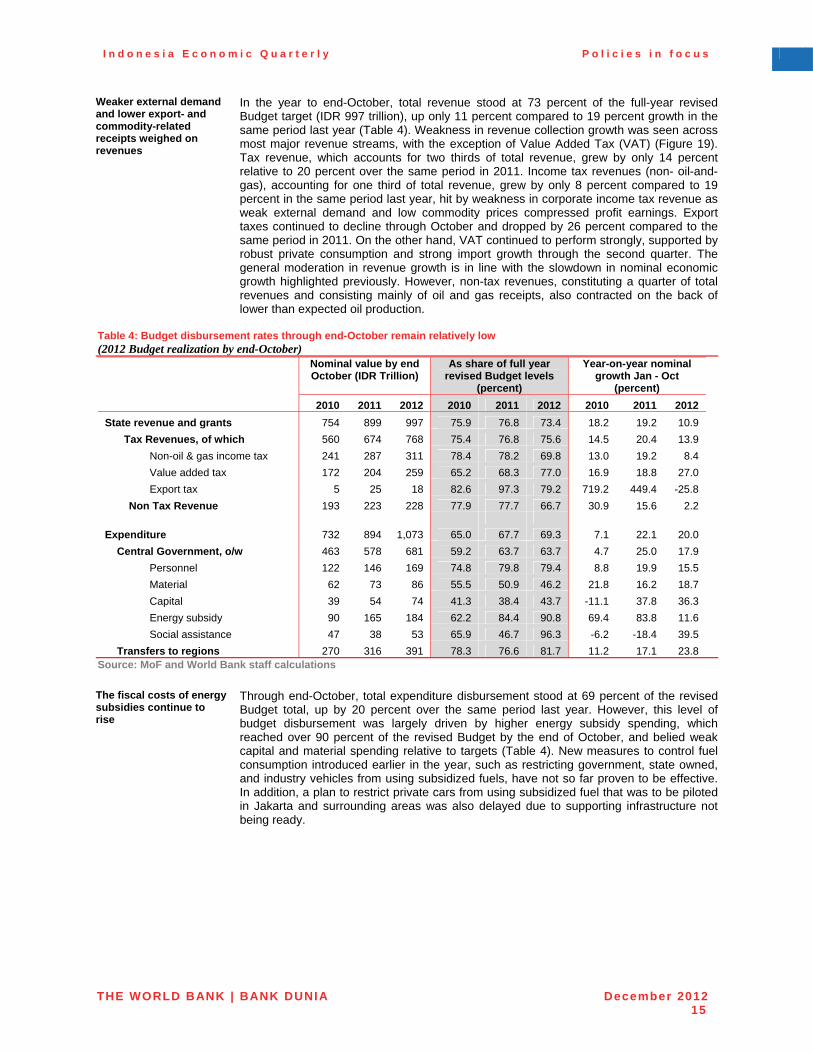
I n d o n e s i a E c o n o m i c Q u a r t e r l y P o l i c i e s i n f o c u s
THE WORLD BANK | BANK DUNIA December 201215
Weaker external demand and lower export- and commodity-related receipts weighed on revenues
In the year to end-October, total revenue stood at 73 percent of the full-year revised Budget target (IDR 997 trillion), up only 11 percent compared to 19 percent growth in the same period last year (Table 4). Weakness in revenue collection growth was seen across most major revenue streams, with the exception of Value Added Tax (VAT) (Figure 19). Tax revenue, which accounts for two thirds of total revenue, grew by only 14 percent relative to 20 percent over the same period in 2011. Income tax revenues (non- oil-and-gas), accounting for one third of total revenue, grew by only 8 percent compared to 19 percent in the same period last year, hit by weakness in corporate income tax revenue as weak external demand and low commodity prices compressed profit earnings. Export taxes continued to decline through October and dropped by 26 percent compared to the same period in 2011. On the other hand, VAT continued to perform strongly, supported by robust private consumption and strong import growth through the second quarter. The general moderation in revenue growth is in line with the slowdown in nominal economic growth highlighted previously. However, non-tax revenues, constituting a quarter of total revenues and consisting mainly of oil and gas receipts, also contracted on the back of lower than expected oil production.
Table 4: Budget disbursement rates through end-October remain relatively low (2012 Budget realization by end-October)
Nominal value by end October (IDR Trillion)
As share of full year revised Budget levels
(percent)
Year-on-year nominal growth Jan - Oct
(percent)
2010 2011 2012 2010 2011 2012 2010 2011 2012
State revenue and grants 754 899 997 75.9 76.8 73.4 18.2 19.2 10.9
Tax Revenues, of which 560 674 768 75.4 76.8 75.6 14.5 20.4 13.9
Non-oil & gas income tax 241 287 311 78.4 78.2 69.8 13.0 19.2 8.4
Value added tax 172 204 259 65.2 68.3 77.0 16.9 18.8 27.0
Export tax 5 25 18 82.6 97.3 79.2 719.2 449.4 -25.8
Non Tax Revenue 193 223 228 77.9 77.7 66.7 30.9 15.6 2.2
Expenditure 732 894 1,073 65.0 67.7 69.3 7.1 22.1 20.0
Central Government, o/w 463 578 681 59.2 63.7 63.7 4.7 25.0 17.9
Personnel 122 146 169 74.8 79.8 79.4 8.8 19.9 15.5
Material 62 73 86 55.5 50.9 46.2 21.8 16.2 18.7
Capital 39 54 74 41.3 38.4 43.7 -11.1 37.8 36.3
Energy subsidy 90 165 184 62.2 84.4 90.8 69.4 83.8 11.6
Social assistance 47 38 53 65.9 46.7 96.3 -6.2 -18.4 39.5
Transfers to regions 270 316 391 78.3 76.6 81.7 11.2 17.1 23.8 Source: MoF and World Bank staff calculations
The fiscal costs of energy subsidies continue to rise
Through end-October, total expenditure disbursement stood at 69 percent of the revised Budget total, up by 20 percent over the same period last year. However, this level of budget disbursement was largely driven by higher energy subsidy spending, which reached over 90 percent of the revised Budget by the end of October, and belied weak capital and material spending relative to targets (Table 4). New measures to control fuel consumption introduced earlier in the year, such as restricting government, state owned, and industry vehicles from using subsidized fuels, have not so far proven to be effective. In addition, a plan to restrict private cars from using subsidized fuel that was to be piloted in Jakarta and surrounding areas was also delayed due to supporting infrastructure not being ready.
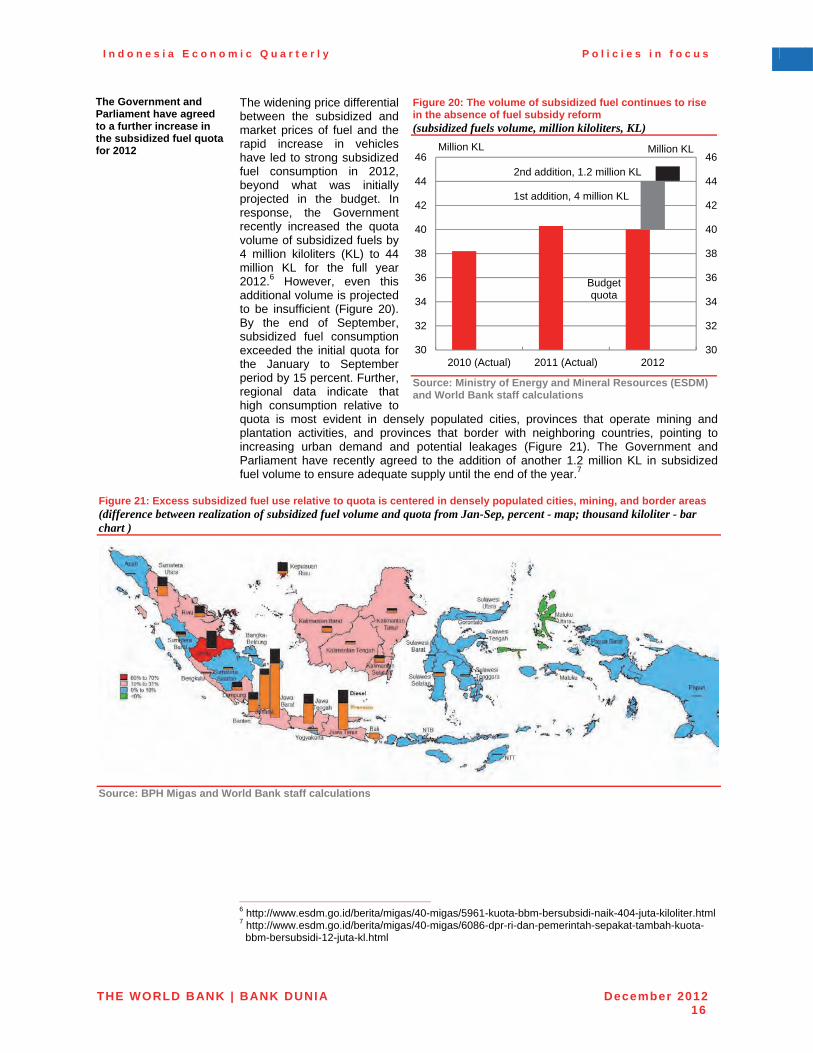
I n d o n e s i a E c o n o m i c Q u a r t e r l y P o l i c i e s i n f o c u s
THE WORLD BANK | BANK DUNIA December 201216
The Government and Parliament have agreed to a further increase in the subsidized fuel quota for 2012
The widening price differential between the subsidized and market prices of fuel and the rapid increase in vehicles have led to strong subsidized fuel consumption in 2012, beyond what was initially projected in the budget. In response, the Government recently increased the quota volume of subsidized fuels by 4 million kiloliters (KL) to 44 million KL for the full year 2012.6 However, even this additional volume is projected to be insufficient (Figure 20). By the end of September, subsidized fuel consumption exceeded the initial quota for the January to September period by 15 percent. Further, regional data indicate that high consumption relative to quota is most evident in densely populated cities, provinces that operate mining and plantation activities, and provinces that border with neighboring countries, pointing to increasing urban demand and potential leakages (Figure 21). The Government and Parliament have recently agreed to the addition of another 1.2 million KL in subsidized fuel volume to ensure adequate supply until the end of the year.7
Figure 20: The volume of subsidized fuel continues to rise in the absence of fuel subsidy reform (subsidized fuels volume, million kiloliters, KL)
Source: Ministry of Energy and Mineral Resources (ESDM) and World Bank staff calculations
Figure 21: Excess subsidized fuel use relative to quota is centered in densely populated cities, mining, and border areas (difference between realization of subsidized fuel volume and quota from Jan-Sep, percent - map; thousand kiloliter - bar chart )
Source: BPH Migas and World Bank staff calculations
6 http://www.esdm.go.id/berita/migas/40-migas/5961-kuota-bbm-bersubsidi-naik-404-juta-kiloliter.html 7 http://www.esdm.go.id/berita/migas/40-migas/6086-dpr-ri-dan-pemerintah-sepakat-tambah-kuota-
bbm-bersubsidi-12-juta-kl.html
Budget quota
30
32
34
36
38
40
42
44
46
30
32
34
36
38
40
42
44
46
2010 (Actual) 2011 (Actual) 2012
Million KLMillion KL
2nd addition, 1.2 million KL
1st addition, 4 million KL
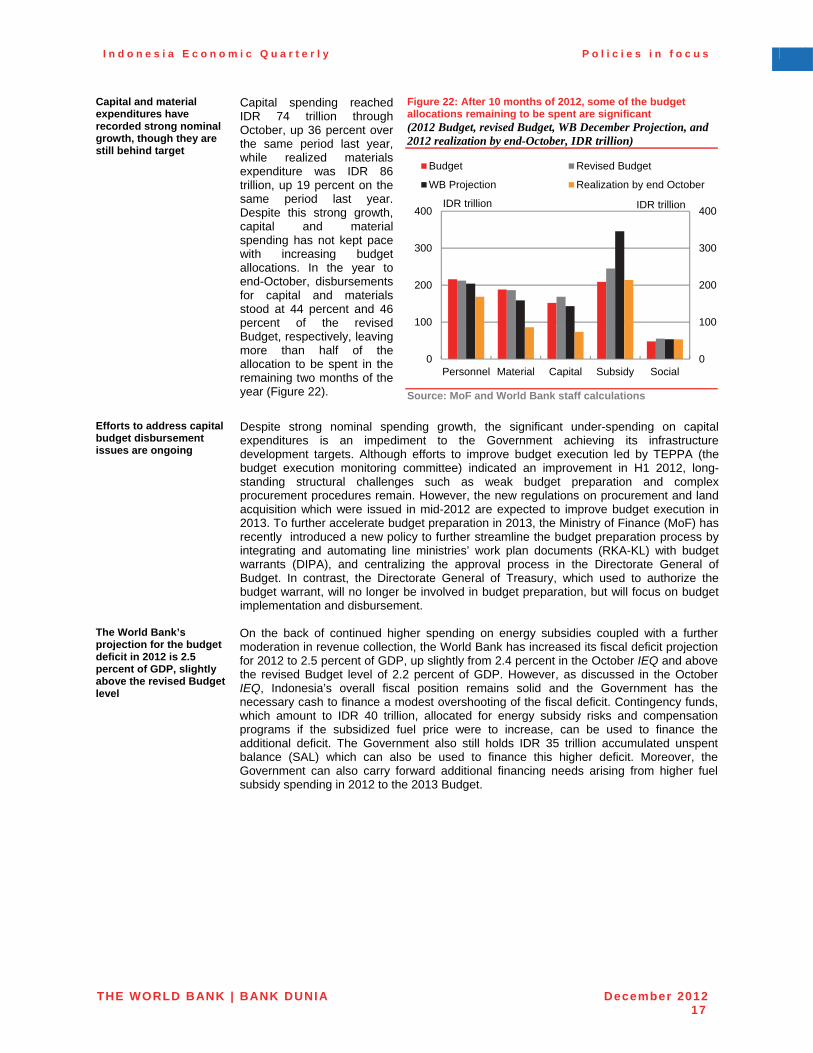
I n d o n e s i a E c o n o m i c Q u a r t e r l y P o l i c i e s i n f o c u s
THE WORLD BANK | BANK DUNIA December 201217
Capital and material expenditures have recorded strong nominal growth, though they are still behind target
Capital spending reached IDR 74 trillion through October, up 36 percent over the same period last year, while realized materials expenditure was IDR 86 trillion, up 19 percent on the same period last year. Despite this strong growth, capital and material spending has not kept pace with increasing budget allocations. In the year to end-October, disbursements for capital and materials stood at 44 percent and 46 percent of the revised Budget, respectively, leaving more than half of the allocation to be spent in the remaining two months of the year (Figure 22).
Figure 22: After 10 months of 2012, some of the budget allocations remaining to be spent are significant (2012 Budget, revised Budget, WB December Projection, and 2012 realization by end-October, IDR trillion)
Source: MoF and World Bank staff calculations
Efforts to address capital budget disbursement issues are ongoing
Despite strong nominal spending growth, the significant under-spending on capital expenditures is an impediment to the Government achieving its infrastructure development targets. Although efforts to improve budget execution led by TEPPA (the budget execution monitoring committee) indicated an improvement in H1 2012, long-standing structural challenges such as weak budget preparation and complex procurement procedures remain. However, the new regulations on procurement and land acquisition which were issued in mid-2012 are expected to improve budget execution in 2013. To further accelerate budget preparation in 2013, the Ministry of Finance (MoF) has recently introduced a new policy to further streamline the budget preparation process by integrating and automating line ministries’ work plan documents (RKA-KL) with budget warrants (DIPA), and centralizing the approval process in the Directorate General of Budget. In contrast, the Directorate General of Treasury, which used to authorize the budget warrant, will no longer be involved in budget preparation, but will focus on budget implementation and disbursement.
The World Bank’s projection for the budget deficit in 2012 is 2.5 percent of GDP, slightly above the revised Budget level
On the back of continued higher spending on energy subsidies coupled with a further moderation in revenue collection, the World Bank has increased its fiscal deficit projection for 2012 to 2.5 percent of GDP, up slightly from 2.4 percent in the October IEQ and abovethe revised Budget level of 2.2 percent of GDP. However, as discussed in the October IEQ, Indonesia’s overall fiscal position remains solid and the Government has the necessary cash to finance a modest overshooting of the fiscal deficit. Contingency funds, which amount to IDR 40 trillion, allocated for energy subsidy risks and compensation programs if the subsidized fuel price were to increase, can be used to finance the additional deficit. The Government also still holds IDR 35 trillion accumulated unspent balance (SAL) which can also be used to finance this higher deficit. Moreover, the Government can also carry forward additional financing needs arising from higher fuel subsidy spending in 2012 to the 2013 Budget.
0
100
200
300
400
0
100
200
300
400
Personnel Material Capital Subsidy Social
IDR trillionIDR trillion
Budget Revised Budget
WB Projection Realization by end October
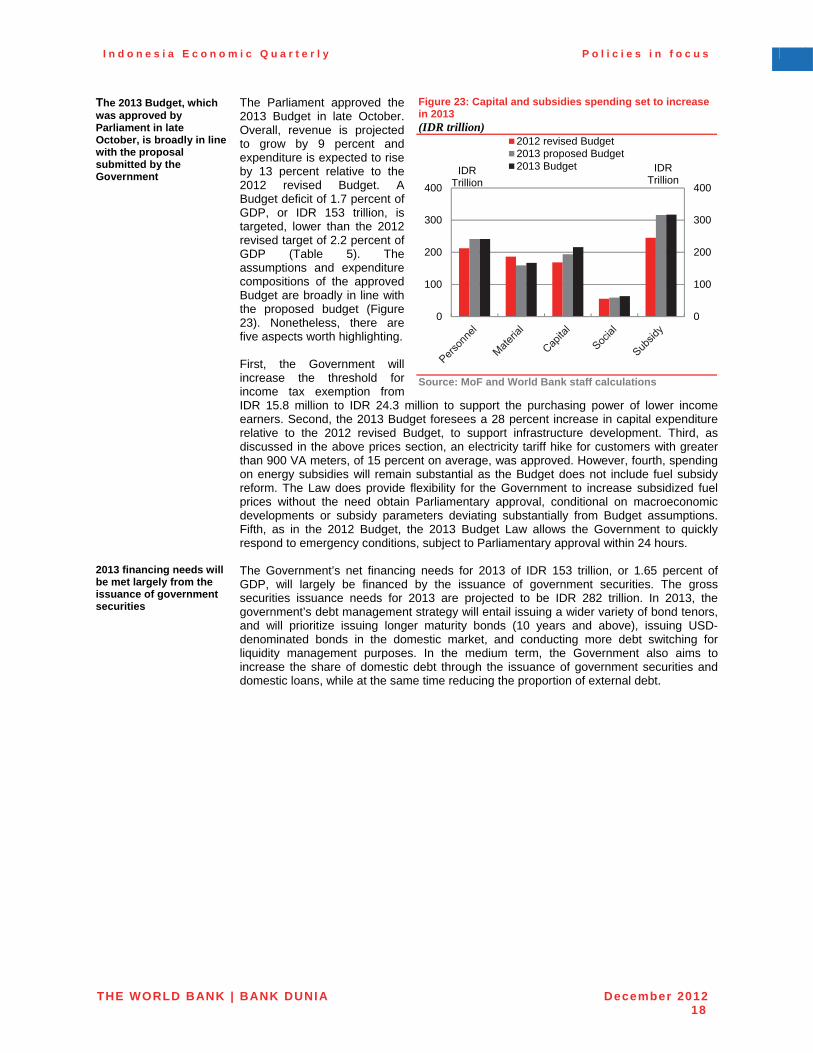
I n d o n e s i a E c o n o m i c Q u a r t e r l y P o l i c i e s i n f o c u s
THE WORLD BANK | BANK DUNIA December 201218
The 2013 Budget, which was approved by Parliament in late October, is broadly in line with the proposal submitted by the Government
The Parliament approved the 2013 Budget in late October. Overall, revenue is projected to grow by 9 percent and expenditure is expected to rise by 13 percent relative to the 2012 revised Budget. A Budget deficit of 1.7 percent of GDP, or IDR 153 trillion, is targeted, lower than the 2012 revised target of 2.2 percent of GDP (Table 5). The assumptions and expenditure compositions of the approved Budget are broadly in line with the proposed budget (Figure 23). Nonetheless, there are five aspects worth highlighting. First, the Government will increase the threshold for income tax exemption from IDR 15.8 million to IDR 24.3 million to support the purchasing power of lower income earners. Second, the 2013 Budget foresees a 28 percent increase in capital expenditure relative to the 2012 revised Budget, to support infrastructure development. Third, as discussed in the above prices section, an electricity tariff hike for customers with greater than 900 VA meters, of 15 percent on average, was approved. However, fourth, spending on energy subsidies will remain substantial as the Budget does not include fuel subsidy reform. The Law does provide flexibility for the Government to increase subsidized fuel prices without the need obtain Parliamentary approval, conditional on macroeconomic developments or subsidy parameters deviating substantially from Budget assumptions. Fifth, as in the 2012 Budget, the 2013 Budget Law allows the Government to quickly respond to emergency conditions, subject to Parliamentary approval within 24 hours.
Figure 23: Capital and subsidies spending set to increase in 2013 (IDR trillion)
Source: MoF and World Bank staff calculations
2013 financing needs will be met largely from the issuance of government securities
The Government’s net financing needs for 2013 of IDR 153 trillion, or 1.65 percent of GDP, will largely be financed by the issuance of government securities. The gross securities issuance needs for 2013 are projected to be IDR 282 trillion. In 2013, the government’s debt management strategy will entail issuing a wider variety of bond tenors, and will prioritize issuing longer maturity bonds (10 years and above), issuing USD-denominated bonds in the domestic market, and conducting more debt switching for liquidity management purposes. In the medium term, the Government also aims to increase the share of domestic debt through the issuance of government securities and domestic loans, while at the same time reducing the proportion of external debt.
0
100
200
300
400
0
100
200
300
400
IDR Trillion
IDR Trillion
2012 revised Budget2013 proposed Budget2013 Budget
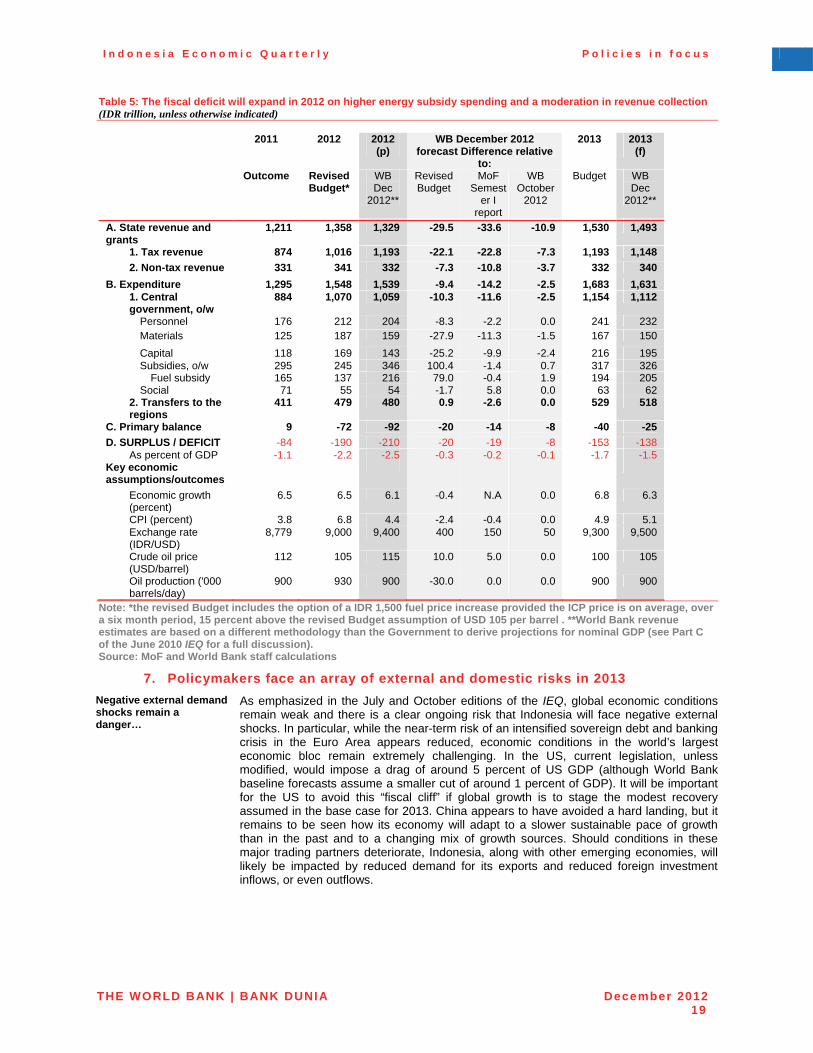
I n d o n e s i a E c o n o m i c Q u a r t e r l y P o l i c i e s i n f o c u s
THE WORLD BANK | BANK DUNIA December 201219
Table 5: The fiscal deficit will expand in 2012 on higher energy subsidy spending and a moderation in revenue collection (IDR trillion, unless otherwise indicated)
2011 2012 2012 (p)
WB December 2012 forecast Difference relative
to:
2013 2013 (f)
Outcome Revised Budget*
WB Dec
2012**
Revised Budget
MoF Semest
er I report
WB October
2012
Budget WB Dec
2012**
A. State revenue and grants
1,211 1,358 1,329 -29.5 -33.6 -10.9 1,530 1,493
1. Tax revenue 874 1,016 1,193 -22.1 -22.8 -7.3 1,193 1,148
2. Non-tax revenue 331 341 332 -7.3 -10.8 -3.7 332 340
B. Expenditure 1,295 1,548 1,539 -9.4 -14.2 -2.5 1,683 1,631 1. Central
government, o/w 884 1,070 1,059 -10.3 -11.6 -2.5 1,154 1,112
Personnel 176 212 204 -8.3 -2.2 0.0 241 232 Materials 125 187 159 -27.9 -11.3 -1.5 167 150
Capital 118 169 143 -25.2 -9.9 -2.4 216 195 Subsidies, o/w 295 245 346 100.4 -1.4 0.7 317 326 Fuel subsidy 165 137 216 79.0 -0.4 1.9 194 205 Social 71 55 54 -1.7 5.8 0.0 63 62 2. Transfers to the
regions 411 479 480 0.9 -2.6 0.0 529 518
C. Primary balance 9 -72 -92 -20 -14 -8 -40 -25
D. SURPLUS / DEFICIT -84 -190 -210 -20 -19 -8 -153 -138 As percent of GDP -1.1 -2.2 -2.5 -0.3 -0.2 -0.1 -1.7 -1.5 Key economic assumptions/outcomes
Economic growth (percent)
6.5 6.5 6.1 -0.4 N.A 0.0 6.8 6.3
CPI (percent) 3.8 6.8 4.4 -2.4 -0.4 0.0 4.9 5.1 Exchange rate
(IDR/USD) 8,779 9,000 9,400 400 150 50 9,300 9,500
Crude oil price (USD/barrel)
112 105 115 10.0 5.0 0.0 100 105
Oil production ('000 barrels/day)
900 930 900 -30.0 0.0 0.0 900 900
Note: *the revised Budget includes the option of a IDR 1,500 fuel price increase provided the ICP price is on average, over a six month period, 15 percent above the revised Budget assumption of USD 105 per barrel . **World Bank revenue estimates are based on a different methodology than the Government to derive projections for nominal GDP (see Part C of the June 2010 IEQ for a full discussion). Source: MoF and World Bank staff calculations
7. Policymakers face an array of external and domestic risks in 2013
Negative external demand shocks remain a danger…
As emphasized in the July and October editions of the IEQ, global economic conditions remain weak and there is a clear ongoing risk that Indonesia will face negative external shocks. In particular, while the near-term risk of an intensified sovereign debt and banking crisis in the Euro Area appears reduced, economic conditions in the world’s largest economic bloc remain extremely challenging. In the US, current legislation, unless modified, would impose a drag of around 5 percent of US GDP (although World Bank baseline forecasts assume a smaller cut of around 1 percent of GDP). It will be importantfor the US to avoid this “fiscal cliff” if global growth is to stage the modest recovery assumed in the base case for 2013. China appears to have avoided a hard landing, but it remains to be seen how its economy will adapt to a slower sustainable pace of growth than in the past and to a changing mix of growth sources. Should conditions in these major trading partners deteriorate, Indonesia, along with other emerging economies, will likely be impacted by reduced demand for its exports and reduced foreign investment inflows, or even outflows.
I n d o n e s i a E c o n o m i c Q u a r t e r l y P o l i c i e s i n f o c u s
THE WORLD BANK | BANK DUNIA December 201220
…and there are also homegrown risks to demand
Domestically, investment spending has been a potent source of growth. It is not yet clear whether the moderation in investment in the third quarter marks the start of a cooling trend, as investment tends to be a volatile component of GDP and capital imports did pick up slightly in October. However, there are risks to the currently high rate of investment spending. First, investment has historically tended to be closely correlated with global commodity prices and, as these remain well off their post financial crisis highs, it is possible that investment will begin to be weighed down as reduced commodity-related earnings spill over into the wider economy. Second, a number of policy announcements over the course of 2012 have raised some concerns over the domestic business and investment policy environment. These concerns may intensify in the lead-up to national elections in 2014, particularly since investor risk appetite globally remains fragile.
Policy could be tested even if the growth environment remains supportive
Even if these negative risks to domestic demand do not materialize, economic developments in 2013 may still test policymakers. In particular, should strong growth continue in 2013, it will be important to watch for signs that the economy is overheating. As with the negative risks to demand, the catalysts for an excess of demand may be external or local. Strong portfolio investment inflows, which have picked up towards the close of 2012, may continue to increase on the back of loose monetary policy in major economies and the global search for yield. Domestically, some increased cost-push inflationary pressures can be foreseen, including from high minimum wage increases, ongoing pass-through from the Rupiah depreciation which has occurred in 2012, and the temporary impact of electricity subsidy reform. Given the ongoing strength of domestic demand, which in the past has received an additional impulse from pre-election spending, it will be important to respond proactively to nascent inflation risks or to signs that the investment needed to expand the economy’s productive capacity is not keeping pace.
International and domestic uncertainties remain elevated, placing the focus on the quality of policy making…
The base case sees solid GDP growth in Indonesia in 2013, as global economic conditions turn mildly more supportive. Yet uncertainties over the international outlook remain elevated and there are material risks of more negative external shocks buffeting the economy. In light of the continued downside risks to the outlook, and scope for more political noise in the run-up to the 2014 elections, there is a need for continued efforts to support improvements in the quality of policy making. This includes a continued focus on crisis mitigation policies, building on the considerable progress Indonesia has already made in securing sources of contingent financing and formulating crisis response protocols for use in times of acute market stress. It is also raises the importance of continuing to tackle the more structural constraints to growth, notably by working to close the large infrastructure gap and improve the efficiency of public spending, thus raising the resilience and sustainable growth rate of the economy.
…especially with regard to the investment climate
Supporting the private sector is also crucial, since rapid growth in investment spending has been a major driver of the recent robust pace of growth, which is lifting living standards in Indonesia. Investment requires making long-term, irreversible commitments, and doing this requires confidence and the ability to effectively plan ahead. Maintaining the clarity and consistency of the regulatory framework, and effectively managing communication concerning any new reforms, may make a decisive difference forinvestment, and hence for the overall economic outlook.
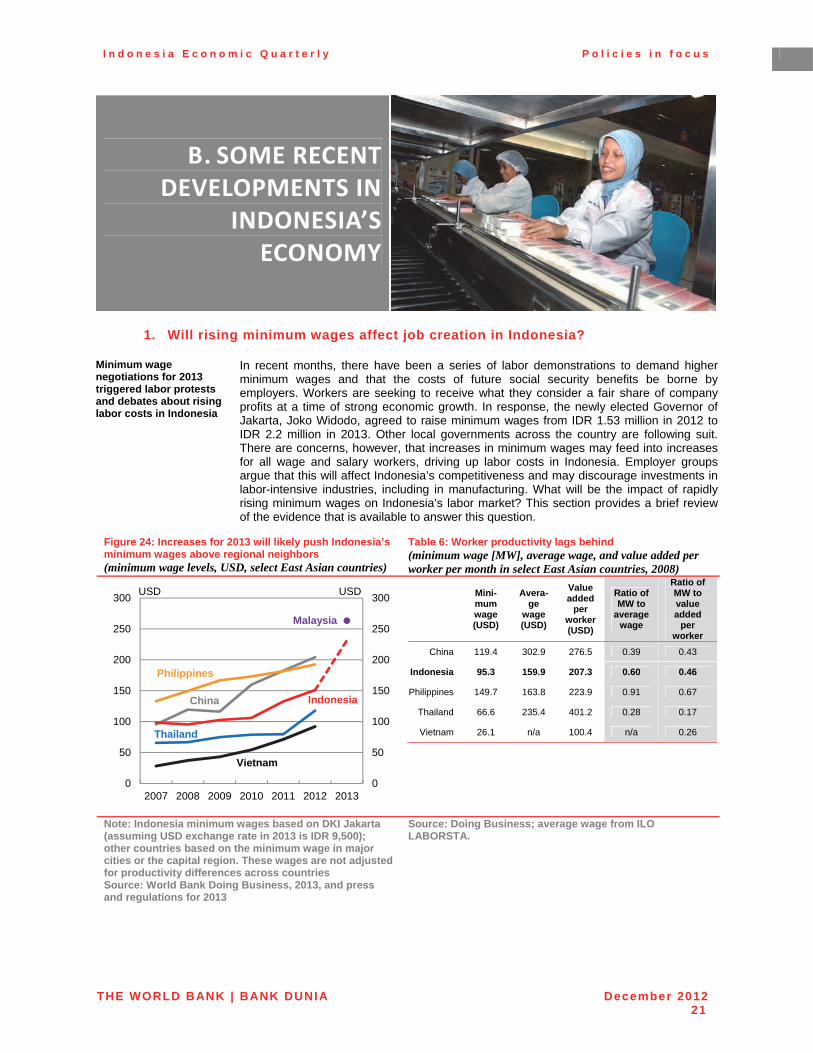
I n d o n e s i a E c o n o m i c Q u a r t e r l y P o l i c i e s i n f o c u s
THE WORLD BANK | BANK DUNIA December 201221
B. SOME RECENT DEVELOPMENTS IN
INDONESIA’S ECONOMY
1. Will rising minimum wages affect job creation in Indonesia?
Minimum wage negotiations for 2013 triggered labor protests and debates about rising labor costs in Indonesia
In recent months, there have been a series of labor demonstrations to demand higher minimum wages and that the costs of future social security benefits be borne by employers. Workers are seeking to receive what they consider a fair share of company profits at a time of strong economic growth. In response, the newly elected Governor of Jakarta, Joko Widodo, agreed to raise minimum wages from IDR 1.53 million in 2012 to IDR 2.2 million in 2013. Other local governments across the country are following suit. There are concerns, however, that increases in minimum wages may feed into increases for all wage and salary workers, driving up labor costs in Indonesia. Employer groups argue that this will affect Indonesia’s competitiveness and may discourage investments in labor-intensive industries, including in manufacturing. What will be the impact of rapidly rising minimum wages on Indonesia’s labor market? This section provides a brief review of the evidence that is available to answer this question.
Figure 24: Increases for 2013 will likely push Indonesia’s minimum wages above regional neighbors (minimum wage levels, USD, select East Asian countries)
Table 6: Worker productivity lags behind (minimum wage [MW], average wage, and value added per worker per month in select East Asian countries, 2008)
Mini- mum wage (USD)
Avera-ge
wage (USD)
Value added
per worker (USD)
Ratio of MW to
average wage
Ratio of MW to value added
per worker
China 119.4 302.9 276.5 0.39 0.43
Indonesia 95.3 159.9 207.3 0.60 0.46
Philippines 149.7 163.8 223.9 0.91 0.67
Thailand 66.6 235.4 401.2 0.28 0.17
Vietnam 26.1 n/a 100.4 n/a 0.26
Note: Indonesia minimum wages based on DKI Jakarta (assuming USD exchange rate in 2013 is IDR 9,500); other countries based on the minimum wage in major cities or the capital region. These wages are not adjusted for productivity differences across countries Source: World Bank Doing Business, 2013, and press and regulations for 2013
Source: Doing Business; average wage from ILO LABORSTA.
0
50
100
150
200
250
300
0
50
100
150
200
250
300
2007 2008 2009 2010 2011 2012 2013
USDUSD
China Indonesia
Malaysia
Philippines
Thailand
Vietnam
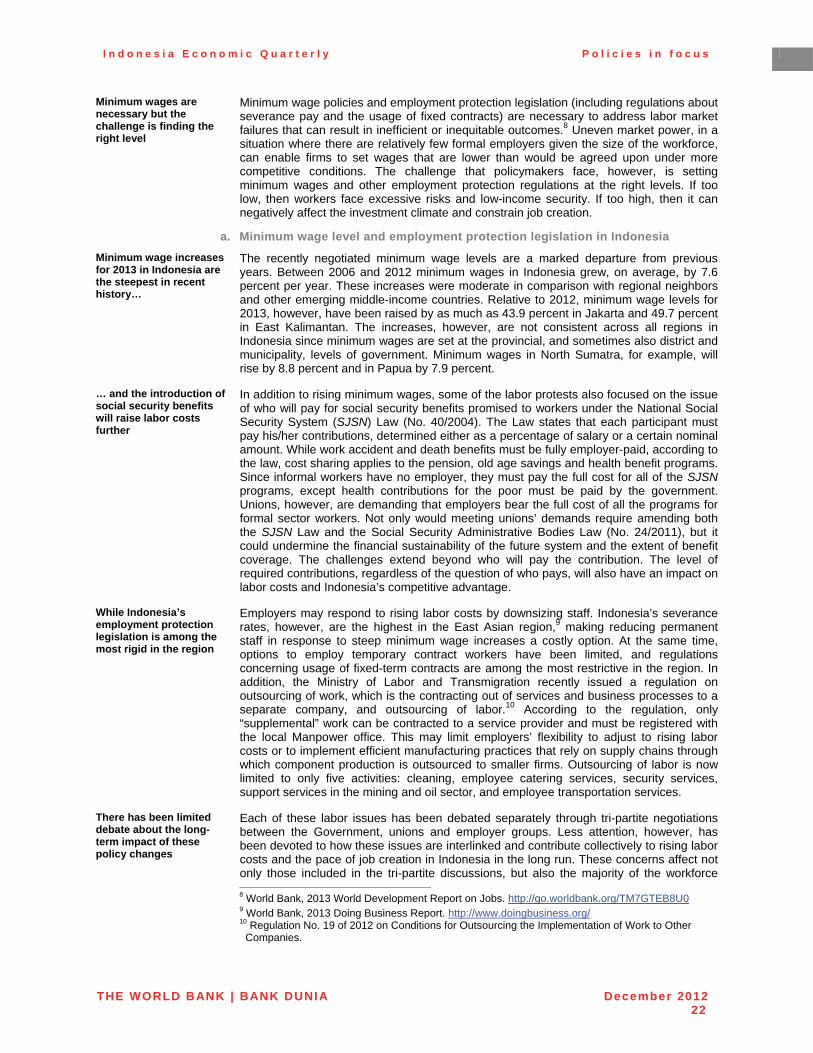
I n d o n e s i a E c o n o m i c Q u a r t e r l y P o l i c i e s i n f o c u s
THE WORLD BANK | BANK DUNIA December 201222
Minimum wages are necessary but the challenge is finding the right level
Minimum wage policies and employment protection legislation (including regulations about severance pay and the usage of fixed contracts) are necessary to address labor market failures that can result in inefficient or inequitable outcomes.8 Uneven market power, in a situation where there are relatively few formal employers given the size of the workforce, can enable firms to set wages that are lower than would be agreed upon under more competitive conditions. The challenge that policymakers face, however, is setting minimum wages and other employment protection regulations at the right levels. If too low, then workers face excessive risks and low-income security. If too high, then it can negatively affect the investment climate and constrain job creation.
a. Minimum wage level and employment protection legislation in Indonesia
Minimum wage increases for 2013 in Indonesia are the steepest in recent history…
The recently negotiated minimum wage levels are a marked departure from previous years. Between 2006 and 2012 minimum wages in Indonesia grew, on average, by 7.6 percent per year. These increases were moderate in comparison with regional neighbors and other emerging middle-income countries. Relative to 2012, minimum wage levels for 2013, however, have been raised by as much as 43.9 percent in Jakarta and 49.7 percent in East Kalimantan. The increases, however, are not consistent across all regions in Indonesia since minimum wages are set at the provincial, and sometimes also district and municipality, levels of government. Minimum wages in North Sumatra, for example, will rise by 8.8 percent and in Papua by 7.9 percent.
… and the introduction of social security benefits will raise labor costs further
In addition to rising minimum wages, some of the labor protests also focused on the issue of who will pay for social security benefits promised to workers under the National Social Security System (SJSN) Law (No. 40/2004). The Law states that each participant must pay his/her contributions, determined either as a percentage of salary or a certain nominal amount. While work accident and death benefits must be fully employer-paid, according to the law, cost sharing applies to the pension, old age savings and health benefit programs. Since informal workers have no employer, they must pay the full cost for all of the SJSNprograms, except health contributions for the poor must be paid by the government. Unions, however, are demanding that employers bear the full cost of all the programs for formal sector workers. Not only would meeting unions’ demands require amending both the SJSN Law and the Social Security Administrative Bodies Law (No. 24/2011), but it could undermine the financial sustainability of the future system and the extent of benefit coverage. The challenges extend beyond who will pay the contribution. The level of required contributions, regardless of the question of who pays, will also have an impact on labor costs and Indonesia’s competitive advantage.
While Indonesia’s employment protection legislation is among the most rigid in the region
Employers may respond to rising labor costs by downsizing staff. Indonesia’s severance rates, however, are the highest in the East Asian region,9 making reducing permanent staff in response to steep minimum wage increases a costly option. At the same time, options to employ temporary contract workers have been limited, and regulations concerning usage of fixed-term contracts are among the most restrictive in the region. In addition, the Ministry of Labor and Transmigration recently issued a regulation on outsourcing of work, which is the contracting out of services and business processes to a separate company, and outsourcing of labor.10 According to the regulation, only “supplemental” work can be contracted to a service provider and must be registered with the local Manpower office. This may limit employers’ flexibility to adjust to rising labor costs or to implement efficient manufacturing practices that rely on supply chains through which component production is outsourced to smaller firms. Outsourcing of labor is now limited to only five activities: cleaning, employee catering services, security services, support services in the mining and oil sector, and employee transportation services.
There has been limited debate about the long-term impact of these policy changes
Each of these labor issues has been debated separately through tri-partite negotiations between the Government, unions and employer groups. Less attention, however, has been devoted to how these issues are interlinked and contribute collectively to rising labor costs and the pace of job creation in Indonesia in the long run. These concerns affect not only those included in the tri-partite discussions, but also the majority of the workforce 8 World Bank, 2013 World Development Report on Jobs. http://go.worldbank.org/TM7GTEB8U0 9 World Bank, 2013 Doing Business Report. http://www.doingbusiness.org/ 10 Regulation No. 19 of 2012 on Conditions for Outsourcing the Implementation of Work to Other
Companies.
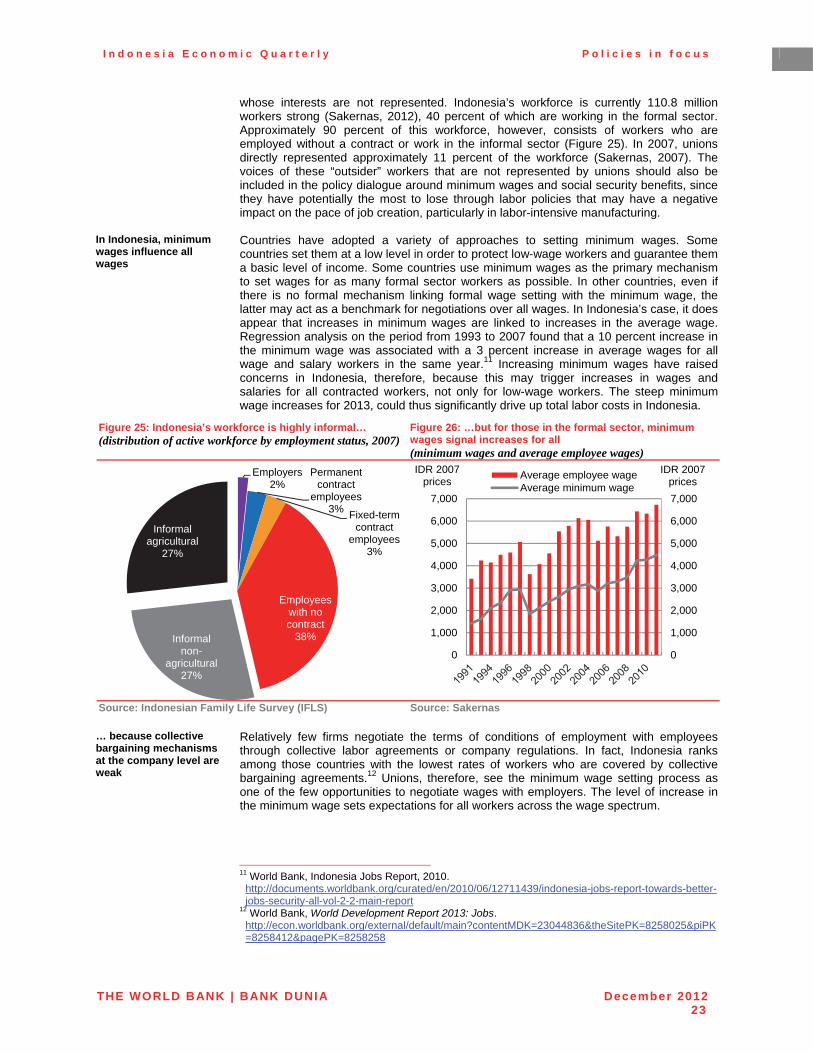
I n d o n e s i a E c o n o m i c Q u a r t e r l y P o l i c i e s i n f o c u s
THE WORLD BANK | BANK DUNIA December 201223
whose interests are not represented. Indonesia’s workforce is currently 110.8 million workers strong (Sakernas, 2012), 40 percent of which are working in the formal sector. Approximately 90 percent of this workforce, however, consists of workers who are employed without a contract or work in the informal sector (Figure 25). In 2007, unions directly represented approximately 11 percent of the workforce (Sakernas, 2007). The voices of these “outsider” workers that are not represented by unions should also be included in the policy dialogue around minimum wages and social security benefits, since they have potentially the most to lose through labor policies that may have a negative impact on the pace of job creation, particularly in labor-intensive manufacturing.
In Indonesia, minimum wages influence all wages
Countries have adopted a variety of approaches to setting minimum wages. Some countries set them at a low level in order to protect low-wage workers and guarantee them a basic level of income. Some countries use minimum wages as the primary mechanism to set wages for as many formal sector workers as possible. In other countries, even if there is no formal mechanism linking formal wage setting with the minimum wage, the latter may act as a benchmark for negotiations over all wages. In Indonesia’s case, it does appear that increases in minimum wages are linked to increases in the average wage. Regression analysis on the period from 1993 to 2007 found that a 10 percent increase in the minimum wage was associated with a 3 percent increase in average wages for all wage and salary workers in the same year.11 Increasing minimum wages have raised concerns in Indonesia, therefore, because this may trigger increases in wages and salaries for all contracted workers, not only for low-wage workers. The steep minimum wage increases for 2013, could thus significantly drive up total labor costs in Indonesia.
Figure 25: Indonesia’s workforce is highly informal… (distribution of active workforce by employment status, 2007)
Figure 26: …but for those in the formal sector, minimum wages signal increases for all (minimum wages and average employee wages)
Source: Indonesian Family Life Survey (IFLS) Source: Sakernas
… because collective bargaining mechanisms at the company level are weak
Relatively few firms negotiate the terms of conditions of employment with employees through collective labor agreements or company regulations. In fact, Indonesia ranks among those countries with the lowest rates of workers who are covered by collective bargaining agreements.12 Unions, therefore, see the minimum wage setting process as one of the few opportunities to negotiate wages with employers. The level of increase in the minimum wage sets expectations for all workers across the wage spectrum.
11 World Bank, Indonesia Jobs Report, 2010.
http://documents.worldbank.org/curated/en/2010/06/12711439/indonesia-jobs-report-towards-better-jobs-security-all-vol-2-2-main-report
12 World Bank, World Development Report 2013: Jobs. http://econ.worldbank.org/external/default/main?contentMDK=23044836&theSitePK=8258025&piPK=8258412&pagePK=8258258
Employers2%
Permanent contract
employees3%
Fixed-term contract
employees3%
Employees with no contract
38%Informal non-
agricultural27%
Informal agricultural
27%
0
1,000
2,000
3,000
4,000
5,000
6,000
7,000
0
1,000
2,000
3,000
4,000
5,000
6,000
7,000
IDR 2007 prices
IDR 2007 prices
Average employee wageAverage minimum wage
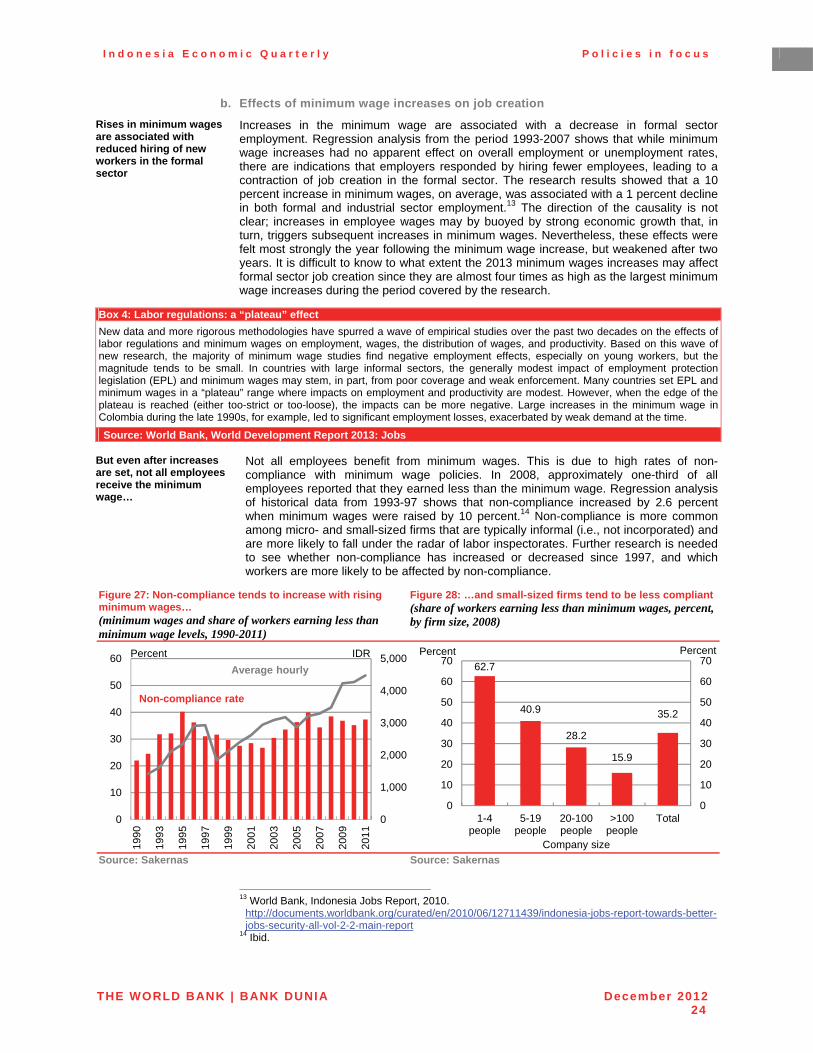
I n d o n e s i a E c o n o m i c Q u a r t e r l y P o l i c i e s i n f o c u s
THE WORLD BANK | BANK DUNIA December 201224
b. Effects of minimum wage increases on job creation
Rises in minimum wages are associated with reduced hiring of new workers in the formal sector
Increases in the minimum wage are associated with a decrease in formal sector employment. Regression analysis from the period 1993-2007 shows that while minimum wage increases had no apparent effect on overall employment or unemployment rates, there are indications that employers responded by hiring fewer employees, leading to a contraction of job creation in the formal sector. The research results showed that a 10 percent increase in minimum wages, on average, was associated with a 1 percent decline in both formal and industrial sector employment.13 The direction of the causality is not clear; increases in employee wages may by buoyed by strong economic growth that, in turn, triggers subsequent increases in minimum wages. Nevertheless, these effects were felt most strongly the year following the minimum wage increase, but weakened after two years. It is difficult to know to what extent the 2013 minimum wages increases may affect formal sector job creation since they are almost four times as high as the largest minimum wage increases during the period covered by the research.
Box 4: Labor regulations: a “plateau” effect
New data and more rigorous methodologies have spurred a wave of empirical studies over the past two decades on the effects oflabor regulations and minimum wages on employment, wages, the distribution of wages, and productivity. Based on this wave of new research, the majority of minimum wage studies find negative employment effects, especially on young workers, but the magnitude tends to be small. In countries with large informal sectors, the generally modest impact of employment protection legislation (EPL) and minimum wages may stem, in part, from poor coverage and weak enforcement. Many countries set EPL and minimum wages in a “plateau” range where impacts on employment and productivity are modest. However, when the edge of the plateau is reached (either too-strict or too-loose), the impacts can be more negative. Large increases in the minimum wage in Colombia during the late 1990s, for example, led to significant employment losses, exacerbated by weak demand at the time.
Source: World Bank, World Development Report 2013: Jobs
But even after increases are set, not all employees receive the minimum wage…
Not all employees benefit from minimum wages. This is due to high rates of non-compliance with minimum wage policies. In 2008, approximately one-third of all employees reported that they earned less than the minimum wage. Regression analysis of historical data from 1993-97 shows that non-compliance increased by 2.6 percent when minimum wages were raised by 10 percent.14 Non-compliance is more common among micro- and small-sized firms that are typically informal (i.e., not incorporated) and are more likely to fall under the radar of labor inspectorates. Further research is needed to see whether non-compliance has increased or decreased since 1997, and which workers are more likely to be affected by non-compliance.
Figure 27: Non-compliance tends to increase with rising minimum wages… (minimum wages and share of workers earning less than minimum wage levels, 1990-2011)
Figure 28: …and small-sized firms tend to be less compliant(share of workers earning less than minimum wages, percent, by firm size, 2008)
Source: Sakernas Source: Sakernas
13 World Bank, Indonesia Jobs Report, 2010.
http://documents.worldbank.org/curated/en/2010/06/12711439/indonesia-jobs-report-towards-better-jobs-security-all-vol-2-2-main-report
14 Ibid.
0
1,000
2,000
3,000
4,000
5,000
0
10
20
30
40
50
60
199
0
199
3
199
5
199
7
199
9
200
1
200
3
200
5
200
7
200
9
201
1
IDRPercent
Non-compliance rate
Average hourly 62.7
40.9
28.2
15.9
35.2
0
10
20
30
40
50
60
70
0
10
20
30
40
50
60
70
1-4people
5-19people
20-100people
>100people
Total
PercentPercent
Company size
I n d o n e s i a E c o n o m i c Q u a r t e r l y P o l i c i e s i n f o c u s
THE WORLD BANK | BANK DUNIA December 201225
…which tends to affect low-wage workers more
Poor households benefit less from minimum wage increases. First, many of the poor do not work in the formal sector and do not earn regular wages. Second, the majority (55 percent in 2006) of poor workers with salaried jobs report that they earn less than the minimum wage.15 This is mostly likely because they tend to work in micro-firms that are more likely to be non-compliant in paying minimum wages.
c. Changes in the process for setting minimum wages
Indonesia revised the process for setting minimum wages in 2006…
The current process for setting minimum wages was first laid out in the 2003 Manpower Law in which local tripartite wage councils prepared a proposed level that was based on a decent standard of living for workers. Governors (for provinces) and heads of districts and mayors (for district and municipalities) finalize the level and set the new minimum wage. In 2005, the Minister of Manpower and Transmigration decreed that local wage councils were required to use a new standard for calculating the cost of living for workers (Kebutuhan Hidup Minimal, KHL), which was to be used as an input for determining minimum wages. The KHL, calculated from a basket of 47 basic commodities and services, was on average 38 percent higher than the previous living standards measure.16
… but the process needs to become less political and more technically driven
In 2007, the authority for calculating the KHL shifted from Statistics Indonesia (BPS) to the tripartite local wage councils (Dewan Pengupahan). Unions and employer groups conduct separate surveys to calculate the KHL, which is then negotiated and a compromise figure is agreed upon. Recent research indicates that this method overstates the real increase in prices; during 2007-2011 KHL increases were almost double the estimated increase in the rate of inflation.17 Nevertheless, the influence of the KHL on minimum wages – although positive – is relatively small. The other factors considered by the wage councils are not publicly released. The shift from a technical to negotiated approach partly explains the large variation in minimum wage increases across regions.
Revisions to the minimum wage setting process are needed to reduce the risk of future labor unrest
Since the process of determining minimum wages is mostly based on negotiations, and only weakly linked to technical assessments of cost of living increases, the process has become highly contentious. A more technical approach to setting minimum wages can improve the transparency and perceived fairness of the process while, at the same time, minimizing business uncertainty and output losses. The appropriateness of the KHL bundle should be re-assessed, and a single transparent process to re-calculate the annual KHL should be agreed to in advance. This revised KHL should become the primary determinant for proposing minimum wage increases; other factors that contribute to the calculation should be standardized and made available for public scrutiny. Shifting towards such a transparent, technically-driven approach will help to ensure that the minimum wage setting process will not be subject to interference by local politics or the interests of employers or unions. This will also improve the transparency and predictability of future minimum wages, which will help boost investor confidence in Indonesia by facilitating business planning and potentially reducing the risk of labor unrest.
d. Adopting a long-term view on job creation and worker protection
Broader dialogue is also needed on a long-term reform strategy that works for all workers…
Minimum wage policies are closely linked to other employment protection measures: severance pay, restrictions on fixed-term contracts and outsourcing, and the introduction of social security benefits such as pensions and accident insurance. There has been strong and vigorous debate on each of these issues, but workers and employers remain trapped in a “lose-lose” situation. Little effort has been made to consider how the policies and regulations work in tandem to protect workers, or their effect on job creation. There is a need for the Government, workers (represented not only by unions but also considering the interests of the large population of informal workers) and employers to shift towards a long-term view of labor policy reform in Indonesia and find “win-win” solutions that work for all. Together, these stakeholders should consider what blend of policies and instruments can be applied to provide real protection for workers without compromising investment in labor-intensive industries and the pace of quality job creation in Indonesia. Such a discussion will also require addressing and resolving some of the issues related to establishing the national social security systems. This will include how to expand
15 Ibid. 16 Chris Manning and Raden Muhamad Purnagunawan, 2012. 17 Ibid.
I n d o n e s i a E c o n o m i c Q u a r t e r l y P o l i c i e s i n f o c u s
THE WORLD BANK | BANK DUNIA December 201226
coverage, designing the right benefit package, ensuring that the future system will be financially sustainable in the long-run, transforming the institutions responsible for the delivery and oversight of the social security system, and synergizing the labor law with the introduction of the social security employment programs.
…and is driven more by research-based evidence than short-term politics
This section has briefly reviewed the evidence to inform the discussion on minimum wages, drawing on the findings of the 2010 World Bank Jobs Report, which reviewedIndonesia’s labor market over the last two decades. However, further work is required by all stakeholders to build the body of knowledge needed for evidence-based policy making. To this end, in early 2013 the World Bank will release an update of the report, which will expand on some of the most pressing issues, notably social security benefits for workers and skills development. At the same time, the World Bank’s 2013 World Development Report is focusing on the issue of jobs and will provide global learning on how to provide more jobs and improve effective protection for all workers.
I n d o n e s i a E c o n o m i c Q u a r t e r l y P o l i c i e s i n f o c u s
THE WORLD BANK | BANK DUNIA December 201227
2. Building Jakarta’s resilience to frequent flooding
Jakarta is Indonesia’s preeminent urban center, one of the largest metropolitan areas in the world, and the source of almost one sixth of the country’s GDP…
As the main commercial hub of Indonesia, the capital city of Jakarta contributes about 13percent, or USD 112 billion, of the country’s total GDP.18 As the economic and political center of Indonesia, regional urbanization has also contributed to making Jakarta one of the largest metropolitan areas in the world. The Special Capital District of Jakarta (DKI) covers an area of approximately 650 km2 with a population of about 10 million (2010). The population of Greater Jakarta (covering about 7,300 km2) stands at just under 30 million.Population growth rates are far above the national average and the population is projected to exceed 35 million people by 2020. Up to 250,000 rural-urban migrants are estimated to move to Jakarta every year, contributing to the increase in informal settlements where people live without the benefit of public services (e.g., transportation, water supply, sanitation and waste management).
…but it suffers from a perennial flood problem
Due to its location and rapid population growth, coupled with under-development of public services, the city has become known for a range of problems, the most severe of which are manifested in disastrous perennial flooding. Jakarta was built on a low lying coastal area. It sits on fluvial sediments on the lowest lying areas of a basin that is surrounded by several dormant volcanoes whose slopes form the upstream catchment areas of the 13 major rivers that flow through the basin on their way to the Java Sea. Today, about 40percent of the city (including most of north Jakarta) lies at, or below, sea level. Perennial floods have been a fact of life in Jakarta since its foundation. Major and destructive incidences have been recorded as far back as 1621, 1654, and 1918.19 As the current rainy season has brought localized flooding to parts of the city, this section provide a timely overview of the severe economic and human impact of such flooding and its determinants. While recognizing the policy challenges, it then outlines some immediate actions that can help to alleviate flood impacts and improve the city’s resilience in the near and medium term.
a. The severity of flooding has increased, imposing significant costs
Flood incidences have been increasing in severity in recent times…
Flood incidences have been increasing in severity during the past decades, with especially devastating floods recorded in January 1996, February 2002, and February 2007. The 2007 event alone inundated 235 km2 (about 36 percent) of the city, by up to seven meters in some areas. It affected more than 2.6 million people and forced 340,000 people to flee their homes. Over 70 people died and outbreaks of disease affected over 200,000 people. In 2008 a flood event closed the airport toll road, cancelling over 1,000 flights and causing serious disruptions for the city. Floods in 2009 also occurred at high intensity and continued into 2010. The actual and perceived risk of flooding results inhuman suffering, direct financial and economic damage, and affects the incentives of businesses and investors to make investments in affected areas.
…inflicting a severe economic, financial and human toll…
The estimated financial and economic losses from a 10-day flood event in 2002 were over USD 1 billion, whereas the 6-day 2007 flood cost about USD 900 million. The consequences of severe flooding to Jakarta are even more alarming if assessed by their sectoral impacts. Unlike rapid onset disasters, like earthquakes or tsunamis (the impact and reconstruction from which are discussed in the following section), the direct damage caused by inundation is relatively small compared to the economic losses caused by interruptions in city services and mobility, and hence productive economic activities (see Box 5 on the 2007 flood).
18 Calculations based on 2011 GDP and regional GDP figures from CEIC. 19 Laporan Perkiraan Kerusakan dan Kerugian Pasca Bencana Banjir Awal Februari 2007 di Wilayah
JABODETABEK (Damage and Losses Estimate of February 2007 Flood), http://www.bappenas.go.id/node/111/995/laporan-perkiraan-kerusakan-dan-kerugian-pasca-bencana-banjir-awal-februari-2007-di-jabodetabek/
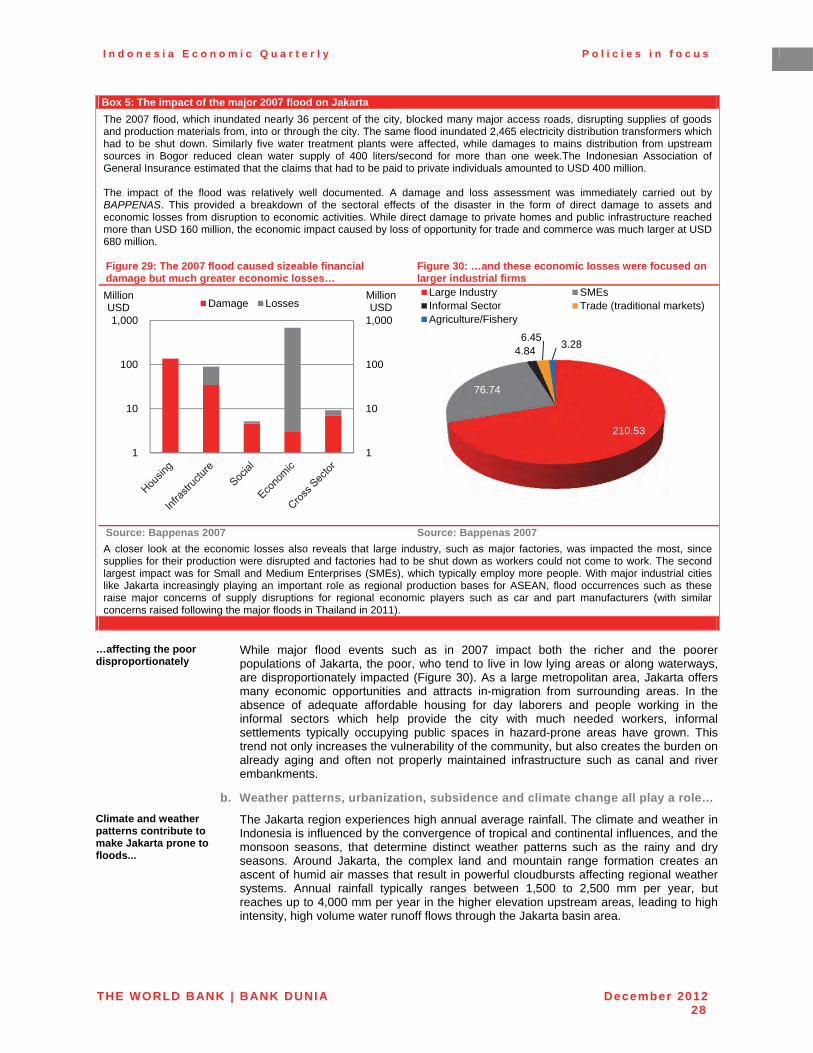
I n d o n e s i a E c o n o m i c Q u a r t e r l y P o l i c i e s i n f o c u s
THE WORLD BANK | BANK DUNIA December 201228
Box 5: The impact of the major 2007 flood on Jakarta
The 2007 flood, which inundated nearly 36 percent of the city, blocked many major access roads, disrupting supplies of goods and production materials from, into or through the city. The same flood inundated 2,465 electricity distribution transformers which had to be shut down. Similarly five water treatment plants were affected, while damages to mains distribution from upstream sources in Bogor reduced clean water supply of 400 liters/second for more than one week.The Indonesian Association of General Insurance estimated that the claims that had to be paid to private individuals amounted to USD 400 million. The impact of the flood was relatively well documented. A damage and loss assessment was immediately carried out by BAPPENAS. This provided a breakdown of the sectoral effects of the disaster in the form of direct damage to assets and economic losses from disruption to economic activities. While direct damage to private homes and public infrastructure reached more than USD 160 million, the economic impact caused by loss of opportunity for trade and commerce was much larger at USD 680 million.
Figure 29: The 2007 flood caused sizeable financial damage but much greater economic losses…
Figure 30: …and these economic losses were focused on larger industrial firms
Source: Bappenas 2007 Source: Bappenas 2007
A closer look at the economic losses also reveals that large industry, such as major factories, was impacted the most, since supplies for their production were disrupted and factories had to be shut down as workers could not come to work. The second largest impact was for Small and Medium Enterprises (SMEs), which typically employ more people. With major industrial cities like Jakarta increasingly playing an important role as regional production bases for ASEAN, flood occurrences such as these raise major concerns of supply disruptions for regional economic players such as car and part manufacturers (with similar concerns raised following the major floods in Thailand in 2011).
…affecting the poor disproportionately
While major flood events such as in 2007 impact both the richer and the poorer populations of Jakarta, the poor, who tend to live in low lying areas or along waterways, are disproportionately impacted (Figure 30). As a large metropolitan area, Jakarta offers many economic opportunities and attracts in-migration from surrounding areas. In the absence of adequate affordable housing for day laborers and people working in the informal sectors which help provide the city with much needed workers, informal settlements typically occupying public spaces in hazard-prone areas have grown. This trend not only increases the vulnerability of the community, but also creates the burden on already aging and often not properly maintained infrastructure such as canal and river embankments.
b. Weather patterns, urbanization, subsidence and climate change all play a role…
Climate and weather patterns contribute to make Jakarta prone to floods...
The Jakarta region experiences high annual average rainfall. The climate and weather in Indonesia is influenced by the convergence of tropical and continental influences, and the monsoon seasons, that determine distinct weather patterns such as the rainy and dry seasons. Around Jakarta, the complex land and mountain range formation creates an ascent of humid air masses that result in powerful cloudbursts affecting regional weather systems. Annual rainfall typically ranges between 1,500 to 2,500 mm per year, but reaches up to 4,000 mm per year in the higher elevation upstream areas, leading to high intensity, high volume water runoff flows through the Jakarta basin area.
1
10
100
1,000
1
10
100
1,000
Million USD
MillionUSD Damage Losses
210.53
76.74
4.84 6.45
3.28
Large Industry SMEsInformal Sector Trade (traditional markets)Agriculture/Fishery
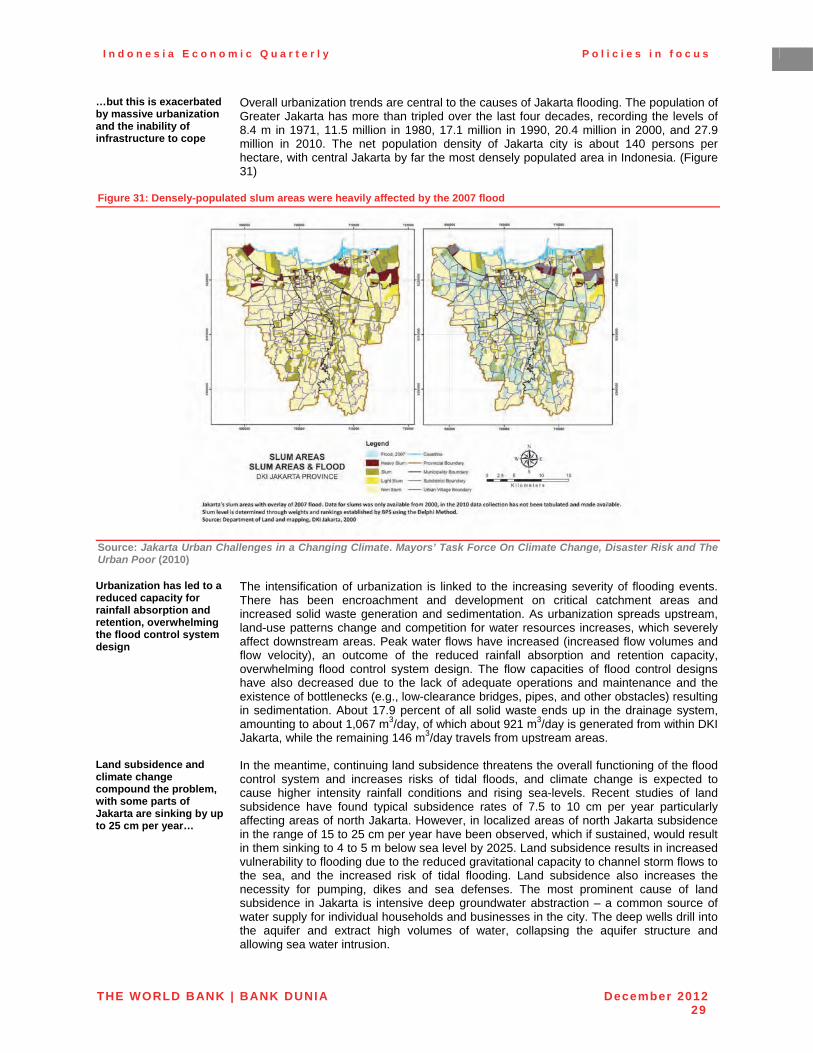
I n d o n e s i a E c o n o m i c Q u a r t e r l y P o l i c i e s i n f o c u s
THE WORLD BANK | BANK DUNIA December 201229
…but this is exacerbated by massive urbanization and the inability of infrastructure to cope
Overall urbanization trends are central to the causes of Jakarta flooding. The population of Greater Jakarta has more than tripled over the last four decades, recording the levels of 8.4 m in 1971, 11.5 million in 1980, 17.1 million in 1990, 20.4 million in 2000, and 27.9 million in 2010. The net population density of Jakarta city is about 140 persons per hectare, with central Jakarta by far the most densely populated area in Indonesia. (Figure 31)
Figure 31: Densely-populated slum areas were heavily affected by the 2007 flood
Source: Jakarta Urban Challenges in a Changing Climate. Mayors’ Task Force On Climate Change, Disaster Risk and The Urban Poor (2010)
Urbanization has led to a reduced capacity for rainfall absorption and retention, overwhelming the flood control system design
The intensification of urbanization is linked to the increasing severity of flooding events.There has been encroachment and development on critical catchment areas and increased solid waste generation and sedimentation. As urbanization spreads upstream, land-use patterns change and competition for water resources increases, which severely affect downstream areas. Peak water flows have increased (increased flow volumes and flow velocity), an outcome of the reduced rainfall absorption and retention capacity, overwhelming flood control system design. The flow capacities of flood control designs have also decreased due to the lack of adequate operations and maintenance and the existence of bottlenecks (e.g., low-clearance bridges, pipes, and other obstacles) resulting in sedimentation. About 17.9 percent of all solid waste ends up in the drainage system, amounting to about 1,067 m3/day, of which about 921 m3/day is generated from within DKI Jakarta, while the remaining 146 m3/day travels from upstream areas.
Land subsidence and climate change compound the problem, with some parts of Jakarta are sinking by up to 25 cm per year…
In the meantime, continuing land subsidence threatens the overall functioning of the flood control system and increases risks of tidal floods, and climate change is expected to cause higher intensity rainfall conditions and rising sea-levels. Recent studies of land subsidence have found typical subsidence rates of 7.5 to 10 cm per year particularly affecting areas of north Jakarta. However, in localized areas of north Jakarta subsidence in the range of 15 to 25 cm per year have been observed, which if sustained, would result in them sinking to 4 to 5 m below sea level by 2025. Land subsidence results in increased vulnerability to flooding due to the reduced gravitational capacity to channel storm flows to the sea, and the increased risk of tidal flooding. Land subsidence also increases the necessity for pumping, dikes and sea defenses. The most prominent cause of land subsidence in Jakarta is intensive deep groundwater abstraction – a common source of water supply for individual households and businesses in the city. The deep wells drill into the aquifer and extract high volumes of water, collapsing the aquifer structure and allowing sea water intrusion.
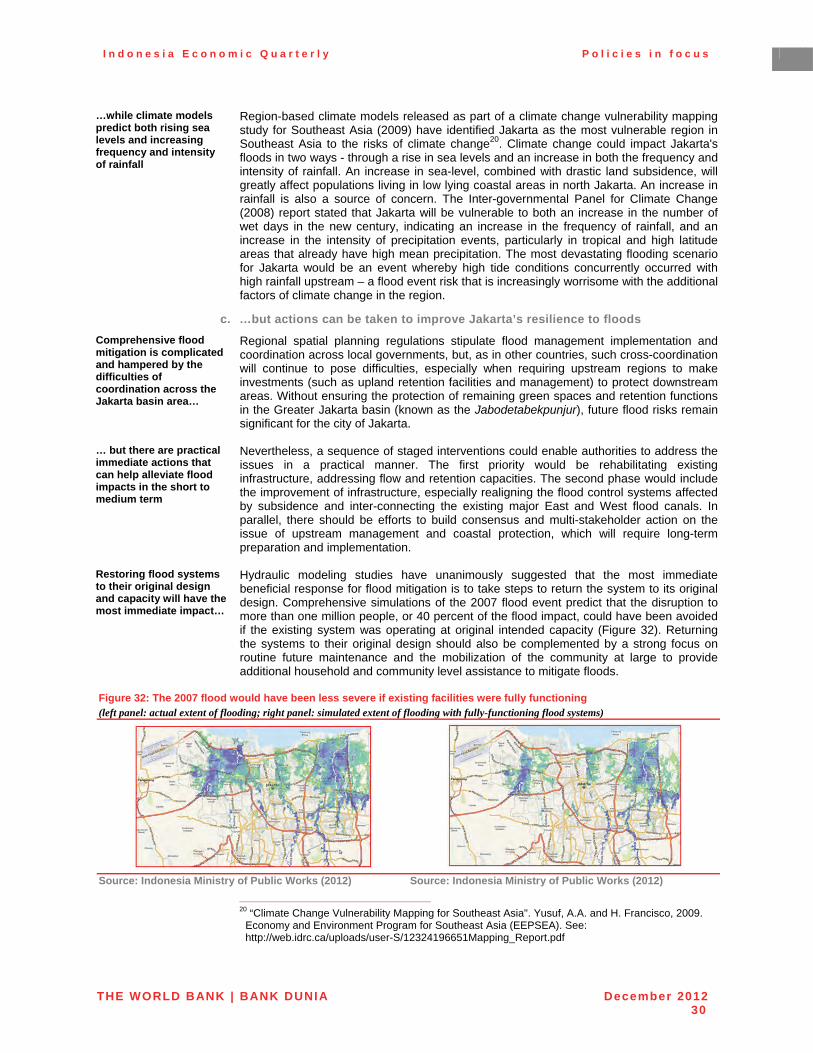
I n d o n e s i a E c o n o m i c Q u a r t e r l y P o l i c i e s i n f o c u s
THE WORLD BANK | BANK DUNIA December 201230
…while climate models predict both rising sea levels and increasing frequency and intensity of rainfall
Region-based climate models released as part of a climate change vulnerability mapping study for Southeast Asia (2009) have identified Jakarta as the most vulnerable region in Southeast Asia to the risks of climate change20. Climate change could impact Jakarta's floods in two ways - through a rise in sea levels and an increase in both the frequency and intensity of rainfall. An increase in sea-level, combined with drastic land subsidence, will greatly affect populations living in low lying coastal areas in north Jakarta. An increase in rainfall is also a source of concern. The Inter-governmental Panel for Climate Change (2008) report stated that Jakarta will be vulnerable to both an increase in the number of wet days in the new century, indicating an increase in the frequency of rainfall, and an increase in the intensity of precipitation events, particularly in tropical and high latitude areas that already have high mean precipitation. The most devastating flooding scenario for Jakarta would be an event whereby high tide conditions concurrently occurred with high rainfall upstream – a flood event risk that is increasingly worrisome with the additional factors of climate change in the region.
c. …but actions can be taken to improve Jakarta’s resilience to floods
Comprehensive flood mitigation is complicated and hampered by the difficulties of coordination across the Jakarta basin area…
Regional spatial planning regulations stipulate flood management implementation and coordination across local governments, but, as in other countries, such cross-coordination will continue to pose difficulties, especially when requiring upstream regions to make investments (such as upland retention facilities and management) to protect downstream areas. Without ensuring the protection of remaining green spaces and retention functions in the Greater Jakarta basin (known as the Jabodetabekpunjur), future flood risks remain significant for the city of Jakarta.
… but there are practical immediate actions that can help alleviate flood impacts in the short to medium term
Nevertheless, a sequence of staged interventions could enable authorities to address the issues in a practical manner. The first priority would be rehabilitating existing infrastructure, addressing flow and retention capacities. The second phase would include the improvement of infrastructure, especially realigning the flood control systems affected by subsidence and inter-connecting the existing major East and West flood canals. In parallel, there should be efforts to build consensus and multi-stakeholder action on the issue of upstream management and coastal protection, which will require long-term preparation and implementation.
Restoring flood systems to their original design and capacity will have the most immediate impact…
Hydraulic modeling studies have unanimously suggested that the most immediate beneficial response for flood mitigation is to take steps to return the system to its original design. Comprehensive simulations of the 2007 flood event predict that the disruption to more than one million people, or 40 percent of the flood impact, could have been avoided if the existing system was operating at original intended capacity (Figure 32). Returning the systems to their original design should also be complemented by a strong focus on routine future maintenance and the mobilization of the community at large to provide additional household and community level assistance to mitigate floods.
Figure 32: The 2007 flood would have been less severe if existing facilities were fully functioning (left panel: actual extent of flooding; right panel: simulated extent of flooding with fully-functioning flood systems)
Source: Indonesia Ministry of Public Works (2012) Source: Indonesia Ministry of Public Works (2012)
20 “Climate Change Vulnerability Mapping for Southeast Asia". Yusuf, A.A. and H. Francisco, 2009.
Economy and Environment Program for Southeast Asia (EEPSEA). See: http://web.idrc.ca/uploads/user-S/12324196651Mapping_Report.pdf
I n d o n e s i a E c o n o m i c Q u a r t e r l y P o l i c i e s i n f o c u s
THE WORLD BANK | BANK DUNIA December 201231
…while reconfiguring key canal networks at strategic locations strengthens the system to cope with recent urban and physical changes
The recently completed East flood canal offers the possibility to divert excess flows of the main Ciliwung river. The building of a diversion system for the Ciliwung river at the existing main control gate in south Jakarta or further upstream, connecting both the East and West flood canals, and improvements to adjoining canals, would provide further safeguards to the heavily populated city center. Coupled with the normalization of the existing system to original design, an additional 600,000 people could have escaped the direct effects of the 2007 flood event.
In the meantime, better preparation and systematic contingency planning can help improve resilience
Despite the various ongoing and planned efforts to mitigate flood risks in Jakarta, theserisks will continue to threaten the city for the foreseeable future. Contingency planning and investing in flood preparedness are critical to increase the resilience of the city and its population to cope with, adapt to and prepare for the recurring flood events, thereby reducing their vulnerability to these risks.
Sophisticated contingency planning tools are being developed and introduced to help city managers and planners…
In recent months, a more sophisticated contingency planning tool has been introduced through an initiative led by the Indonesian National Agency for Disaster Management (BNPB) to develop a practical tool to support sub-national disaster management agencies (BPBDs) during emergency contingency planning. A partnership between the BNPB, the Australia-Indonesia Facility for Disaster Reduction (AIFDR), and the Global Facility for Disaster Reduction and Recovery (GFDRR) has developed a contingency planning tool based on hazard impact modeling. This tool is aimed at providing planners with prior knowledge of who will be impacted and what will be damaged in the event of a particular natural disaster event. This tool – named the Indonesia Scenario Assessment for Emergencies (InaSAFE)21 – was officially launched at the 5th Asian Ministerial Conference on Disaster Risk Reduction (AMCDRR) in October 2012.
…which would significantly increase resilience and reduce vulnerability, if they are mainstreamed and constantly augmented on with ever improving and accurate data
Through answering a series of questions about a potential disaster scenario, the InaSAFE hazard impact modeling tool can be used to produce maps and reports to estimate potential damage, along with recommended actions for emergency managers. This tool was tested during the 2011-2012 Jakarta flood season and proved effective in providing an understanding of hazard impacts and communicating them to support disaster risk management decisions. Participatory mapping tools (e.g., OpenStreetMap) have been used to collect high resolution baseline data of critical infrastructure in Jakarta through collaboration between the Jakarta Provincial Disaster Management Agency (BPBD), theHumanitarian OpenStreet Team (HOT) and University of Indonesia, supported by several international development organizations. These, together with hazard data from technical agencies and demographic data from the national census, were used to produce visualizations of the impact of different flood scenarios on critical infrastructure (e.g., roads, schools or hospitals) and populations in flood prone areas across Jakarta. The tool calculates the number of structures or areas that could be flooded under different scenarios, giving the exact location of the affected areas and infrastructure to support contingency planning. The tool can also be used to support risk-based land-use planning, determining priorities for infrastructure retrofitting, real-time impact forecasts, or for a Post Disaster Needs Assessment (PDNA).
Through a combination of these different measures Jakarta can be made more resilient to flood risks, supporting the economic development of the city and the livelihoods of its population
As Jakarta continues to undertake flood mitigation both through structural measures, such as river dredging, canal improvement or construction of retention basins, and non-structural measures such as catchment rehabilitation, community preparedness and contingency planning, the city will better adapt to the increasing frequency and intensity of flooding. While the poor have always been disproportionately affected, they also show the most resilience, mainly out of necessity and the lack of choices that they can make. But, through increased awareness of flood risk, early warning and prediction, as well as real-time flood information dissemination including through the social media, all inhabitants of Jakarta, be they individuals, corporations or public agencies, can adapt their lives and make their respective contingency planning to ensure safety, business continuity andsecured livelihood. Jakartans have shown extreme patience in dealing and coping with problems on a daily basis. With a few more systematic and comprehensive flood mitigation investments, and an effective information dissemination and contingency system, Jakarta could emerge as a flood resilient city.
21 For more detail information, please visit : www.inasafe.org
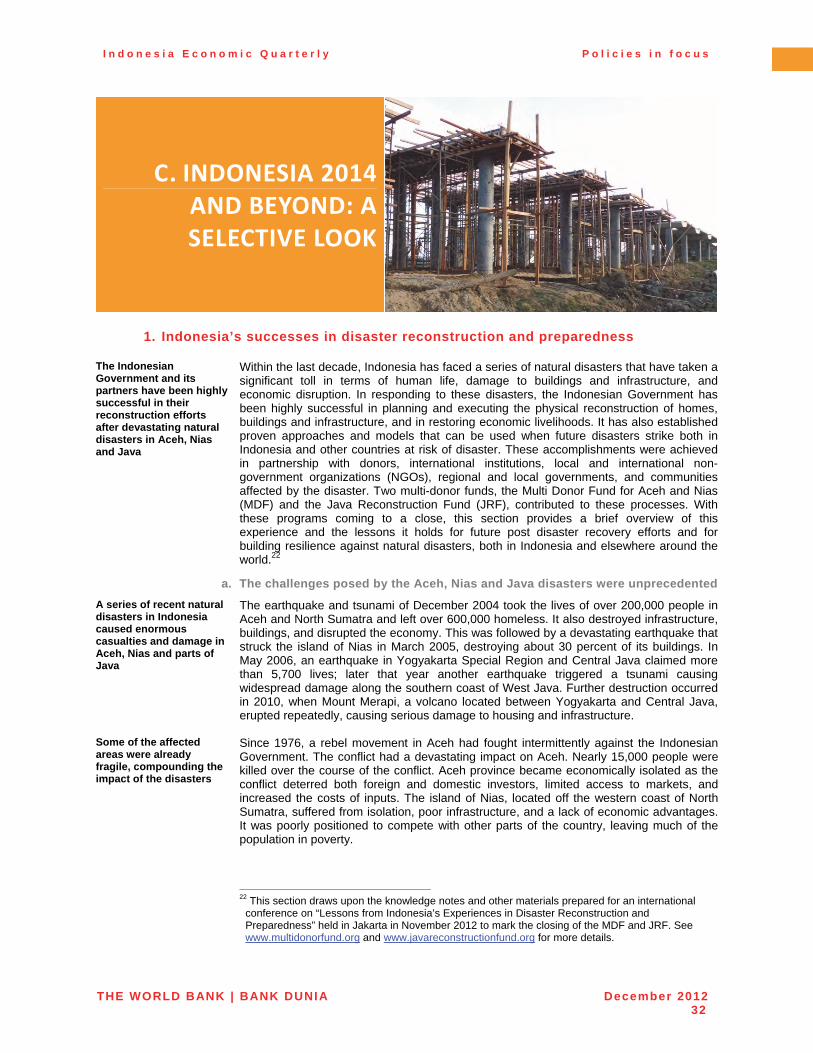
I n d o n e s i a E c o n o m i c Q u a r t e r l y P o l i c i e s i n f o c u s
THE WORLD BANK | BANK DUNIA December 201232
C. INDONESIA 2014 AND BEYOND: A SELECTIVE LOOK
1. Indonesia’s successes in disaster reconstruction and preparedness
The Indonesian Government and its partners have been highly successful in their reconstruction efforts after devastating natural disasters in Aceh, Nias and Java
Within the last decade, Indonesia has faced a series of natural disasters that have taken a significant toll in terms of human life, damage to buildings and infrastructure, and economic disruption. In responding to these disasters, the Indonesian Government has been highly successful in planning and executing the physical reconstruction of homes, buildings and infrastructure, and in restoring economic livelihoods. It has also established proven approaches and models that can be used when future disasters strike both in Indonesia and other countries at risk of disaster. These accomplishments were achieved in partnership with donors, international institutions, local and international non-government organizations (NGOs), regional and local governments, and communities affected by the disaster. Two multi-donor funds, the Multi Donor Fund for Aceh and Nias (MDF) and the Java Reconstruction Fund (JRF), contributed to these processes. With these programs coming to a close, this section provides a brief overview of this experience and the lessons it holds for future post disaster recovery efforts and for building resilience against natural disasters, both in Indonesia and elsewhere around the world.22
a. The challenges posed by the Aceh, Nias and Java disasters were unprecedented
A series of recent natural disasters in Indonesia caused enormous casualties and damage in Aceh, Nias and parts of Java
The earthquake and tsunami of December 2004 took the lives of over 200,000 people in Aceh and North Sumatra and left over 600,000 homeless. It also destroyed infrastructure, buildings, and disrupted the economy. This was followed by a devastating earthquake that struck the island of Nias in March 2005, destroying about 30 percent of its buildings. In May 2006, an earthquake in Yogyakarta Special Region and Central Java claimed more than 5,700 lives; later that year another earthquake triggered a tsunami causing widespread damage along the southern coast of West Java. Further destruction occurred in 2010, when Mount Merapi, a volcano located between Yogyakarta and Central Java, erupted repeatedly, causing serious damage to housing and infrastructure.
Some of the affected areas were already fragile, compounding the impact of the disasters
Since 1976, a rebel movement in Aceh had fought intermittently against the Indonesian Government. The conflict had a devastating impact on Aceh. Nearly 15,000 people were killed over the course of the conflict. Aceh province became economically isolated as the conflict deterred both foreign and domestic investors, limited access to markets, and increased the costs of inputs. The island of Nias, located off the western coast of North Sumatra, suffered from isolation, poor infrastructure, and a lack of economic advantages. It was poorly positioned to compete with other parts of the country, leaving much of the population in poverty.
22 This section draws upon the knowledge notes and other materials prepared for an international
conference on “Lessons from Indonesia’s Experiences in Disaster Reconstruction and Preparedness” held in Jakarta in November 2012 to mark the closing of the MDF and JRF. See www.multidonorfund.org and www.javareconstructionfund.org for more details.
I n d o n e s i a E c o n o m i c Q u a r t e r l y P o l i c i e s i n f o c u s
THE WORLD BANK | BANK DUNIA December 201233
Managing the generous contributions in aid presented challenges in the recovery process
Both Indonesia and the international community were generous in providing aid in response to the disasters. Supplies, funding, and expertise were mobilized to support relief and reconstruction efforts. Total contributions from the Indonesian Government and international donors reached USD 6.7 billion for the reconstruction of Aceh and Nias. Hundreds of organizations established themselves in Aceh and Nias. While this assistance was both needed and welcomed, managing such huge resources presented major challenges for government, which led the reconstruction effort. Defining a clear reconstruction strategy, directing resources to support it, and managing funds in an efficient, transparent way was critical for the success of the overall reconstruction effort. Coordination of the many players on the ground was also essential to avoid duplication of effort and ensure an efficient usage of resources.
b. Multi-donor funds supported Government-led relief and reconstruction efforts
The Indonesian Government led and coordinated the relief and reconstruction process in Aceh and Nias with support from the MDF
The Government of Indonesia managed each stage of the relief and recovery process. Given the scale of the disaster in Aceh and Nias, it established the Agency for the Rehabilitation and Reconstruction of Aceh and Nias (BRR) to coordinate and manage the process until its closure in 2009. It also requested the establishment of a multi-donor fund with the World Bank acting as trustee to support the overall reconstruction effort. This led to the formation of the MDF, which pooled USD 655 million in contributions from 15 donors, representing nearly 10 percent of total reconstruction funds.23 This approach was designed to simplify the management of funds, focus resources where they were most needed in line with government strategy, and ensure funds would be used in a transparent, cost-efficient way. As such, it was in line with the Paris Declaration on Aid Effectiveness of 2005, which calls for national governments to develop their own development strategies which are then supported by donors towards well-defined goals.
The MDF model was successfully replicated in Java
In response to the 2006 earthquakes in Java a National Transition Team was established for initial coordination until 2008. Later, this role was assumed by the National Development Planning Agency (Bappenas) in coordination with provincial governments and line agencies. Seven donors set up the JRF using the same inclusive governance structure as the MDF, pooling USD 94.1 million.24 The program was expanded in 2010 to address reconstruction efforts following the Merapi eruptions. With the MDF in operation for over a year by the time the Java earthquakes struck, the value of the model as a vehicle for managing aid to support reconstruction had been demonstrated.
The multi donor funds contributed to the reconstruction efforts by providing a framework for government-led partnerships…
The MDF and JRF contributed to the reconstruction efforts by providing an inclusive governance mechanism that provided government, donors, and other key players a platform for discussing issues and making decisions quickly. A Steering Committee consisting of representatives from the Indonesian Government, the World Bank as trustee,donors and civil society coordinated stakeholders, formulated a strategy, developed procedures, and allocated funds to proposed projects.
…adopting a phased approach…
In support of the Government’s reconstruction agenda, the MDF program implemented a strategy using a phased approach to meet the evolving needs of survivors throughout the reconstruction process. After their immediate needs were addressed by the Government, reconstruction support focused on rebuilding homes and communities. As rebuilding progressed, the focus was on major infrastructure to restore transportation links, ensure availability of safe water, provide sanitation, and manage waste. The third phase of the MDF laid the groundwork for long-term development by strengthening key economic sectors, such as coffee, cacao, fisheries and rubber. This approach reflected and reinforced the government’s strategy. The reconstruction efforts in Java also took this approach, starting with housing reconstruction before working on restoring livelihoods.
23 The MDF’s donors were the European Commission, the Netherlands, the United Kingdom, the
World Bank, Sweden, Denmark, Norway, Germany, Canada, Belgium, Finland, the Asian Development Bank, the United States, New Zealand and Ireland.
24 The JRF’s donors were the European Commission, the Netherlands, the United Kingdom, Canada, Finland and Denmark.
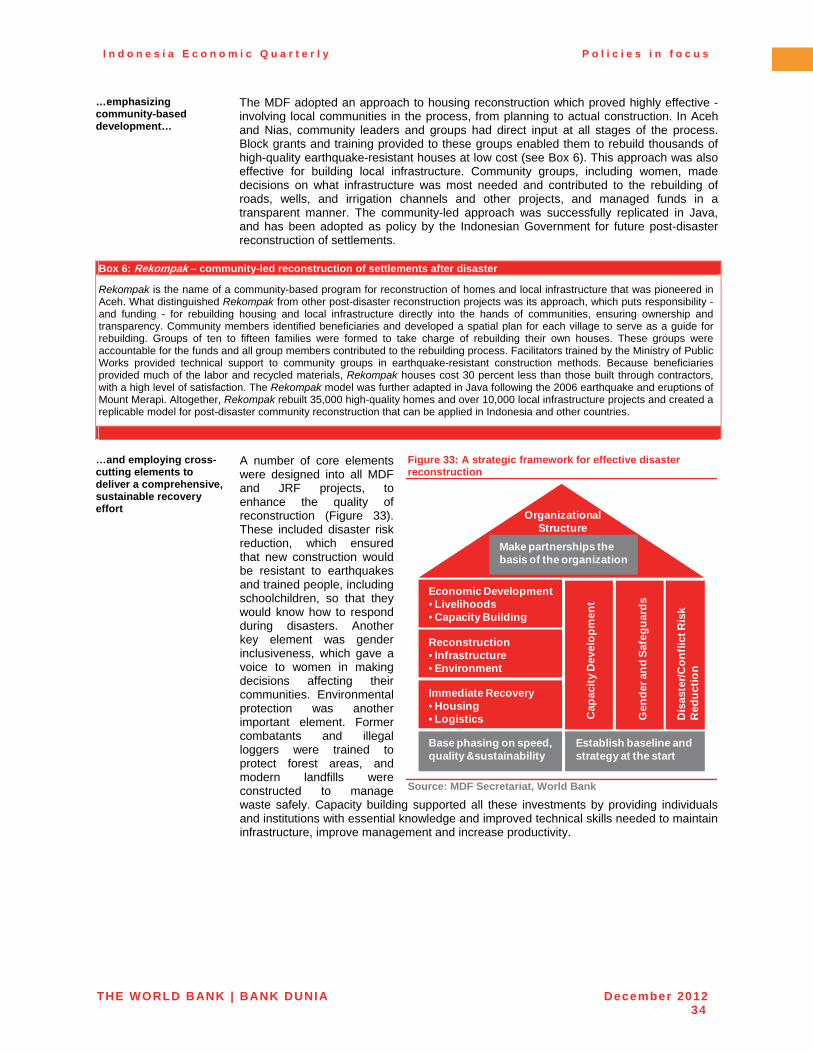
I n d o n e s i a E c o n o m i c Q u a r t e r l y P o l i c i e s i n f o c u s
THE WORLD BANK | BANK DUNIA December 201234
…emphasizing community-based development…
The MDF adopted an approach to housing reconstruction which proved highly effective -involving local communities in the process, from planning to actual construction. In Aceh and Nias, community leaders and groups had direct input at all stages of the process. Block grants and training provided to these groups enabled them to rebuild thousands of high-quality earthquake-resistant houses at low cost (see Box 6). This approach was also effective for building local infrastructure. Community groups, including women, made decisions on what infrastructure was most needed and contributed to the rebuilding of roads, wells, and irrigation channels and other projects, and managed funds in a transparent manner. The community-led approach was successfully replicated in Java, and has been adopted as policy by the Indonesian Government for future post-disaster reconstruction of settlements.
Box 6: Rekompak – community-led reconstruction of settlements after disaster
Rekompak is the name of a community-based program for reconstruction of homes and local infrastructure that was pioneered in Aceh. What distinguished Rekompak from other post-disaster reconstruction projects was its approach, which puts responsibility - and funding - for rebuilding housing and local infrastructure directly into the hands of communities, ensuring ownership and transparency. Community members identified beneficiaries and developed a spatial plan for each village to serve as a guide for rebuilding. Groups of ten to fifteen families were formed to take charge of rebuilding their own houses. These groups were accountable for the funds and all group members contributed to the rebuilding process. Facilitators trained by the Ministry of Public Works provided technical support to community groups in earthquake-resistant construction methods. Because beneficiaries provided much of the labor and recycled materials, Rekompak houses cost 30 percent less than those built through contractors, with a high level of satisfaction. The Rekompak model was further adapted in Java following the 2006 earthquake and eruptions of Mount Merapi. Altogether, Rekompak rebuilt 35,000 high-quality homes and over 10,000 local infrastructure projects and created a replicable model for post-disaster community reconstruction that can be applied in Indonesia and other countries.
…and employing cross-cutting elements to deliver a comprehensive, sustainable recovery effort
A number of core elements were designed into all MDF and JRF projects, to enhance the quality of reconstruction (Figure 33). These included disaster risk reduction, which ensured that new construction would be resistant to earthquakes and trained people, including schoolchildren, so that they would know how to respond during disasters. Another key element was gender inclusiveness, which gave a voice to women in making decisions affecting their communities. Environmental protection was another important element. Former combatants and illegal loggers were trained to protect forest areas, and modern landfills were constructed to manage waste safely. Capacity building supported all these investments by providing individuals and institutions with essential knowledge and improved technical skills needed to maintain infrastructure, improve management and increase productivity.
Figure 33: A strategic framework for effective disaster reconstruction
Source: MDF Secretariat, World Bank
Reconstruction• Infrastructure• Environment
Immediate Recovery• Housing• Logistics
Economic Development• Livelihoods• Capacity Building
Base phasing on speed, quality &sustainability
Establish baseline and strategy at the start
Cap
acit
y D
evel
op
men
t
Gen
der
an
d S
afeg
uar
ds
Dis
aste
r/C
on
flic
t Ris
k R
edu
ctio
n
Make partnerships the basis of the organization
Organizational Structure
I n d o n e s i a E c o n o m i c Q u a r t e r l y P o l i c i e s i n f o c u s
THE WORLD BANK | BANK DUNIA December 201235
c. Applying the lessons that Indonesia has learned on disaster recovery
Indonesia’s experience over the past decade has generated a body of critical knowledge on disaster recovery
Over an eight-year period from 2004, the Indonesian Government responded to a series of natural disasters including, for example, earthquakes and tsunamis, landslides and volcanic eruptions. It was able to apply freshly-learned lessons from one disaster to the next. In this way, it built up a body of knowledge related to disaster response and preparedness. Its experience with the MDF and JRF enabled it to replicate and improve models and approaches to disaster response and preparedness. In the process, Indonesia is now well-positioned to contribute to the global body of knowledge on these issues, so that others can benefit from these lessons and experience to better manage future disasters and reduce their impact.
The experience also prompted the Government of Indonesia to make policy changes in disaster planning and response, including the establishment of the National Disaster Management Agency…
Following the experience of the disasters in Aceh, Nias and Java, the Indonesian Government has put in place a number of new policies to improve disaster management, preparedness and response. In 2008 the National Disaster Management Agency (BNPB) was established. Its role includes formulating disaster management policy, coordinating the government’s response to disasters, disaster preparedness, and providing information relevant to disasters. It operates at both national and regional levels. The BNPBcoordinated the development of the National Disaster Management Plan for 2010-2014, which includes a number of components drawn from the MDF and JRF. These include the integration of disaster risk reduction in development programs, capacity building, community-based disaster management, and enhancing the role of government partners.25
…and the Indonesia Disaster Fund
In 2010, the Government also established the Indonesia Disaster Fund (IDF). The IDF was established to fund and coordinate disaster recovery efforts and disaster preparedness with international support. This donor trust fund operates through two windows, one administered by the World Bank and the other by the United Nations. The IDF also incorporates a number of features successfully employed by the MDF and JRF, including alignment with government strategy, a steering committee, technical committee, and focus areas including housing, livelihoods, and capacity building.
Some of the key lessons include the fact that reconstruction efforts benefit from an over-arching strategic framework…
A number of important lessons for reconstruction efforts can also be drawn out from Indonesia’s experience. In terms of overall strategies, a framework for reconstruction based on three interrelated strategies of strong partnerships, effective implementation, and cross-cutting elements was found to be successful. Overarching organizational structures, such as those provided by the MDF and JRF, enable a government and its partners to make effective program decisions, design appropriate projects and execute them efficiently. In addition, a mix of partners and implementers brought together core competencies and comparative advantages to address a wide range of needs. For donor-funded support it is important to have solid monitoring and evaluation, regular reporting, clear communications, and good funds management to ensure that each project supports the Government’s reconstruction strategy.
...community-led development delivers…
The evidence from Indonesia shows that community-driven approaches can be adaptedeffectively for post-disaster reconstruction to deliver cost-effective, equitable and sustainable local level recovery. As discussed in Box 6 on the Rekompak program, the experiences of community recovery projects implemented under the MDF and JRFdemonstrate that disaster-affected communities are able to manage reconstruction resources and projects to high-levels of quality and satisfaction while benefitting from increased confidence and capacities brought by the consultative and participatoryapproaches. At the same time, the community driven approach encourages faster social recovery and builds capacities that will last well beyond the reconstruction.
…building capacity should be an integral feature for sustainable results…
Capacity building proved to be crucial in the sustainability of investments made in serviceprovision and economic development. Capacity-building strategies ranged fromempowering communities to participate in the rebuilding of housing and community infrastructure to strengthening skills and systems for local governments to managereconstruction assets, to organizational development for local government to better
25 Indonesia National Agency for Disaster Management. Disaster Management Plan / 2010-2014, pp.
80-83. http://www.bnpb.go.id/website/file/pubnew/99.pdf
I n d o n e s i a E c o n o m i c Q u a r t e r l y P o l i c i e s i n f o c u s
THE WORLD BANK | BANK DUNIA December 201236
address public sector management. Capacity building was found to be most effective when woven into each project and program initiative at entry, with its design and intensity reflecting the challenges of sustainability and the exit strategy of the supporting actors.
…post-disaster reconstruction of infrastructure can benefit from a sequenced approach…
The experiences in Aceh and Nias demonstrate that a sequenced approach to infrastructure investments, and, indeed, to overall reconstruction, based on balancing the need for urgency with the need for quality and ownership, can be highly effective inmanaging short-term expectations while delivering long lasting results. For example, the MDF’s initial infrastructure investments focused on immediate logistics needs to restorevital transport links and provide access to affected areas. Once these were established, the MDF redirected attention to large scale infrastructure reconstruction. Investments in large infrastructure have critical quality and ownership requirements that may supersede speed considerations, and care needed to be taken to balance the cost of speed againstthe cost of delay. Later, the scope of this work expanded to provide training to agencies responsible for managing the newly created assets.
…and gender equality and women’s empowerment improves results
Another important lesson that can be drawn from the experiences of the MDF and JRF was that supporting gender equality and women’s empowerment in reconstruction efforts led to better results and increased resilience. Women’s participation improved quality, cost efficiency and increased satisfaction, and sped up economic recovery. Women benefited from stronger legal and land ownership rights, which in turn gave women entrepreneurs better access to credit. Their active participation in local decision-making processesincreased social cohesion and improved outcomes, such as an increase in the provision of public goods such as water, sanitation and health clinics.
Valuable knowledge generated through Indonesia’s experience on disaster reconstruction and preparedness has been delivered back to the global community…
As mentioned, the experience over nearly eight years of responding to a series of disasters, and applying lessons learned, have given the Indonesian government extensive experience and knowledge in disaster management. Much of this has been embedded in its policies and newly-formed government bodies, such as the BNPB, and in educational institutions such as the Gadjah Mada University in Yogyakarta and the Tsunami Research Center in Banda Aceh. Other countries, including Haiti and Pakistan, have studied Indonesia’s disaster response methods in designing their own post-disaster strategies. Indonesia, which has benefitted from international support in the wake of disasters, is now able to give back to the global community lessons for the future.
…including through knowledge-sharing events across disaster-prone countries…
In November 2012, the closing of the MDF and JRF were marked by an international conference in Jakarta on “Lessons from Indonesia’s Experiences in Disaster Reconstruction and Preparedness” which shared global experiences in post-disaster reconstruction and preparedness. The conference drew over 500 participants including dignitaries from disaster prone countries including Japan, Pakistan, and Haiti. It coveredmany aspects of post-disaster reconstruction and preparedness, including the community-led approach to housing reconstruction, post-disaster livelihoods recovery, gender and capacity development, mainstreaming disaster risk reduction, and knowledge sharing.
…with the aim of delivering a legacy of further improvements in disaster response, resilience and preparedness into the future
Indonesia has set a new standard for disaster response through its experiences in Aceh, Nias and Java. This is critical in a country which, by virtue of geography, will face natural disasters again. But the Indonesia government’s successful approach to natural disaster response and preparedness will save countless lives in the future. Its approach is proven and has been successfully replicated to address different kinds of disasters and contexts. As a significant contributor to the reconstruction results, the MDF and JRF programs have been documenting their models, approaches, and experiences. The lessons Indonesia has learned through its massive recovery efforts will ensure that a legacy of improved response, resilience and preparedness will endure into the future.
I n d o n e s i a E c o n o m i c Q u a r t e r l y P o l i c i e s i n f o c u s
THE WORLD BANK | BANK DUNIA December 201237
2. Village infrastructure for basic service delivery
Positive trends in Indonesia’s socioeconomic development over the past decade hide significant region-by-region inequality which is in part due to a lack of human and physical capital for basic services
Since the turn of the millennium, Indonesian real incomes have grown rapidly and reliably while steady progress towards meeting the Millennium Development Goals has been made. However, robust national averages and trends hide a more troubling regional picture: individual provinces, districts, and villages are not all progressing at the same high rate. While there are many likely factors behind this unequal distribution, an impossible-to-ignore constraint to better performance in all Indonesian regions lies in the availability of the human and physical capital necessary for basic service provision. Using the findings of the recent Village Infrastructure Census this section highlights some of the key spatial divergences in health, education and infrastructure service delivery across the country and discusses how this new highly disaggregated data may be used to inform future policies to address this inequality of progress.
a. What is the Village Infrastructure Census and why is it necessary?
The VIC provides insights into a more equitable, targeted and potentially more rational system of resource transfers from the central government to local governments…
A recent Village Infrastructure Census (VIC), commissioned by the Vice President’s Office for the Acceleration of Poverty Reduction (TNP2K), developed in collaboration with the PNPM Support Facility (PSF),26 and undertaken by the Central Statistics Agency (BPS), demonstrates the size and shape of the deficiencies in the ability to provide basic health, education, and transportation services across different villages. The VIC is regarded by TNP2K and the Government as the first step toward remedying the inequality of progress. The insights from the VIC can be used to inform the development of a plan for spending resources more equitably; for improving the targeting of development spending priorities, and potentially for pointing the way towards a more rational system of resource transfers (from central to local governments) to better match needs and capacities. The portrait of basic service supply readiness in Indonesian regions drawn from the VIC can also be used to quantify the remaining gaps in health, education, and transportation, i.e. the investments required to meet basic service standards, and estimate the cost of filling those gaps.
…by collecting detailed facility-level information...
The VIC provides detailed facility-level information on public health and education facilities, covering a total of 166,506 health facilities and 164,561 schools across the country. The 2011 PODES (Potensi Desa) core survey (also a village-by-village census) is used to complement the VIC data by providing observations on the quantity and quality of intra- and inter-village transportation and the quantity of health and education providers. The resulting combined database provides in-depth information on the quantity, quality, and accessibility of existing basic, public service-oriented infrastructure.
…and assesses supply-side weaknesses to quantify the cost of remedying them
Combined with further analyses and reports, commissioned jointly by TNP2K and PSF, this information provides a comprehensive assessment of the local-level availability of basic facilities and services in health, education, and transport. The database is rich enough to generate a nuanced picture of “supply readiness” through the construction of indices combining several different indicators of the human and physical capital necessary for the provision of services. The indicators entering the supply readiness indices are available at the village level, which provides a very high resolution picture and will enable policy recommendations to be tailored to any level of regional disaggregation.
b. The VIC combines a range of indicators to provide Supply Readiness Indices
The VIC provides information on three rough categories of basic service supply quantity and quality…
Indicators entering the VIC-based supply readiness indices can be grouped into roughly three categories, according to the type of information they provide, namely on the availability and accessibility of facilities, on the presence and qualification of personnel, and on the physical characteristics of facilities. Table 7 provides more detail on the selected indicators for health , education, and transportation services, respectively. As a general rule, the selected indicators of supply readiness take a value between 0 and 1, reflecting the share of the population, facility or geographic area that meet a supply readiness norm or threshold. 26 The PNPM Support Facility (PSF) was established by the Government of Indonesia and supported
by multi-donor grants provided by the Governments of Australia, Denmark, the Netherlands, United Kingdom, United States, and the European Union. The grants are administered by the World Bank. The VIC final report will be made available on both the TNP2K and PSF websites beginning February 2013. For more details see http://pnpm-support.org/.
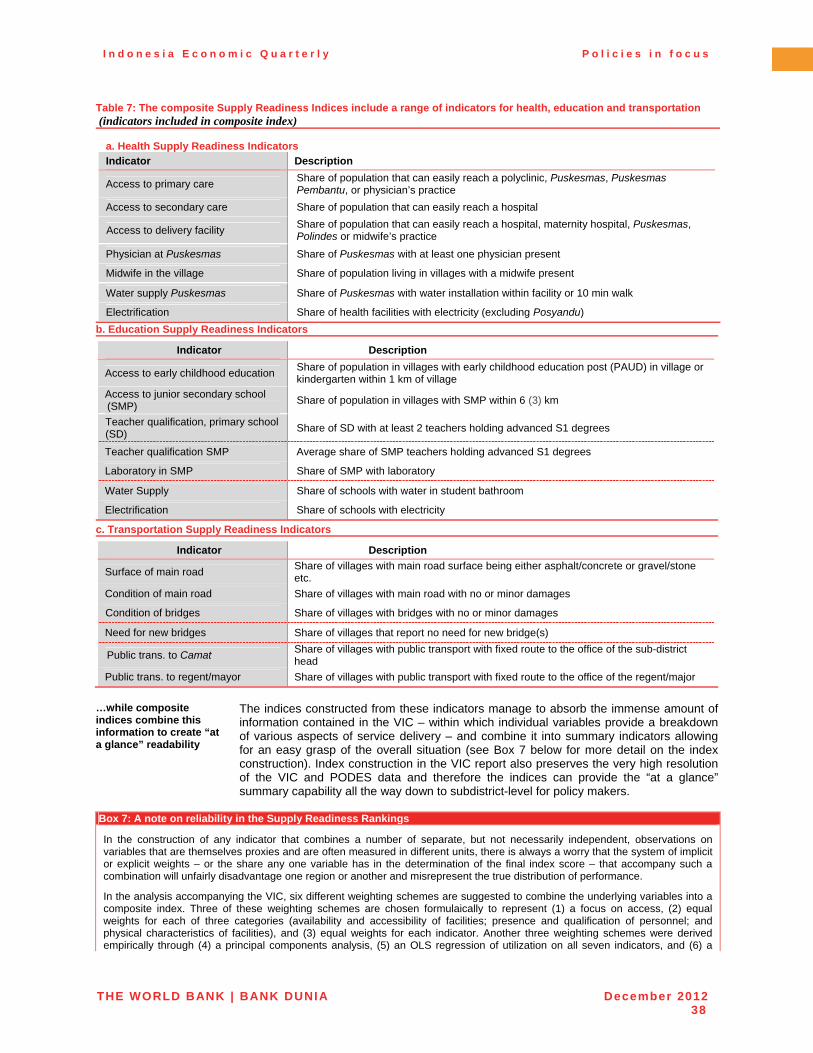
I n d o n e s i a E c o n o m i c Q u a r t e r l y P o l i c i e s i n f o c u s
THE WORLD BANK | BANK DUNIA December 201238
Table 7: The composite Supply Readiness Indices include a range of indicators for health, education and transportation (indicators included in composite index)
a. Health Supply Readiness Indicators
Indicator Description
Access to primary care Share of population that can easily reach a polyclinic, Puskesmas, Puskesmas Pembantu, or physician’s practice
Access to secondary care Share of population that can easily reach a hospital
Access to delivery facility Share of population that can easily reach a hospital, maternity hospital, Puskesmas, Polindes or midwife’s practice
Physician at Puskesmas Share of Puskesmas with at least one physician present
Midwife in the village Share of population living in villages with a midwife present
Water supply Puskesmas Share of Puskesmas with water installation within facility or 10 min walk
Electrification Share of health facilities with electricity (excluding Posyandu)
b. Education Supply Readiness Indicators
Indicator Description
Access to early childhood education Share of population in villages with early childhood education post (PAUD) in village or kindergarten within 1 km of village
Access to junior secondary school (SMP)
Share of population in villages with SMP within 6 (3) km
Teacher qualification, primary school (SD)
Share of SD with at least 2 teachers holding advanced S1 degrees
Teacher qualification SMP Average share of SMP teachers holding advanced S1 degrees
Laboratory in SMP Share of SMP with laboratory
Water Supply Share of schools with water in student bathroom
Electrification Share of schools with electricity
c. Transportation Supply Readiness Indicators
Indicator Description
Surface of main road Share of villages with main road surface being either asphalt/concrete or gravel/stone etc.
Condition of main road Share of villages with main road with no or minor damages
Condition of bridges Share of villages with bridges with no or minor damages
Need for new bridges Share of villages that report no need for new bridge(s)
Public trans. to Camat Share of villages with public transport with fixed route to the office of the sub-district head
Public trans. to regent/mayor Share of villages with public transport with fixed route to the office of the regent/major
…while composite indices combine this information to create “at a glance” readability
The indices constructed from these indicators manage to absorb the immense amount of information contained in the VIC – within which individual variables provide a breakdown of various aspects of service delivery – and combine it into summary indicators allowingfor an easy grasp of the overall situation (see Box 7 below for more detail on the index construction). Index construction in the VIC report also preserves the very high resolution of the VIC and PODES data and therefore the indices can provide the “at a glance” summary capability all the way down to subdistrict-level for policy makers.
Box 7: A note on reliability in the Supply Readiness Rankings
In the construction of any indicator that combines a number of separate, but not necessarily independent, observations on variables that are themselves proxies and are often measured in different units, there is always a worry that the system of implicit or explicit weights – or the share any one variable has in the determination of the final index score – that accompany such a combination will unfairly disadvantage one region or another and misrepresent the true distribution of performance.
In the analysis accompanying the VIC, six different weighting schemes are suggested to combine the underlying variables into a composite index. Three of these weighting schemes are chosen formulaically to represent (1) a focus on access, (2) equal weights for each of three categories (availability and accessibility of facilities; presence and qualification of personnel; and physical characteristics of facilities), and (3) equal weights for each indicator. Another three weighting schemes were derived empirically through (4) a principal components analysis, (5) an OLS regression of utilization on all seven indicators, and (6) a
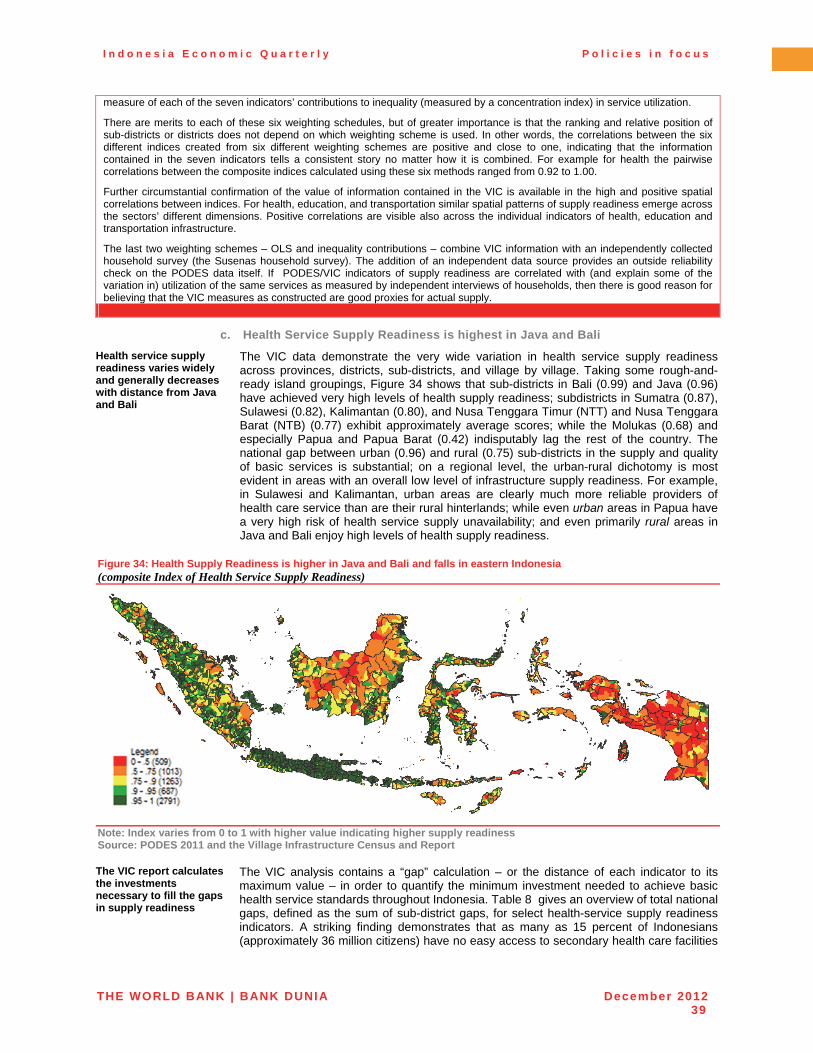
I n d o n e s i a E c o n o m i c Q u a r t e r l y P o l i c i e s i n f o c u s
THE WORLD BANK | BANK DUNIA December 201239
measure of each of the seven indicators’ contributions to inequality (measured by a concentration index) in service utilization.
There are merits to each of these six weighting schedules, but of greater importance is that the ranking and relative position of sub-districts or districts does not depend on which weighting scheme is used. In other words, the correlations between the six different indices created from six different weighting schemes are positive and close to one, indicating that the information contained in the seven indicators tells a consistent story no matter how it is combined. For example for health the pairwise correlations between the composite indices calculated using these six methods ranged from 0.92 to 1.00.
Further circumstantial confirmation of the value of information contained in the VIC is available in the high and positive spatial correlations between indices. For health, education, and transportation similar spatial patterns of supply readiness emerge across the sectors’ different dimensions. Positive correlations are visible also across the individual indicators of health, education and transportation infrastructure.
The last two weighting schemes – OLS and inequality contributions – combine VIC information with an independently collected household survey (the Susenas household survey). The addition of an independent data source provides an outside reliability check on the PODES data itself. If PODES/VIC indicators of supply readiness are correlated with (and explain some of the variation in) utilization of the same services as measured by independent interviews of households, then there is good reason for believing that the VIC measures as constructed are good proxies for actual supply.
c. Health Service Supply Readiness is highest in Java and Bali
Health service supply readiness varies widely and generally decreases with distance from Java and Bali
The VIC data demonstrate the very wide variation in health service supply readiness across provinces, districts, sub-districts, and village by village. Taking some rough-and-ready island groupings, Figure 34 shows that sub-districts in Bali (0.99) and Java (0.96) have achieved very high levels of health supply readiness; subdistricts in Sumatra (0.87), Sulawesi (0.82), Kalimantan (0.80), and Nusa Tenggara Timur (NTT) and Nusa Tenggara Barat (NTB) (0.77) exhibit approximately average scores; while the Molukas (0.68) and especially Papua and Papua Barat (0.42) indisputably lag the rest of the country. Thenational gap between urban (0.96) and rural (0.75) sub-districts in the supply and quality of basic services is substantial; on a regional level, the urban-rural dichotomy is most evident in areas with an overall low level of infrastructure supply readiness. For example, in Sulawesi and Kalimantan, urban areas are clearly much more reliable providers of health care service than are their rural hinterlands; while even urban areas in Papua have a very high risk of health service supply unavailability; and even primarily rural areas in Java and Bali enjoy high levels of health supply readiness.
Figure 34: Health Supply Readiness is higher in Java and Bali and falls in eastern Indonesia (composite Index of Health Service Supply Readiness)
Note: Index varies from 0 to 1 with higher value indicating higher supply readiness Source: PODES 2011 and the Village Infrastructure Census and Report
The VIC report calculates the investments necessary to fill the gaps in supply readiness
The VIC analysis contains a “gap” calculation – or the distance of each indicator to its maximum value – in order to quantify the minimum investment needed to achieve basic health service standards throughout Indonesia. Table 8 gives an overview of total national gaps, defined as the sum of sub-district gaps, for select health-service supply readiness indicators. A striking finding demonstrates that as many as 15 percent of Indonesians (approximately 36 million citizens) have no easy access to secondary health care facilities
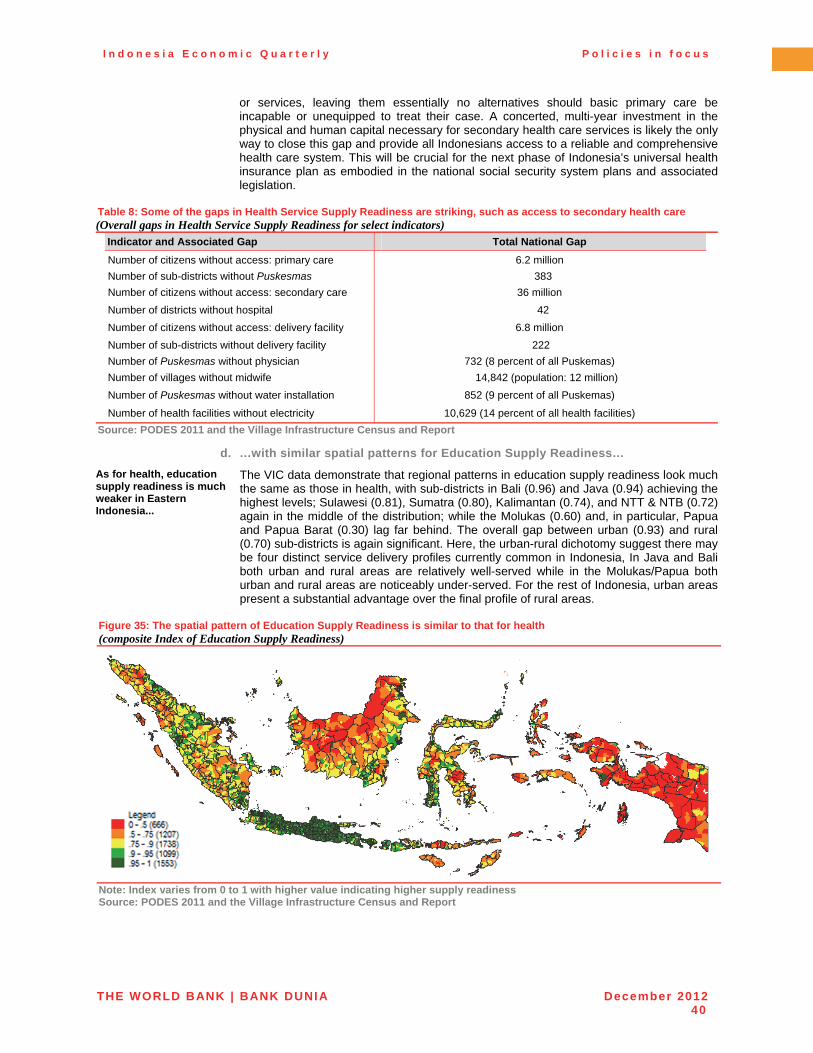
I n d o n e s i a E c o n o m i c Q u a r t e r l y P o l i c i e s i n f o c u s
THE WORLD BANK | BANK DUNIA December 201240
or services, leaving them essentially no alternatives should basic primary care be incapable or unequipped to treat their case. A concerted, multi-year investment in the physical and human capital necessary for secondary health care services is likely the only way to close this gap and provide all Indonesians access to a reliable and comprehensive health care system. This will be crucial for the next phase of Indonesia’s universal health insurance plan as embodied in the national social security system plans and associated legislation.
Table 8: Some of the gaps in Health Service Supply Readiness are striking, such as access to secondary health care (Overall gaps in Health Service Supply Readiness for select indicators)
Indicator and Associated Gap Total National Gap
Number of citizens without access: primary care 6.2 million
Number of sub-districts without Puskesmas 383
Number of citizens without access: secondary care 36 million
Number of districts without hospital 42
Number of citizens without access: delivery facility 6.8 million
Number of sub-districts without delivery facility 222
Number of Puskesmas without physician 732 (8 percent of all Puskemas)
Number of villages without midwife 14,842 (population: 12 million)
Number of Puskesmas without water installation 852 (9 percent of all Puskemas)
Number of health facilities without electricity 10,629 (14 percent of all health facilities)
Source: PODES 2011 and the Village Infrastructure Census and Report
d. …with similar spatial patterns for Education Supply Readiness…
As for health, education supply readiness is much weaker in Eastern Indonesia...
The VIC data demonstrate that regional patterns in education supply readiness look much the same as those in health, with sub-districts in Bali (0.96) and Java (0.94) achieving the highest levels; Sulawesi (0.81), Sumatra (0.80), Kalimantan (0.74), and NTT & NTB (0.72)again in the middle of the distribution; while the Molukas (0.60) and, in particular, Papua and Papua Barat (0.30) lag far behind. The overall gap between urban (0.93) and rural (0.70) sub-districts is again significant. Here, the urban-rural dichotomy suggest there may be four distinct service delivery profiles currently common in Indonesia, In Java and Bali both urban and rural areas are relatively well-served while in the Molukas/Papua both urban and rural areas are noticeably under-served. For the rest of Indonesia, urban areas present a substantial advantage over the final profile of rural areas.
Figure 35: The spatial pattern of Education Supply Readiness is similar to that for health (composite Index of Education Supply Readiness)
Note: Index varies from 0 to 1 with higher value indicating higher supply readiness Source: PODES 2011 and the Village Infrastructure Census and Report
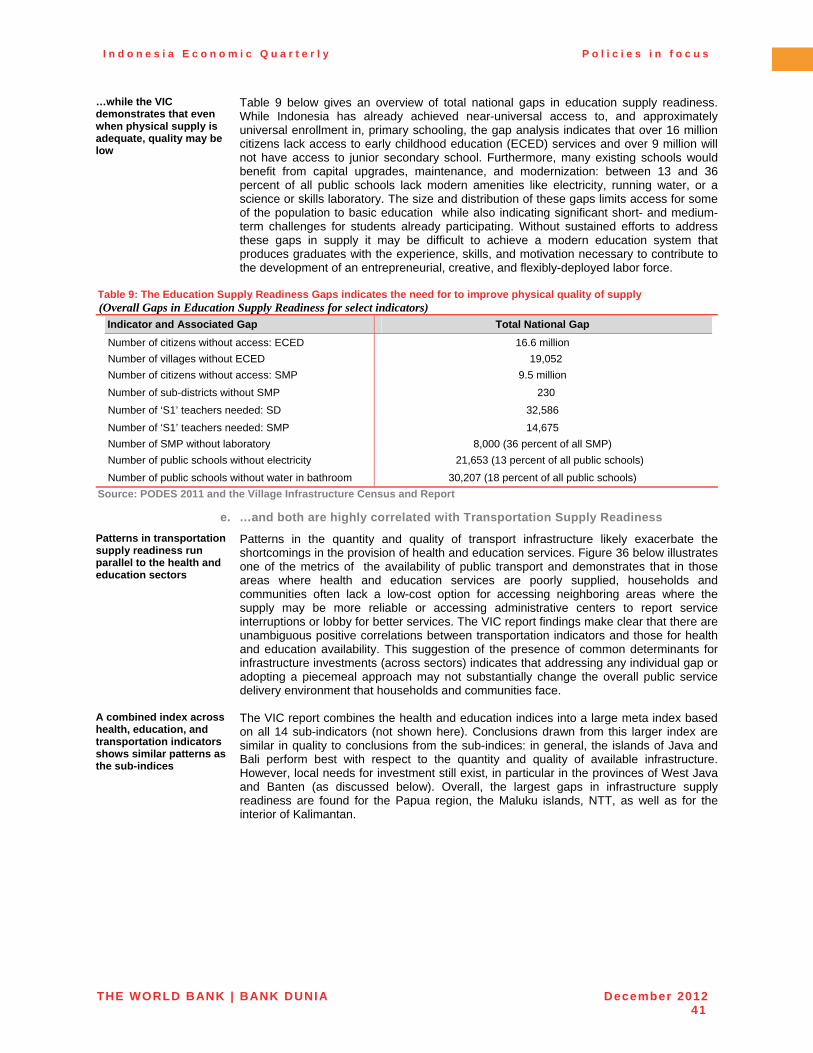
I n d o n e s i a E c o n o m i c Q u a r t e r l y P o l i c i e s i n f o c u s
THE WORLD BANK | BANK DUNIA December 201241
…while the VIC demonstrates that even when physical supply is adequate, quality may be low
Table 9 below gives an overview of total national gaps in education supply readiness. While Indonesia has already achieved near-universal access to, and approximately universal enrollment in, primary schooling, the gap analysis indicates that over 16 million citizens lack access to early childhood education (ECED) services and over 9 million will not have access to junior secondary school. Furthermore, many existing schools would benefit from capital upgrades, maintenance, and modernization: between 13 and 36 percent of all public schools lack modern amenities like electricity, running water, or a science or skills laboratory. The size and distribution of these gaps limits access for some of the population to basic education while also indicating significant short- and medium-term challenges for students already participating. Without sustained efforts to address these gaps in supply it may be difficult to achieve a modern education system that produces graduates with the experience, skills, and motivation necessary to contribute to the development of an entrepreneurial, creative, and flexibly-deployed labor force.
Table 9: The Education Supply Readiness Gaps indicates the need for to improve physical quality of supply (Overall Gaps in Education Supply Readiness for select indicators)
Indicator and Associated Gap Total National Gap
Number of citizens without access: ECED 16.6 million
Number of villages without ECED 19,052
Number of citizens without access: SMP 9.5 million
Number of sub-districts without SMP 230
Number of ‘S1’ teachers needed: SD 32,586
Number of ‘S1’ teachers needed: SMP 14,675
Number of SMP without laboratory 8,000 (36 percent of all SMP)
Number of public schools without electricity 21,653 (13 percent of all public schools)
Number of public schools without water in bathroom 30,207 (18 percent of all public schools)
Source: PODES 2011 and the Village Infrastructure Census and Report
e. …and both are highly correlated with Transportation Supply Readiness
Patterns in transportation supply readiness run parallel to the health and education sectors
Patterns in the quantity and quality of transport infrastructure likely exacerbate the shortcomings in the provision of health and education services. Figure 36 below illustrates one of the metrics of the availability of public transport and demonstrates that in those areas where health and education services are poorly supplied, households and communities often lack a low-cost option for accessing neighboring areas where the supply may be more reliable or accessing administrative centers to report service interruptions or lobby for better services. The VIC report findings make clear that there are unambiguous positive correlations between transportation indicators and those for health and education availability. This suggestion of the presence of common determinants for infrastructure investments (across sectors) indicates that addressing any individual gap or adopting a piecemeal approach may not substantially change the overall public service delivery environment that households and communities face.
A combined index across health, education, and transportation indicators shows similar patterns as the sub-indices
The VIC report combines the health and education indices into a large meta index based on all 14 sub-indicators (not shown here). Conclusions drawn from this larger index are similar in quality to conclusions from the sub-indices: in general, the islands of Java and Bali perform best with respect to the quantity and quality of available infrastructure. However, local needs for investment still exist, in particular in the provinces of West Java and Banten (as discussed below). Overall, the largest gaps in infrastructure supply readiness are found for the Papua region, the Maluku islands, NTT, as well as for the interior of Kalimantan.
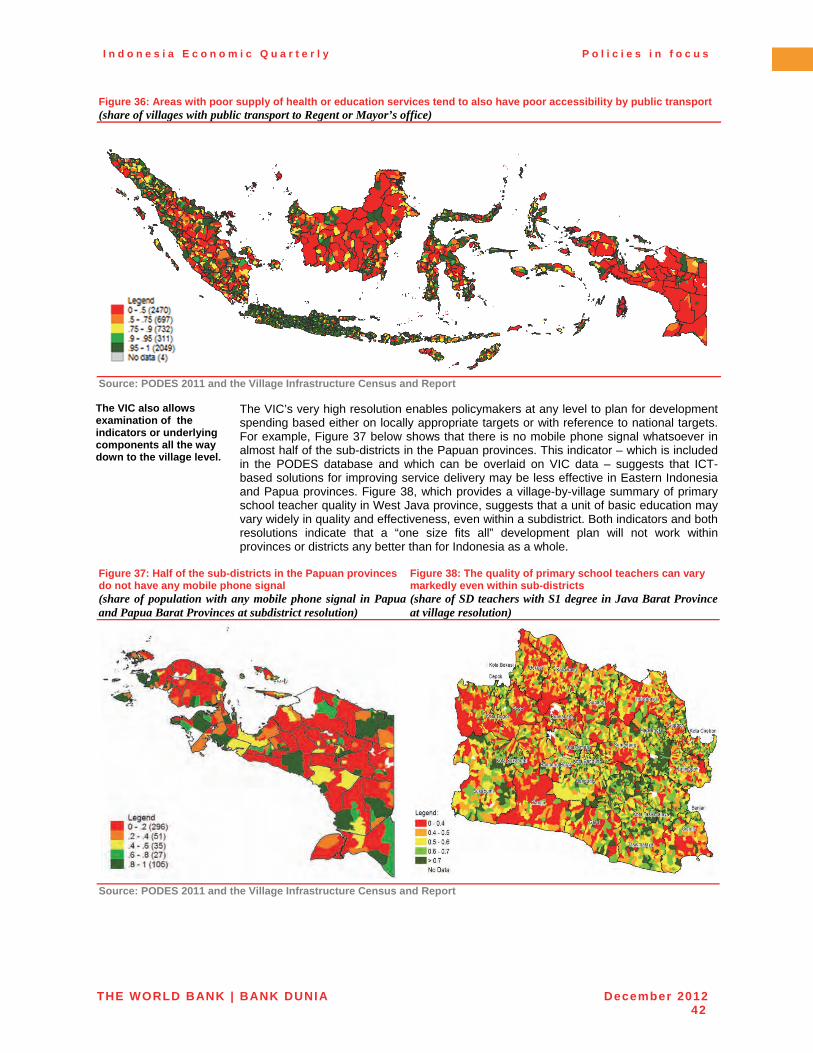
I n d o n e s i a E c o n o m i c Q u a r t e r l y P o l i c i e s i n f o c u s
THE WORLD BANK | BANK DUNIA December 201242
Figure 36: Areas with poor supply of health or education services tend to also have poor accessibility by public transport (share of villages with public transport to Regent or Mayor’s office)
Source: PODES 2011 and the Village Infrastructure Census and Report
The VIC also allows examination of the indicators or underlying components all the way down to the village level.
The VIC’s very high resolution enables policymakers at any level to plan for development spending based either on locally appropriate targets or with reference to national targets. For example, Figure 37 below shows that there is no mobile phone signal whatsoever in almost half of the sub-districts in the Papuan provinces. This indicator – which is included in the PODES database and which can be overlaid on VIC data – suggests that ICT-based solutions for improving service delivery may be less effective in Eastern Indonesia and Papua provinces. Figure 38, which provides a village-by-village summary of primary school teacher quality in West Java province, suggests that a unit of basic education may vary widely in quality and effectiveness, even within a subdistrict. Both indicators and both resolutions indicate that a “one size fits all” development plan will not work within provinces or districts any better than for Indonesia as a whole.
Figure 37: Half of the sub-districts in the Papuan provinces do not have any mobile phone signal (share of population with any mobile phone signal in Papua and Papua Barat Provinces at subdistrict resolution)
Figure 38: The quality of primary school teachers can vary markedly even within sub-districts (share of SD teachers with S1 degree in Java Barat Province at village resolution)
Source: PODES 2011 and the Village Infrastructure Census and Report
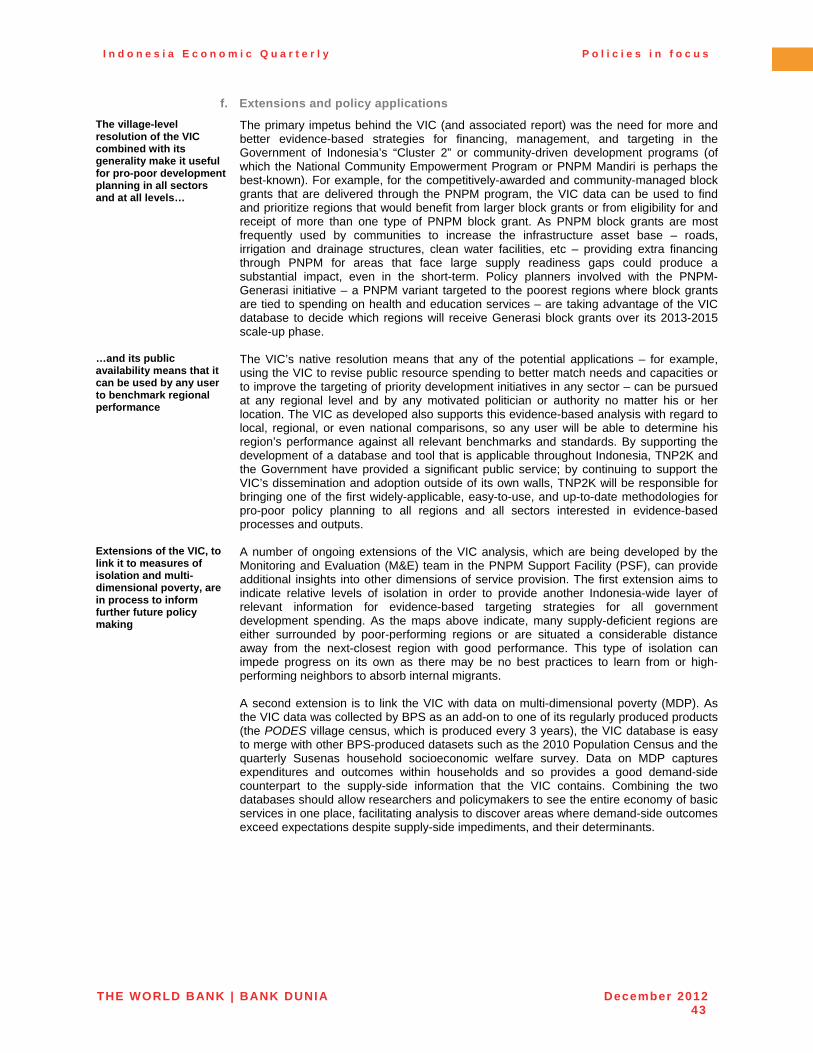
I n d o n e s i a E c o n o m i c Q u a r t e r l y P o l i c i e s i n f o c u s
THE WORLD BANK | BANK DUNIA December 201243
f. Extensions and policy applications
The village-level resolution of the VIC combined with its generality make it useful for pro-poor development planning in all sectors and at all levels…
The primary impetus behind the VIC (and associated report) was the need for more and better evidence-based strategies for financing, management, and targeting in the Government of Indonesia’s “Cluster 2” or community-driven development programs (of which the National Community Empowerment Program or PNPM Mandiri is perhaps the best-known). For example, for the competitively-awarded and community-managed block grants that are delivered through the PNPM program, the VIC data can be used to find and prioritize regions that would benefit from larger block grants or from eligibility for and receipt of more than one type of PNPM block grant. As PNPM block grants are most frequently used by communities to increase the infrastructure asset base – roads, irrigation and drainage structures, clean water facilities, etc – providing extra financing through PNPM for areas that face large supply readiness gaps could produce a substantial impact, even in the short-term. Policy planners involved with the PNPM-Generasi initiative – a PNPM variant targeted to the poorest regions where block grants are tied to spending on health and education services – are taking advantage of the VIC database to decide which regions will receive Generasi block grants over its 2013-2015 scale-up phase.
…and its public availability means that it can be used by any user to benchmark regional performance
The VIC’s native resolution means that any of the potential applications – for example, using the VIC to revise public resource spending to better match needs and capacities or to improve the targeting of priority development initiatives in any sector – can be pursued at any regional level and by any motivated politician or authority no matter his or her location. The VIC as developed also supports this evidence-based analysis with regard to local, regional, or even national comparisons, so any user will be able to determine his region’s performance against all relevant benchmarks and standards. By supporting the development of a database and tool that is applicable throughout Indonesia, TNP2K and the Government have provided a significant public service; by continuing to support the VIC’s dissemination and adoption outside of its own walls, TNP2K will be responsible for bringing one of the first widely-applicable, easy-to-use, and up-to-date methodologies for pro-poor policy planning to all regions and all sectors interested in evidence-based processes and outputs.
Extensions of the VIC, to link it to measures of isolation and multi-dimensional poverty, are in process to inform further future policy making
A number of ongoing extensions of the VIC analysis, which are being developed by the Monitoring and Evaluation (M&E) team in the PNPM Support Facility (PSF), can provide additional insights into other dimensions of service provision. The first extension aims to indicate relative levels of isolation in order to provide another Indonesia-wide layer of relevant information for evidence-based targeting strategies for all government development spending. As the maps above indicate, many supply-deficient regions are either surrounded by poor-performing regions or are situated a considerable distance away from the next-closest region with good performance. This type of isolation can impede progress on its own as there may be no best practices to learn from or high-performing neighbors to absorb internal migrants. A second extension is to link the VIC with data on multi-dimensional poverty (MDP). As the VIC data was collected by BPS as an add-on to one of its regularly produced products (the PODES village census, which is produced every 3 years), the VIC database is easy to merge with other BPS-produced datasets such as the 2010 Population Census and the quarterly Susenas household socioeconomic welfare survey. Data on MDP captures expenditures and outcomes within households and so provides a good demand-side counterpart to the supply-side information that the VIC contains. Combining the two databases should allow researchers and policymakers to see the entire economy of basic services in one place, facilitating analysis to discover areas where demand-side outcomes exceed expectations despite supply-side impediments, and their determinants.
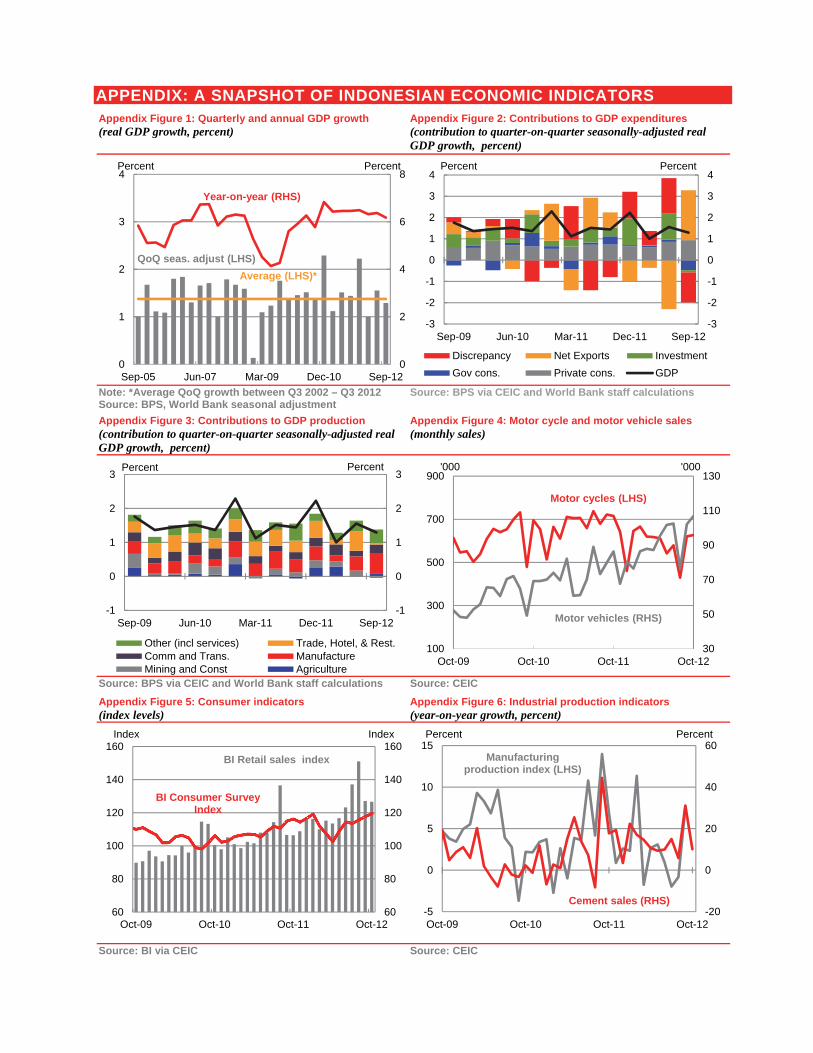
APPENDIX: A SNAPSHOT OF INDONESIAN ECONOMIC INDICATORS Appendix Figure 1: Quarterly and annual GDP growth (real GDP growth, percent)
Appendix Figure 2: Contributions to GDP expenditures (contribution to quarter-on-quarter seasonally-adjusted real GDP growth, percent)
Note: *Average QoQ growth between Q3 2002 – Q3 2012 Source: BPS, World Bank seasonal adjustment
Source: BPS via CEIC and World Bank staff calculations
Appendix Figure 3: Contributions to GDP production (contribution to quarter-on-quarter seasonally-adjusted real GDP growth, percent)
Appendix Figure 4: Motor cycle and motor vehicle sales (monthly sales)
Source: BPS via CEIC and World Bank staff calculations Source: CEIC
Appendix Figure 5: Consumer indicators (index levels)
Appendix Figure 6: Industrial production indicators (year-on-year growth, percent)
Source: BI via CEIC Source: CEIC
0
2
4
6
8
0
1
2
3
4
Sep-05 Jun-07 Mar-09 Dec-10 Sep-12
Percent Percent
QoQ seas. adjust (LHS)
Year-on-year (RHS)
Average (LHS)*
-3
-2
-1
0
1
2
3
4
-3
-2
-1
0
1
2
3
4
Sep-09 Jun-10 Mar-11 Dec-11 Sep-12
Discrepancy Net Exports Investment
Gov cons. Private cons. GDP
Percent Percent
-1
0
1
2
3
-1
0
1
2
3
Sep-09 Jun-10 Mar-11 Dec-11 Sep-12
Other (incl services) Trade, Hotel, & Rest.Comm and Trans. ManufactureMining and Const Agriculture
Percent Percent
30
50
70
90
110
130
100
300
500
700
900
Oct-09 Oct-10 Oct-11 Oct-12
'000
Motor cycles (LHS)
'000
Motor vehicles (RHS)
60
80
100
120
140
160
60
80
100
120
140
160
Oct-09 Oct-10 Oct-11 Oct-12
Index Index
BI Retail sales index
BI Consumer SurveyIndex
-20
0
20
40
60
-5
0
5
10
15
Oct-09 Oct-10 Oct-11 Oct-12
Percent Percent
Cement sales (RHS)
Manufacturingproduction index (LHS)
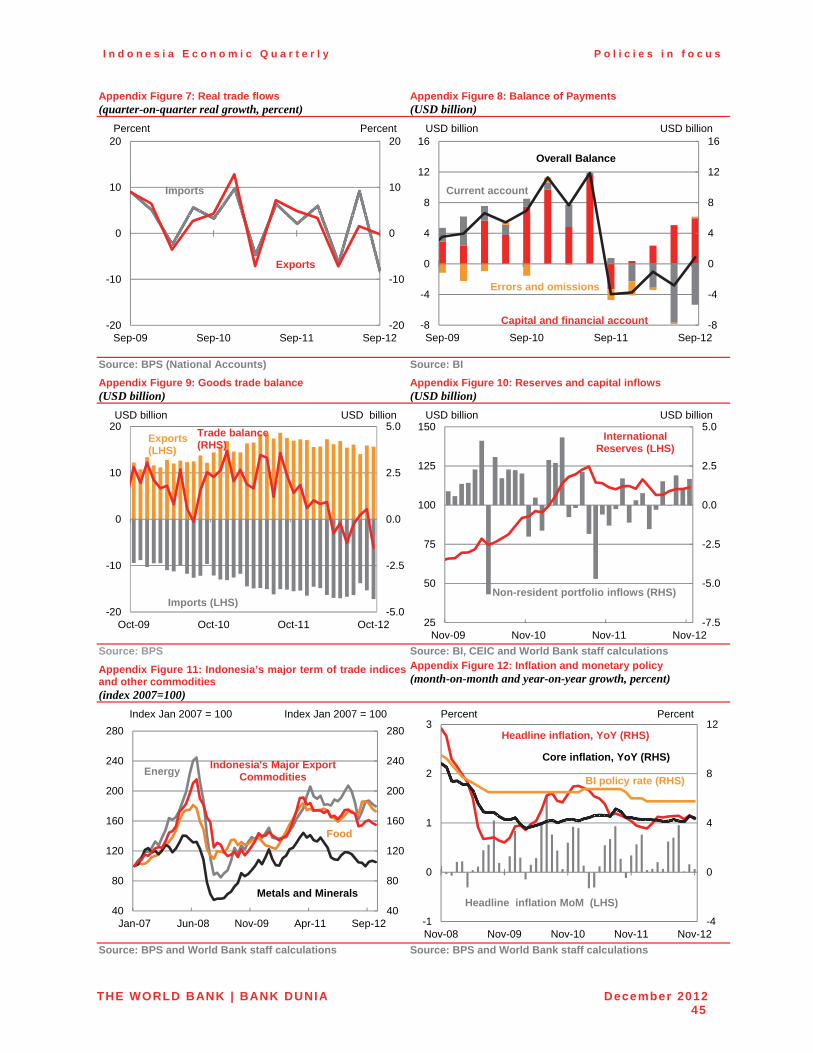
I n d o n e s i a E c o n o m i c Q u a r t e r l y P o l i c i e s i n f o c u s
THE WORLD BANK | BANK DUNIA December 201245
Appendix Figure 7: Real trade flows (quarter-on-quarter real growth, percent)
Appendix Figure 8: Balance of Payments (USD billion)
Source: BPS (National Accounts) Source: BI
Appendix Figure 9: Goods trade balance (USD billion)
Appendix Figure 10: Reserves and capital inflows (USD billion)
Source: BPS Source: BI, CEIC and World Bank staff calculations
Appendix Figure 11: Indonesia’s major term of trade indices and other commodities (index 2007=100)
Appendix Figure 12: Inflation and monetary policy (month-on-month and year-on-year growth, percent)
Source: BPS and World Bank staff calculations Source: BPS and World Bank staff calculations
-20
-10
0
10
20
-20
-10
0
10
20
Sep-09 Sep-10 Sep-11 Sep-12
Exports
Imports
Percent Percent
-8
-4
0
4
8
12
16
-8
-4
0
4
8
12
16
Sep-09 Sep-10 Sep-11 Sep-12
USD billion USD billion
Capital and financial account
Current account
Overall Balance
Errors and omissions
-5.0
-2.5
0.0
2.5
5.0
-20
-10
0
10
20
Oct-09 Oct-10 Oct-11 Oct-12
Trade balance (RHS)
Exports(LHS)
Imports (LHS)
USD billion USD billion
-7.5
-5.0
-2.5
0.0
2.5
5.0
25
50
75
100
125
150
Nov-09 Nov-10 Nov-11 Nov-12
International Reserves (LHS)
USD billion USD billion
Non-resident portfolio inflows (RHS)
40
80
120
160
200
240
280
40
80
120
160
200
240
280
Jan-07 Jun-08 Nov-09 Apr-11 Sep-12
Index Jan 2007 = 100 Index Jan 2007 = 100
Indonesia's Major Export Commodities
Food
Metals and Minerals
Energy
-4
0
4
8
12
-1
0
1
2
3
Nov-08 Nov-09 Nov-10 Nov-11 Nov-12
Core inflation, YoY (RHS)
Headline inflation, YoY (RHS)
Headline inflation MoM (LHS)
Percent Percent
BI policy rate (RHS)
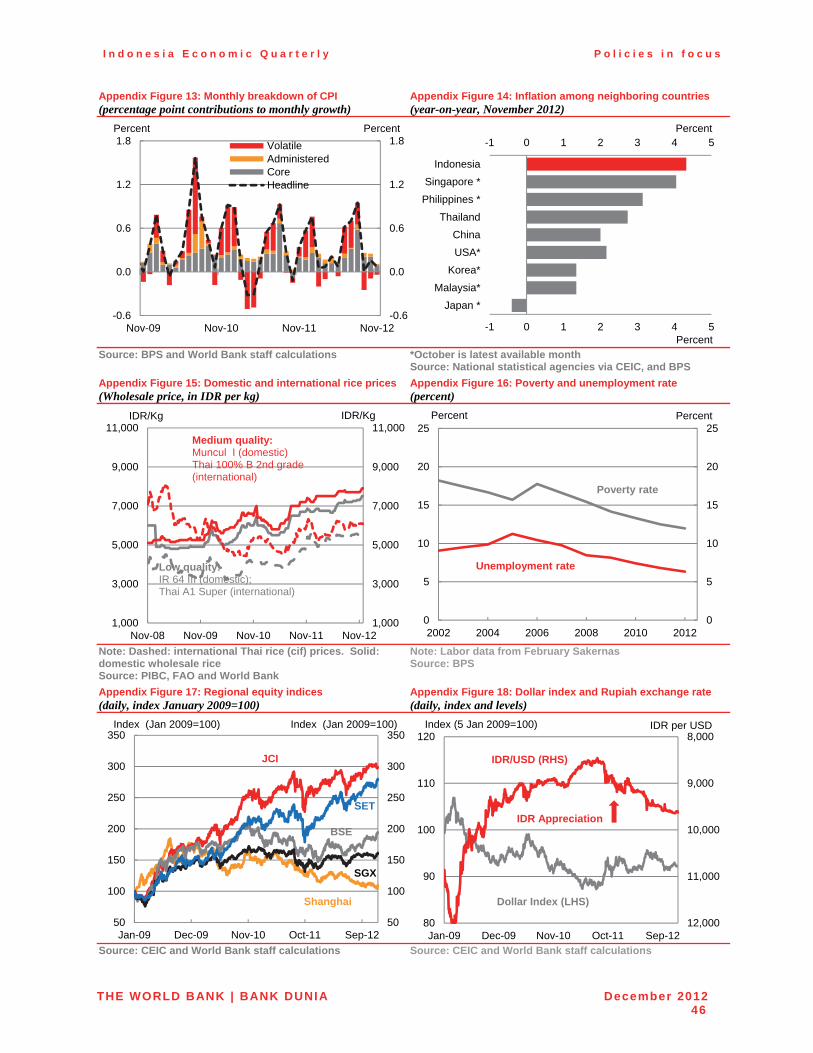
I n d o n e s i a E c o n o m i c Q u a r t e r l y P o l i c i e s i n f o c u s
THE WORLD BANK | BANK DUNIA December 201246
Appendix Figure 13: Monthly breakdown of CPI (percentage point contributions to monthly growth)
Appendix Figure 14: Inflation among neighboring countries (year-on-year, November 2012)
Source: BPS and World Bank staff calculations *October is latest available month Source: National statistical agencies via CEIC, and BPS
Appendix Figure 15: Domestic and international rice prices (Wholesale price, in IDR per kg)
Appendix Figure 16: Poverty and unemployment rate (percent)
Note: Dashed: international Thai rice (cif) prices. Solid: domestic wholesale rice Source: PIBC, FAO and World Bank
Note: Labor data from February Sakernas Source: BPS
Appendix Figure 17: Regional equity indices (daily, index January 2009=100)
Appendix Figure 18: Dollar index and Rupiah exchange rate (daily, index and levels)
Source: CEIC and World Bank staff calculations Source: CEIC and World Bank staff calculations
-0.6
0.0
0.6
1.2
1.8
-0.6
0.0
0.6
1.2
1.8
Nov-09 Nov-10 Nov-11 Nov-12
VolatileAdministeredCoreHeadline
Percent Percent-1 0 1 2 3 4 5
-1 0 1 2 3 4 5
Japan *
Malaysia*
Korea*
USA*
China
Thailand
Philippines *
Singapore *
Indonesia
Percent
Percent
1,000
3,000
5,000
7,000
9,000
11,000
1,000
3,000
5,000
7,000
9,000
11,000
Nov-08 Nov-09 Nov-10 Nov-11 Nov-12
Low quality:IR 64 III (domestic);Thai A1 Super (international)
IDR/Kg
Medium quality: Muncul I (domestic)Thai 100% B 2nd grade (international)
IDR/Kg
0
5
10
15
20
25
0
5
10
15
20
25
2002 2004 2006 2008 2010 2012
Percent Percent
Poverty rate
Unemployment rate
50
100
150
200
250
300
350
50
100
150
200
250
300
350
Jan-09 Dec-09 Nov-10 Oct-11 Sep-12
Index (Jan 2009=100)
SGX
JCI
SET
Shanghai
BSE
Index (Jan 2009=100)8,000
9,000
10,000
11,000
12,00080
90
100
110
120
Jan-09 Dec-09 Nov-10 Oct-11 Sep-12
Index (5 Jan 2009=100)
IDR/USD (RHS)
Dollar Index (LHS)
IDR Appreciation
IDR per USD
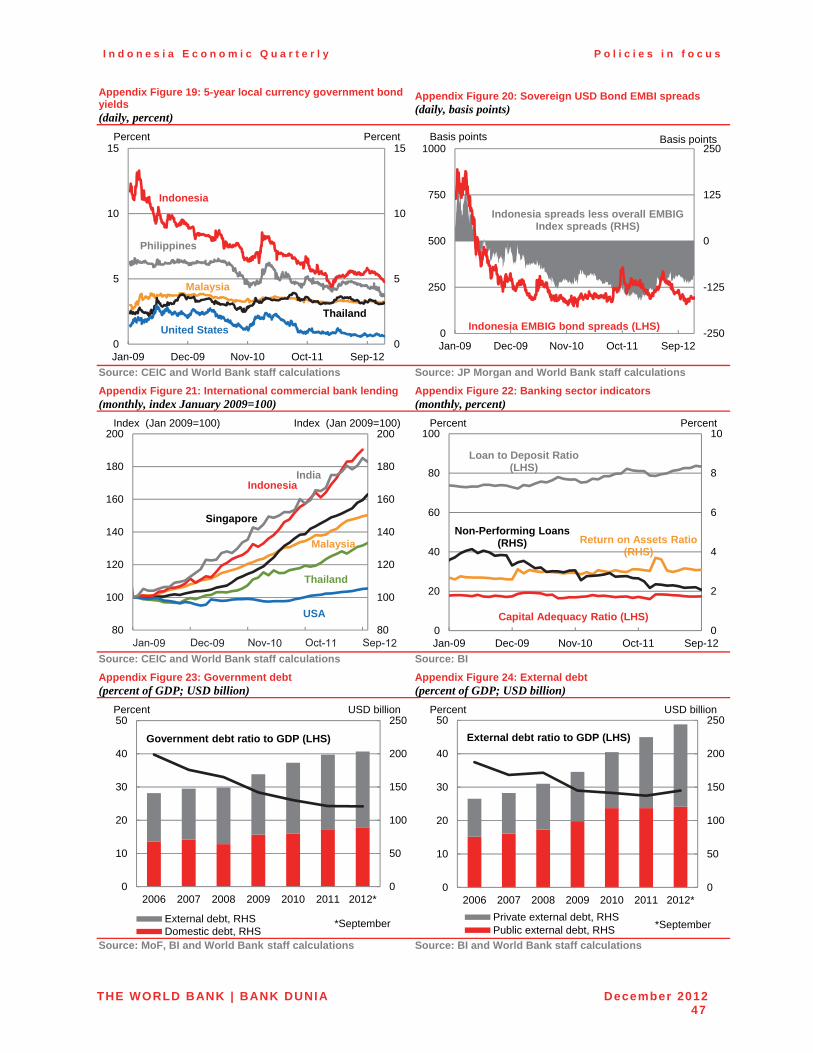
I n d o n e s i a E c o n o m i c Q u a r t e r l y P o l i c i e s i n f o c u s
THE WORLD BANK | BANK DUNIA December 201247
Appendix Figure 19: 5-year local currency government bond yields (daily, percent)
Appendix Figure 20: Sovereign USD Bond EMBI spreads (daily, basis points)
Source: CEIC and World Bank staff calculations Source: JP Morgan and World Bank staff calculations
Appendix Figure 21: International commercial bank lending (monthly, index January 2009=100)
Appendix Figure 22: Banking sector indicators (monthly, percent)
Source: CEIC and World Bank staff calculations Source: BI
Appendix Figure 23: Government debt (percent of GDP; USD billion)
Appendix Figure 24: External debt (percent of GDP; USD billion)
Source: MoF, BI and World Bank staff calculations Source: BI and World Bank staff calculations
0
5
10
15
0
5
10
15
Jan-09 Dec-09 Nov-10 Oct-11 Sep-12
Percent
Philippines
United States
Thailand
Malaysia
Indonesia
Percent
-250
-125
0
125
250
0
250
500
750
1000
Jan-09 Dec-09 Nov-10 Oct-11 Sep-12
Basis points
Indonesia EMBIG bond spreads (LHS)
Indonesia spreads less overall EMBIG Index spreads (RHS)
Basis points
80
100
120
140
160
180
200
80
100
120
140
160
180
200Index (Jan 2009=100)
USA
Thailand
Singapore
IndonesiaIndia
Malaysia
Index (Jan 2009=100)
0
2
4
6
8
10
0
20
40
60
80
100
Jan-09 Dec-09 Nov-10 Oct-11 Sep-12
Capital Adequacy Ratio (LHS)
Return on Assets Ratio (RHS)
Loan to Deposit Ratio (LHS)
Percent Percent
Non-Performing Loans (RHS)
0
50
100
150
200
250
0
10
20
30
40
50
2006 2007 2008 2009 2010 2011 2012*
External debt, RHSDomestic debt, RHS
Percent USD billion
Government debt ratio to GDP (LHS)
*September
0
50
100
150
200
250
0
10
20
30
40
50
2006 2007 2008 2009 2010 2011 2012*
Private external debt, RHSPublic external debt, RHS
External debt ratio to GDP (LHS)
Percent USD billion
*September
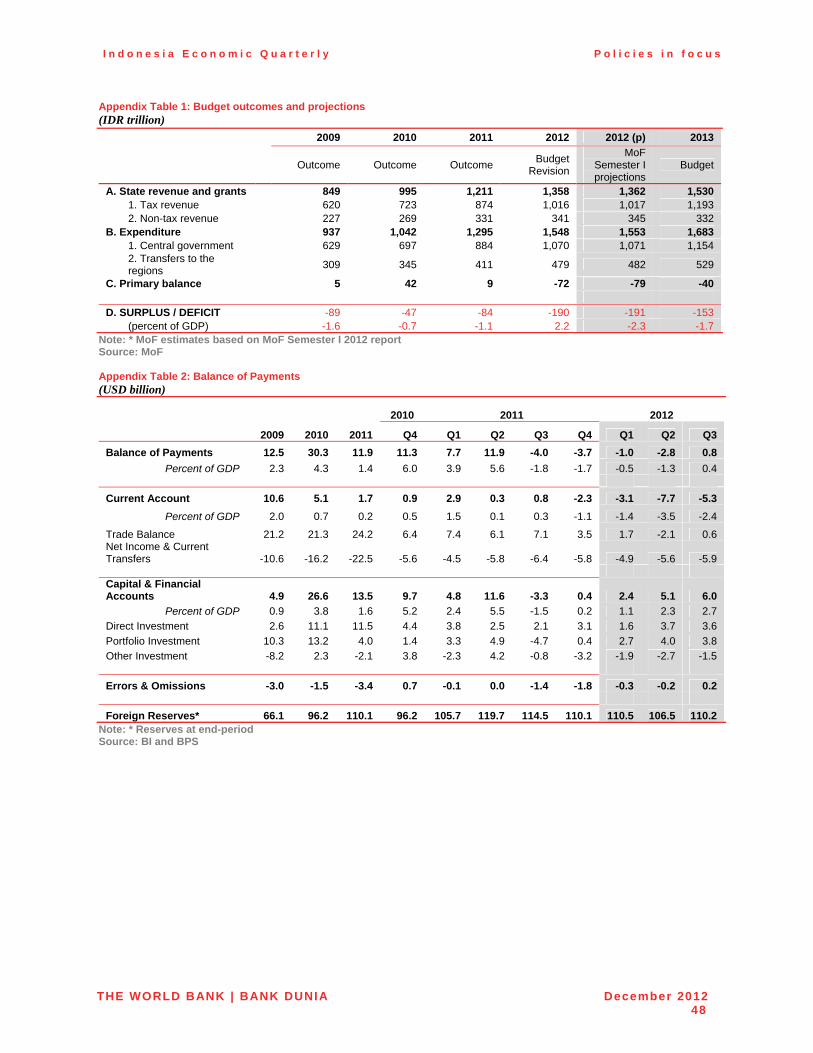
I n d o n e s i a E c o n o m i c Q u a r t e r l y P o l i c i e s i n f o c u s
THE WORLD BANK | BANK DUNIA December 201248
Appendix Table 1: Budget outcomes and projections (IDR trillion)
2009 2010 2011 2012 2012 (p) 2013
Outcome Outcome Outcome
Budget Revision
MoF Semester I projections
Budget
A. State revenue and grants 849 995 1,211 1,358 1,362 1,530 1. Tax revenue 620 723 874 1,016 1,017 1,193 2. Non-tax revenue 227 269 331 341 345 332 B. Expenditure 937 1,042 1,295 1,548 1,553 1,683 1. Central government 629 697 884 1,070 1,071 1,154
2. Transfers to the regions
309 345 411 479 482 529
C. Primary balance 5 42 9 -72 -79 -40
D. SURPLUS / DEFICIT -89 -47 -84 -190 -191 -153 (percent of GDP) -1.6 -0.7 -1.1 2.2 -2.3 -1.7
Note: * MoF estimates based on MoF Semester I 2012 report Source: MoF
Appendix Table 2: Balance of Payments (USD billion)
2010 2011 2012
2009 2010 2011 Q4 Q1 Q2 Q3 Q4 Q1 Q2 Q3
Balance of Payments 12.5 30.3 11.9 11.3 7.7 11.9 -4.0 -3.7 -1.0 -2.8 0.8
Percent of GDP 2.3 4.3 1.4 6.0 3.9 5.6 -1.8 -1.7 -0.5 -1.3 0.4
Current Account 10.6 5.1 1.7 0.9 2.9 0.3 0.8 -2.3 -3.1 -7.7 -5.3
Percent of GDP 2.0 0.7 0.2 0.5 1.5 0.1 0.3 -1.1 -1.4 -3.5 -2.4
Trade Balance 21.2 21.3 24.2 6.4 7.4 6.1 7.1 3.5 1.7 -2.1 0.6 Net Income & Current Transfers -10.6 -16.2 -22.5 -5.6 -4.5 -5.8 -6.4 -5.8 -4.9 -5.6 -5.9 Capital & Financial Accounts 4.9 26.6 13.5 9.7 4.8 11.6 -3.3 0.4 2.4 5.1 6.0
Percent of GDP 0.9 3.8 1.6 5.2 2.4 5.5 -1.5 0.2 1.1 2.3 2.7
Direct Investment 2.6 11.1 11.5 4.4 3.8 2.5 2.1 3.1 1.6 3.7 3.6
Portfolio Investment 10.3 13.2 4.0 1.4 3.3 4.9 -4.7 0.4 2.7 4.0 3.8
Other Investment -8.2 2.3 -2.1 3.8 -2.3 4.2 -0.8 -3.2 -1.9 -2.7 -1.5
Errors & Omissions -3.0 -1.5 -3.4 0.7 -0.1 0.0 -1.4 -1.8 -0.3 -0.2 0.2
Foreign Reserves* 66.1 96.2 110.1 96.2 105.7 119.7 114.5 110.1 110.5 106.5 110.2
Note: * Reserves at end-period Source: BI and BPS
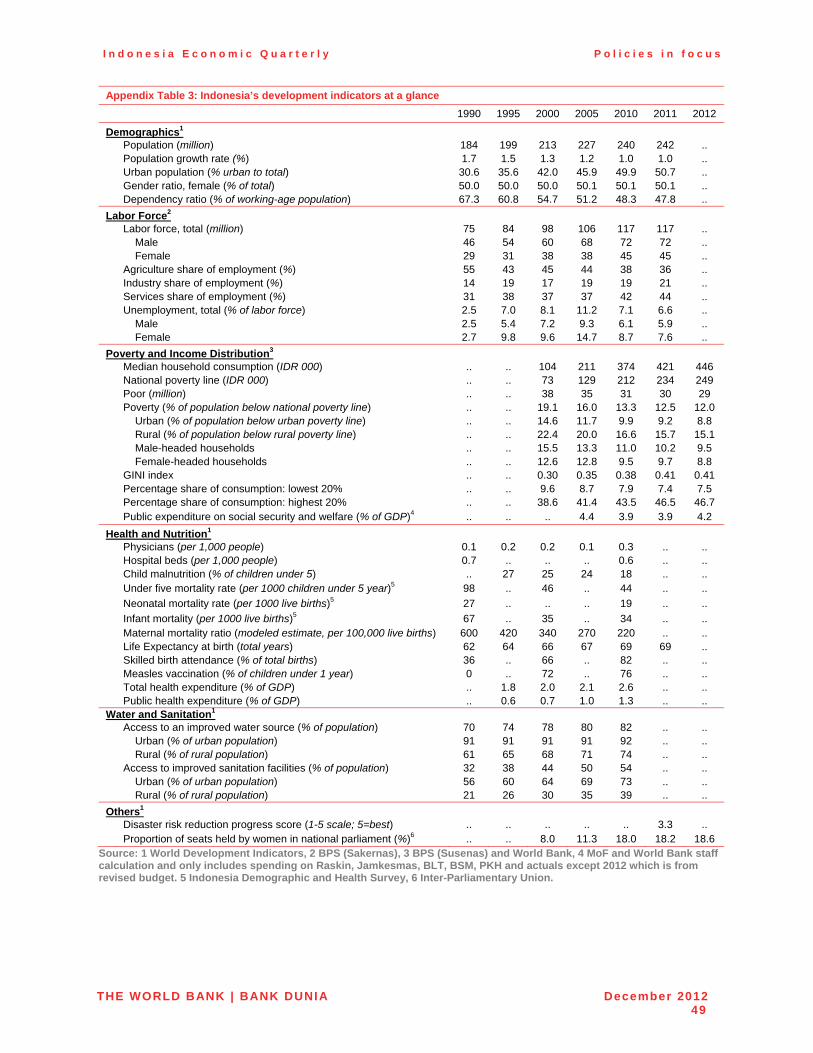
I n d o n e s i a E c o n o m i c Q u a r t e r l y P o l i c i e s i n f o c u s
THE WORLD BANK | BANK DUNIA December 201249
Appendix Table 3: Indonesia’s development indicators at a glance
1990 1995 2000 2005 2010 2011 2012
Demographics1 Population (million) 184 199 213 227 240 242 .. Population growth rate (%) 1.7 1.5 1.3 1.2 1.0 1.0 .. Urban population (% urban to total) 30.6 35.6 42.0 45.9 49.9 50.7 .. Gender ratio, female (% of total) 50.0 50.0 50.0 50.1 50.1 50.1 .. Dependency ratio (% of working-age population) 67.3 60.8 54.7 51.2 48.3 47.8 ..
Labor Force2
Labor force, total (million) 75 84 98 106 117 117 .. Male 46 54 60 68 72 72 .. Female 29 31 38 38 45 45 .. Agriculture share of employment (%) 55 43 45 44 38 36 .. Industry share of employment (%) 14 19 17 19 19 21 .. Services share of employment (%) 31 38 37 37 42 44 .. Unemployment, total (% of labor force) 2.5 7.0 8.1 11.2 7.1 6.6 .. Male 2.5 5.4 7.2 9.3 6.1 5.9 .. Female 2.7 9.8 9.6 14.7 8.7 7.6 ..
Poverty and Income Distribution3
Median household consumption (IDR 000) .. .. 104 211 374 421 446 National poverty line (IDR 000) .. .. 73 129 212 234 249 Poor (million) .. .. 38 35 31 30 29 Poverty (% of population below national poverty line) .. .. 19.1 16.0 13.3 12.5 12.0 Urban (% of population below urban poverty line) .. .. 14.6 11.7 9.9 9.2 8.8 Rural (% of population below rural poverty line) .. .. 22.4 20.0 16.6 15.7 15.1 Male-headed households .. .. 15.5 13.3 11.0 10.2 9.5 Female-headed households .. .. 12.6 12.8 9.5 9.7 8.8 GINI index .. .. 0.30 0.35 0.38 0.41 0.41 Percentage share of consumption: lowest 20% .. .. 9.6 8.7 7.9 7.4 7.5 Percentage share of consumption: highest 20% .. .. 38.6 41.4 43.5 46.5 46.7
Public expenditure on social security and welfare (% of GDP)4 .. .. .. 4.4 3.9 3.9 4.2
Health and Nutrition1
Physicians (per 1,000 people) 0.1 0.2 0.2 0.1 0.3 .. .. Hospital beds (per 1,000 people) 0.7 .. .. .. 0.6 .. .. Child malnutrition (% of children under 5) .. 27 25 24 18 .. ..
Under five mortality rate (per 1000 children under 5 year)5 98 .. 46 .. 44 .. ..
Neonatal mortality rate (per 1000 live births)5 27 .. .. .. 19 .. ..
Infant mortality (per 1000 live births)5 67 .. 35 .. 34 .. ..
Maternal mortality ratio (modeled estimate, per 100,000 live births) 600 420 340 270 220 .. .. Life Expectancy at birth (total years) 62 64 66 67 69 69 .. Skilled birth attendance (% of total births) 36 .. 66 .. 82 .. .. Measles vaccination (% of children under 1 year) 0 .. 72 .. 76 .. .. Total health expenditure (% of GDP) .. 1.8 2.0 2.1 2.6 .. .. Public health expenditure (% of GDP) .. 0.6 0.7 1.0 1.3 .. .. Water and Sanitation1 Access to an improved water source (% of population) 70 74 78 80 82 .. .. Urban (% of urban population) 91 91 91 91 92 .. .. Rural (% of rural population) 61 65 68 71 74 .. .. Access to improved sanitation facilities (% of population) 32 38 44 50 54 .. .. Urban (% of urban population) 56 60 64 69 73 .. .. Rural (% of rural population) 21 26 30 35 39 .. ..
Others1
Disaster risk reduction progress score (1-5 scale; 5=best) .. .. .. .. .. 3.3 ..
Proportion of seats held by women in national parliament (%)6 .. .. 8.0 11.3 18.0 18.2 18.6 Source: 1 World Development Indicators, 2 BPS (Sakernas), 3 BPS (Susenas) and World Bank, 4 MoF and World Bank staff calculation and only includes spending on Raskin, Jamkesmas, BLT, BSM, PKH and actuals except 2012 which is from revised budget. 5 Indonesia Demographic and Health Survey, 6 Inter-Parliamentary Union.

December 2012
Policies in focus
INDONESIA ECONOMIC QUARTERLY
Juli 2012
Investing in Indonesia’s Institutionsfor Inclusive and Sustainable Development
Bangkit menghadapi tantangan saat ini dan ke depan
PERKEMBANGAN TRIWULANANPEREKONOMIAN INDONESIA