Perfusion PET • Metabolic PET (Viability) • Hybrid Imaging ... PET Coronary CTA... · Why PET...
57
Agenda • Perfusion PET • Metabolic PET (Viability) • Hybrid Imaging (PET/CTA)
-
Upload
truongphuc -
Category
Documents
-
view
216 -
download
1
Transcript of Perfusion PET • Metabolic PET (Viability) • Hybrid Imaging ... PET Coronary CTA... · Why PET...

Agenda
• Perfusion PET• Metabolic PET (Viability)• Hybrid Imaging (PET/CTA)
Progression of Atherosclerosis
Adapted from Abrams J. N Engl J Med. 2005;352:2524-2533.
SPECT
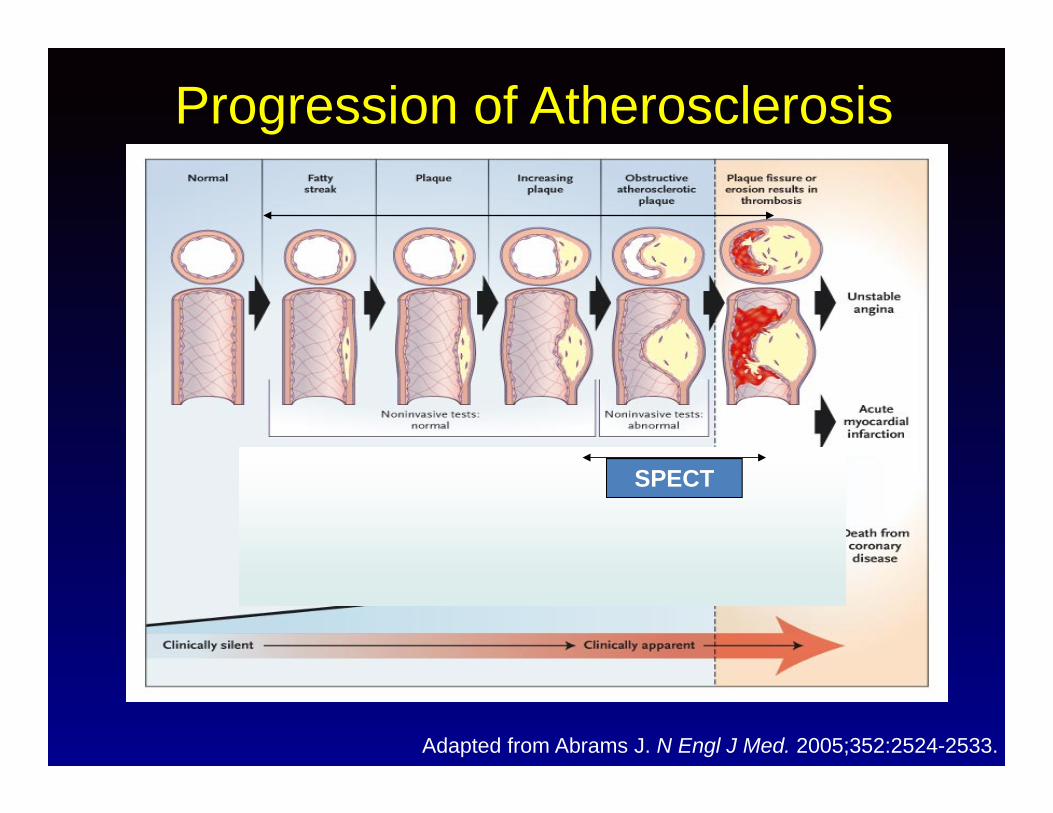
Why PET Perfusion?
• Better spatial & temporal resolution: Small hearts, large patients.
• Improved diagnostic accuracy, lower false positive.
• Identification of multivessel ischemia.• Accurate depth-independent attenuation
correction.• Faster protocols.• Lower radiation burden.• Quantification capabilities.

SPECT vs PET Perfusion
• Energy: 78-140 KeV• Attenuation correction:
sometimes• Stress: exercise,
pharmacologic• Protocol, start to finish:
2–2/12 hours• Ventricular function: post-
stress, rest
• 511 KeV• Attenuation correction:
always• Stress: pharmacologic,
exercise in future (F-18)• Protocol, start to
finish:30–45 minutes• Ventricular function:
stress, rest
SPECT PET
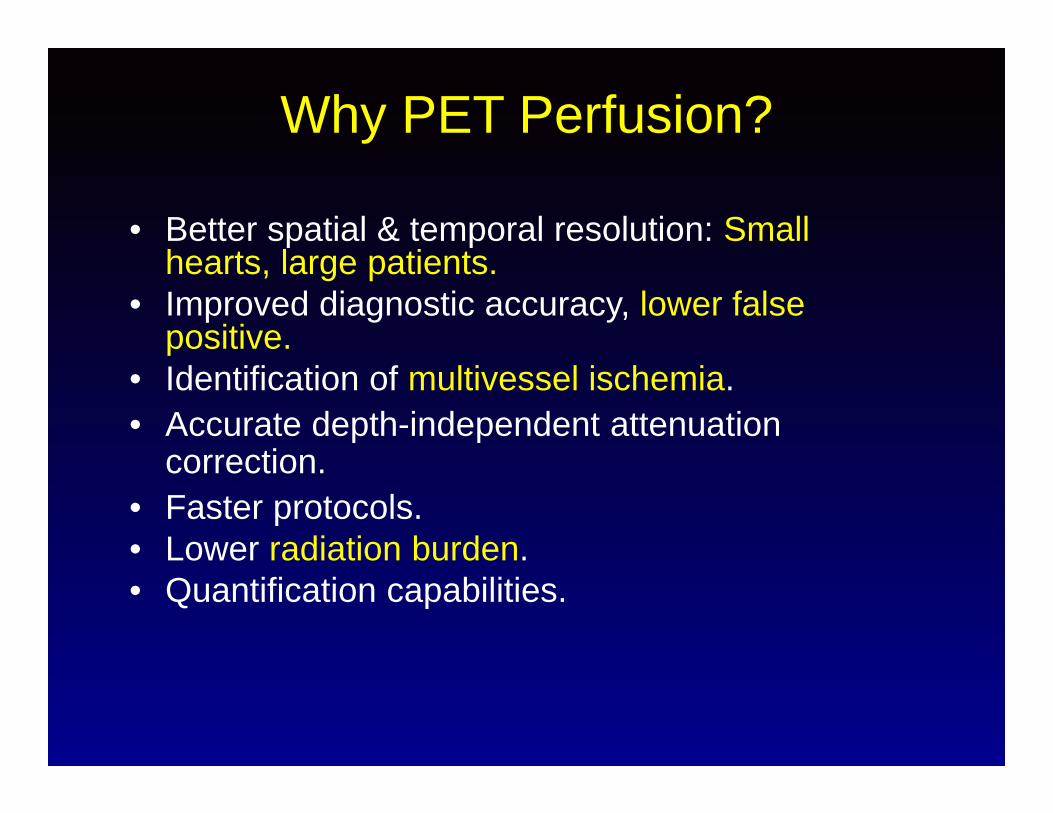
Radiation Exposure (mSv) PET vs SPECT

Myocardial Blood Flow and Radiotracer Uptake

PET Cardiac Radiotracers
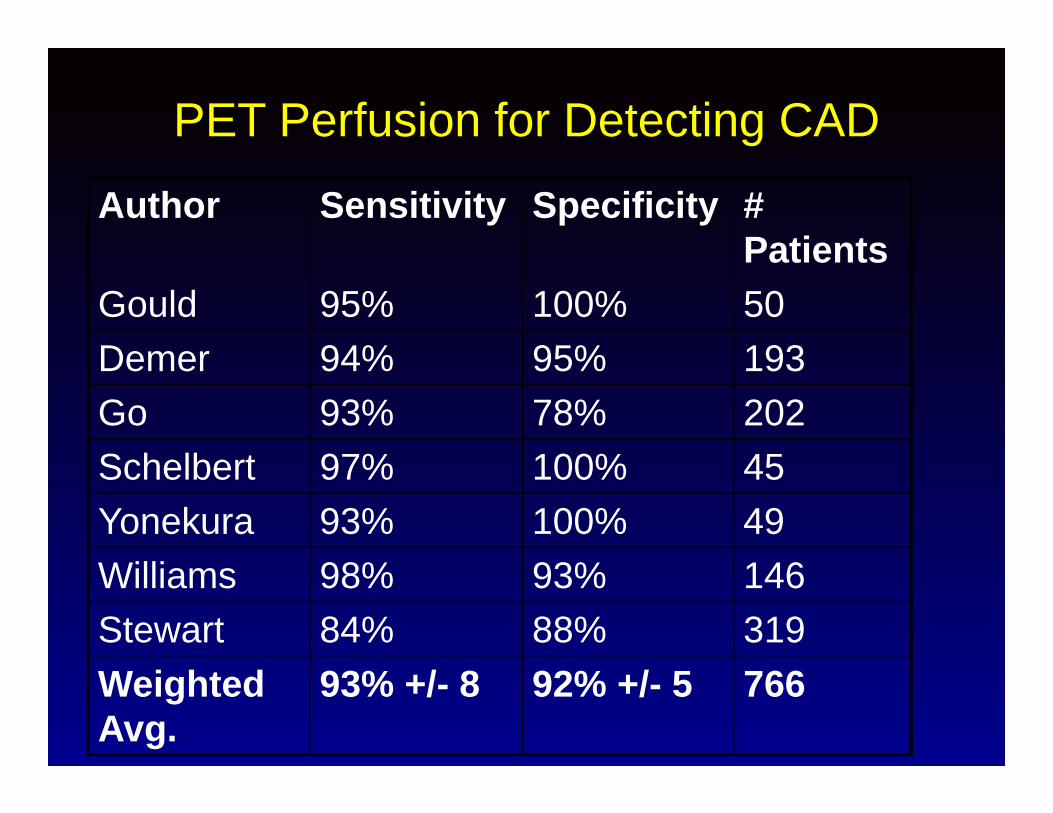
PET Perfusion for Detecting CAD
Author Sensitivity Specificity # Patients
Gould 95% 100% 50Demer 94% 95% 193Go 93% 78% 202Schelbert 97% 100% 45Yonekura 93% 100% 49Williams 98% 93% 146Stewart 84% 88% 319Weighted Avg.
93% +/- 8 92% +/- 5 766
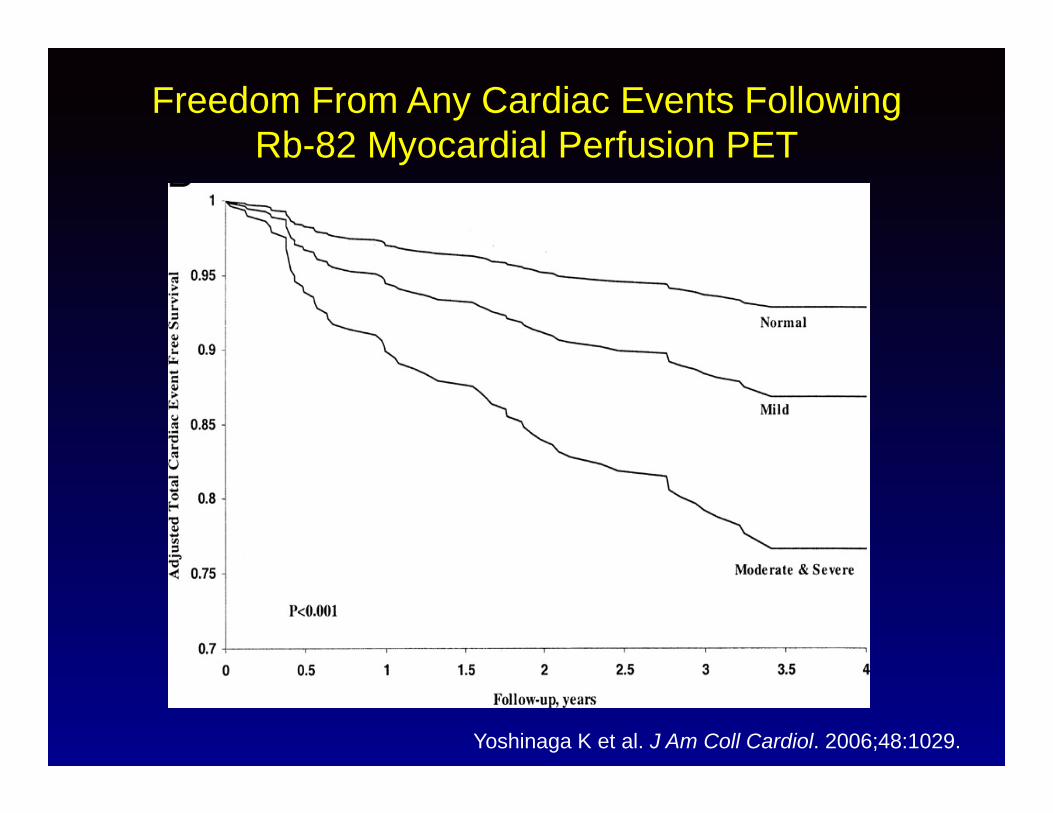
Freedom From Any Cardiac Events Following Rb-82 Myocardial Perfusion PET
Yoshinaga K et al. J Am Coll Cardiol. 2006;48:1029.

Characteristics of a NormalMyocardial Perfusion PET Study
• Uniform distribution of tracer, independent of gender
• LV cavity at peak stress equal to/smaller than at rest
• Uniform and normal wall thickness and thickening
• Uniform and normal regional wall motion
• Peak stress LVEF > rest LVEF
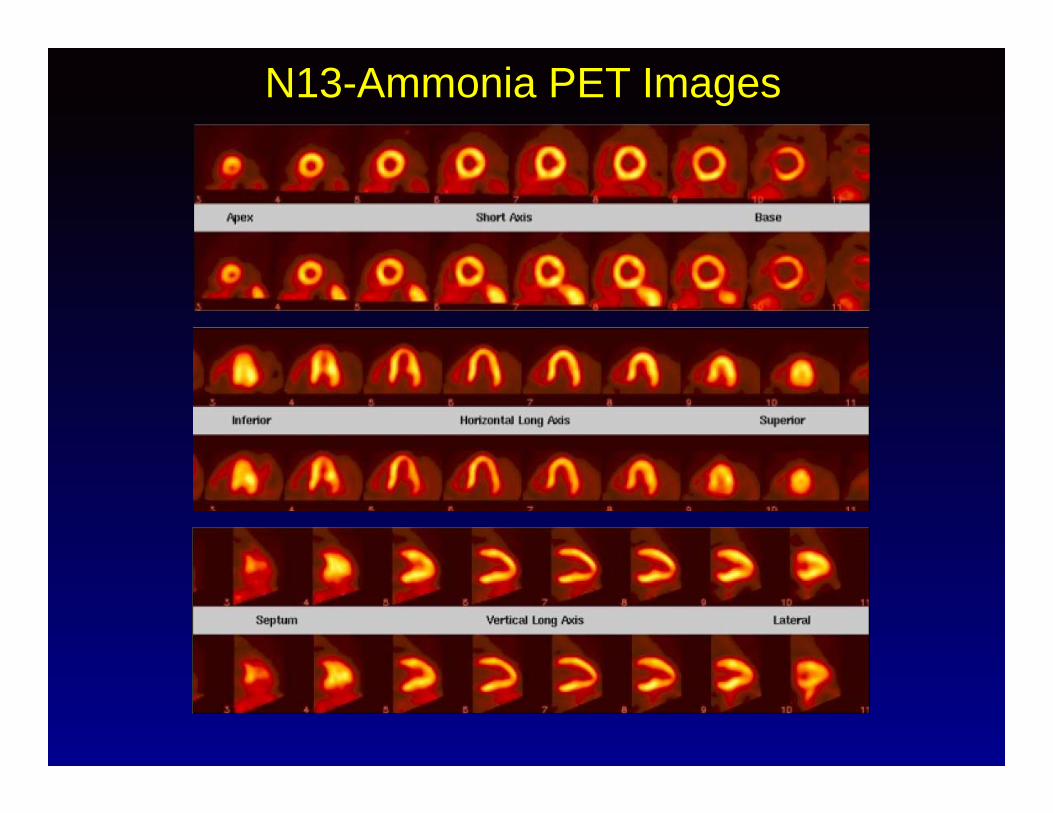
N13-Ammonia PET Images
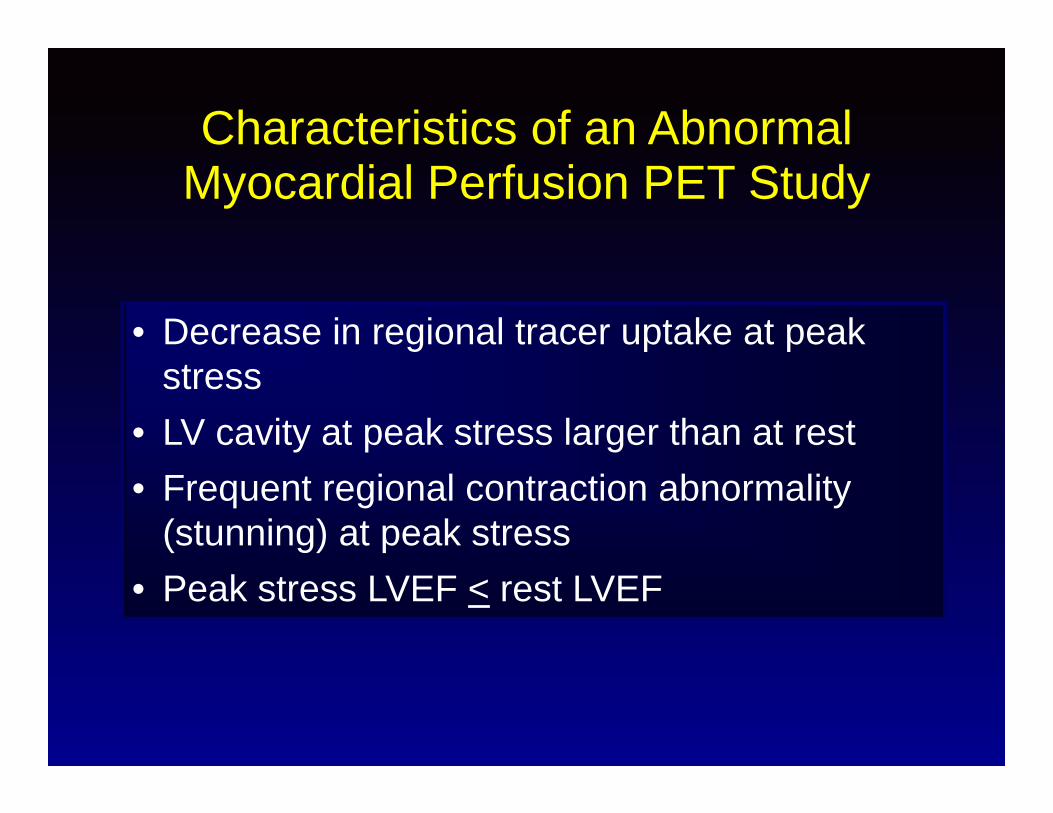
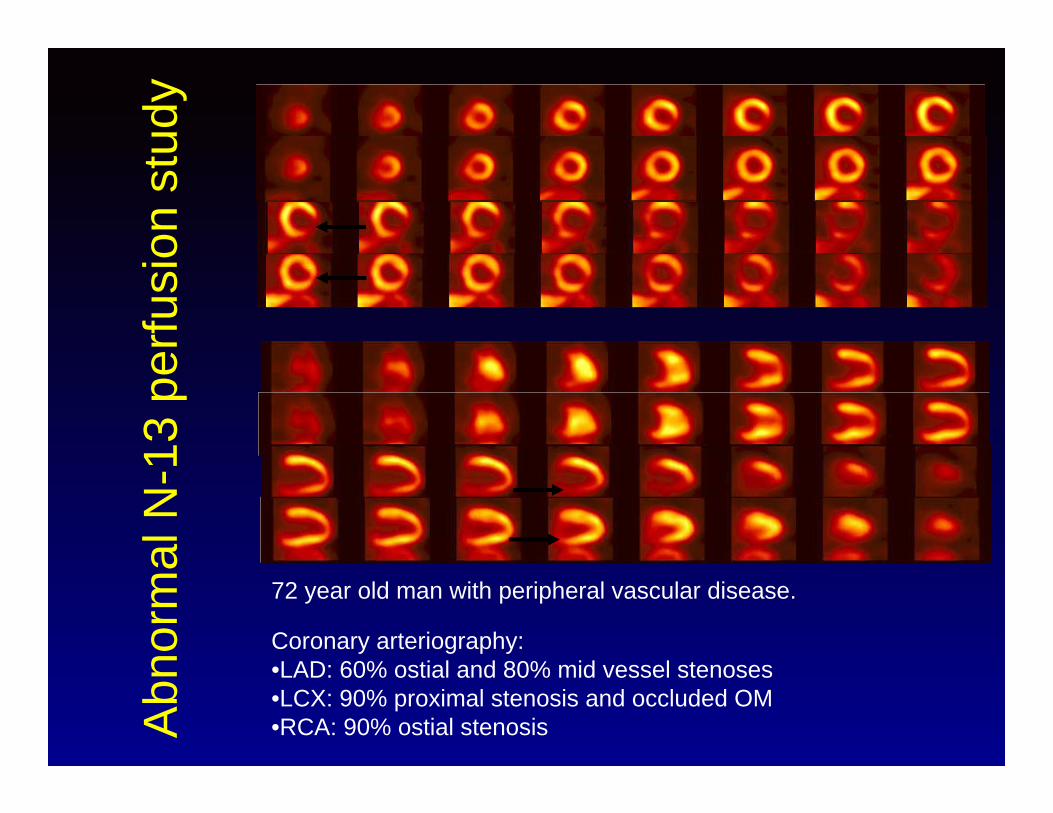
Characteristics of an AbnormalMyocardial Perfusion PET Study
• Decrease in regional tracer uptake at peak stress
• LV cavity at peak stress larger than at rest • Frequent regional contraction abnormality
(stunning) at peak stress• Peak stress LVEF < rest LVEF
Abn
orm
al N
-13
perfu
sion
stu
dy
72 year old man with peripheral vascular disease.
Coronary arteriography:•LAD: 60% ostial and 80% mid vessel stenoses•LCX: 90% proximal stenosis and occluded OM•RCA: 90% ostial stenosis

Abn
orm
al N
-13
perfu
sion
stu
dy

Multivessel DiseaseIschemia + Transient Dilatation
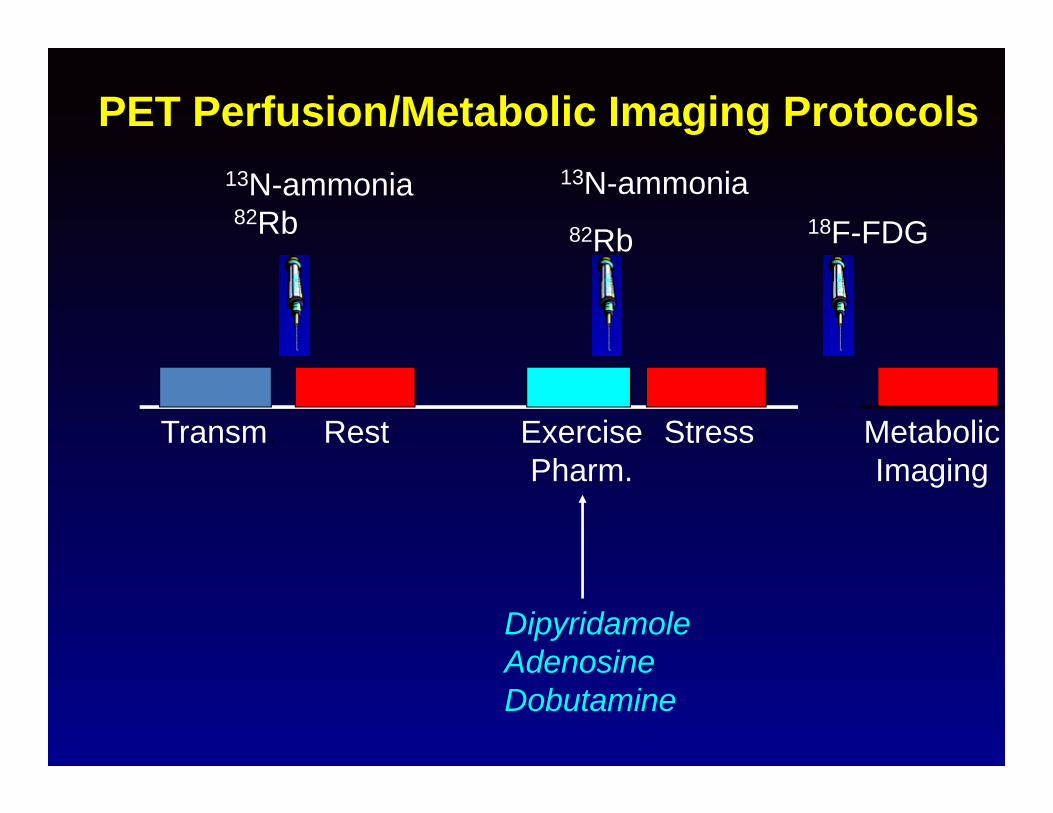
PET Perfusion/Metabolic Imaging Protocols
Transm. Rest ExercisePharm.
Stress
DipyridamoleAdenosineDobutamine
13N-ammonia82Rb
13N-ammonia82Rb 18F-FDG
MetabolicImaging

Progression of Atherosclerosis
Adapted from Abrams J. N Engl J Med. 2005;352:2524-2533.
SPECT
PETEndothelial dysfunction
Severe ischemia
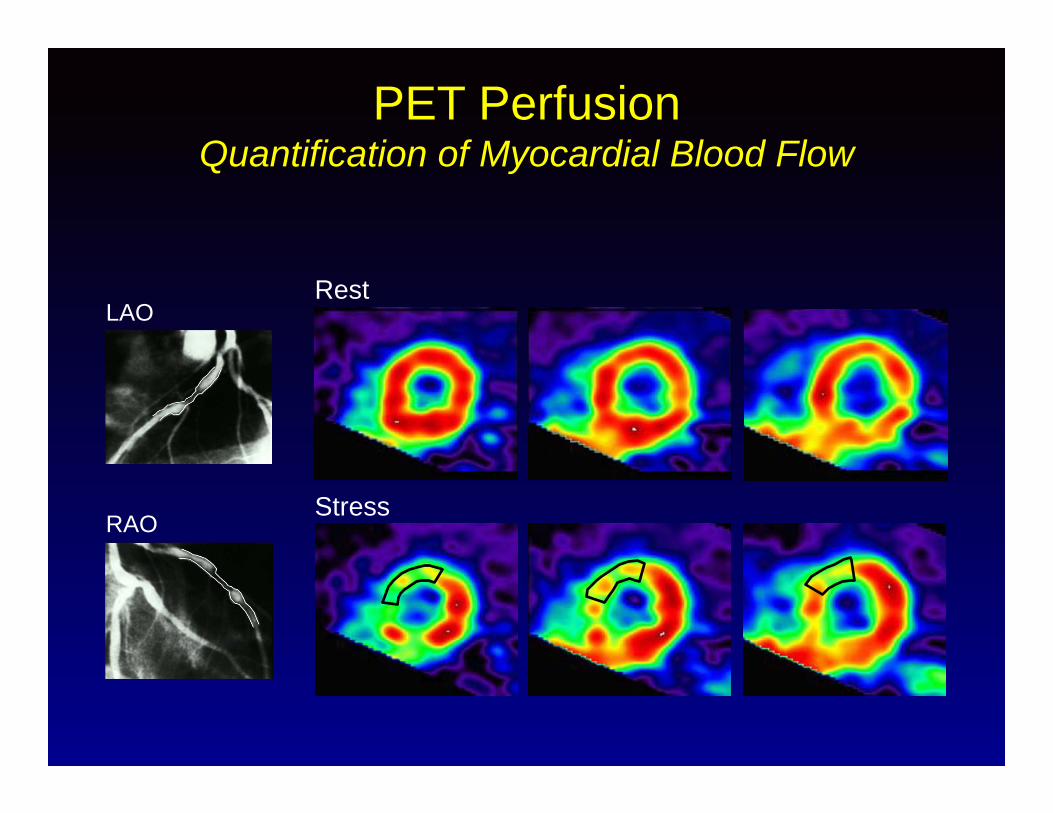
PET PerfusionQuantification of Myocardial Blood Flow
Rest
Stress
LAO
RAO

Control of Coronary Blood Flow
ConductanceVessel
ConductanceVessel
Resistance Vessels
Resistance Vessels
FF
Vascular Smooth Muscle Cell
Vascular Smooth Muscle Cell
Shear StressShear Stress
Endothelial CellEndothelial Cell

Hyperemic FlowHyperemic Flow
Normal Responseabout 10-20% diameter increase
Normal Responseabout 10-20% diameter increase
• Length of Vessel (L)
• Flow Velocity (V)
• Diameter of Vessel (D; 4th power)
• Length of Vessel (L)
• Flow Velocity (V)
• Diameter of Vessel (D; 4th power)
Resistance to FlowResistance to Flow
Conductance VesselConductance Vessel

Hyperemic FlowHyperemic Flow
• Length of Vessel (L)
• Flow Velocity (V)
• Diameter of Vessel (D; 4th power)
• Length of Vessel (L)
• Flow Velocity (V)
• Diameter of Vessel (D; 4th power)
Resistance to FlowResistance to Flow
Abnormal Responseno change or decrease in diameter
Abnormal Responseno change or decrease in diameter
Conductance VesselConductance Vessel

Control of Coronary Blood FlowResistance Vessels
< 400µm< 400µm
CoronaryBloodFlow
CoronaryBloodFlow
AdenosineDipyridamolePapaverine
Shear StressShear Stress
Endothelial CellEndothelial Cell
Vascular Smooth Muscle Cell
Vascular Smooth Muscle Cell
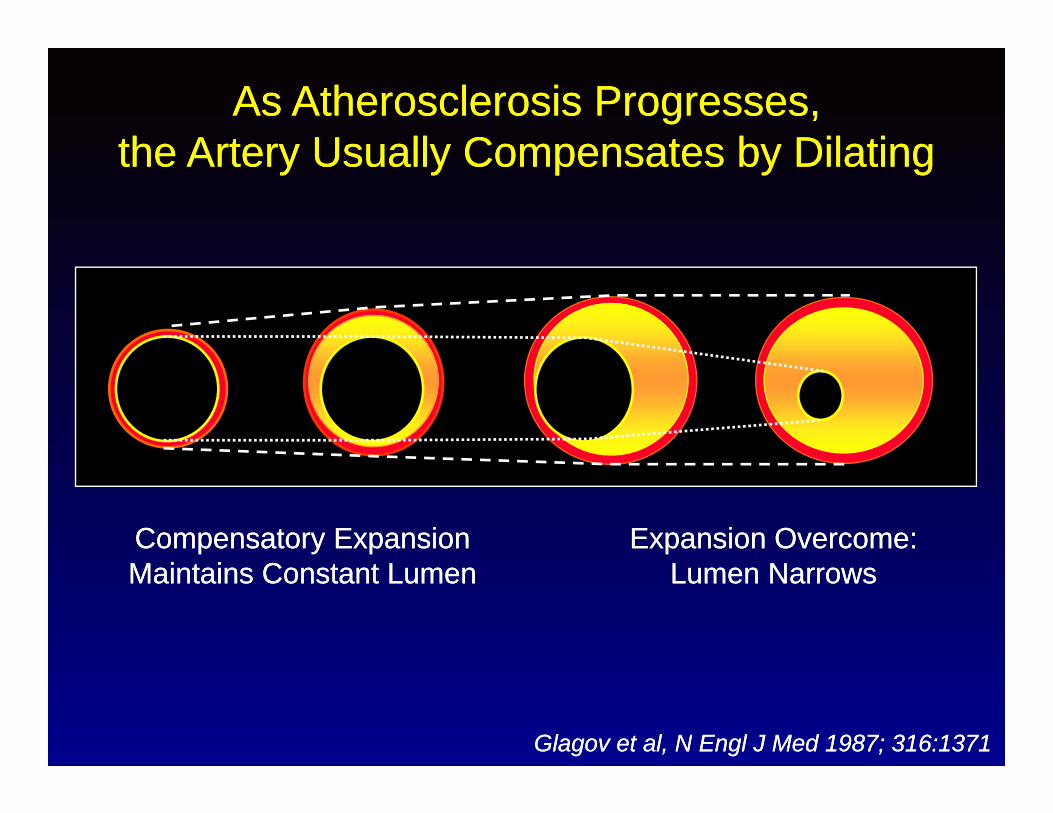
Glagov et al, N Engl J Med 1987; 316:1371Glagov et al, N Engl J Med 1987; 316:1371
Compensatory Expansion Maintains Constant LumenCompensatory Expansion Maintains Constant Lumen
As Atherosclerosis Progresses,the Artery Usually Compensates by Dilating
As Atherosclerosis Progresses,the Artery Usually Compensates by Dilating
Expansion Overcome:Lumen Narrows
Expansion Overcome:Lumen Narrows

Conductance and Resistance Vessel InteractionConductance and Resistance Vessel Interaction
00
% Flow Index Change% Flow Index Change
% Luminal Area
Change
% Luminal Area
Change
3030
4040
00 200200
n = 11r = 0.79p < 0. 01
n = 11r = 0.79p < 0. 01
1010
2020
300300 400400 500500 600600 700700 800800
Zeiher et al., Circulation 1991; 84:1984-92Zeiher et al., Circulation 1991; 84:1984-92
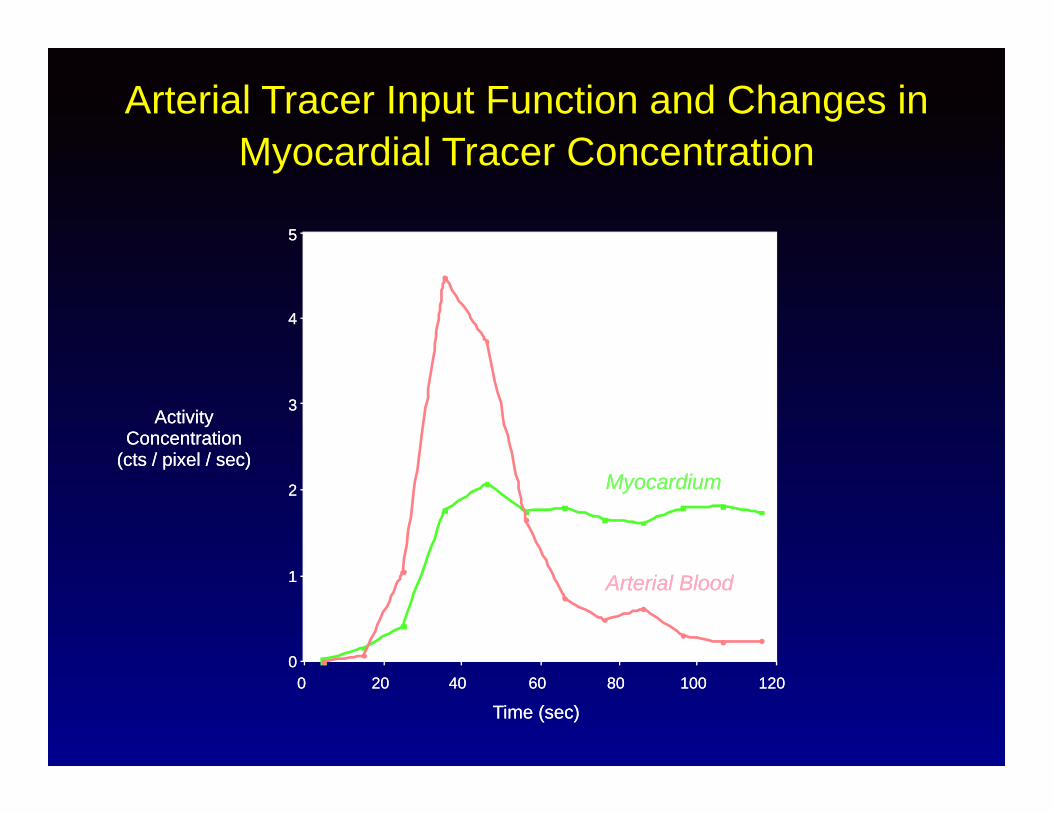
Arterial Tracer Input Function and Changes inMyocardial Tracer Concentration
ActivityConcentration
(cts / pixel / sec)
ActivityConcentration
(cts / pixel / sec)MyocardiumMyocardium
Time (sec)Time (sec)120120100100808060604040202000
00
11
22
33
44
55
Arterial BloodArterial Blood
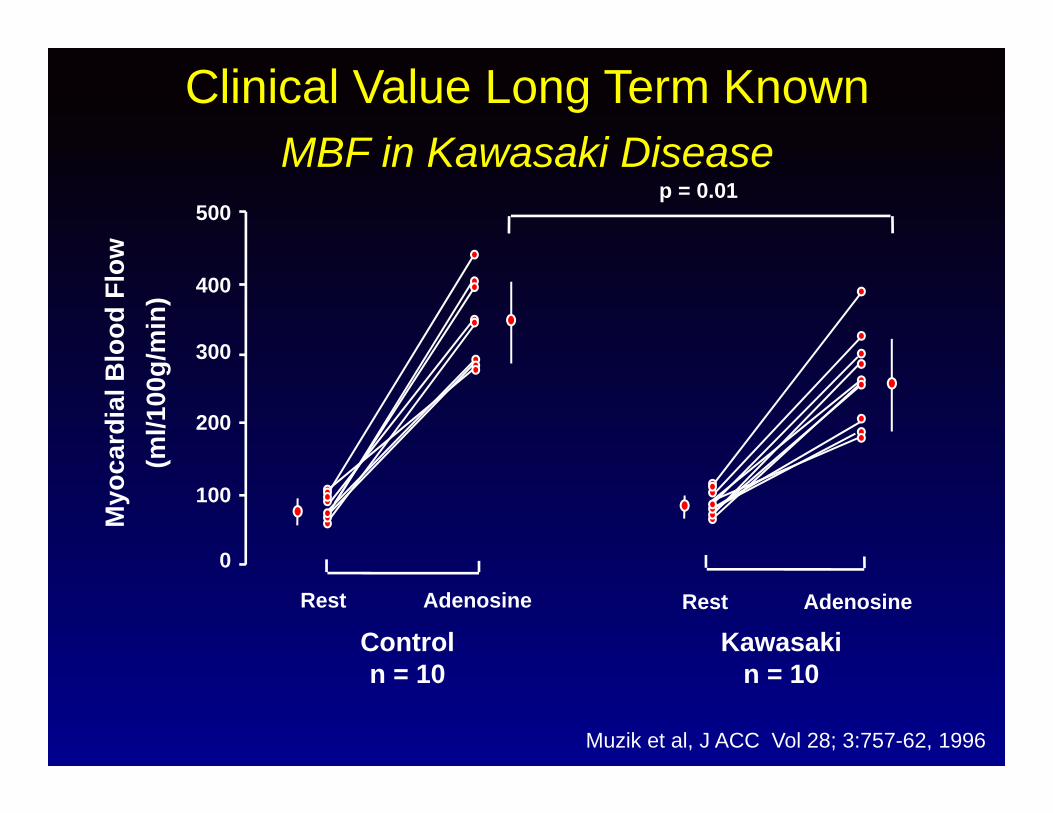
Clinical Value Long Term KnownMBF in Kawasaki Disease
Muzik et al, J ACC Vol 28; 3:757-62, 1996
Rest
0
100
Myo
card
ial B
lood
Flo
w(m
l/100
g/m
in)
Adenosine
Controln = 10
Kawasakin = 10
200
300
400
500
Rest Adenosine
p = 0.01

0
10
20
30
40
50
0
10
20
30
40
50
SDSD
NSNS P <0.05P <0.05
Perc
ent I
ncre
ase
Perc
ent I
ncre
ase
RPPRPP
BaselineBaseline On TreatOn Treat Off TreatOff Treat
MBFMBFP <0.05P <0.05
BaselineBaseline On TreatOn Treat Off TreatOff Treat
Clinical Value Long Term KnownTherapy MBF Changes in Insulin Resistance
Clinical Value Long Term KnownTherapy MBF Changes in Insulin Resistance
Quinones et al, Ann Int Med 2004:140:700-708

Herzog et al. JACC 2009;54:150-156.Herzog et al. JACC 2009;54:150-156.
Long Term Prognostic Value PET PerfusionAdded Value of Coronary Flow Reserve

Quantitative PET
• Serial PET imaging is validated, reproducible approachto quantify non-invasively myocardial blood flow at restand during stress in healthy individuals and patientswith heart disease
• The effects of pharmacological interventions, drugeffects, noxious stimuli or life style modificationprograms on myocardial blood flow and flow reservecan be measured
• The effects of physiologic processes such as agingcan be evaluated in humans
• The hemodynamic significance of coronary arterydisease can be estimated

Why Is PET More Suitable to Follow Pro/Regression of CAD
• Coronary blood flow is a function of the arterial radius raised to the fourth power
• Small changes in diameter not measurable by anatomic imaging are magnified into much larger changes in blood flow readily quantifiable by PET
• Changes in PET perfusion can be seen in 40–90 days after intense risk factor treatment is begun
Gould KL. J Nucl Cardiol. 2005;12:625-638.

Agenda
• Perfusion PET• Metabolic PET (Viability)• Hybrid Imaging (PET/CTA)
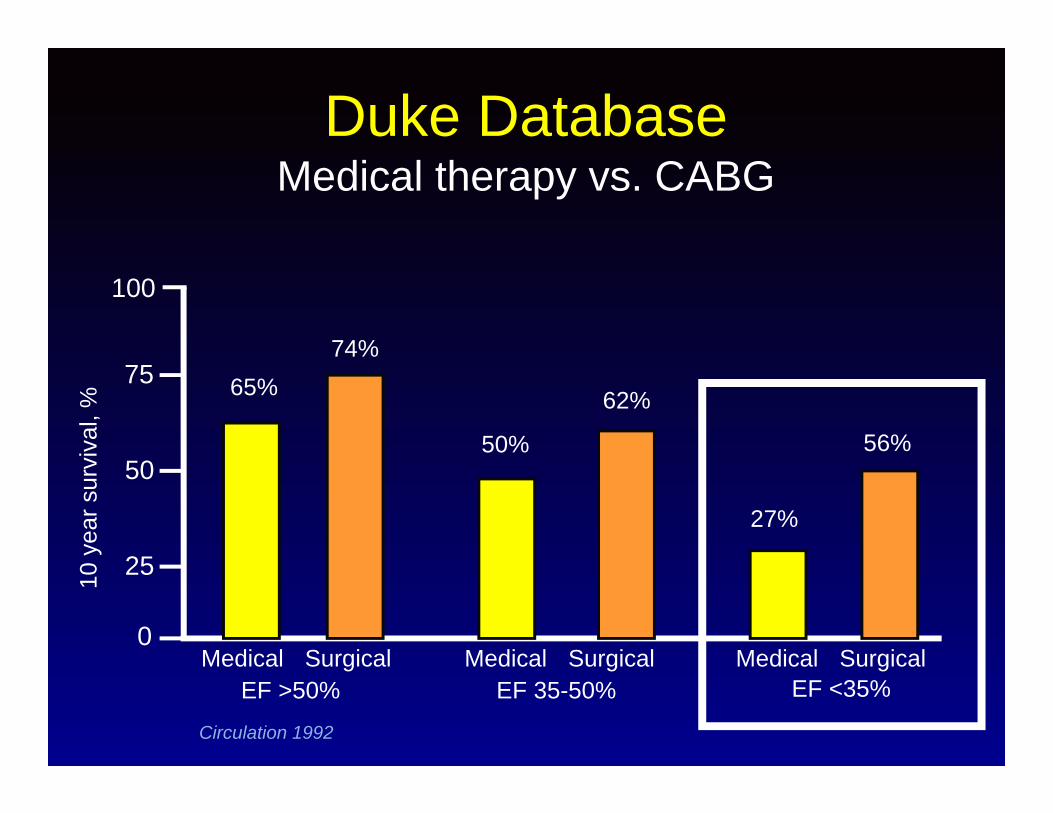
Duke DatabaseMedical therapy vs. CABG
0
100
75
50
2510 y
ear s
urvi
val,
%
Circulation 1992
Medical MedicalMedical SurgicalSurgicalSurgicalEF >50% EF <35%EF 35-50%
65%74%
56%
62%
27%
50%
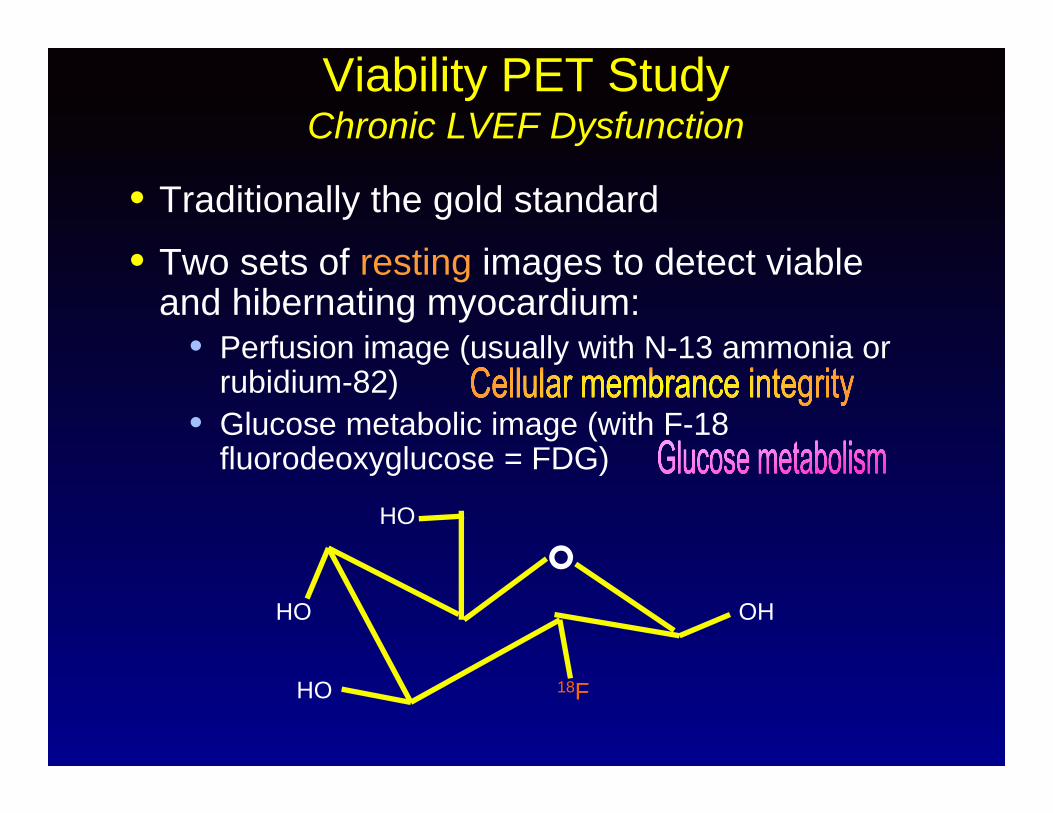
Viability PET StudyChronic LVEF Dysfunction
• Traditionally the gold standard
• Two sets of resting images to detect viable and hibernating myocardium:
• Perfusion image (usually with N-13 ammonia or rubidium-82)
• Glucose metabolic image (with F-18 fluorodeoxyglucose = FDG)
OH
HO
HO
HO
18F
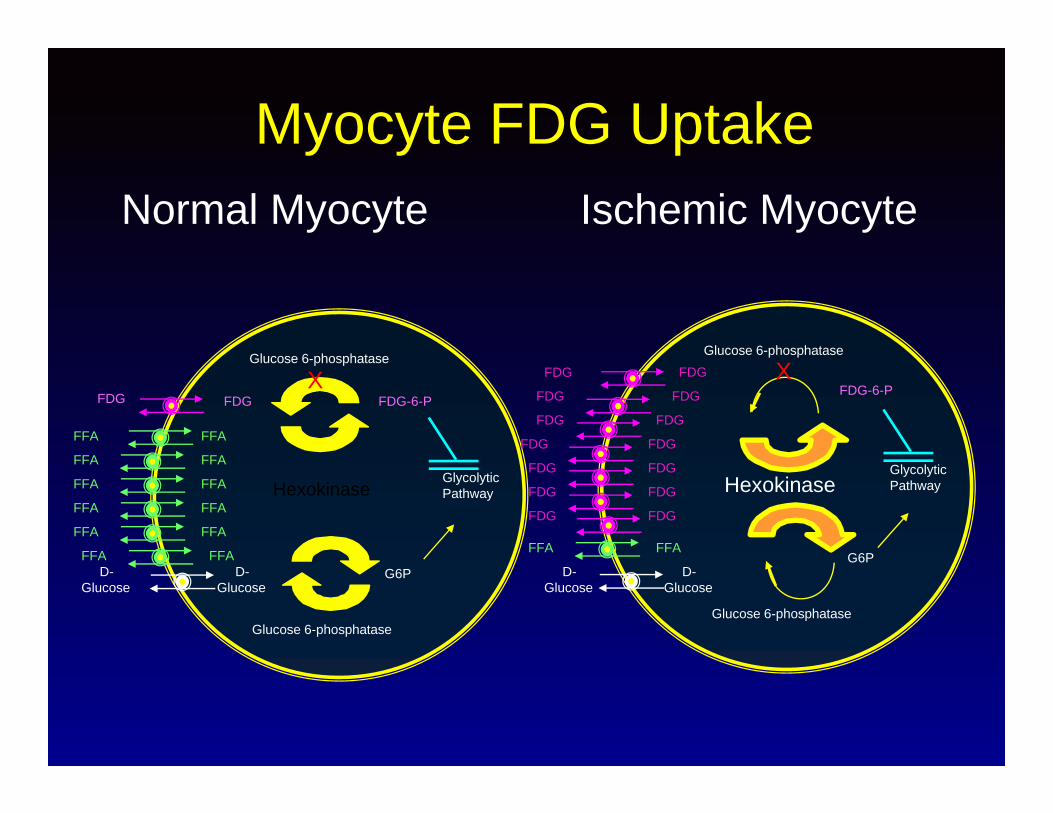
Myocyte FDG UptakeNormal Myocyte Ischemic Myocyte
Glucose 6-phosphatase
Hexokinase
Glucose 6-phosphatase
G6PD-
Glucose
GlycolyticPathway
D-Glucose
X
FFA
Glucose 6-phosphatase
Hexokinase
Glucose 6-phosphatase
FDG-6-P
G6P
GlycolyticPathway
D-Glucose
XFDGFDG
D-Glucose
FDG-6-P
FDG
FDGFDG
FDGFDG
FDGFDG
FDG
FDG
FDG
FDG
FDGFDG
FDG
FFA FFA
FFA
FFA
FFA
FFA
FFA
FFA
FFA
FFA
FFA FFA
FFA FFA

FixedFixed
FixedFixed
Partially ReversiblePartially Reversible
Partially ReversiblePartially Reversible
MatchMatch
MismatchMismatch
StressStress RestRest
FDGFDGNH3NH3
MatchMatch
MismatchMismatch
PET Myocardial Viability

PET viability protocolsTraditional semi-quantitativeflow/metabolism match-mismatchfollowing oral glucose load
Quantitative measurement (HH) of FDGuptake during glucose clamp
Circulation 1996; 93: 737-744J Clin Invest 1996; 98: 2094-2099

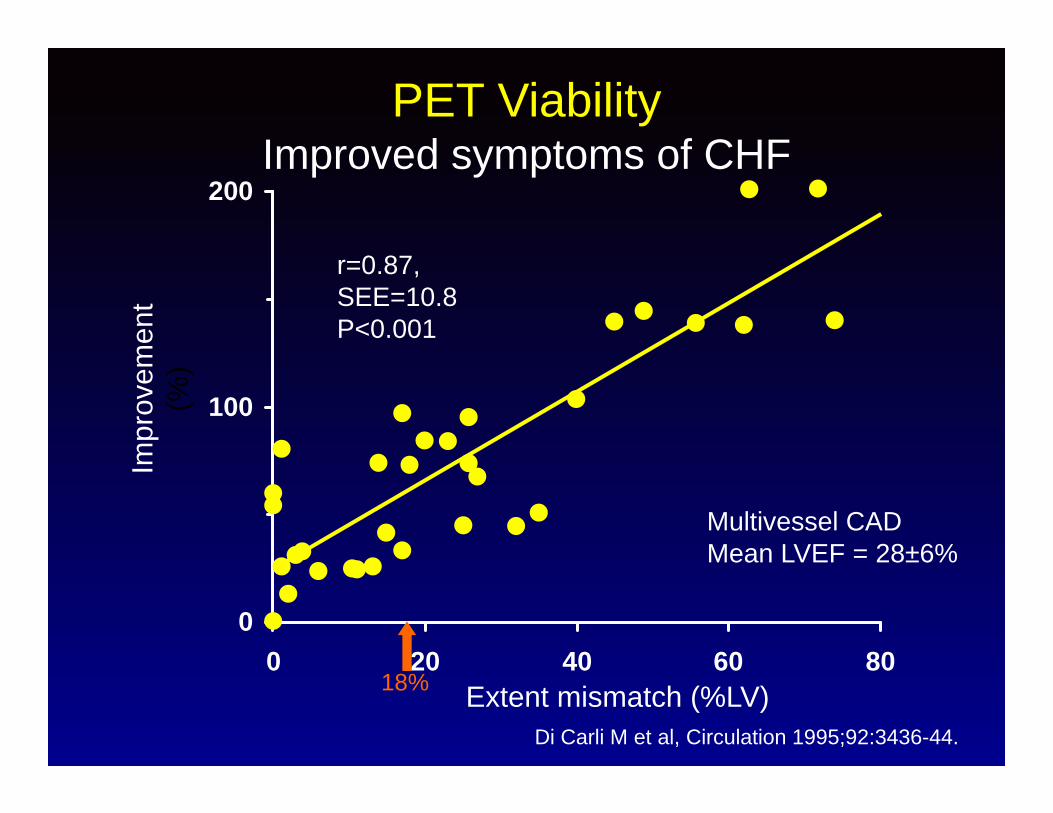
Impr
ovem
ent
(%)
Di Carli M et al, Circulation 1995;92:3436-44.
0
100
200
0 20 40 60 80Extent mismatch (%LV)
r=0.87,SEE=10.8P<0.001
PET ViabilityImproved symptoms of CHF
18%
Multivessel CADMean LVEF = 28±6%
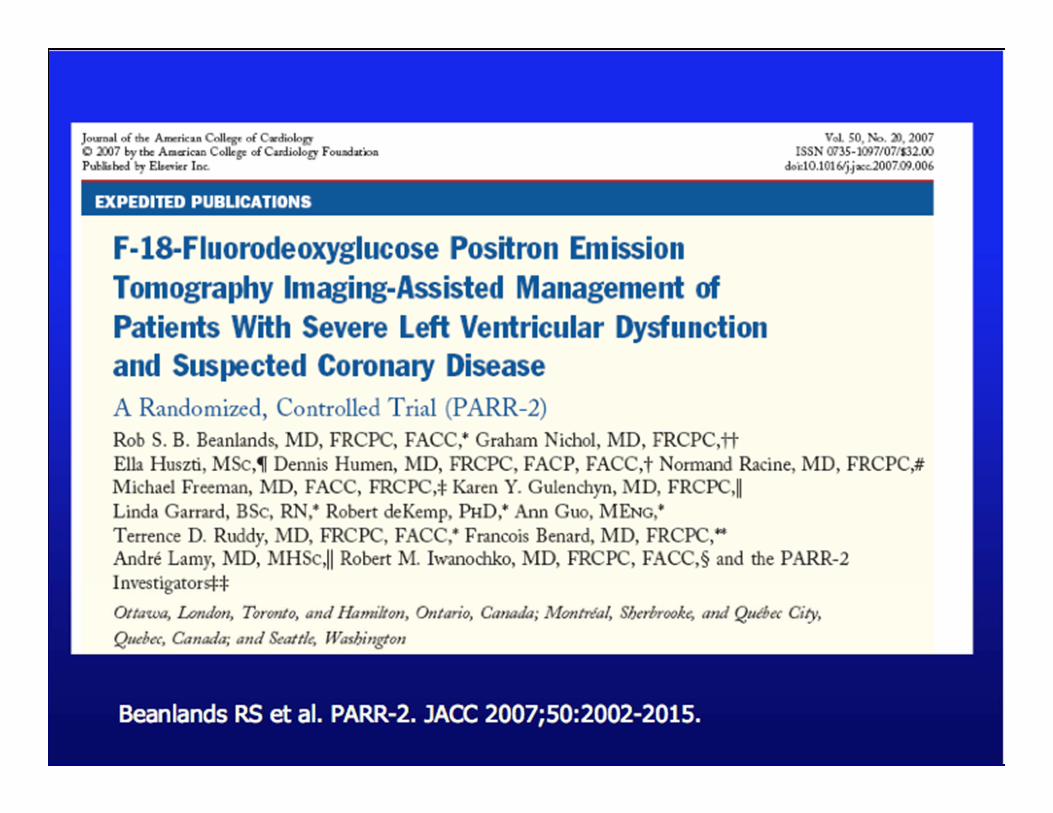

Beanlands R et al: JACC 50:2002, 2007Beanlands R et al: JACC 50:2002, 2007
0.0
0.2
0.4
0.6
0.8
1.0
0 50 100 150 200 250 300 350 400DaysDays
ADHERE armADHERE arm
Standard armStandard arm
PARR-2PET-guided Therapy vs Standard Care
Event-free
survival
Event-free
survival
p = 0.019
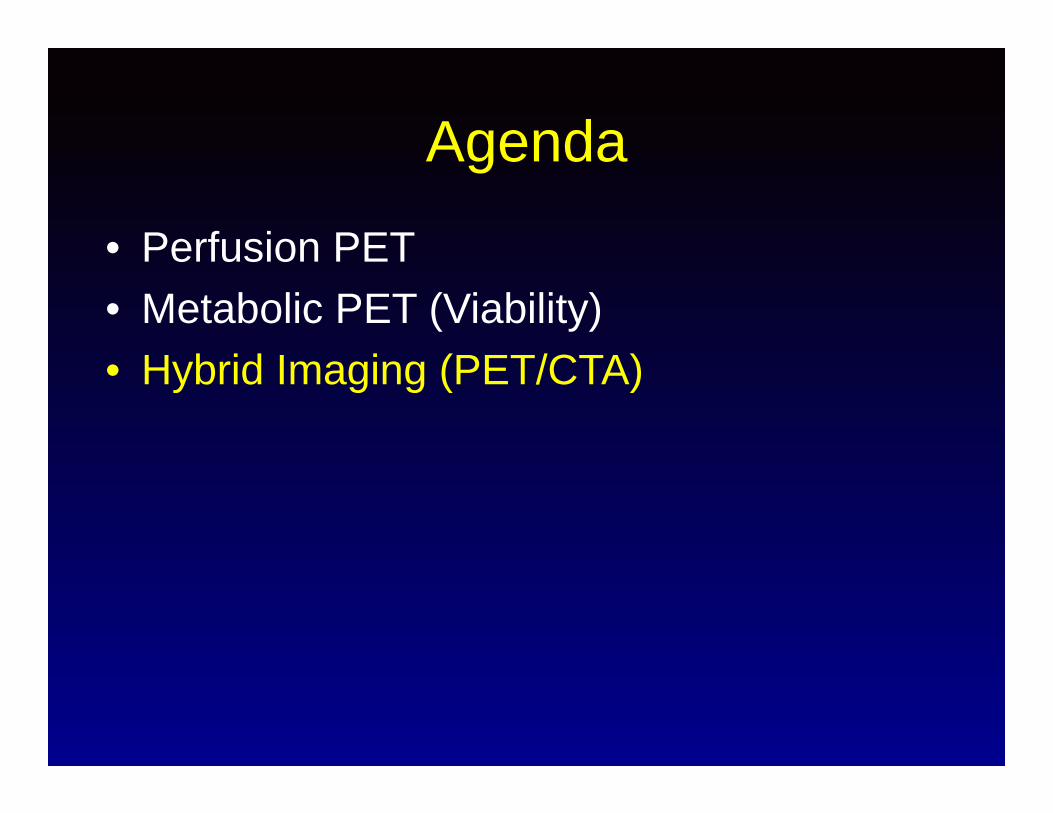
Agenda
• Perfusion PET• Metabolic PET (Viability)• Hybrid Imaging (PET/CTA)

Hybrid PET/CTA: Myocardial Perfusion and Function
Cardiac Perfusion
Concurrent Rest & Peak Stress
FunctionCTA
Coronary Calcium
Assessment

Progression of Atherosclerosis
Adapted from Abrams J. N Engl J Med. 2005;352:2524-2533.
SPECT
PETEndothelial dysfunction
Severe ischemia
CT Coronary angiography
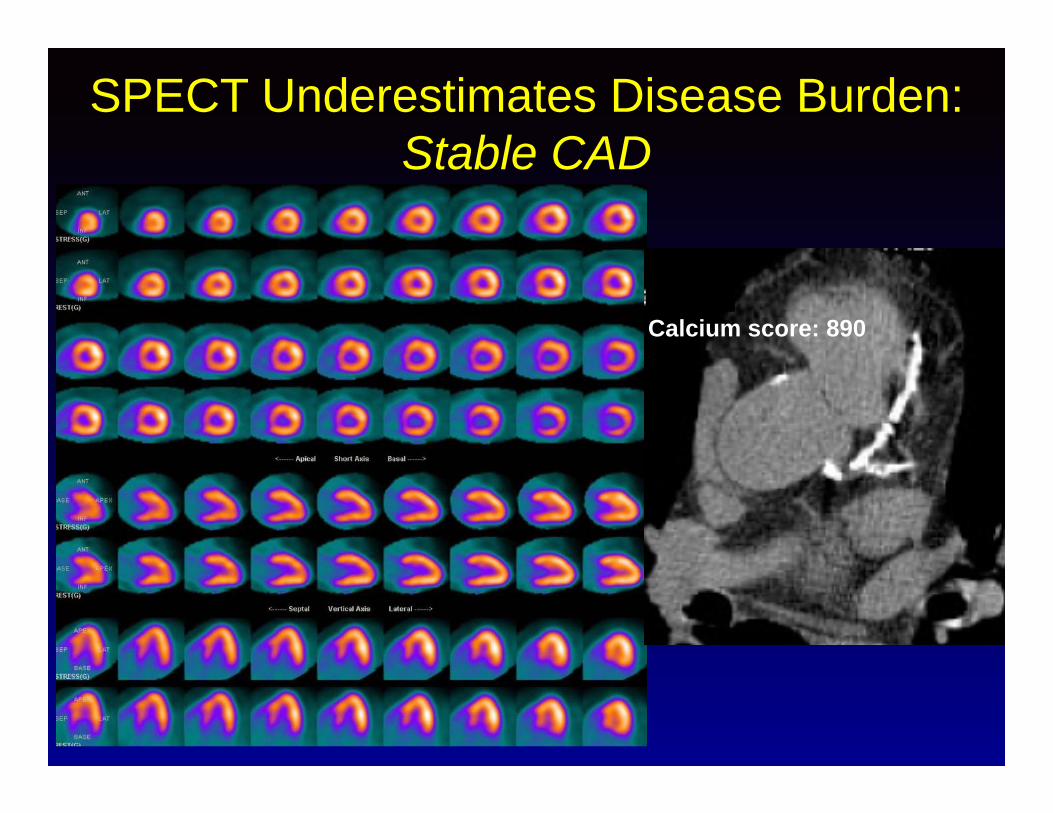
SPECT Underestimates Disease Burden: Stable CAD
Calcium score: 890

Relationship of Stress-Induced Ischemia and Atherosclerosis (CAC)
Berman DS et al. J Am Coll Cardiol. 2004;44:923-930.
Distribution of the normal MPS studies (N=1,119)
0
1-9
10-99
100-399
400-999
1000
Distribution of the ischemic MPS studies (N=76)CAC score
5%
0 %
7 %
20 %
29 %
39 %
22%
4 %
18 %
25 %
20 %
11 %
Why use PET/CTA ?• Non invasive.• Offer high diagnostic accuracy.• Monitor the course of disease.• Allow quantification of myocardial blood flow and
coronary reserve.• Detect early functional abnormalities.• Monitor consequences of lifestyle modifications.
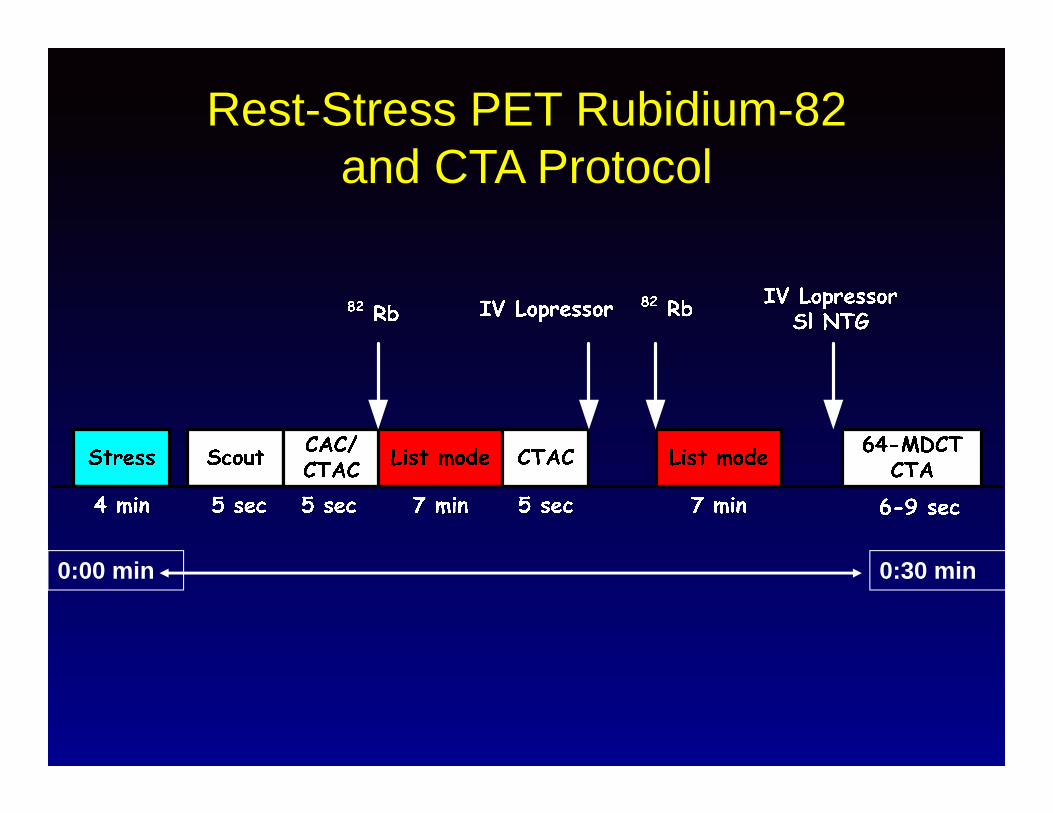
Rest-Stress PET Rubidium-82 and CTA Protocol
0:00 min 0:30 min
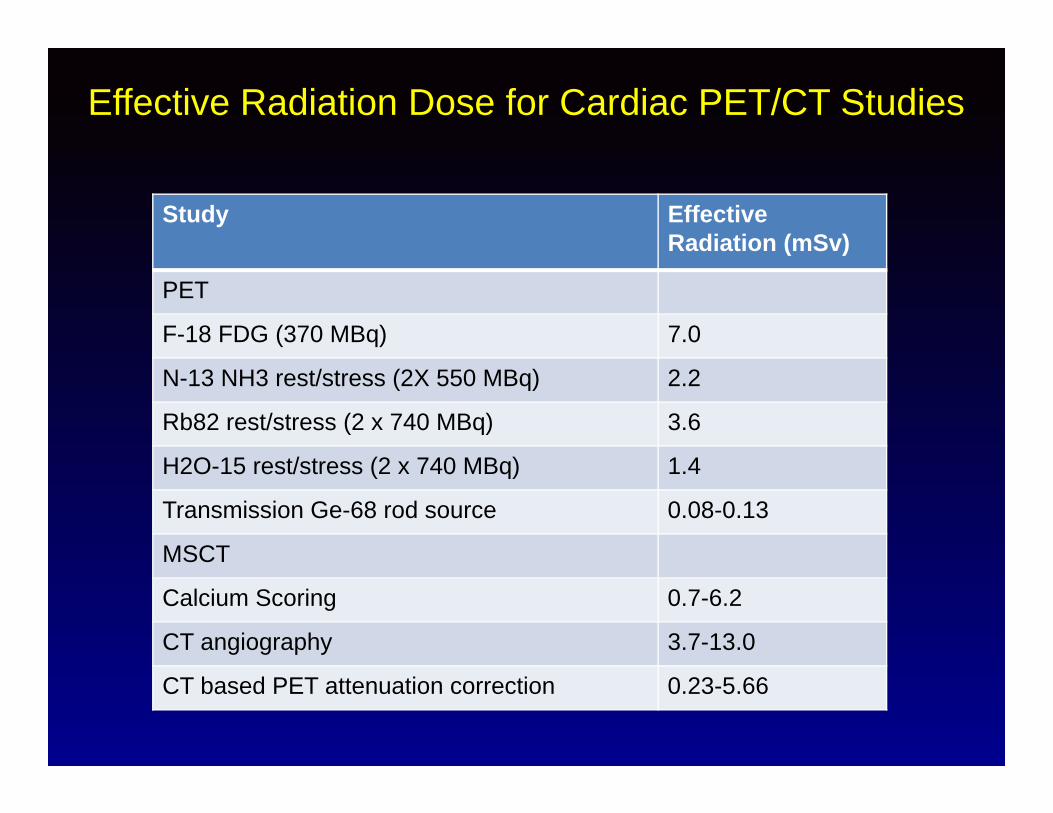
Study Effective Radiation (mSv)
PET
F-18 FDG (370 MBq) 7.0
N-13 NH3 rest/stress (2X 550 MBq) 2.2
Rb82 rest/stress (2 x 740 MBq) 3.6
H2O-15 rest/stress (2 x 740 MBq) 1.4
Transmission Ge-68 rod source 0.08-0.13
MSCT
Calcium Scoring 0.7-6.2
CT angiography 3.7-13.0
CT based PET attenuation correction 0.23-5.66
Effective Radiation Dose for Cardiac PET/CT Studies

Schenker, M. P. et al. Circulation 2008;117:1693-1700
Prognosis of Cardiac Events by PET-CTAdded Value of CAC

Kajander, S. et al. Circulation 2010;122:603-613
Hybrid PET/CTA: Myocardial Perfusion and Function

PET and CTA Complement Each Other
• Calcium (blooming)• Stents• Limited spatial resolution, <1.5-mm vessels• Overestimation of stenosis• Positive predictive value MDCT ~50%• Clinical outcomes data• Preclinical disease
Abnormal CT Angiography: Limited Positive Predictive Value
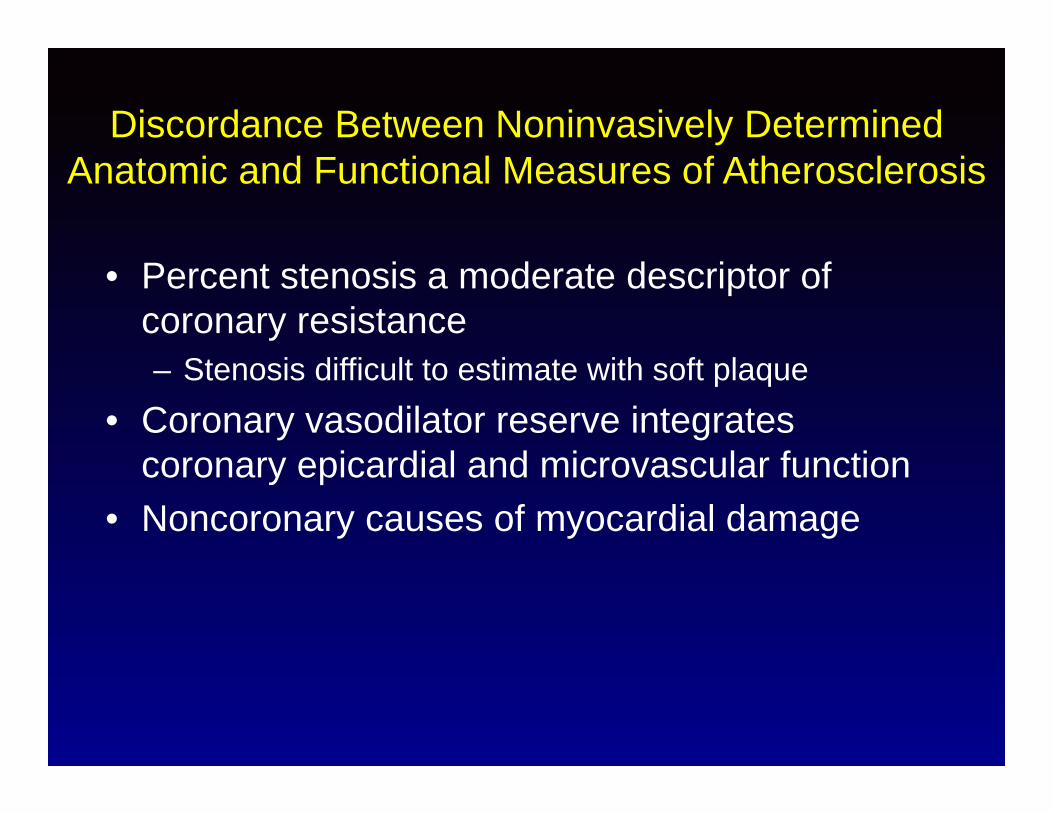
Discordance Between Noninvasively Determined Anatomic and Functional Measures of Atherosclerosis
• Percent stenosis a moderate descriptor of coronary resistance– Stenosis difficult to estimate with soft plaque
• Coronary vasodilator reserve integrates coronary epicardial and microvascular function
• Noncoronary causes of myocardial damage

PET CTA Diagnosis Potential Strategy
Normal Normal No CAD Discharge
Normal Abnormal Non-significant CAD
Medical Tx & Follow-up
Abnormal Abnormal Significant CAD
Medical Tx & Consider Cath
Abnormal Normal Coronary microvasculardysfunction
Risk ProfileModification & Consider Antianginal Tx
Scenarios in Cardiac PET/CT imaging for (suspected) Coronary Artery Disease

Lautamaki, R. et al. Circ Cardiovasc Imaging 2009;2:299-305
Infarct size measurement

Beeres, S. L.M.A. et al. J Am Coll Cardiol 2007;49:1137-1148
The Next Thing is….Tracking of Genetically Labeled Progenitor Cells by PET

Changes Coming With Hybrid ImagingNuclear Cardiology Evolution
• PET-CT:Comprehensive evaluation of CADPerfusionFunctionViabilityVulnerable Plaque Assessment (FDG ?)

Take Home Message
• Excellent sensitivity and prognosticator,CAD, severe LV dysfunction.
• Integrates function and morphology, PET/CTA.
• Unsurpassed ability to calculate MBF in preclinical and during therapy.
• Unlimited molecular imaging capabilities to target specific pathophysiology questions.


![Alignment of Cardiac Structures in H215O Perfusion PET … · Alignment of Cardiac Structures in [15O]H 2O Perfusion ... because the tracer is freely dif- ... 5.2.2 Alignment of Cardiac](https://static.fdocuments.us/doc/165x107/5afc599a7f8b9a944d8c05e0/alignment-of-cardiac-structures-in-h215o-perfusion-pet-of-cardiac-structures.jpg)