Performics Benchmarking Report Q1 2013: Paid Search, Mobile, PLAs, Social & Display
32
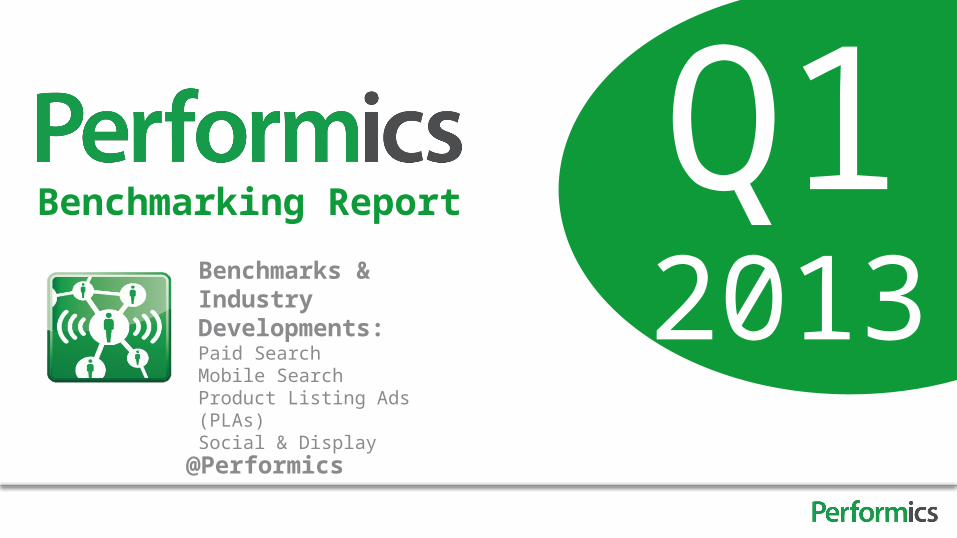
Q1 2013 Benchmarking Report Benchmarks & Industry Developments: Paid Search Mobile Search Product Listing Ads (PLAs) Social & Display @Performics
-
Upload
performics -
Category
Technology
-
view
2.770 -
download
0
Transcript of Performics Benchmarking Report Q1 2013: Paid Search, Mobile, PLAs, Social & Display
Q12013
Benchmarking Report
Benchmarks & Industry Developments:Paid SearchMobile SearchProduct Listing Ads (PLAs)Social & Display
@Performics
2
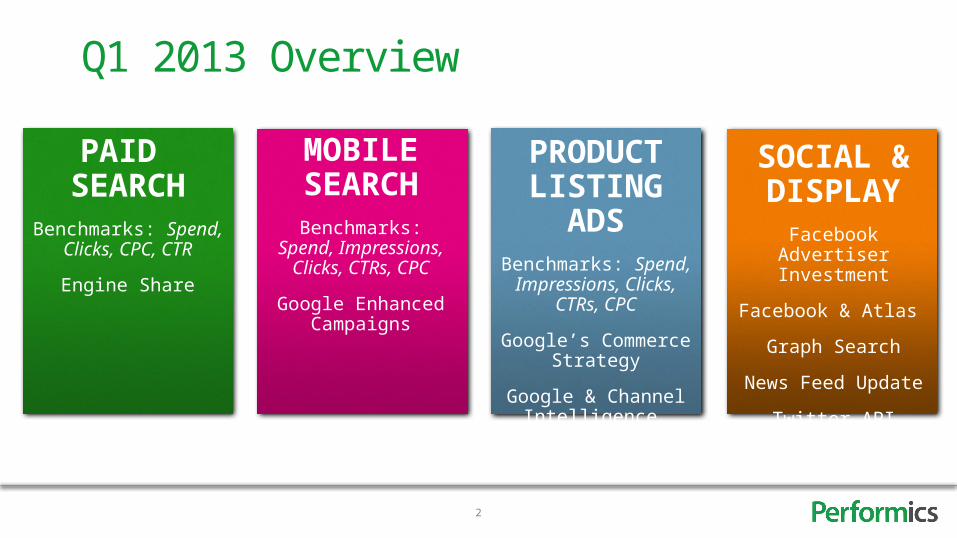
Q1 2013 Overview
MOBILE SEARCH
Benchmarks: Spend, Impressions, Clicks,
CTRs, CPC
Google Enhanced Campaigns
PRODUCT LISTING ADSBenchmarks: Spend,
Impressions, Clicks, CTRs, CPC
Google’s Commerce Strategy
Google & Channel Intelligence
PAID SEARCH
Benchmarks: Spend, Clicks, CPC, CTR
Engine Share
SOCIAL & DISPLAY
Facebook Advertiser Investment
Facebook & Atlas
Graph Search
News Feed Update
Twitter API

Paid Search
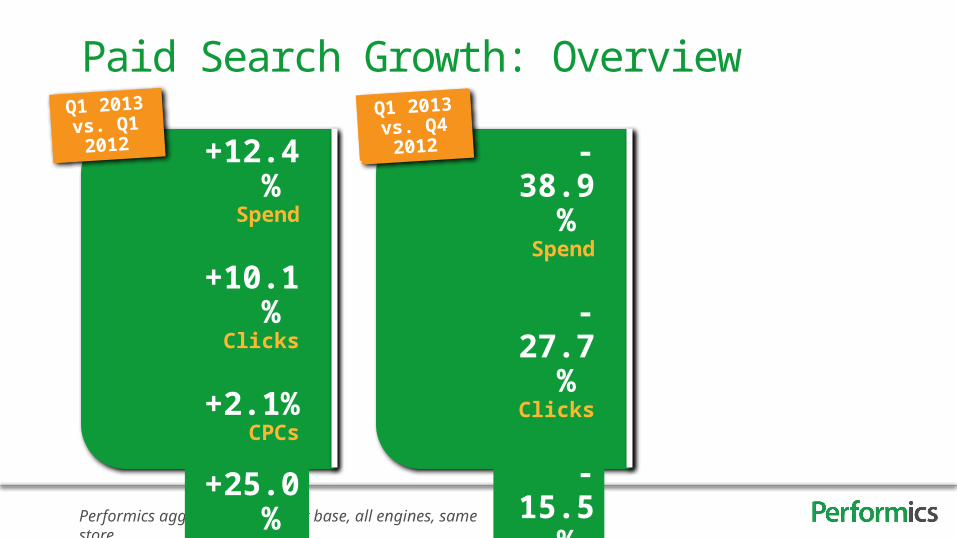
Performics aggregate U.S. client base, all engines, same store
+12.4% Spend
+10.1% Clicks
+2.1% CPCs
+25.0% CTRs
Paid Search Growth: Overview
-38.9% Spend
-27.7% Clicks
-15.5% CPCs
+8.9% CTRs
Q1 2013 vs. Q1 2012
Q1 2013 vs. Q4 2012
+12.4% Spend
+10.1% Clicks
+2.1% CPCs
+25.0% CTRs
-38.9% Spend
-27.7% Clicks
-15.5% CPCs
+8.9% CTRs
Q1 2013 vs. Q1 2012
Q1 2013 vs. Q4 2012
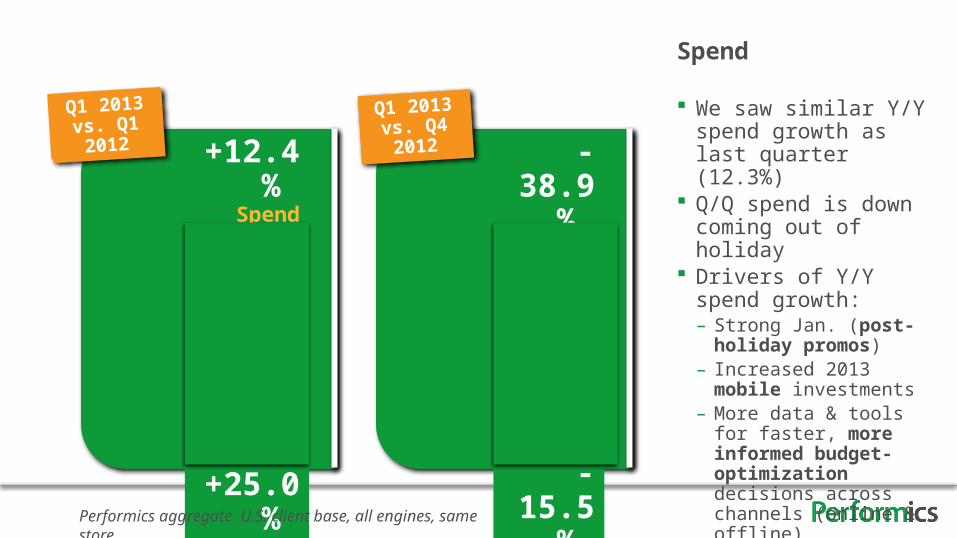
Spend
We saw similar Y/Y spend growth as last quarter (12.3%)
Q/Q spend is down coming out of holiday
Drivers of Y/Y spend growth:– Strong Jan. (post-holiday
promos)– Increased 2013 mobile
investments– More data & tools for faster,
more informed budget-optimization decisions across channels (online & offline)
Performics aggregate U.S. client base, all engines, same store
+12.4% Spend
+10.1% Clicks
+2.1% CPCs
+25.0% CTRs
-38.9% Spend
-27.7% Clicks
-15.5% CPCs
+8.9% CTRs
Q1 2013 vs. Q1 2012
Q1 2013 vs. Q4 2012
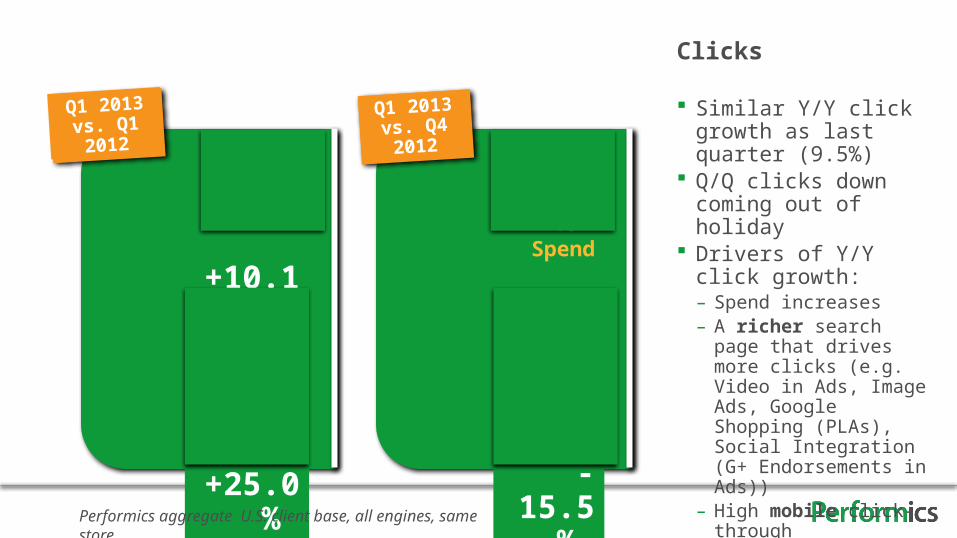
Clicks
Similar Y/Y click growth as last quarter (9.5%)
Q/Q clicks down coming out of holiday
Drivers of Y/Y click growth:– Spend increases– A richer search page that
drives more clicks (e.g. Video in Ads, Image Ads, Google Shopping (PLAs), Social Integration (G+ Endorsements in Ads))
– High mobile click-through
Performics aggregate U.S. client base, all engines, same store
+12.4% Spend
+10.1% Clicks
+2.1% CPCs
+25.0% CTRs
-38.9% Spend
-27.7% Clicks
-15.5% CPCs
+8.9% CTRs
Q1 2013 vs. Q1 2012
Q1 2013 vs. Q4 2012
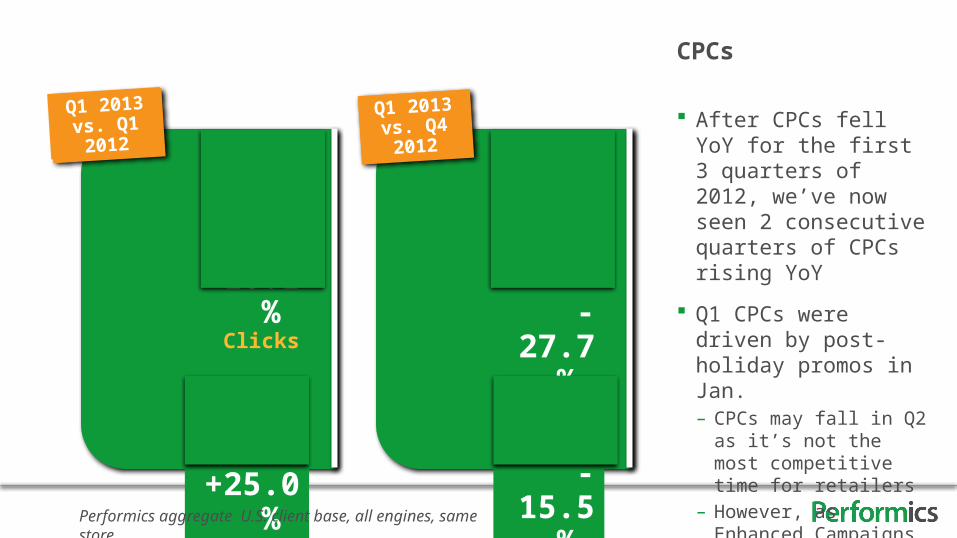
CPCs
After CPCs fell YoY for the first 3 quarters of 2012, we’ve now seen 2 consecutive quarters of CPCs rising YoY
Q1 CPCs were driven by post-holiday promos in Jan.– CPCs may fall in Q2 as it’s
not the most competitive time for retailers
– However, as Enhanced Campaigns roll out (summer) CPCs could rise
Performics aggregate U.S. client base, all engines, same store
+12.4% Spend
+10.1% Clicks
+2.1% CPCs
+25.0% CTRs
-38.9% Spend
-27.7% Clicks
-15.5% CPCs
+8.9% CTRs
Q1 2013 vs. Q1 2012
Q1 2013 vs. Q4 2012
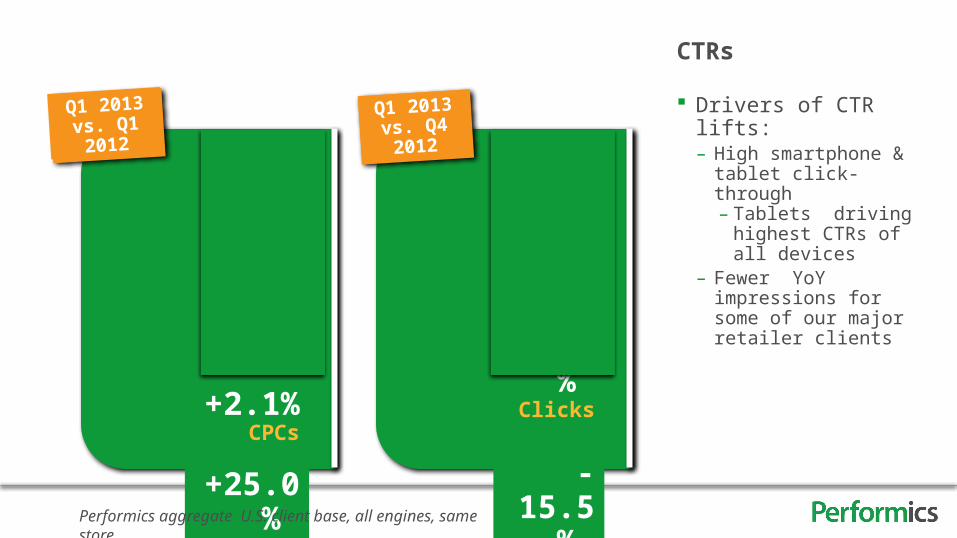
CTRs
Drivers of CTR lifts:– High smartphone & tablet
click-through– Tablets driving highest
CTRs of all devices– Fewer YoY impressions for
some of our major retailer clients
Performics aggregate U.S. client base, all engines, same store
9
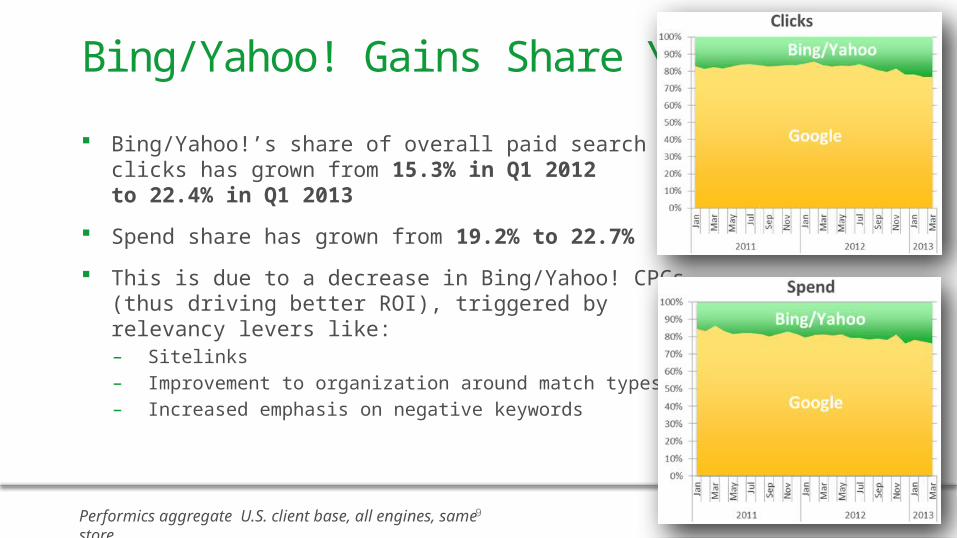
Bing/Yahoo!’s share of overall paid search clicks has grown from 15.3% in Q1 2012 to 22.4% in Q1 2013
Spend share has grown from 19.2% to 22.7%
This is due to a decrease in Bing/Yahoo! CPCs (thus driving better ROI), triggered by relevancy levers like:– Sitelinks – Improvement to organization around match types– Increased emphasis on negative keywords
Bing/Yahoo! Gains Share YoY
Performics aggregate U.S. client base, all engines, same store

Mobile Search
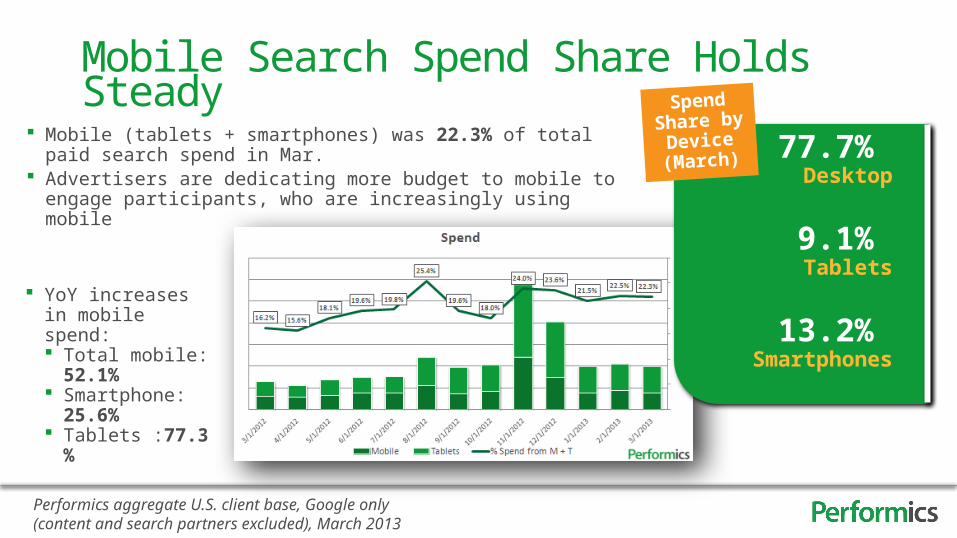
Mobile Search Spend Share Holds Steady
Performics aggregate U.S. client base, Google only (content and search partners excluded), March 2013
Mobile (tablets + smartphones) was 22.3% of total paid search spend in Mar. Advertisers are dedicating more budget to mobile to engage participants,
who are increasingly using mobile77.7%
Desktop
9.1% Tablets
13.2% Smartphones
Spend Share by
Device (March)
YoY increases in mobile spend: Total mobile: 52.1% Smartphone: 25.6% Tablets :77.3%
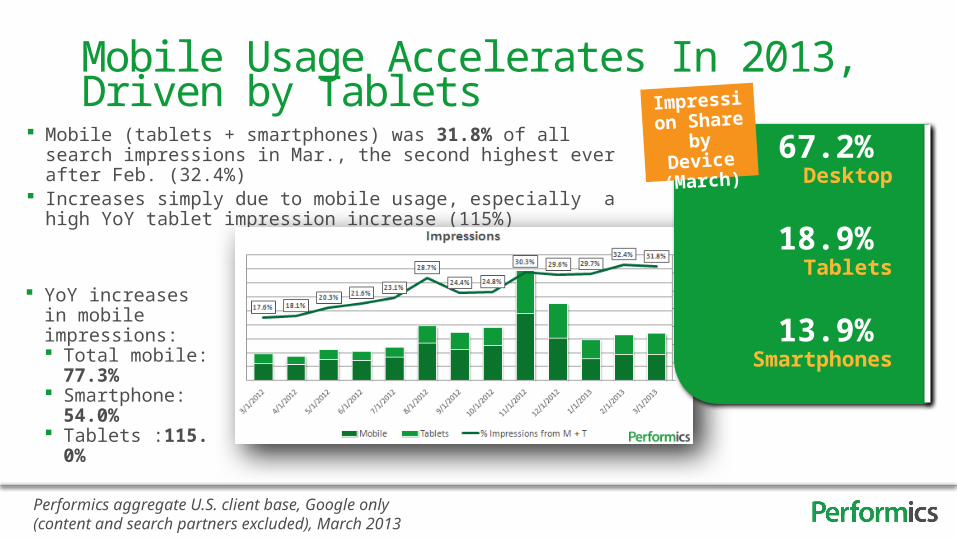
Mobile Usage Accelerates In 2013, Driven by Tablets
Performics aggregate U.S. client base, Google only (content and search partners excluded), March 2013
Mobile (tablets + smartphones) was 31.8% of all search impressions in Mar., the second highest ever after Feb. (32.4%)
Increases simply due to mobile usage, especially a high YoY tablet impression increase (115%)
YoY increases in mobile impressions: Total mobile: 77.3% Smartphone: 54.0% Tablets :115.0%
67.2% Desktop
18.9% Tablets
13.9% Smartphones
Impression Share by
Device (March)
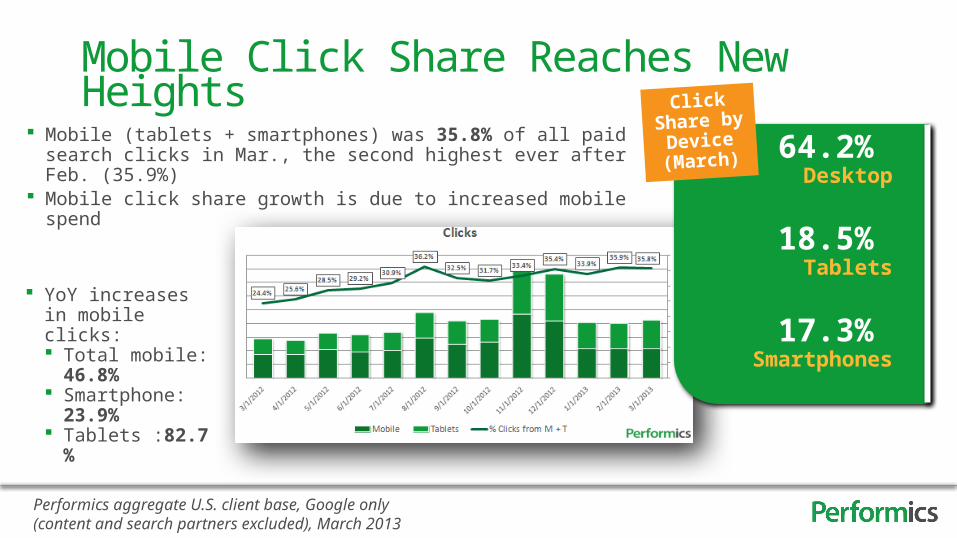
Mobile Click Share Reaches New Heights
Performics aggregate U.S. client base, Google only (content and search partners excluded), March 2013
Mobile (tablets + smartphones) was 35.8% of all paid search clicks in Mar., the second highest ever after Feb. (35.9%)
Mobile click share growth is due to increased mobile spend
YoY increases in mobile clicks: Total mobile: 46.8% Smartphone: 23.9% Tablets :82.7%
64.2% Desktop
18.5% Tablets
17.3% Smartphones
Click Share by Device (March)
14
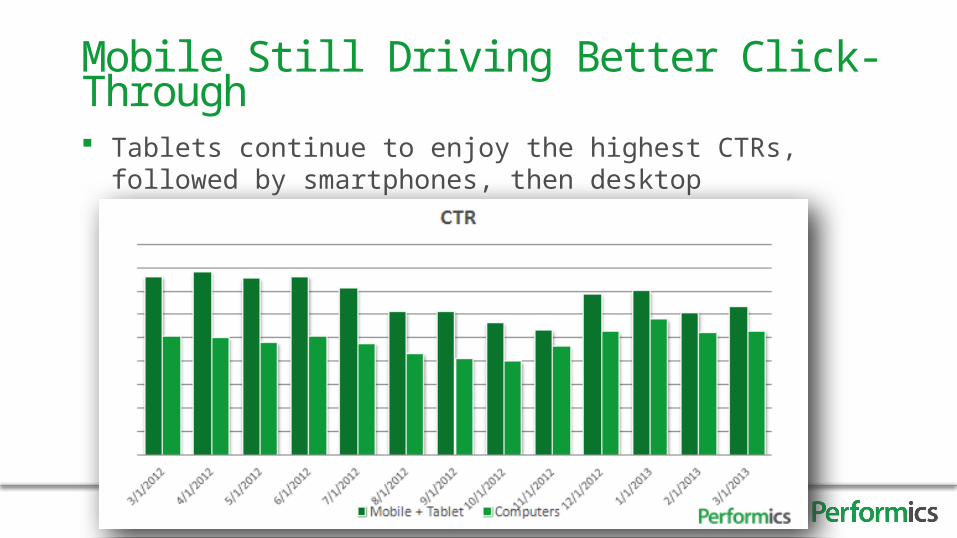
Tablets continue to enjoy the highest CTRs, followed by smartphones, then desktop
Mobile Still Driving Better Click-Through
15
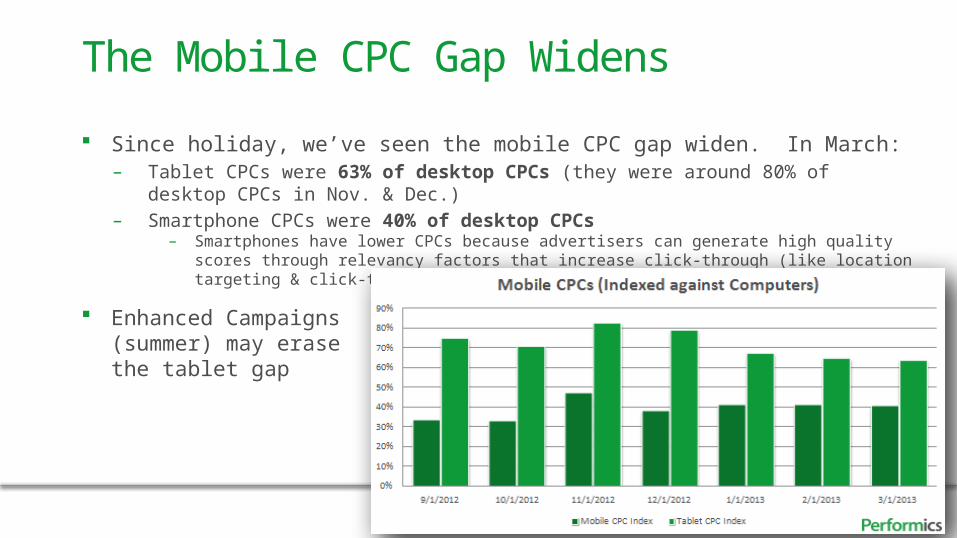
Since holiday, we’ve seen the mobile CPC gap widen. In March:– Tablet CPCs were 63% of desktop CPCs (they were around 80% of desktop CPCs in Nov. & Dec.)– Smartphone CPCs were 40% of desktop CPCs
– Smartphones have lower CPCs because advertisers can generate high quality scores through relevancy factors that increase click-through (like location targeting & click-to-call)
Enhanced Campaigns (summer) may erasethe tablet gap
The Mobile CPC Gap Widens
16
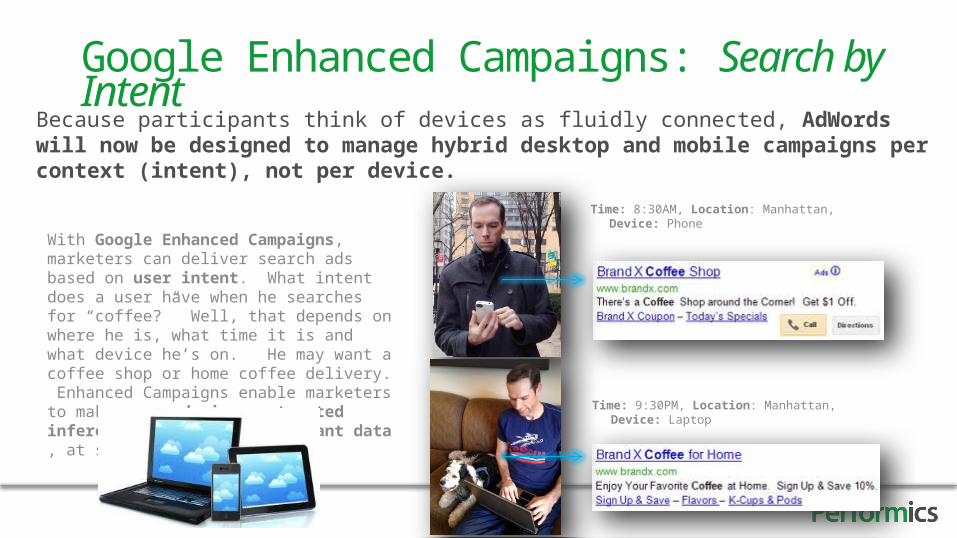
Google Enhanced Campaigns: Search by Intent
With Google Enhanced Campaigns, marketers can deliver search ads based on user intent. What intent does a user have when he searches for “coffee?” Well, that depends on where he is, what time it is and what device he’s on. He may want a coffee shop or home coffee delivery. Enhanced Campaigns enable marketers to make cross-device, automated inferences based on participant data , at scale
Because participants think of devices as fluidly connected, AdWords will now be designed to manage hybrid desktop and mobile campaigns per context (intent), not per device.
Time: 8:30AM, Location: Manhattan, Device: Phone
Time: 9:30PM, Location: Manhattan, Device: Laptop
17
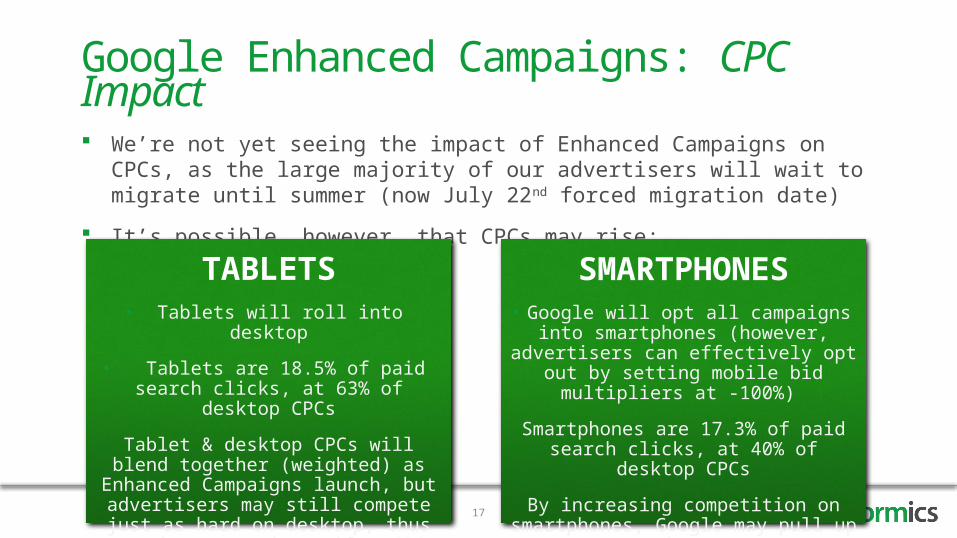
We’re not yet seeing the impact of Enhanced Campaigns on CPCs, as the large majority of our advertisers will wait to migrate until summer (now July 22nd forced migration date)
It’s possible, however, that CPCs may rise:
Google Enhanced Campaigns: CPC Impact
TABLETS• Tablets will roll into desktop
• Tablets are 18.5% of paid search clicks, at 63% of desktop CPCs
Tablet & desktop CPCs will blend together (weighted) as Enhanced Campaigns launch,
but advertisers may still compete just as hard on desktop, thus erasing any prior tablet CPC
efficiencies over time
SMARTPHONES• Google will opt all campaigns into smartphones (however, advertisers can effectively opt out by setting mobile bid
multipliers at -100%)
Smartphones are 17.3% of paid search clicks, at 40% of desktop CPCs
By increasing competition on smartphones, Google may pull up smartphone CPCs
Product Listing Ads (Google Shopping)
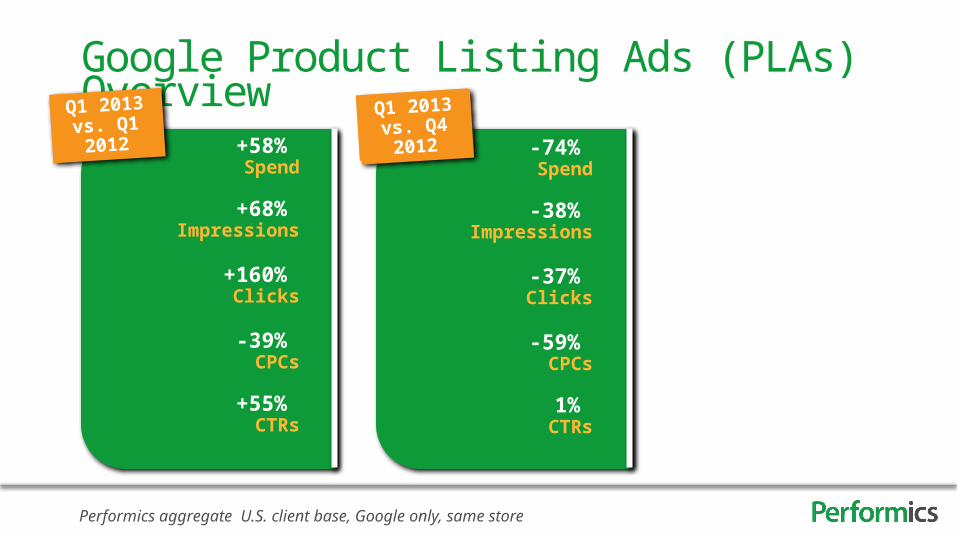
Google Product Listing Ads (PLAs) Overview
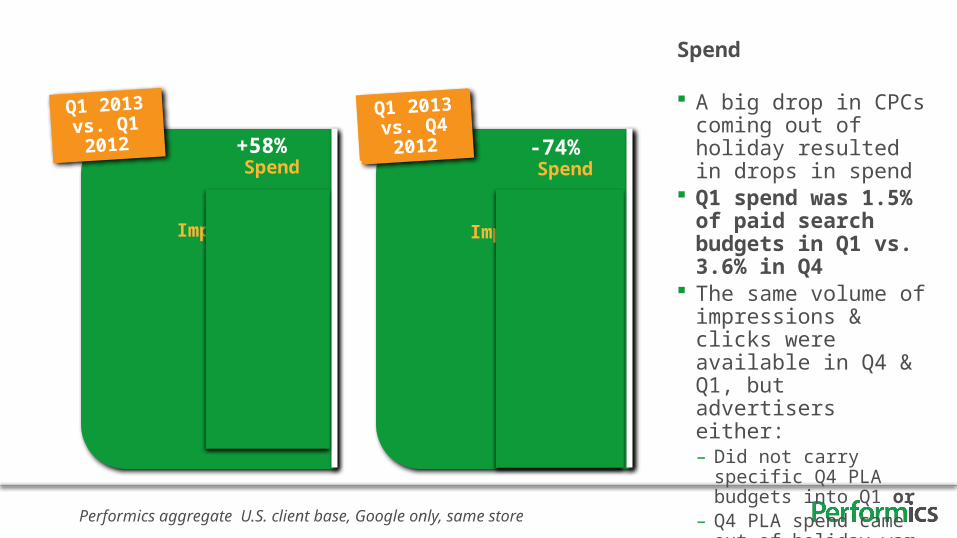
+58% Spend
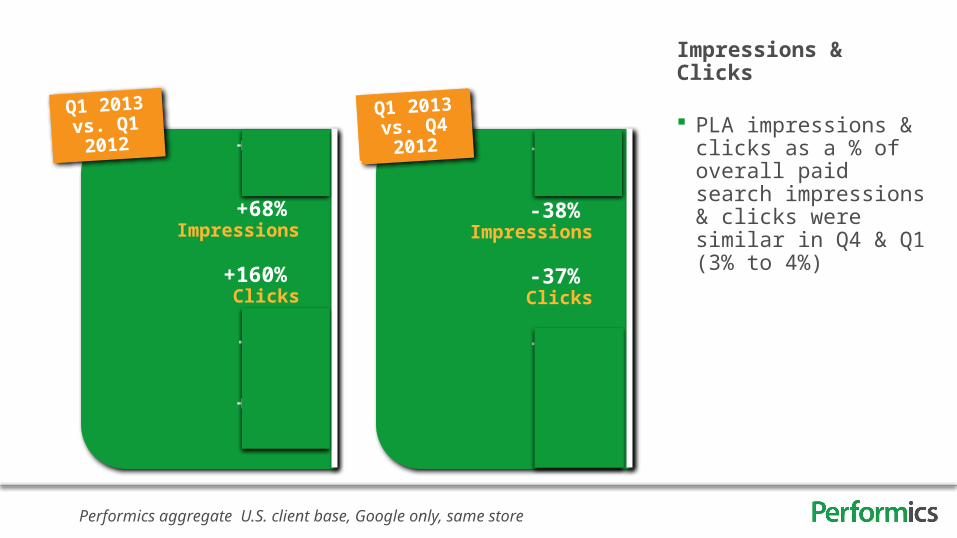
+68% Impressions
+160%
Clicks
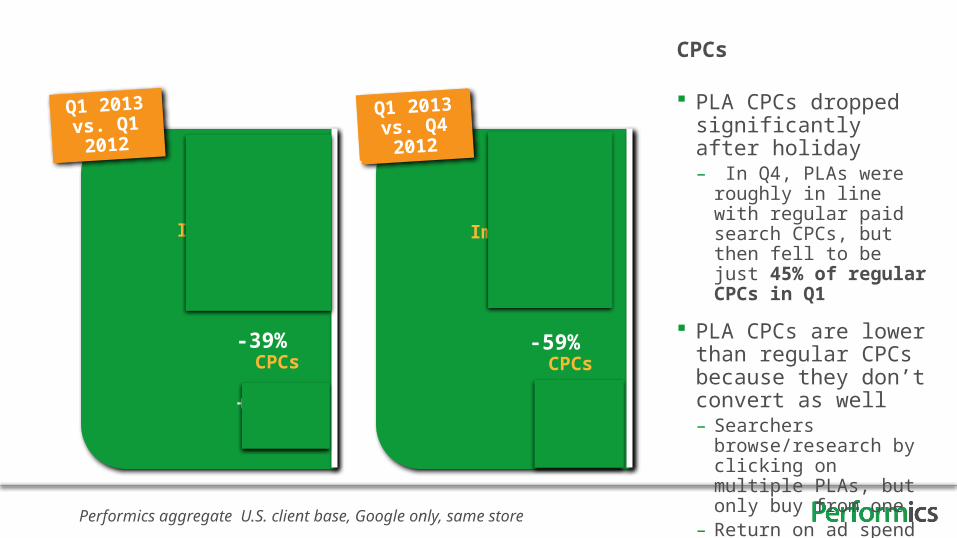
-39% CPCs
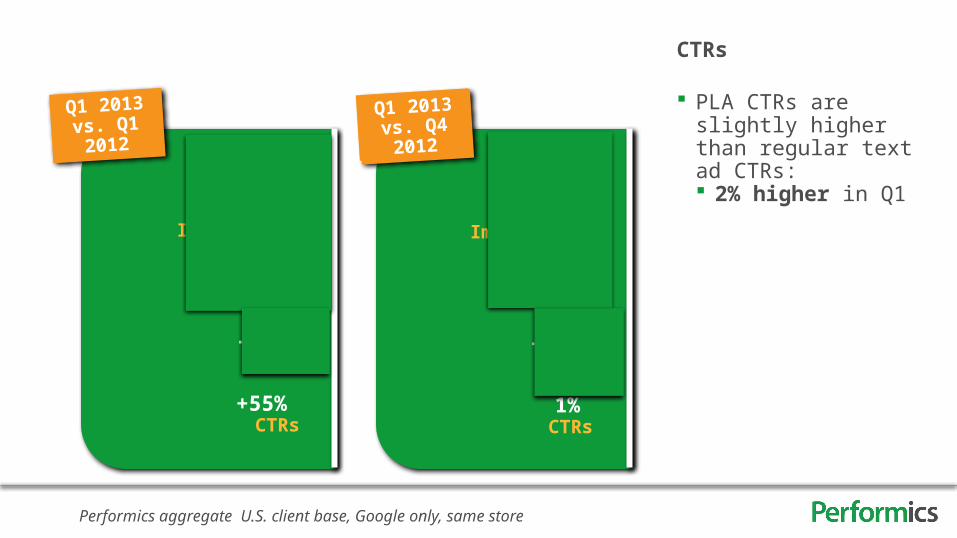
+55% CTRs
Q1 2013 vs. Q1 2012
Performics aggregate U.S. client base, Google only, same store
-74% Spend
-38% Impressions
-37% Clicks
-59% CPCs
1% CTRs
Q1 2013 vs. Q4 2012
+58% Spend
+68% Impressions
+160%
Clicks
-39% CPCs
+55% CTRs
Q1 2013 vs. Q1 2012
Performics aggregate U.S. client base, Google only, same store
-74% Spend
-38% Impressions
-37% Clicks
-59% CPCs
1% CTRs
Q1 2013 vs. Q4 2012
Spend
A big drop in CPCs coming out of holiday resulted in drops in spend
Q1 spend was 1.5% of paid search budgets in Q1 vs. 3.6% in Q4
The same volume of impressions & clicks were available in Q4 & Q1, but advertisers either:– Did not carry specific Q4
PLA budgets into Q1 or– Q4 PLA spend came out of
holiday war chests. Now advertisers need time to test PLAs to justify budgets.
+58% Spend
+68% Impressions
+160%
Clicks
-39% CPCs
+55% CTRs
Q1 2013 vs. Q1 2012
Performics aggregate U.S. client base, Google only, same store
-74% Spend
-38% Impressions
-37% Clicks
-59% CPCs
1% CTRs
Q1 2013 vs. Q4 2012
Impressions & Clicks
PLA impressions & clicks as a % of overall paid search impressions & clicks were similar in Q4 & Q1 (3% to 4%)
+58% Spend
+68% Impressions
+160%
Clicks
-39% CPCs
+55% CTRs
Q1 2013 vs. Q1 2012
Performics aggregate U.S. client base, Google only, same store
-74% Spend
-38% Impressions
-37% Clicks
-59% CPCs
1% CTRs
Q1 2013 vs. Q4 2012
CPCs
PLA CPCs dropped significantly after holiday– In Q4, PLAs were roughly in
line with regular paid search CPCs, but then fell to be just 45% of regular CPCs in Q1
PLA CPCs are lower than regular CPCs because they don’t convert as well– Searchers browse/research
by clicking on multiple PLAs, but only buy from one
– Return on ad spend is about half as compared to regular paid search
+58% Spend
+68% Impressions
+160%
Clicks
-39% CPCs
+55% CTRs
Q1 2013 vs. Q1 2012
Performics aggregate U.S. client base, Google only, same store
-74% Spend
-38% Impressions
-37% Clicks
-59% CPCs
1% CTRs
Q1 2013 vs. Q4 2012
CTRs
PLA CTRs are slightly higher than regular text ad CTRs: 2% higher in Q1
24
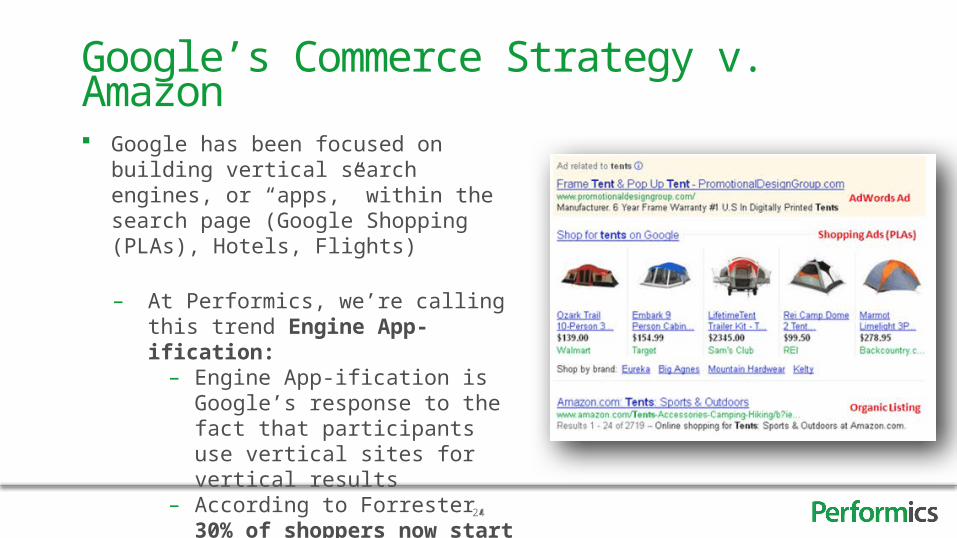
Google has been focused on building vertical search engines, or “apps,” within the search page (Google Shopping (PLAs), Hotels, Flights)
– At Performics, we’re calling this trend Engine App-ification:– Engine App-ification is Google’s
response to the fact that participants use vertical sites for vertical results
– According to Forrester, 30% of shoppers now start their searches on Amazon; only 13% start their searches on Google
Google’s Commerce Strategy v. Amazon
25
In Feb., Google announced that it had agreed to acquire Channel Intelligence
The CI purchase is the next step in Google’s commerce plan
CI will bolster Google Shopping (PLAs), which will only become more important to advertisers as Google seeks to build a Shopping catalog that can compete with Amazon
In this new landscape, where shopping and search are one, retailers must have an integrated shopping feeds-search experience
Google Channel Intelligence (CI) Acquisition
Full Performics POV
Social & Display
27
Facebook’s new products & tools have enabled our clientsto invest more:– View-through Tracking: We can now quantify leads & sales (not just fans gained),
enabling advertisers to invest more direct-response dollars– Facebook Ad Exchange (FBX): Advertisers can now better target (e.g. by browsing
history). A user’s recent browsing data is more likely to indicate intent to purchase than Facebook’s other targeting options (e.g. profile demographics or interests).
– Atlas, Graph Search & the new News Feed may further spur advertiser investment throughout the rest of 2013
Facebook Advertiser Investment
28
In Feb., Facebook announced that it agreed to acquire the Atlas Advertiser Suite from Microsoft
Facebook has been a self-contained channel (“walled garden”); data derived from Facebook’s users could only be used to optimize ads on Facebook
With Atlas, Facebook instantly becomes a cross-web network, with all of Atlas’s publisher relationships in place
Atlas will better enable advertisers to leverage Facebook’s massive participant dataset to serve ads across the web
Breaking From the “Walled Garden”
Full Performics POV
29
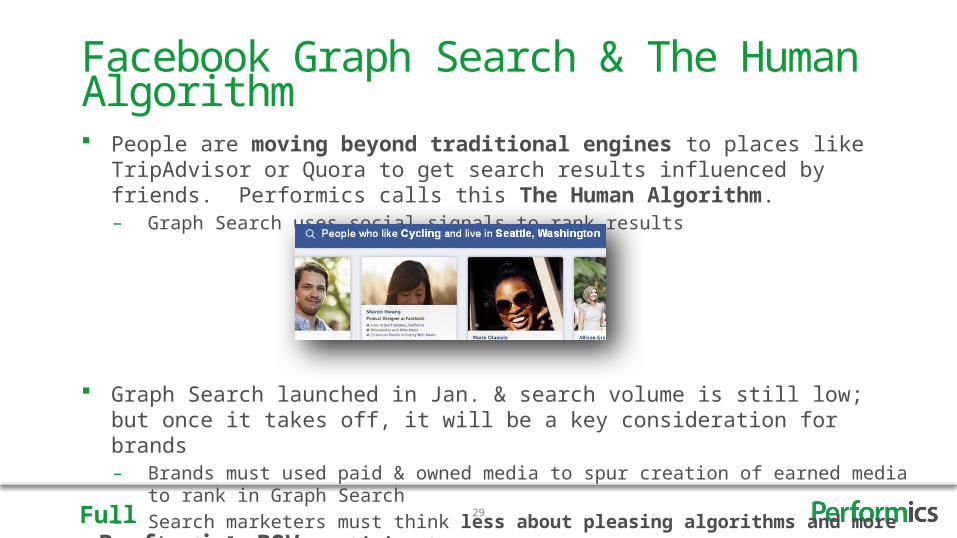
People are moving beyond traditional engines to places like TripAdvisor or Quora to get search results influenced by friends. Performics calls this The Human Algorithm.– Graph Search uses social signals to rank results
Graph Search launched in Jan. & search volume is still low; but once it takes off, it will be a key consideration for brands– Brands must used paid & owned media to spur creation of earned media to rank in Graph Search– Search marketers must think less about pleasing algorithms and more about pleasing participants
Facebook Graph Search & The Human Algorithm
Full Performics POV
30
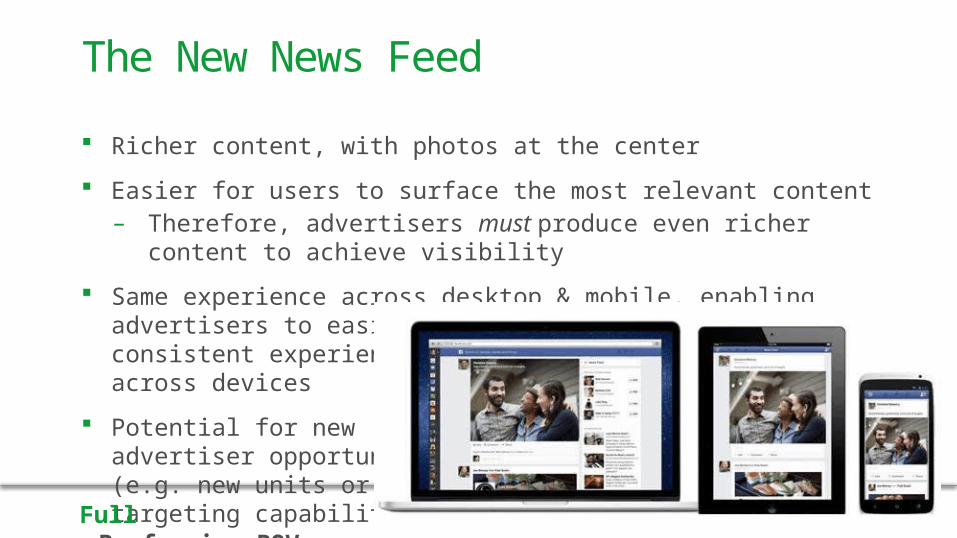
Richer content, with photos at the center
Easier for users to surface the most relevant content– Therefore, advertisers must produce even richer content to achieve visibility
Same experience across desktop & mobile, enabling advertisers to easily create consistent experiences across devices
Potential for new advertiser opportunities (e.g. new units or new targeting capabilities)
The New News Feed
Full Performics POV
31
In Feb., Twitter released its new API (it will charge advertisers to connect)
By allowing companies to build on its API, Twitter will more effectively compete with Facebook, which sees 60% of its ad revenue come through its API
The API will allow advertisers to measure, optimize, and promote their content immediately as events unfold
As third-party partners build on the API, marketers will find greater ease of use and access to Twitter’s products–social listening, content development, paid promotion
A New Revenue Source for Twitter
Full Performics POV
BLOG.PERFORMICS.COMSLIDESHARE: PERFORMICS_US@Performics
Benchmarking Report