
Performance Testing What can you achieve with your MB System?
12
Performance Testing Performance Testing What can you achieve with your MB System?
-
Upload
jennifer-shields -
Category
Documents
-
view
225 -
download
1
Transcript of Performance Testing What can you achieve with your MB System?

Performance TestingPerformance Testing
What can you achieve with your MB System?

Performance TestingPerformance Testing
Note: You can use the Corps of Engineers Standards or set your own.Note: You can use the Corps of Engineers Standards or set your own.
Questions We Might Ask About Our Multibeam Data:Questions We Might Ask About Our Multibeam Data:
•How noisy is it? (What is the repeatability?)
•How much of the swath can I use?
•How does it compare with single beam?
Two Performance Tests in MBMAX Help to AnswerTwo Performance Tests in MBMAX Help to Answer
• Beam Angle Test – Shows multibeam repeatability vs. beam angle.
• Check Line Statistics – Compares multibeam vs. single beam depths.
• Compare results to standards or project requirements
Bottom Type Hard Soft
Maximum Outlier 1 ft 1 ftMax. Mean Bias <0.1 ft <0.2 ft95% confidence
depth < 15 ft ±0.5 ft ±0.5 ftdepth 15 – 40 ft ±1.0 ft ±1.0 ft depth > 40 ft ±1.0 ft ±2.0 ft
From Table 3-1: Minimum Performance Standards for Corps of Engineers Hydrographic Surveys

Create Your Reference Surface.Create Your Reference Surface.Location
•Small area with a very flat, uniform bottom. Slope should be <5%
•The flat surface is to prevent DGPS position errors from influencing the results.
•Using lots of overlap and area of nadir depths (in processing) we get the best possible estimation of depth.
Preparation and Survey
•Two sets of 7 parallel lines, crossing at 90 degreesTwo sets of 7 parallel lines, crossing at 90 degrees
Separation = water depth. This will allow valid stats out to 75 Separation = water depth. This will allow valid stats out to 75 degrees from nadir.degrees from nadir.
•Reference MTXReference MTX with 1’ x 1’ cells.with 1’ x 1’ cells.
•Survey at low or high tides to minimize errors. SV cast Survey at low or high tides to minimize errors. SV cast immediately before survey.immediately before survey.
•Survey the reference lines.Survey the reference lines.
•Survey the check lines: Survey the check lines: middle lines NS and EW. Do not use middle lines NS and EW. Do not use one of the reference lines!one of the reference lines!
Flat, uniform reference area.
Sample Survey grid.

Reference Surface: Processing StepsReference Surface: Processing StepsReference Survey to Surface XYZReference Survey to Surface XYZ
1.1.Use a User-Defined MTX that encloses your test area. Set the cell size to 30cm Use a User-Defined MTX that encloses your test area. Set the cell size to 30cm x 3cm (metric) or 1’ x 1’ (foot)x 3cm (metric) or 1’ x 1’ (foot)
2.2.Load Load reference survey reference survey into MBMAX64.into MBMAX64.
3.3.Apply tide and SV corrections. Filter to +/- 45 degree angle limit. Edit out Apply tide and SV corrections. Filter to +/- 45 degree angle limit. Edit out remaining flyers.remaining flyers.
4.4.Save to XYZ Save to XYZ (Save One Point Per Cell, Average, 3 Points).(Save One Point Per Cell, Average, 3 Points).
User-Defined MTX.

Testing your MB System:
Multibeam Check Lines
1.Use the same User-Defined MTX file that you used when creating the reference surface.
2.Load check survey data into MBMAX64.
3.Edit minimally, removing outliers. Do not use angle limits. We want to generate statistics for all available beams.
4.Start the Beam Angle Test from the Tools menu. (Stage 2)
5.Open Reference Surface (Saved XYZ from step 3)

Beam Angle TestBeam Angle TestDifference Statistics: Reference Minus Check.Difference Statistics: Reference Minus Check.
Comparison Tab is Overall Result
•X Axis is beam angle.
•Y Axis is depth difference.
•x’s show bias.
•o’s show repeatability. Maximum difference at 95% confidence.
Details Tab is Result at Specific AngleDetails Tab is Result at Specific Angle
•Histogram is the distribution.
•Max Outlier = Max difference.
•Mean Difference shows bias between reference and the check lines.
•95% confidence = 2 * Standard Deviation.

Beam Angle Test in ActionBeam Angle Test in Action
a.k.a. “Performance Test”

SINGLE BEAM vs. SINGLE BEAM vs. MULTIBEAMMULTIBEAM
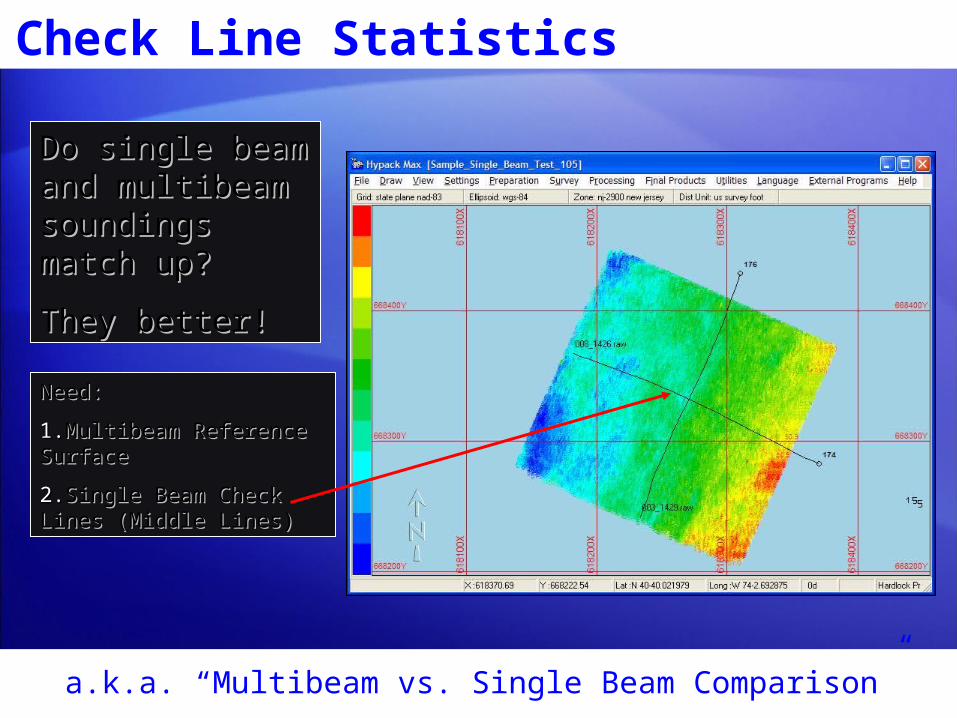
Check Line Statistics
Do single beam Do single beam and multibeam and multibeam soundings match soundings match up?up?
They better!They better!
a.k.a. “Multibeam vs. Single Beam Comparison”
Need:Need:
1.1.Multibeam Reference Multibeam Reference SurfaceSurface
2.2.Single Beam Check Lines Single Beam Check Lines (Middle Lines)(Middle Lines)

Check Line Statistics – Processing StepsSingle Beam Check Lines to XYZSingle Beam Check Lines to XYZ
1.1.Load Load Single Beam Check Lines (Raw Data) Single Beam Check Lines (Raw Data) into SBMAX.into SBMAX.
2.2.Save to XYZSave to XYZ
Reference Surface (same as beam angle check surface)
3.Use a User-Define MTX. (30cm x 30cm or 1’ x 1’ cells).
4.Load Reference Surface into MBMAX64.
5.5.Apply tide and SV corrections. Filter to +/- 45 degree angle limit. Apply tide and SV corrections. Filter to +/- 45 degree angle limit. Edit out remaining flyers.Edit out remaining flyers.
6.6.Save to XYZ Save to XYZ (Save One Point Per Cell, Average, 3 Points).(Save One Point Per Cell, Average, 3 Points).
Check Lines – Running the Test
7.Use the same MTX as step 3.
8.Load Edited SB (All or XYZ formats) into MBMAX64.
9.Start the Check Line Statistics from the Tools menu.
10.Open the Reference Surface XYZ

ResultsResults
•Once again using difference statistics = reference minus check.
•Histogram shows the distribution and bias.
•Mean Difference = Bias. This is the main point of the test!
•Standard Deviation (Sigma): Spread of the difference distribution.
•95% Confidence = 2*Sigma. 95% of the differences fall within 2*Sigma.
Not bad! Bias less than 0.1 foot!
Check Line Statistics

Sample: Single Beam Test
a.k.a. “Multibeam vs. Single Beam Comparison”
Caryn Zacharias
Update using MBMAX64


![1 195.337 mb 195.338 mb 2kb 195.339 mb 195.34 mb o z o U ... · 195.337 mb 195.338 mb 2kb 195.339 mb 195.34 mb o z o U.] U.] Thiel Hey 1 80.836 80.838 mb 80.84 80.842 mb Figure S7](https://static.fdocuments.us/doc/165x107/5e71a866b2da8320f30922bc/1-195337-mb-195338-mb-2kb-195339-mb-19534-mb-o-z-o-u-195337-mb-195338.jpg)


![Metallographic examination and hardness testing [4 MB PDF]](https://static.fdocuments.us/doc/165x107/584cb6a01a28ab85738f5373/metallographic-examination-and-hardness-testing-4-mb-pdf.jpg)