Performance statement Coming together to shape the · PDF filePerformance statement Coming...
32
Performance statement survey 2007 | PricewaterhouseCoopers 1 Performance statement Coming together to shape the future International survey of the views of both the investment community and companies on the performance statement December 2007
Transcript of Performance statement Coming together to shape the · PDF filePerformance statement Coming...

Performance statement survey 2007 | PricewaterhouseCoopers 1
Performance statement Coming together to shape the future
International survey of the views of both the investment community and companies on the performance statement
December 2007

2 PricewaterhouseCoopers | Performance statement survey 2007
For over a decade PricewaterhouseCoopers has conducted extensive research into the views of capital market participants with the sole aim of improving the value and utility of corporate reporting. By analysing the information needs of investment professionals and company management, we hope to help shape a corporate reporting model that is both cost-effective and relevant.
Our February 2007 report, Measuring Assets and Liabilities: investment professionals’ views, presents the results of interviews with investment professionals in which we discussed their use of the balance sheet and the measurement bases for assets and liabilities that best meet their needs.
More recently, we published the findings of an international survey of investors’ and analysts’ views on the information that companies provide in their corporate reports. (See Corporate reporting: Is it what investment professionals expect? November 2007).
Our latest research in this field, captured here, turns the spotlight on the income statement. The income statement has been highlighted by respondents to our previous studies as particularly important in their assessment of corporate performance. Its critical role in the communication of financial returns has been recognised by the International Accounting Standards Board (IASB) and the Financial Accounting Standards Board (FASB) who are committing significant resources to a joint project that is reviewing its structure. The findings in this survey provide valuable insights to help inform the standard-setting debate.

Performance statement survey 2007 | PricewaterhouseCoopers 3
Contents
Introduction ............................................................................... 5
Executive summary ................................................................... 6
Research methodology and survey population ....................... 11
1 The importance of earnings ................................................ 12
2 Performance data splits ...................................................... 16
3 Segment reporting .............................................................. 20
4 Non-GAAP information ....................................................... 24
5 Tax ....................................................................................... 26
6 Templates for performance statements .............................. 28
Further information .................................................................. 30

4 PricewaterhouseCoopers | Performance statement survey 2007

Performance statement survey 2007 | PricewaterhouseCoopers 5
Introduction
Since its creation in the middle of the last century, regulatory reporting has had the communication of financial performance at its core.
While many questions have been posed about how reporting can be enhanced to embrace a world where corporate value is increasingly attributed to intangibles, financial information remains the lynchpin of market analysis and valuations.
As the accounting profession and, in particular, the standard setters at the International Accounting Standards Board (IASB) and the US Financial Accounting Standards Board (FASB) debate how the reporting of performance can be improved, two recurring questions emerge.
How do investors use reported •information in their assessment of companies’ performance and could it be improved to facilitate a more streamlined valuation process?
Are investor views aligned, or at •odds, with those of the preparers of financial statements – company management?
It is these questions that the research outlined in this report tries to answer.
Research in this area is timely. The IASB and FASB have established a joint working party charged with producing a discussion paper on the topic. Although this document is not expected to be published until the first quarter of 2008, given the importance of this topic, the tentative proposals made by the standard setters are already being debated in the world’s financial press.
The findings of the survey are significant. They underscore the degree of alignment between the views of the investment community and those of their corporate peers. They also expose some fundamental issues that need to be considered in reshaping the performance statement. In particular, the results highlight the importance of providing clear visibility on the underlying operating performance of a company.
Determining the best way forward needs input from all those involved in the reporting process. For this reason, we believe the survey provides some
important signposts for how the performance statement can be structured to make the critical components of financial performance more accessible, and provide a more effective communications bridge between the preparers of financial reports and their primary users.
We hope this report can act as a catalyst in shaping the ongoing dialogue among all those stakeholders who have an interest in enhancing the utility of the current regulatory reporting model.

6 PricewaterhouseCoopers | Performance statement survey 2007
Executive summary
There is a high degree of congruence between the views expressed by investment community participants and corporate respondents.
While acknowledging that all •the primary statements are important, respondents from both the corporate and investment communities rank the income statement as the most important. In their opinion, it offers the best insight into the performance of a company over a given period of time.
Both investment professionals •and corporates stress the need to be able to distinguish ‘underlying’ earnings from both one-off events (such as a gain from the sale of a business) and the impact of the re-measurement of assets or liabilities.
They believe that the earnings •number is useful and largely agree upon how that number shouldbedefined.
Non-GAAP information is •considered valuable by the vast majority of respondents from both the investment community and from companies, though it was widely held that some ground rules should govern their use.
The only key areas of divergence •lie in tax reporting and how segmentsshouldbeidentified.
Such agreement among the respondents is noteworthy. Two key stakeholders in the corporate reporting arena see the performance statement in much the same way. This has important implications for the work of the IASB and FASB, and the development of future standards relating to the performance statement.
It also has important implications for companies and the investment community. By engaging actively in the debate with each other, and with the accounting standard-setters, they have the potential to shape the future development of the performance statement – helping to createafinancialreportingmodelthatdelivers the information investors, analysts and companies agree is important for enhanced understanding of corporate performance.
The importance of earnings
This research clearly shows the high degree of importance placed on the earnings statement by investors and analysts.
The majority of investment •professionals surveyed (over 60%) rank the income statement as the most important element of the primaryfinancialstatements.
Askedtonamethefirstthreeitems•of data they look for in an earnings release, participating analysts and investors mentioned three most frequently: net income/earnings per share,sales,andoperatingprofit/earnings before interest and tax.
Almost every investment •professional interviewed voluntarily forecasts the income statement, whereas fewer than 30% forecast thecashflowstatement.
The vast majority of participating •investors and analysts see an earnings measure as useful (80%), while over 60% say that a ‘comprehensive income’ measure is not useful.

Performance statement survey 2007 | PricewaterhouseCoopers 7
Corporate view: The importance of earnings
Corporate respondents agree with the investment community.
Almost 90% of corporate •participants rank the income statement as the most important primary statement.
Over 85% think earnings numbers •are useful, while over 65% say comprehensive income is not useful.
Performance data splits
Investment professionals stress the importance of being able to distinguish ‘underlying’ operating performance from both one-off events (such as a gain from the sale of a business) and the impact of the re-measurement of assets or liabilities.
When asked to identify the data •splits that would be useful in assessing performance, investment professionals ranked ‘recurring versus non-recurring’ as most important, followed by splits between operating, investing and financingactivity.Beingabletosee the impact of fair value re-measurements is also considered to be helpful.
Investment professionals in this •survey place particular importance on the current GAAP presentation of revenue and earnings as this provides consistency and comparability. They would also like to see ‘organic versus acquired’ as it offers insight into the sustainability of performance.
Participants suggested placing •the most important data splits on the face of the primary statements, and other secondary data in the notes.
Corporate view: Performance data splits
Corporate respondents agree with their professional investor peers that it is important to be able to communicate the ‘underlying’ operating performance of the business.
They have similar priorities in •terms of the data splits they value most.
They also think that the data splits •highlighted as most important should be shown on the face of the primary statements.
Executive summary

8 PricewaterhouseCoopers | Performance statement survey 2007
Segment reporting
The majority of investment professionals surveyed (over 80%) would like management to identify segments primarily by business unit.
Just over one third support •segment reporting on the basis of being ‘through management’s eyes’ – the approach required in the US by FAS 131 and under IFRS8.Ourfindingsshowthisapproach has less support among respondents in the US than in the rest of the world.
When asked to name data lines •per segment that they would like reported in addition to those required by current standards, investment professionals most often suggest operating cash flow,capitalemployedand working capital.
Overall, the majority of analysts •and investors surveyed say there should be a ‘commercially sensitive’ exemption for segment reporting. However, the majority of investment community respondents in the US do not express this view.
Corporate view: Segment reporting
Segment reporting is one area where there is some disagreement between corporate respondents and investment professionals.
In contrast to their investment •community peers, the majority of corporate participants (over 75%) supportsegmentidentification‘through management’s eyes’.
However, when asked to name •additional line items that could be useful in communicating performance to investors and analysts, corporate respondents name the same three chosen by investment professionals, that is operatingcashflow,capitalemployed and working capital.
Corporate respondents •overwhelmingly support the existence of a ‘commercially sensitive’ exemption for management.
Non-GAAP information
There is considerable support among investment professionals for use of non-GAAP information (adjusted financials).Itisseenasavaluablemechanism for addressing the inherent tension between GAAP reporting and a company’s particular facts and circumstances.
Very few respondents from the •investment community think such non-GAAP numbers should be banned. However, there is strong support for ground rules on their use – with particular value placed on reconciliations to GAAP. A majority also think non-GAAP numbers should be noted as non-GAAP and as unaudited where that is the case, and would also liketoseedefinitionsgiven.
The majority of US investors and •analysts surveyed think non-GAAP numbers should not be allowed on the face of the primary statements, while the majority of respondents from the rest of the world think they should.
Executive summary

Performance statement survey 2007 | PricewaterhouseCoopers 9
Corporate view: Non-GAAP information
The majority of corporate respondents also support the use of non-GAAP numbers.
They too support ground rules, •such as explanations for their use and relevance, the provision of cleardefinitions,andreconciliationback to GAAP. While they think that non-GAAP numbers should be clearly distinguished as such, they are less keen that they should be noted as non-audited measures where that is the case.
The majority of corporate •participants surveyed in the US do not think non-GAAP numbers should be allowed on the face of the primary statements, while those from the rest of the world are ambivalent.
Tax
Investment professionals need to be able to assess operating performance. To do this, they require the tax amounts from operations to be clearly presented in the statements.
Over 70% of investors and •analysts surveyed want to see more than one tax number in the income statement.
There is particular support for •splitting out the tax amounts foroperating,financingandinvestment activities.
Deferred tax amounts are •deemed impenetrable by most participants and so are not widely used by investment professionals in this survey – about 70% of respondents say they ignore deferred tax.
Corporate view: Tax
This is one of the few areas where corporate respondents disagree with their investment community peers.
The majority (over 60%) prefer •a single tax amount, highlighting the challenge of producing more information.
Deferred tax amounts are more •likely to be used by corporate participants, but over 50% of those from the US and over 30% from the rest of the world also say they effectively ignore them when it comes to assessing and forecasting results.
Templates for performance statements
Participating investment professionals showlittlesupportfora‘one-size-fits-all’ model for the earnings statement.
Just 10% say results should be •reported using a common template.
Greatest support is expressed for •using a common template for each broad industry group.
Corporate view: Templates for performance statements
Corporate respondents also express little enthusiasm for a common template for presenting results.
In contrast to their investment •peers, however, the largest group think management should have someflexibilitytopresentthenumbers in the way they consider most appropriate.
.
Executive summary

10 PricewaterhouseCoopers | Performance statement survey 2007
...the consistency of views expressed both within markets and across territories suggests that the findings offer reliable insights.

Performance statement survey 2007 | PricewaterhouseCoopers 11
Research methodology and survey population
For a number of years, PwC has been engaged in a campaign to connect the investment community more thoroughly and consistently with the standard-setting process. We have also conducted research with companies to improve our understanding of their views on reporting issues and highlight key topics deserving further debate.
This survey draws in both of these key stakeholder groups, canvassing their views on the performance statement.
While we do not claim that our studies representastatisticallysignificantanalysis of investment professional and corporate opinion in each of the markets reviewed, the consistency of views expressed both within markets and across territories suggests that thefindingsofferreliableinsights.
Survey population: investment professionals
Investment professionals were asked a series of questions during interviews conducted face to face (or by telephone), enabling us both to explore the rationale for any given
reply and to ensure a consistent interpretation of accounting terms used. The results are based on such in-depth interviews with 58 investment professionals.
Research methodology and survey population
Figure 2: Respondents by fixed income vs equityFigure 1: Respondents by territory
North America
Fixed income
Equity
Australia
UK
Continental
Europe
Figure 4: Respondents by functionFigure 3: Respondents: Reporting standard used
US GAAP
IFRS
Financial Controller/Mgt Accountant
Investor Relations/ External Reporting Manager
Other
Finance Director/CFO
Company representatives, who typically have a financial role in their organisation, provided their input via an online questionnaire. Our findings are based on responses from 134 of these corporate participants.
Corporate respondents
In the rest of this report, the responses of corporate participants are captured in highlighted boxes.

12 PricewaterhouseCoopers | Performance statement survey 2007
Investment professionals tell us they place great importance on earnings. They say the earnings figure helps them to make their assessments of how successful management has been in creating value. It also helps them to predict potential future growth.
Ranking the primary statements and segmental analysis
Investment professionals in this survey appreciate the importance of alltheprimaryfinancialstatementsand segment reporting. However, when asked to rank them in order of importance, the income statement
emerges as the strong favourite – over 60% of all investors and analysts surveyed (and over 70% of equity respondents) rank the income statement as most important. Over 50% of all investment professional participants rank the balance sheet as leastimportant.Thecashflowstatement and segment analysis typically hold the middle rankings.
Asmightbeexpected,fixedincomeparticipants place less importance on the income statement (with just 20% of respondents ranking this as most important).Incontrast,60%offixedincomeparticipantssaythecashflowstatement is of prime importance.
1 The importance of earnings
Figure 5: Rank the income statement, balance sheet, cash flow statement and segment analysis in order of priority for your assessment of financial performance.
‘Supposedly, you can figure out the income statement from the balance sheet, but, in terms of day-to-day usage, where I get most of my knowledge – and where it is presented most conveniently – is the income statement.’
90%
80%
70%
60%
50%
40%
30%
20%
10%
0
Rated most important
Ranked 2nd
Ranked 3rd
Least important
Income statement Balance sheet Cashflowstatement Segment analysis
Performance statement survey 2007 | PricewaterhouseCoopers 13
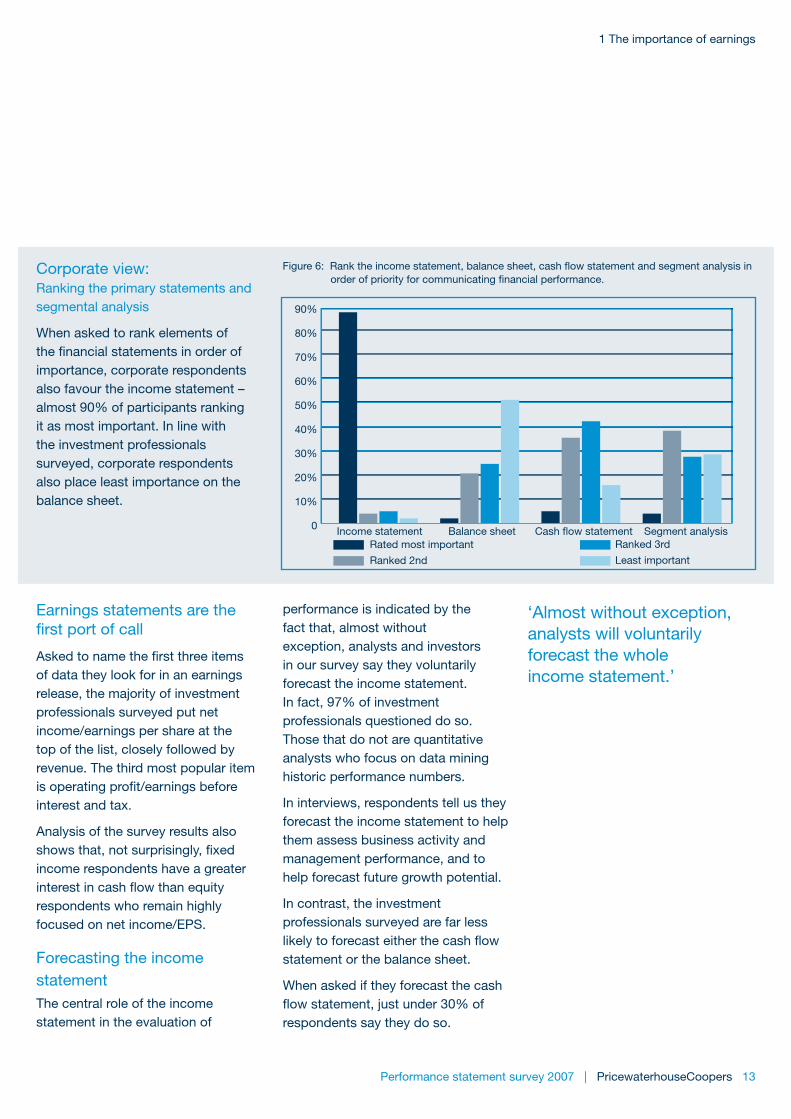
Corporate view: Ranking the primary statements and segmental analysis
When asked to rank elements of thefinancialstatementsinorderofimportance, corporate respondents also favour the income statement – almost 90% of participants ranking it as most important. In line with the investment professionals surveyed, corporate respondents also place least importance on the balance sheet.
Figure 6: Rank the income statement, balance sheet, cash flow statement and segment analysis in order of priority for communicating financial performance.
Earnings statements are the firstportofcall
Askedtonamethefirstthreeitems of data they look for in an earnings release, the majority of investment professionals surveyed put net income/earnings per share at the top of the list, closely followed by revenue. The third most popular item isoperatingprofit/earningsbeforeinterest and tax.
Analysis of the survey results also showsthat,notsurprisingly,fixedincome respondents have a greater interestincashflowthanequityrespondents who remain highly focused on net income/EPS.
Forecasting the income statement The central role of the income statement in the evaluation of
performance is indicated by the fact that, almost without exception, analysts and investors in our survey say they voluntarily forecast the income statement. In fact, 97% of investment professionals questioned do so. Those that do not are quantitative analysts who focus on data mining historic performance numbers.
In interviews, respondents tell us they forecast the income statement to help them assess business activity and management performance, and to help forecast future growth potential.
In contrast, the investment professionals surveyed are far less likelytoforecasteitherthecashflowstatement or the balance sheet.
When asked if they forecast the cash flowstatement,justunder30%ofrespondents say they do so.
‘Almost without exception, analysts will voluntarily forecast the whole income statement.’
1 The importance of earnings
90%
80%
70%
60%
50%
40%
30%
20%
10%
0
Rated most important
Ranked 2nd
Ranked 3rd
Least important
Income statement Balance sheet Cashflowstatement Segment analysis
14 PricewaterhouseCoopers | Performance statement survey 2007
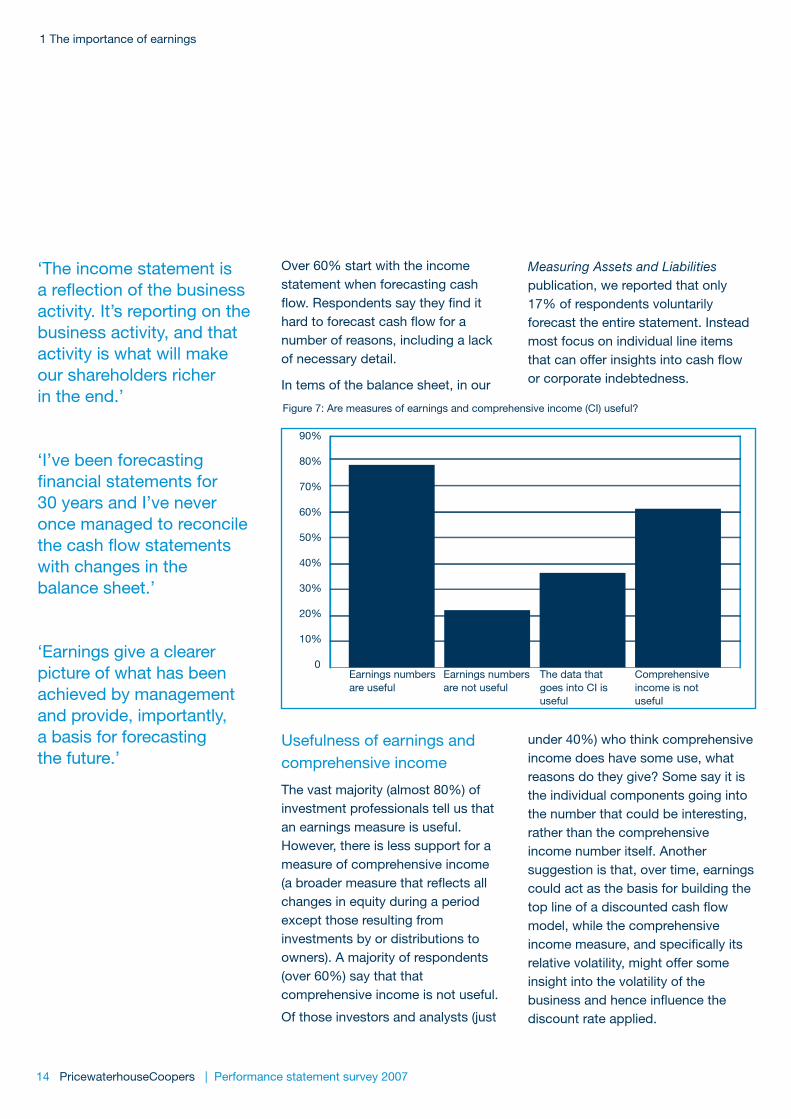
Over 60% start with the income statement when forecasting cash flow.Respondentssaytheyfindithardtoforecastcashflowforanumber of reasons, including a lack of necessary detail.
In tems of the balance sheet, in our
Measuring Assets and Liabilities publication, we reported that only 17% of respondents voluntarily forecast the entire statement. Instead most focus on individual line items thatcanofferinsightsintocashflowor corporate indebtedness.
‘The income statement is a reflection of the business activity. It’s reporting on the business activity, and that activity is what will make our shareholders richer in the end.’
‘I’ve been forecasting financial statements for 30 years and I’ve never once managed to reconcile the cash flow statements with changes in the balance sheet.’
‘Earnings give a clearer picture of what has been achieved by management and provide, importantly, a basis for forecasting the future.’
Usefulness of earnings and comprehensive income
The vast majority (almost 80%) of investment professionals tell us that an earnings measure is useful. However, there is less support for a measure of comprehensive income (abroadermeasurethatreflectsallchanges in equity during a period except those resulting from investments by or distributions to owners). A majority of respondents (over 60%) say that that comprehensive income is not useful.
Of those investors and analysts (just
under 40%) who think comprehensive income does have some use, what reasons do they give? Some say it is the individual components going into the number that could be interesting, rather than the comprehensive income number itself. Another suggestion is that, over time, earnings could act as the basis for building the toplineofadiscountedcashflowmodel, while the comprehensive incomemeasure,andspecificallyitsrelative volatility, might offer some insight into the volatility of the businessandhenceinfluencethediscount rate applied.
Figure 7: Are measures of earnings and comprehensive income (CI) useful?
1 The importance of earnings
Earnings numbersare useful
Earnings numbersare not useful
The data thatgoes into CI isuseful
Comprehensiveincome is notuseful
90%
80%
70%
60%
50%
40%
30%
20%
10%
0

Performance statement survey 2007 | PricewaterhouseCoopers 15
Corporate view: Usefulness of earnings and comprehensive income
Corporate survey participants typically hold the same views as our investment professional sample. Over 85% of corporate respondents think earnings numbers are useful, while over 65% say comprehensive income is not useful.
Figure 8: Are measures of earnings and comprehensive income (CI) useful?
Definitionsofearnings
Askedhowtheywoulddefineearnings, investment community respondents typically exclude any revaluations of assets or liabilities, both when attempting to understand the underlying earnings of the company and when building forecasts.
However, some investor and analyst participants only exclude ‘one-offs’ (such as gains or losses on sale of businesses or restructuring costs) when forecasting. They say they may include them when looking at historical earnings and trying to assess management’s performance in generating value from the assets entrusted to them.
Corporate view: Definitionsofearnings
Inlinewithourfindingsamong the investment community, respondents in the companies we surveyed also typically exclude revaluationsfromtheirdefinition of earnings.
However, there is less consistency in terms of the exclusion of ‘one-off’ items. In general, corporate respondents are more likely than investment professional participants to include these in theirearningsdefinition.
1 The importance of earnings
90%
80%
70%
60%
50%
40%
30%
20%
10%
0Earnings numbersare useful
Earnings numbersare not useful
The data thatgoes into CI isuseful
Comprehensiveincome is notuseful

16 PricewaterhouseCoopers | Performance statement survey 2007
2 Performance data splits
Investment professionals and corporates participating in this survey share largely similar views on the different data splits they want to see clearly identified in financial statements.
Data splits provide extra information that help analysts and investors understand the drivers of corporate performance. However, some types of data split are seen as more useful than others.
Among investment professionals surveyed, a split of ‘recurring versus non-recurring’ is a top priority. There is also strong support for data being presented between operating, investingandfinancingactivities,though conversations with investors and analysts made it clear that the key split is between ‘operating’ and ‘other’ items. Being able to see the performance of activities with different business models that are contained within a single corporate structure (such as a bank that has an insurance arm) is also seen as important.
The ability to see numbers before and after the impact of fair value re-valuations is also important to many analysts and investors, though itssignificancedependstosomedegree on the interviewee’s industry or geographic specialisation. For example, this is not something most US respondents encounter regularly. For those who do see the impact of fair value re-measurements as a priority, this is primarily because they need to be able to exclude any such
re-valuations from their income statement forecasts in order to value the company.
Participating investors and analysts showsignificantinterestinsplittingout costs by nature and by function. Overall, they place equal importance on these two splits, though based on our interviews, their relative importance appears to depend on the particular industry sector being analysed.
As businesses are typically less diversifiedthantheywere20yearsago, there is less interest among participating analysts and investors in being able to distinguish core numbers from non-core. Similarly ‘realised from unrealised’ was not a priority for respondents.
‘One of my pet peeves is that under US GAAP you are unable to separate genuinely recurring from non-recurring costs.’
‘Separating out ‘operating’ is critical: investing and financing together would be OK.’

Performance statement survey 2007 | PricewaterhouseCoopers 17
2 Performance data splits
Figure 9: How important are these data splits for your analysis of performance?
Corporate view: Performance data splits
Corporate survey respondents express largely similar views to those of participating investment professionals. The ability to split data between recurring and non-recurring is seen as most important for understanding their business. There is also strong support for the split between operating, investing and financing,andconsiderablesupportfor splitting out the impact of fair value re-measurements. Respondents from the US place less importance on this than those from the rest of the world, however, because such re-measurements are less frequent in US GAAP.
Overall, corporate responses differ slightly from those of investors and analysts in that corporate participants
Figure 10: How important are these data splits for your analysis of performance?
place less importance on analysing costs by nature, though they do value analysing costs by function. Corporate respondents also place
less emphasis than investors and analysts on splitting out performance by business models.
90%
80%
70%
60%
50%
40%
30%
20%
10%
0
Imp
act
of F
V r
e-
mea
sure
men
ts
Op
erat
ing,
in
vest
ing
and
financing
Rec
urrin
g/
non-
recu
rrin
g
Cor
e/
non-
core
Rea
lised
/ un
-rea
lised
Cos
ts b
y na
ture
Cos
ts b
y fu
nctio
n
By
bus
ines
s m
odel
Imp
act
of F
V r
e-
mea
sure
men
ts
Op
erat
ing,
in
vest
ing
and
financing
Rec
urrin
g/
non-
recu
rrin
g
Cor
e/
non-
core
Rea
lised
/ un
-rea
lised
Cos
ts b
y na
ture
Cos
ts b
y fu
nctio
n
By
bus
ines
s m
odel
90%
80%
70%
60%
50%
40%
30%
20%
10%
0
‘It is very important [to split out fair value re-measurements] because what most analysts do is try and exclude that from some kind of sustainable earnings number.’
18 PricewaterhouseCoopers | Performance statement survey 2007
2 Performance data splits
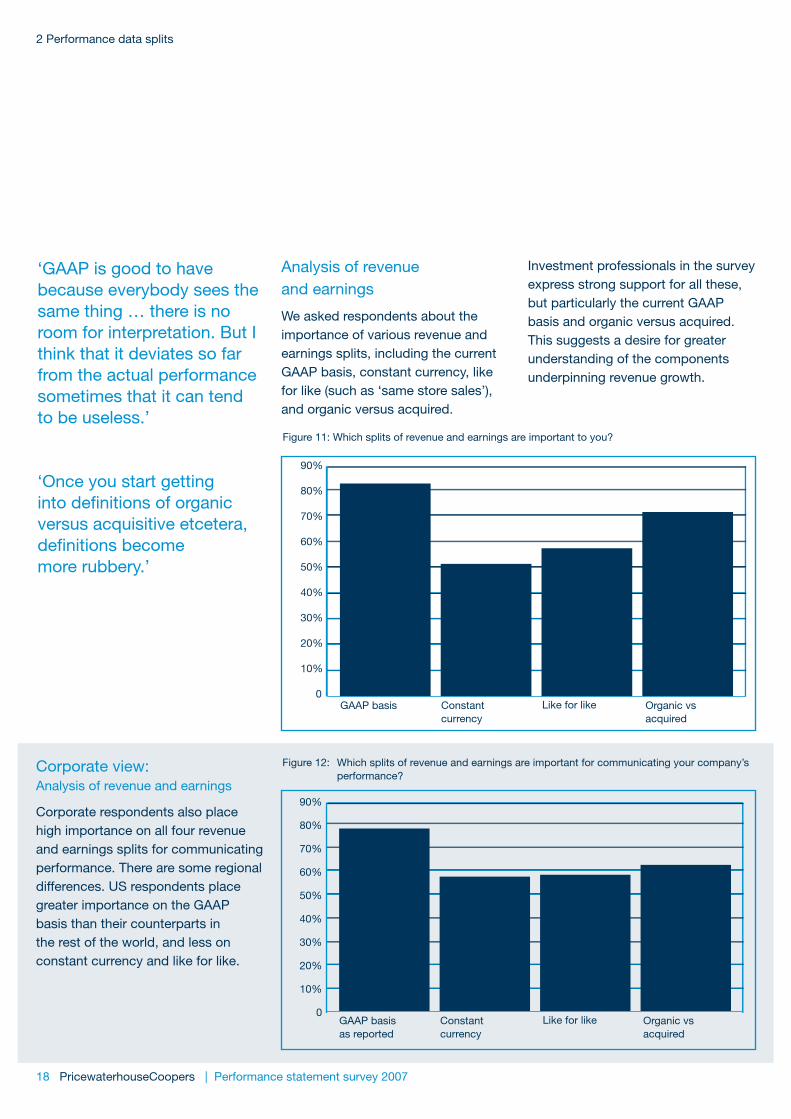
Analysis of revenue and earnings
We asked respondents about the importance of various revenue and earnings splits, including the current GAAP basis, constant currency, like for like (such as ‘same store sales’), and organic versus acquired.
Investment professionals in the survey express strong support for all these, but particularly the current GAAP basis and organic versus acquired. This suggests a desire for greater understanding of the components underpinning revenue growth.
‘GAAP is good to have because everybody sees the same thing … there is no room for interpretation. But I think that it deviates so far from the actual performance sometimes that it can tend to be useless.’
‘Once you start getting into definitions of organic versus acquisitive etcetera, definitions become more rubbery.’
Figure 11: Which splits of revenue and earnings are important to you?
Corporate view: Analysis of revenue and earnings
Corporate respondents also place high importance on all four revenue and earnings splits for communicating performance. There are some regional differences. US respondents place greater importance on the GAAP basis than their counterparts in the rest of the world, and less on constant currency and like for like.
Figure 12: Which splits of revenue and earnings are important for communicating your company’s performance?
90%
80%
70%
60%
50%
40%
30%
20%
10%
0
GAAP basis Constantcurrency
Like for like Organic vsacquired
GAAP basisas reported
Constantcurrency
Like for like Organic vsacquired
90%
80%
70%
60%
50%
40%
30%
20%
10%
0

Performance statement survey 2007 | PricewaterhouseCoopers 19
2 Performance data splits
Presentation of data splits
Survey participants were asked where they wanted data splits to be presented – on the face of the primary statements or in the notes. Responses are reasonably consistent. Participating investors and analysts want to see the data items they consider most important appearing on the face. For example, these would include splits between recurring and non-recurring,operating/financing/investing, and those relating to fair value re-measurements. Other splits they would put in the notes.
The majority of the participating investment professionals would like data that relates to constant currency, like for like and organic versus acquired to be disclosed in the notes and not on the face of the income statement.
‘I don’t think it makes a lot of sense to jam too much stuff into the statements, but it should definitely all be available in notes.’
‘I’d want it in the statement because I think the numbers would have a chance of getting better examination by auditors and management than if they appear in the notes.’
Corporate view: Presentation of data splits
Corporate respondents express similar preferences. Like participating investors and analysts, they would prefer to see items such as splits relating to operating/investing/financing,fairvaluere-measurementsand recurring/non-recurring on the faceoftheprimaryfinancialstatements. They would put other items in the notes.
In terms of regional differences, US corporate respondents are generally less likely to want such splits to appear on the face, and a little more likely to prefer them to be left outside thefinancialstatementsaltogether.
Asked about the bases for data splits (GAAP, constant currency, like for like and organic versus acquired), corporate respondents are again in tune with the investment community. Corporate participants also typically prefer the notes as a location – except for the GAAP basis, where the majority (over 70%) choose the face of the primaries. There are some regional differences, with corporate respondents from the US again having a stronger preference for data splits on the bases of constant currency, like for like and organic versus acquired being left outside the financialstatements.

20 PricewaterhouseCoopers | Performance statement survey 2007
3 Segment reporting
Given the high level of current interest in segment reporting around the world, we focused survey respondents’ attention on this particular aspect of reporting. Our findings offer insights into how segments might be identified, the priorities for additional line items, and the extent of support for the ‘commercially sensitive’ override.
Surveyparticipantswerefirstaskedabout their preferences in terms of segmentidentification.Theywereable to select as many ways for identifying segments as they liked.
Regardless of territory, the majority of investment professionals involved in the survey would like management to identify segments primarily by business unit – over 80% support this option. A little under half support geographical criteria. Just over one third of participating investors and
analysts support segment selection being made on the basis of ‘through management’s eyes’ – the approach adopted under the current US standard, FAS 131 and required by the new international standard, IFRS 8.
Given that the impact of IFRS 8 is gradually being felt internationally while the US segment standard is longer established, responses were analysed by region. In the ‘rest of the world’ (the IFRS zone), the approach of ‘through management’s eyes’, though less popular than segment selection by business unit or geography, is still cited as a suitable way to identify segments by over 40% of respondents. In contrast, 20% of participating investment professionals in the US support the ‘through management’s eyes’ method, with over 90% wanting selection by business unit.
Figure 13: How should management identify segments?
‘I’d always, always be suspicious of “through management’s eyes”.’
‘Geography only interests me for the translation effects. Most people analyse by business and product line, because that’s what’s really very, very important.’
‘When you’re an investor what you want to do is understand the basic economics of these companies’ businesses...’
100%
90%
80%
70%
60%
50%
40%
30%
20%
10%
0Geography Business unit According to
industry normsThroughmanagement’s eyes
Global USA ROW

Performance statement survey 2007 | PricewaterhouseCoopers 21
Corporate view: Segment reporting
Corporate survey respondents have different preferences when it comes to methods of segment selection. The majority (over 75%) of corporate participants support segment identificationonthegroundsof‘through management’s eyes’, while just over 50% support an approach based on business unit or product line.
A regional analysis of responses shows general consistency between the US and the rest of the world, although corporate participants from outside the US are more supportive ofsegmentidentificationalonggeographical lines.
Figure 14: How should management identify segments?
3 Segment reporting
Additional data lines per segment
Survey participants were asked to state a maximum of three lines that they would like to see presented per segment in addition to those required by the current standards. They were asked to take a pragmatic approach to this question, and only identify extra lines that they both need and would use.
A few participants from the investment community stated they did not need any additions to existing GAAP requirements. In fact, some of those looking at smaller companies expressed a desire that there should be no GAAP requirements for lines
per segment. This was on the grounds that, because many smaller companies are unable to separate assets, management can be discouraged from reporting a few high level lines (such as revenue) per segment.
Of those investors and analysts who did state a need for more information, the most popular requests were for operatingcashflow(namedbyjustover 45%), capital employed (named by around one third) and working capital (just under 30%).
Corporate view: Additional data lines per segment
Corporaterespondentsidentifiedthe same three additional line items as adding the greatest value in their communication of performance. Just under 60% nameoperatingcashflow,while just over 30% state capital employed and around 25% name working capital.
Geography Business unit According toindustry norms
Throughmanagement’s eyes
Global USA ROW
100%
90%
80%
70%
60%
50%
40%
30%
20%
10%
0

22 PricewaterhouseCoopers | Performance statement survey 2007
Commercially sensitive exemptions
Overall, around 65% of participating investors and analysts say there should be a ‘commercially sensitive’ exemption for segment reporting. However,theglobalfiguredisguisessome interesting regional variations, with the US going against the global trend.
The majority of investment community respondents in the US (over 55%) do
not think management should be allowed to avoid reporting on a segment if they feel it would injure their commercial position. Around 45% think management should be able to use this exemption. This is in stark contrast to the rest of the world, where the vast majority (over 75%) think that management should have this exemption option for ‘commercially sensitive’ situations.
Figure 15: Should there be a ‘commercially sensitive’ exemption for segment reporting?
‘If they think that the competitors don’t already know what their business is, they’re fooling themselves.’
‘It [a commercial exemption] should be allowed – but only when absolutely necessary.’
3 Segment reporting
90%
80%
70%
60%
50%
40%
30%
20%
10%
0Global USA ROW
Yes No

Performance statement survey 2007 | PricewaterhouseCoopers 23
Corporate view: Commercially sensitive exemptions
Corporate respondents overwhelmingly support the existence of a ‘commercially sensitive’ exemption option for management. This is a consistent view regardless of region, though a larger proportion of US respondents are in favour.
Figure 16: Should there be a ‘commercially sensitive’ exemption for segment reporting?
3 Segment reporting
90%
80%
70%
60%
50%
40%
30%
20%
10%
0Global USA ROW
Yes No

24 PricewaterhouseCoopers | Performance statement survey 2007
4 Non-GAAP information
Few investment professionals or corporate participants in this survey would ban the use of non-GAAP numbers. However, virtually all believe their use should be governed by some ground rules.
Survey participants were asked for their views on non-GAAP numbers. The survey limited the scope of this dialogueto‘adjustedfinancials’(eg,earnings before exceptional items) rather than a broader set of non-financialmetrics(suchas,‘same store sales’).
Very few respondents from the investment community believe that
such non-GAAP measures should be disallowed. Over 40% of participants think they should have equal prominence with GAAP measures.
However, there is a strong demand for some ground rules for the use of non-GAAP numbers. The largest proportion (just over 80%) of participating investors and analysts think they should be reconciled to GAAP, while almost two thirds think they should be noted as non-GAAP and also as unaudited where that is thecase.Asignificantgroup(over60%)wouldalsoliketoseedefinitionsgiven for the terms used.
‘I don’t necessarily trust the non-GAAP measures that companies give me. But I wouldn’t ban them; I’d just like to see some ground rules.’
‘I quite like non-GAAP measures: they help me increase my understanding of the business.’
Corporate view: Non-GAAP information
Corporate survey participants appreciate the value of using non-GAAP numbers. Very few (about 10%) would ban them.
There is again strong support for ground rules, although preferred options are placed in a slightly different order. Corporate respondents are most supportive of explanations being given for the use of non-GAAP
numbers and their relevance to the business, closely followed by the provisionofcleardefinitions.Aswithinvestor community respondents, high proportions of corporate participants support reconciliations back to GAAP measures and think that non-GAAP measures should be clearly distinguished as such. However, few corporate respondents (about 20%) think non-GAAP numbers should be clearly distinguished as non- audited measures.
Location of non-GAAP numbers
When asked whether non-GAAP numbers should be allowed on the face of the primary statements, respondents from the investment community are split geographically. The majority of US participants (over 60%) do not think non-GAAP should
be allowed on the face. However, almost 70% of investment community respondents from the rest of the world would allow the mixing of GAAP and non-GAAP numbers on the face of the primary statements. Just under 10% of participants have no strong opinion on the topic.

Performance statement survey 2007 | PricewaterhouseCoopers 25
‘If it’s something that they consistently report then it ought to be on the face.’
‘Non-GAAP should be put into the main financial statements so that they are audited.’
‘I think they should be required to be consistent in their non-GAAP measures.’
4 Non-GAAP information
Figure 17: Should non-GAAP numbers be allowed on the face of the primary statements?
Corporate view: Location of non-GAAP numbers
US corporate respondents, like their US investment community counterparts, do not think material non-GAAP measures should be allowed on the face of the primary statements. Over 60% of US corporate respondents express this view.
Corporate respondents from the rest of the world were evenly split between those who would allow non-GAAP numbers on the face of the primary statements and those who would not.
Figure 18: Should non-GAAP numbers be allowed on the face of the primary statements?
80%
70%
60%
50%
40%
30%
20%
10%
0Global USA ROW
Non-GAAP should be allowedon the face
Non-GAAP should not be allowed on the face
80%
70%
60%
50%
40%
30%
20%
10%
0Global USA ROW
Non-GAAP should be allowedon the face
Non-GAAP should not be allowed on the face

26 PricewaterhouseCoopers | Performance statement survey 2007
5 Tax
Investment professionals surveyed would like to see greater detail in the tax amounts presented by companies. However, corporate participants are less supportive of this idea, seeing considerable challenges involved.
Over 70% of investors and analysts in this survey say they want to see more than just a single tax amount in the income statement. The largest group (just under 40%) say they would like tax amounts that enable them to identify the tax impact of operating, financingandinvestmentactivities.
‘Tax is probably the hardest area for analysts to make forecasts about.’
Figure 19: How many tax numbers should be reported?
Corporate view: Tax
This is one of the few areas of the survey where the views of corporate respondents differ from those of investment professionals. The majority of all corporate participants (over 60%) favour a single tax amount. Those from the US are slightly more supportive of generating more than one tax amount.
Askedtoindicatetherelativedifficultyof generating various tax amounts, corporate respondents typically indicate that generating anything other than a single tax amount would be highly challenging.
Figure 20: How many tax numbers should be reported?
70%
60%
50%
40%
30%
20%
10%
0
A single tax number Tax split into operating and other
Tax split into operating, financingandinvesting
A single tax number Tax split into operating and other
Tax split into operating, financingandinvesting
70%
60%
50%
40%
30%
20%
10%
0

Performance statement survey 2007 | PricewaterhouseCoopers 27
Use of deferred tax
Deferred tax amounts are not widely used by investment professionals in this survey. Close to 70% of participating investors and analysts
say they ignore deferred taxes. Those who do make use of deferred tax amounts do so to forecast future cash taxes or effective tax rates.
‘I’m a typical analyst. I ignore deferred tax.’
‘I’m hazily aware of it. I don’t ignore it completely. You will see in my models that the cash tax payment is typically not equal to the P&L tax charge. So, by definition, I’m sort of allowing for deferred tax in there.’
Figure 21: How do you use deferred tax?
Corporate view: Use of deferred tax
Corporate respondents are more likely than those from the investment community to use deferred tax amounts – doing so to forecast long-term effective tax rates or to forecast cash taxes.
Even so, over 50% of corporate participants from the US and over 30% from the rest of the world say they effectively ignore deferred tax.
Figure 22: How do you use deferred tax?
5 Tax
80%
70%
60%
50%
40%
30%
20%
10%
0
Global USA ROW
I ignore deferred tax I use deferred tax number to forecast cash taxes
I use deferred tax number to forecast effective tax rates
Global USA ROW
I ignore deferred tax I use deferred tax number to forecast cash taxes
I use deferred tax number to forecast effective tax rates
80%
70%
60%
50%
40%
30%
20%
10%
0

28 PricewaterhouseCoopers | Performance statement survey 2007
6 Templates for performance statements
Investment professionals interviewed show little support for a ‘one-size-fits-all’ model for the earnings statement. When asked if results should be presented using a common template, just 10% of investors and analysts surveyed say that they should.
In our survey group, the greatest support was expressed for a common template for each broad industry group – just under 50% of respondents preferring this option. Thisreflectstherealityofinvestmentprofessionals’ lives, where they try to
put companies’ reports into a standard format so they can compare performance within broad industry groups.
There was relatively little support for allowingmanagementflexibility(justunder 20% choosing this option). Similarly, relatively few investors and analysts surveyed support the idea of a common template below EBIT or the operating line, but with managementhavingflexibilityintermsof presentation above that line.
‘We reallocate everything to fit a common industry template.’
‘The more commonality you can get, the better.’
‘Changes in the template are the issue, not the actual template itself.’
Figure 23: Should results be presented using a common template?
50%
40%
30%
20%
10%
0There should be one common template for the entire income statement
There should be one common template for each broad industry group
There should be a common template below the EBIT or operating line
Management should have flexibilityinthepresentation of the numbers

Performance statement survey 2007 | PricewaterhouseCoopers 29
6 Templates for performance statements
Corporate view: Templates for performance statements
Survey participants from companies, like investment professional respondents, show little support for one common template for the entire income statement. Less than 10% of corporate respondents support this. However, while there is reasonable support for a common template within an industry group (chosen by just under 30%), just over 30% of corporate respondents think managementshouldhaveflexibilitytopresent the numbers in the way they consider most appropriate.
Corporate respondents from the US are notably more in favour of a common template for industry groups than their counterparts in the rest of the world.
Figure 24: Should results be presented using a common template?
50%
40%
30%
20%
10%
0There should be one common template for the entire income statement
There should be one common template for each broad industry group
There should be a common template below the EBIT or operating line
Management should have flexibilityinthepresentation of the numbers
Contact detailsFor further details about this survey please contact:
United States: Doug Kangostel: +1 973 236 4994email: [email protected]
United Kingdom: Alison Thomastel: +44 207 212 2438email: [email protected]
Australia: Nick Ridehalghtel: +61 2 8266 4899email: [email protected]

30 PricewaterhouseCoopers | Performance statement survey 2007
Further information
Corporatereporting:atimeforreflection
During 2006, PricewaterhouseCoopers surveyed the narrative reporting practices of the world’s largest companies, the Fortune Global 500. Its objective was to provide answers to questions such as: What does the narrative discussion actually communicate? Are companies meeting the information needs of investors, their priority audience for these strategic communications?
Measuring Assets and Liabilities: Investment Professionals’ Views
How do investment professionals use the balance sheet? How do they want assets and liabilities to be measured? This publication offers the thoughts of participants in the major global capital markets.
Corporate reporting: Is it what investment professionals expect?
What is the investment community’s view of the current corporate reporting framework? What do they see as its strengths and weaknesses? Based on interviews with over 250 analysts and investors around the world, “Corporate Reporting: is it what investment professionals expect” provides unique insight into the corporate reporting agenda.

Performance statement survey 2007 | PricewaterhouseCoopers 31
Report Leadership
Report Leadership, a multi-stakeholder group, focused on the annual report to develop simple, practicalwaystoimprovenarrativeandfinancialreportingtothecapitalmarkets.Reflectinginput from a range of investors, the publication outlines some far-reaching, yet practical, ideas for improving the content of annual reports and other communications. These ideas have been received very positively, not least by the UK Hundred Group of Finance Directors.
The contributors to this initiative are the Chartered Institute of Management Accounts (CIMA), PricewaterhouseCoopers LLP, Radley Yeldar and Tomkins plc.
World Watch
Thelatestdevelopmentsandtrendsingovernance,financialreporting,broaderreportingandassurance are covered in this global magazine. It includes news and opinion articles on issues of international interest and gives the ‘big picture’ to help inform executive and non-executive directors, regulators, standard setters, academics and investors. The magazine is published twice a year and circulated in 94 countries. To subscribe, email [email protected] or order direct from www.cch.co.uk/ifrsbooks.
Point of view
OurglobalpositionpapersgivethePwCnetworkoffirms’pointofviewonissuesthataffectour clients and our Assurance profession. These short, one-page papers present a distilled perspective on a range of current regulatory, auditing and assurance topics and are of interest to executive and non-executive directors, regulators, standard setters, and investors. If you are interested in receiving Point of view, please contact [email protected].

32 PricewaterhouseCoopers | Performance statement survey 2007
© 2007 PricewaterhouseCoopers. All rights reserved. ‘PricewaterhouseCoopers’ refers to the network of member firmsofPricewaterhouseCoopersInternationalLimited,eachofwhichisaseparateandindependentlegalentity.Design: PIC 0701101_jp
pwc.com/ifrs
80%
Printed on recycled paper