Performance Solutions by Millikenfplreflib.findlay.co.uk/images/pdf/ems/Jordan Workman Milliken -...
34
Performance Solutions by Milliken Jordan Workman Director of NA & EMEA Client Development
Transcript of Performance Solutions by Millikenfplreflib.findlay.co.uk/images/pdf/ems/Jordan Workman Milliken -...

© 2007 - 2017 Milliken Design, Inc.
Performance Solutions by Milliken
Jordan Workman
Director of NA & EMEA Client Development

© 2007 - 2017 Milliken Design, Inc.
Milliken & Company’s Background
9
Locations
15
Locations
Corporate Offices
Manufacturing /Warehousing
Sales/Technical Service
Floor Covering Design Studio
• Founded in 1865
• Privately held
• ~$2.5 Billion in revenue
• ~7,500 associates
• 45 sites in 6 countries
• Operations throughout the
Americas, Europe and Asia

© 2007 - 2017 Milliken Design, Inc.
Specialty ChemicalsIntermediates • Textile Chemicals • Plastic Additives • Specialty Colorants • Carpet Cleaning
Floor Coverings & InteriorsCommercial • Contract • Residential • Hospitality • Napery & Drapery • Office Fabrics
Protective & Performance ProductsPerformance Apparel Fabrics • Workwear Fabrics • Military Fabrics • Airbags • Nonwovens
Industrial ProductsComposites • Belt & Hose Textiles • Inner duct • Tire Cord • Core Materials
Performance SolutionsSafety • Performance Excellence • Training
Key Markets

© 2007 - 2017 Milliken Design, Inc.
Milliken & Company’s Reality
Performance vs Domestic Textile Players
Textile companies with > $1B sales:
0
40
80
120
1950 1960 1970 1980 1990 2000 2010
U.S. Textile Mill Production
75% Textiles
25%
100%
0%
50%
All
items
Percent of U.S. consumptionthat is Imported
1950 1960 1970 1980 1990 2000 2010
1995MillikenSpringsBurlingtonCollins & AikmanWestpoint StevensFieldcrest Cannon
TodayMilliken
© 2007 - 2017 Milliken Design, Inc.
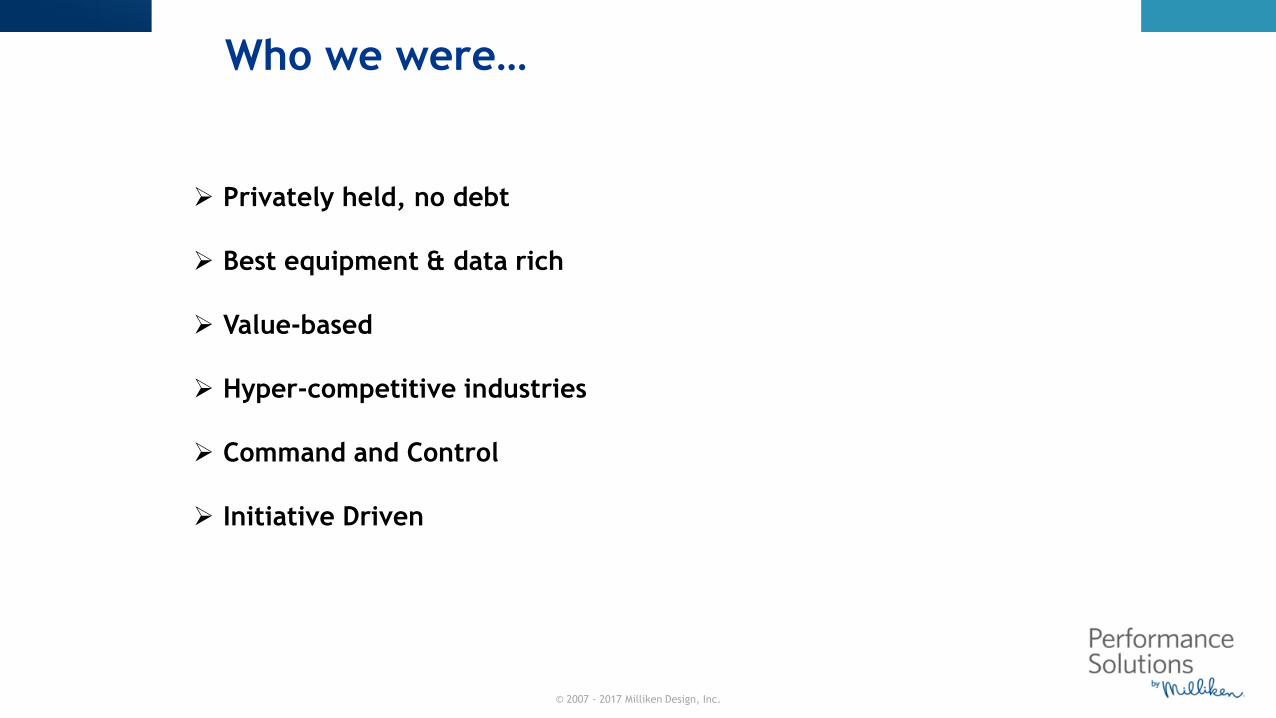
➢ Privately held, no debt
➢ Best equipment & data rich
➢ Value-based
➢ Hyper-competitive industries
➢ Command and Control
➢ Initiative Driven
Who we were…

© 2007 - 2017 Milliken Design, Inc.
➢ Privately held, no debt
➢ Best equipment & data rich
➢ Value-based
➢ Hyper-competitive industries
➢ Command and Control
➢ Initiative Driven
➢ Award Winning
Who we were…

© 2007 - 2017 Milliken Design, Inc.
Life after Awards and Initiatives
We were not sustaining the gains…

© 2007 - 2017 Milliken Design, Inc.
Over
125CorporateInitiatives
People Excellence Era
1980 to 1985
1985 to 1990
Process Excellence Era
1990 to 1996
Business Excellence Era
1996 to 2017
Implementation of theMilliken Performance System
1980
1985
1990
2017
Evolution of Operational Excellence

© 2007 - 2017 Milliken Design, Inc.
The Performance System

© 2007 - 2017 Milliken Design, Inc.
1994
25
Benchmarking World-Class Manufacturing Practices
Study Missions to Japan

© 2007 - 2017 Milliken Design, Inc.
# of Companies Reporting ImprovementMeasurement
6
7
9
8
9
85%
74%
92%
32%
61%
Claims
Defects
Breakdowns
Process Reliability /
OEE
ProductivityMilliken sent 120
managers on 4
Study Mission
Trips
Japan Study Mission Results 1994-1996

© 2007 - 2017 Milliken Design, Inc.
Western
Management 40%Daily Operations
60%Firefighting
The Best
in Japan20%Daily
Operations
Routine
20%Firefighting
Working Through
Cross-Functional Teams
60%Continuous Improvement/
Innovation
The Leadership Challenge

© 2007 - 2017 Milliken Design, Inc.
Milliken Hires Japanese Consultants

© 2007 - 2017 Milliken Design, Inc.

© 2007 - 2017 Milliken Design, Inc.
# of Japanese
Companies Reporting
Japanese Improvement
(Historical)Measurement
_
7
9
8
9
74%
92%
32%
61%
36%Safety
80%Defects
88%Breakdowns
30%Process
Reliability / OEE
78%Productivity
MillikenImprovement
(OE Journey)
Performance System results

© 2007 - 2017 Milliken Design, Inc.
Management
System
Reliance on experience
Individual Management
Systems
Improved knowledge
Standard work for leaders & operators
Approach Tools/ initiative driven
(unsustainable)
Training Variation in operatorsJobs, training, and operators use
standard methods
Attitude Acceptance of waste Waste elimination
Improvement Incremental,
unsustainableBreak-through; sustainable
Communication Little, infrequent ROI is clear at all levels
Common language, common process
(Sustainable)
The Benefits of Milliken Performance SystemSpring Management Conference
ConclusionsMilliken Performance System Transitions
Before After

© 2007 - 2017 Milliken Design, Inc.
What are the keys to building a
sustainable performance system?

© 2007 - 2017 Milliken Design, Inc.
Embrace Zero Loss Thinking
• Strong benevolent discontent
• Stop measuring success internally
• Celebrate the RED as opportunity
Key to Implementation - #1

© 2007 - 2017 Milliken Design, Inc.
Absolute minimum cost required
to manufacture a product
(theoretical cost)
Cost
Reduction
Opportunity
The
difference
between
actual cost
& ideal cost
Loss
Actual CostTotal real dollars spent to
manufacture a product.
Ideal Cost
What is a Loss?

© 2007 - 2017 Milliken Design, Inc.
What is Zero Loss Thinking?

© 2007 - 2017 Milliken Design, Inc.
1. Equipment Failure
2. Set-up & Adjustment
3. Cutting Blade Change
4. Start-up
5. Minor Stoppage & Idling
6. Speed
7. Defect & Rework
8. Shutdown
9. Management
10. Operating Motion
11. Line Organization
12. Logistics
13. Measurement & Adjustment
14. Energy
15. Die, Tool & Jig
16. Yield
JIPM Losses
1. Breakdowns
2. Change Over
3. Start-Up & Shutdown
4. Minor Stops
5. PM & Cleaning Downtime
6. Planning
7. Material Handling
8. Speed Loss
9. Off-Quality
10. Rework
11. Waste
12. Obsolescence
13. Allowances
14. Inventory Variances
15. Training
16. Inspection & Testing
17. Indirect Materials
18. Purchase Price Variance/Claims
19. Over/Under Spending
20. Spending not Captured
Milliken Losses
Loss Categories
© 2007 - 2017 Milliken Design, Inc.
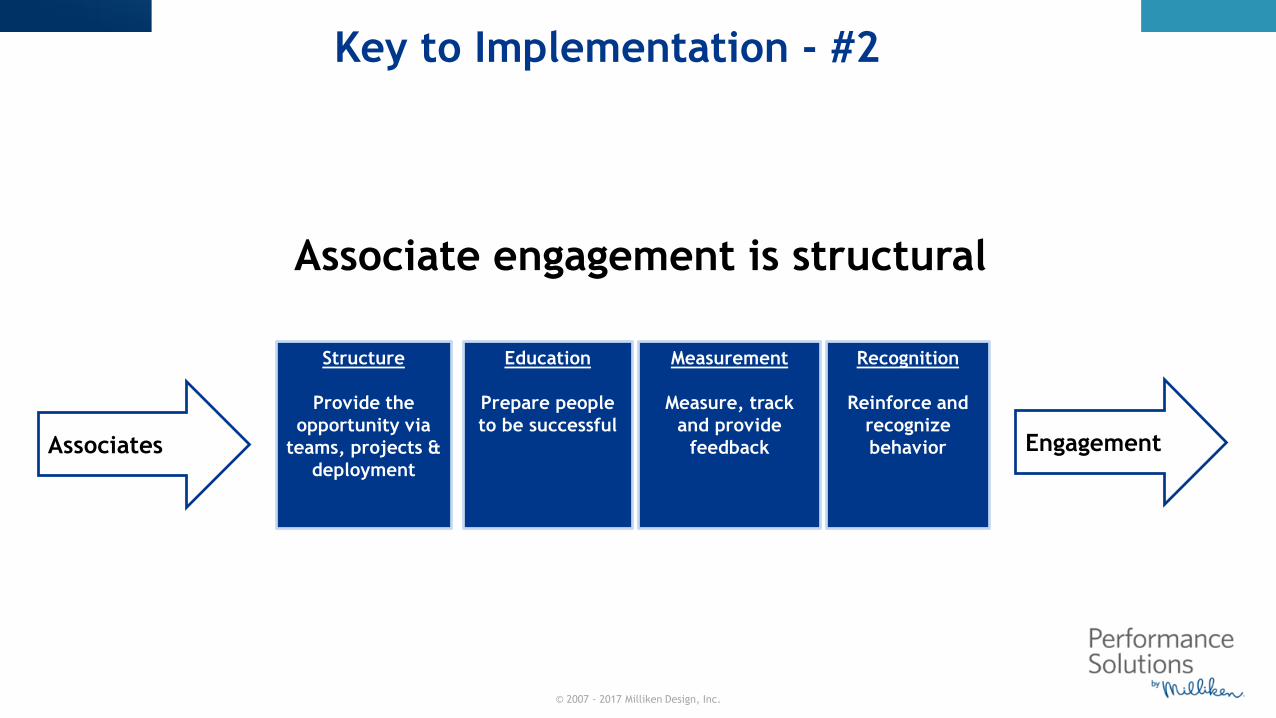
Associate engagement is structural
EngagementAssociates
Structure
Provide the
opportunity via
teams, projects &
deployment
Education
Prepare people
to be successful
Measurement
Measure, track
and provide
feedback
Recognition
Reinforce and
recognize
behavior
Key to Implementation - #2

© 2007 - 2017 Milliken Design, Inc.
• Facts and data must trump emotions/political power
• Process health monitored more than results
• Results, without showing process, not celebrated
• Trust the process – success begets confidence
Become process thinkers
Key to Implementation - #3
© 2007 - 2017 Milliken Design, Inc.
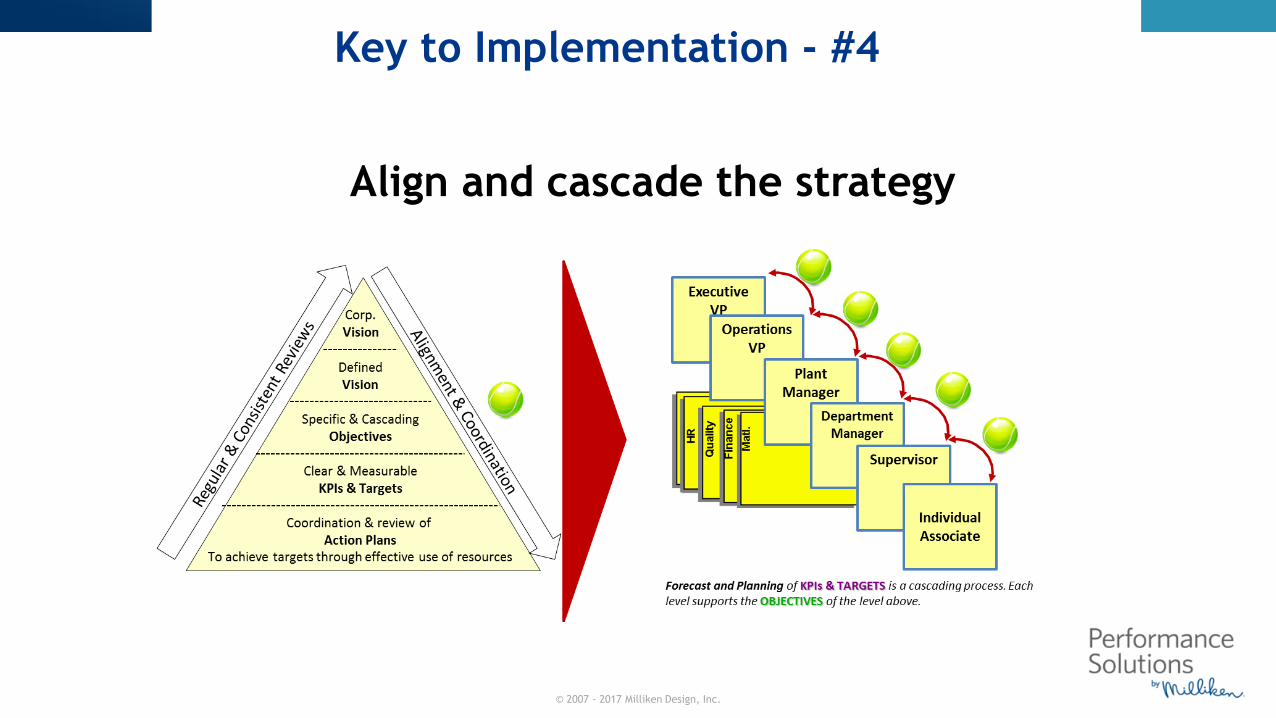
Key to Implementation - #4
Align and cascade the strategy

© 2007 - 2017 Milliken Design, Inc.25
Key to Implementation - #5
Translate system success to financial results
quickly and consistently

© 2007 - 2017 Milliken Design, Inc.
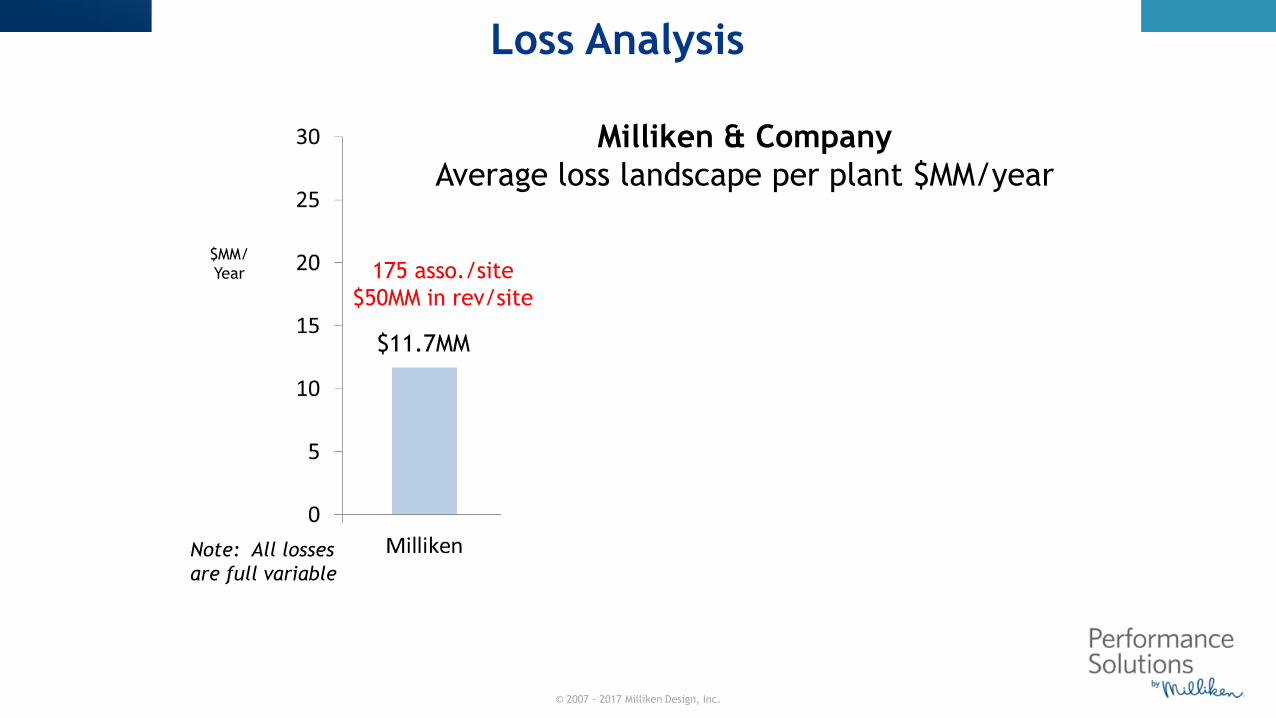
$11.7MM
$MM/
Year
Milliken & Company
Average loss landscape per plant $MM/year
Note: All losses
are full variable
175 asso./site
$50MM in rev/site
Loss Analysis
© 2007 - 2017 Milliken Design, Inc.
$11.7MM
175 asso./site
$50MM in rev/site
$MM/
Year
Milliken & Company
Average loss landscape per plant $MM/year
Note: All losses
are full variable
Loss Analysis
© 2007 - 2017 Milliken Design, Inc.
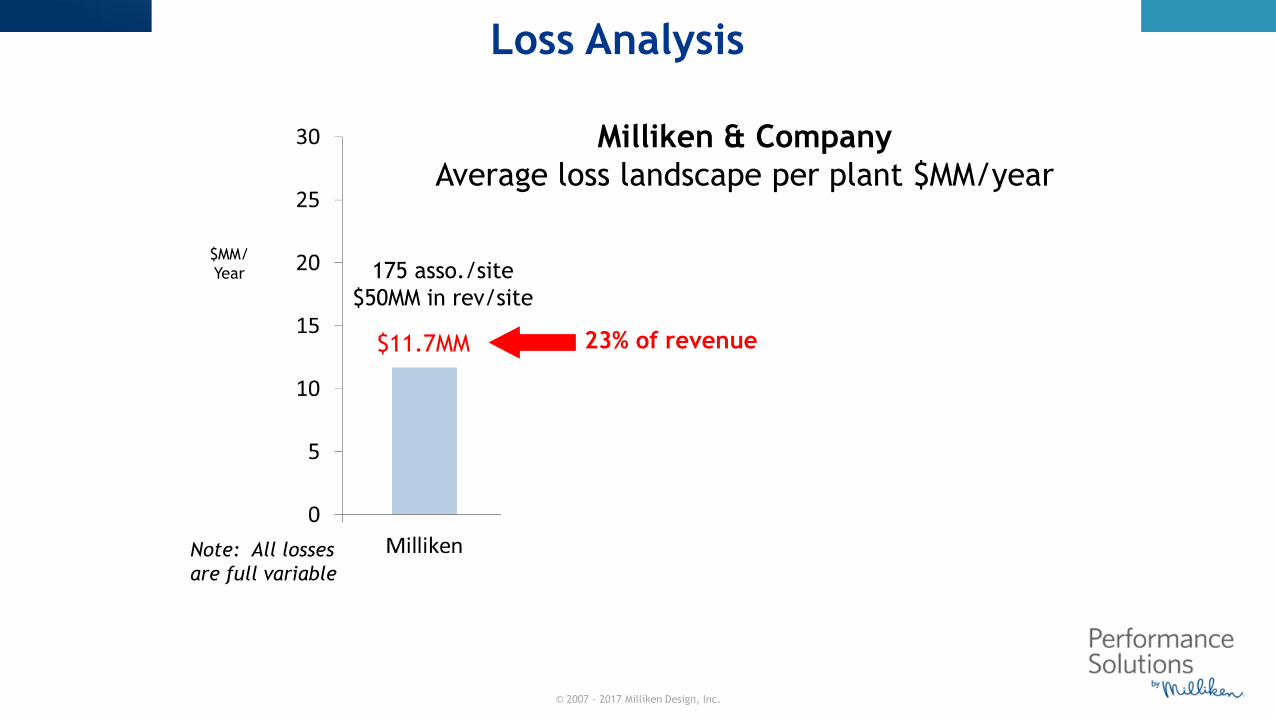
$11.7MM
175 asso./site
$50MM in rev/site
23% of revenue
$MM/
Year
Milliken & Company
Average loss landscape per plant $MM/year
Note: All losses
are full variable
Loss Analysis

© 2007 - 2017 Milliken Design, Inc.
$11.7MM
175 asso./site
$50MM in rev/site
Milliken & Company
reduced losses 30% on average per
plant within the first 24 monthsof implementation
of the Milliken Performance System
$3.5 million reduction
per plant
$MM/
Year
Milliken & Company
Average loss landscape per plant $MM/year
Note: All losses
are full variable
Loss Analysis

© 2007 - 2017 Milliken Design, Inc.
Cost
of
Goods
Sold
Fixed
Cost
Raw
Material
Cost
Variable
Cost
Zero-BasedCost Opportunity
In 1995
Losses
57%
57% of COGS (excluding raw
material but including yield
losses) was identified as a LOSS
Losses
30%
By 2016, we had
reduced LOSSES by
45% (from 57% of
COGS to 30% of
COGS)
LOSSES became 30% of COGS
(excluding raw material but
including yield losses) was
identified as a LOSS
Loss Analysis
© 2007 - 2017 Milliken Design, Inc.
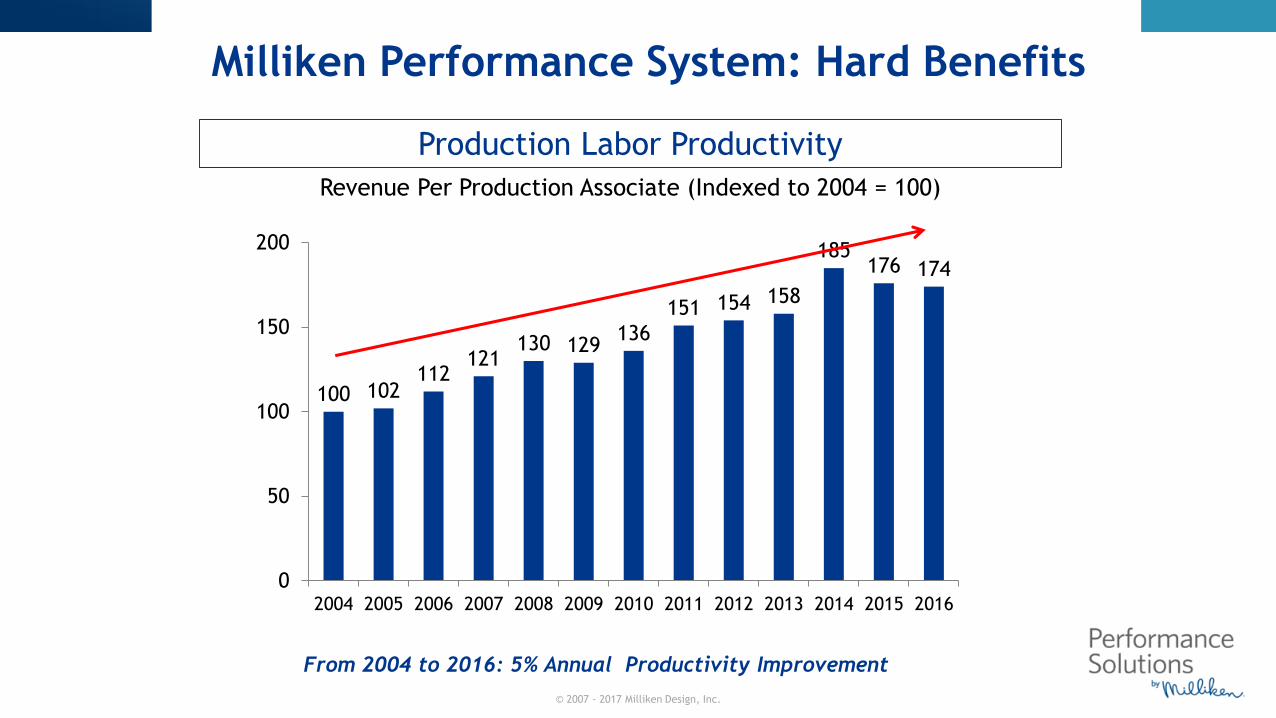
Milliken Performance System: Hard Benefits
Production Labor Productivity
100 102112
121130 129
136
151 154 158
185176 174
0
50
100
150
200
2004 2005 2006 2007 2008 2009 2010 2011 2012 2013 2014 2015 2016
Revenue Per Production Associate (Indexed to 2004 = 100)
From 2004 to 2016: 5% Annual Productivity Improvement
© 2007 - 2017 Milliken Design, Inc.
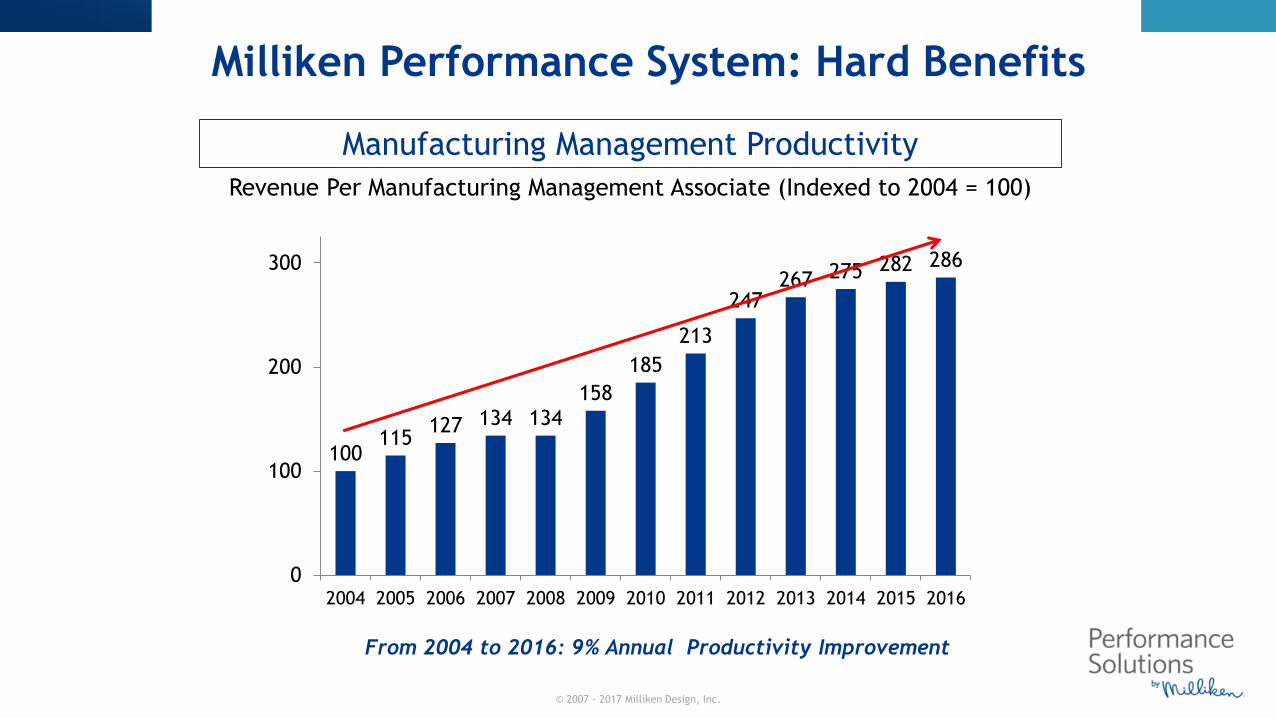
Milliken Performance System: Hard Benefits
Manufacturing Management Productivity
100115
127 134 134158
185
213
247267 275 282 286
0
100
200
300
2004 2005 2006 2007 2008 2009 2010 2011 2012 2013 2014 2015 2016
Revenue Per Manufacturing Management Associate (Indexed to 2004 = 100)
From 2004 to 2016: 9% Annual Productivity Improvement

© 2007 - 2017 Milliken Design, Inc.
Milliken Revenue and Earnings Since 2004
100 98 104 106 10481
94105 108 108
122 127 128
0
50
100
150
200
2004 2005 2006 2007 2008 2009 2010 2011 2012 2013 2014 2015 2016
100134
205261 290
146
229271
327378
427480
602
0
100
200
300
400
500
600
2004 2005 2006 2007 2008 2009 2010 2011 2012 2013 2014 2015 2016
Revenue
Earnings
2% CAGR
16% CAGR

© 2007 - 2017 Milliken Design, Inc.
400 + Operations27 Countries
• Food & Beverage• Glass• Steel Manufacturing• Agribusiness• Packaging• Paper Manufacturing and Converting• Construction• Chemicals• Non-wovens• Consumer Packaged Goods
Industries
Performance Solutions by Milliken