Performance Review Unit - ATM Seminar · • Cooperative process ... – Identify areas for...
12
Performance Review Unit Performance Review Unit Five Years Experience in ATM Cost Benchmarking 7th USA/Europe ATM 2007 R&D seminar 2 July 2007 Presentation by Sebastien Portet EUROCONTROL Performance Review Unit
Transcript of Performance Review Unit - ATM Seminar · • Cooperative process ... – Identify areas for...
Per
form
ance
Rev
iew
Uni
tP
erfo
rman
ce R
evie
w U
nit
Five Years Experience in ATM Cost Benchmarking
7th USA/Europe ATM 2007 R&D seminar2 July 2007
Presentation by Sebastien Portet EUROCONTROL Performance Review Unit
2
Performance Review Unit
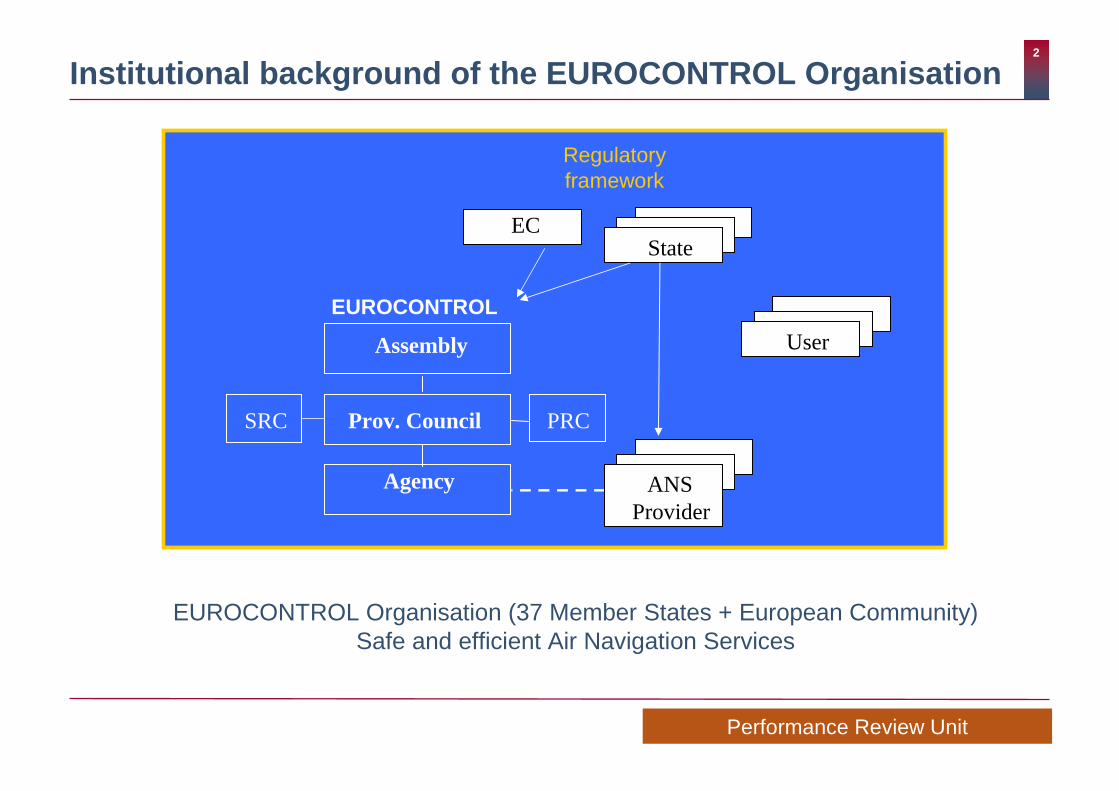
Institutional background of the EUROCONTROL Organis ation
EUROCONTROL Organisation (37 Member States + European Community)Safe and efficient Air Navigation Services
EC
NSAs
ANSProvider
PRC
Agency
Prov. Council
Assembly
State
SRC
User
EUROCONTROL
Regulatoryframework
EC

3
Performance Review Unit
Performance Review Commission (PRC)
• Since 1998
• Independent expert commission
• Monitor & analyse ATM performance– Produce Annual Performance Review Reports
– ATM KPAs (Safety, Capacity/Delays, Flight efficiency, Cost-effectiveness);– Special items;
– Electronic versions of the Reports available on PRC website:www.eurocontrol.int/prc/public/standard_page/doc_prr.html
• Make recommendations on target setting
• Not economic regulator
“to ensure effective management of the European air t raffic management system through a strong, transparent and
independent performance review system”
4
Performance Review Unit
Economic Information Disclosure
• En-route Air Navigation Services Providers� statutory monopolies
• Decision No. 88 of the EUROCONTROL Commission in Nov. 2001
– Mandatory provision of economic and related information by Air Navigation Service Providers (ANSPs)
– Allow PRC/PRU to discharge its performance review role in the field of cost-effectiveness and produce detailed benchmarking analysis
• Reduce asymmetry of information
• Allow sound quantitative analysis
5
Performance Review Unit
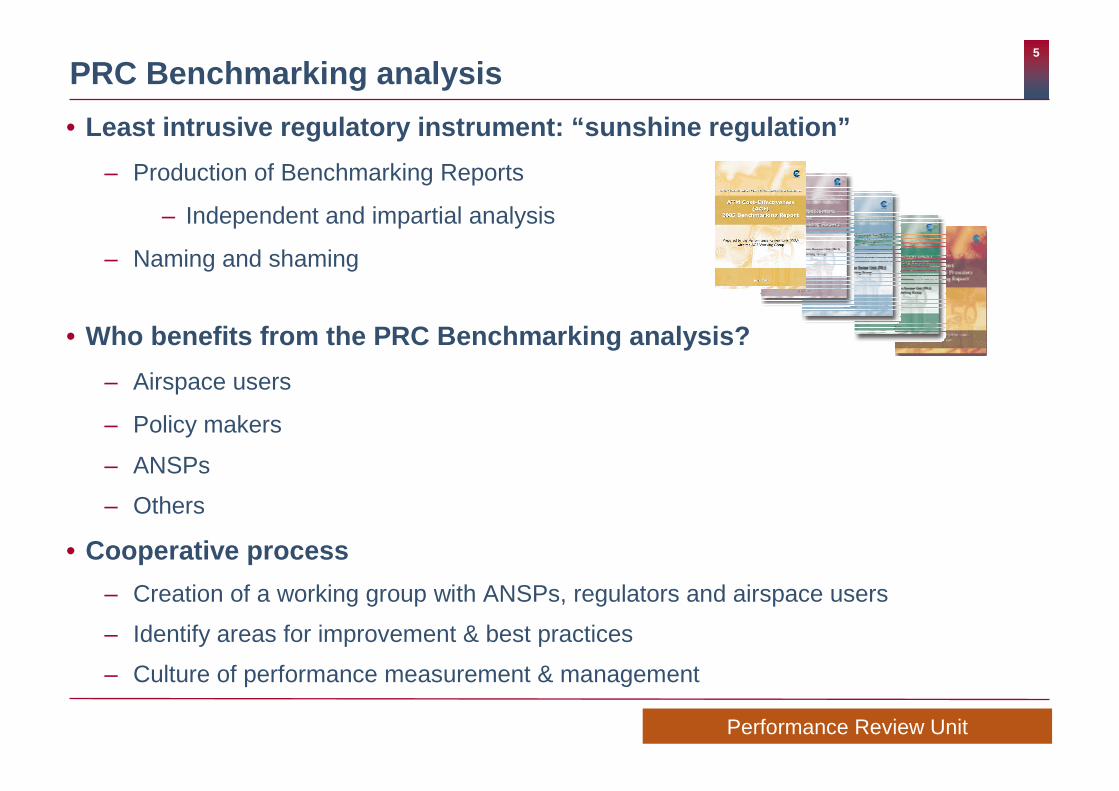
PRC Benchmarking analysis
• Least intrusive regulatory instrument: “sunshine regula tion”
– Production of Benchmarking Reports
– Independent and impartial analysis
– Naming and shaming
• Who benefits from the PRC Benchmarking analysis?
– Airspace users
– Policy makers
– ANSPs
– Others
• Cooperative process
– Creation of a working group with ANSPs, regulators and airspace users
– Identify areas for improvement & best practices
– Culture of performance measurement & management

6
Performance Review Unit
Range in ANSPs unit costs in 2005
Factual indicator: cannot be interpreted as a measure of cost-inefficiency
149
202220
239246251273279281283292292294298
312318322323333341
376384384390414416424
438441465475
490516
675697
0
100
200
300
400
500
600
700
800
Bel
goco
ntro
l
LVN
L
Aen
a
AT
SA
Bul
garia
EN
AV
RO
MA
TS
A
DF
S
NA
V P
ortu
gal (
FIR
Lis
boa)
NA
TS
MK
CA
A
Sky
guid
e
LPS
NA
TA
Alb
ania
DS
NA
Aus
tro
Con
trol
Oro
Nav
igac
ija
Slo
veni
a C
ontr
ol
UkS
AT
SE
AN
S C
R
Cro
atia
Con
trol
Mol
dAT
SA
DC
AC
Cyp
rus
DH
MI
NA
VIA
IR
MA
TS
Fin
avia
IAA
Avi
nor
HC
AA
PP
L/P
AT
A
AN
S S
wed
en
Hun
garo
Con
trol
MU
AC
LGS
EA
NS
€ pe
r co
mpo
site
flig
ht-h
our
Gate-to-gate ATM/CNSEuropean system average: €395
7
Performance Review Unit
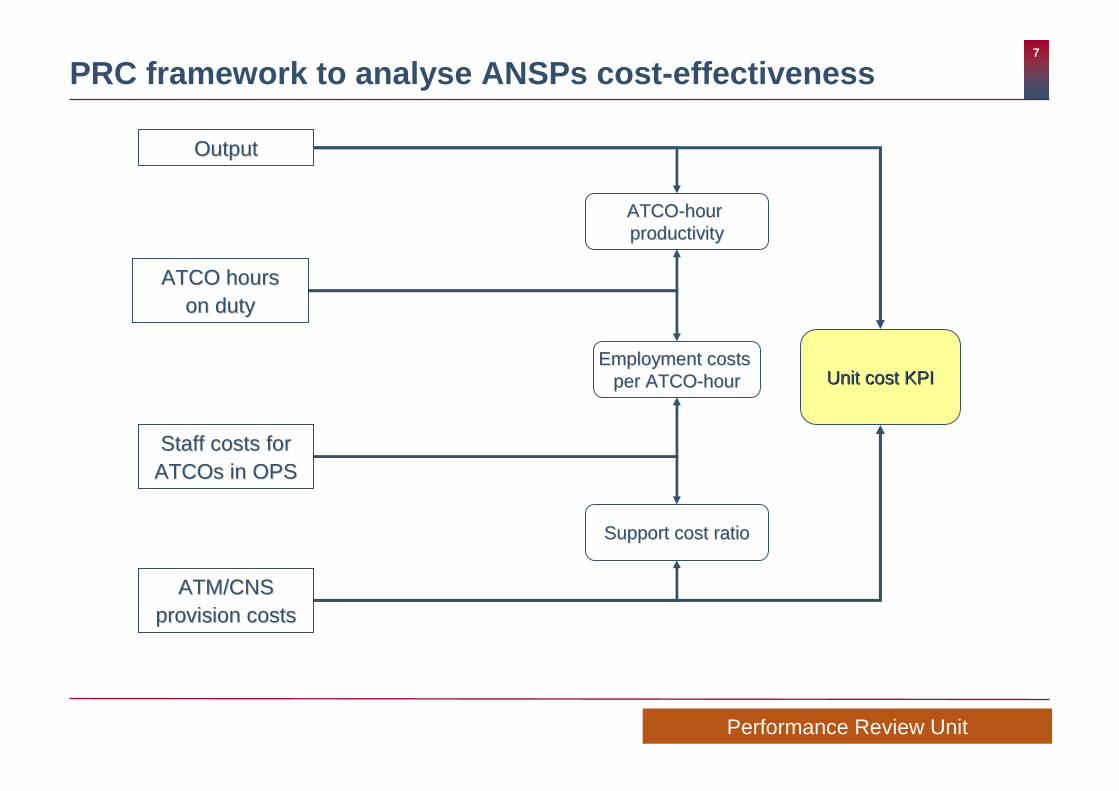
PRC framework to analyse ANSPs cost-effectiveness
Staff costs for Staff costs for ATCOsATCOs in OPSin OPS
OutputOutput
ATCO hours ATCO hours on dutyon duty
ATM/CNS ATM/CNS provision costsprovision costs
Support cost ratioSupport cost ratio
ATCOATCO--hour hour productivityproductivity
Employment costs Employment costs per ATCOper ATCO--hourhour Unit cost KPIUnit cost KPI
8
Performance Review Unit
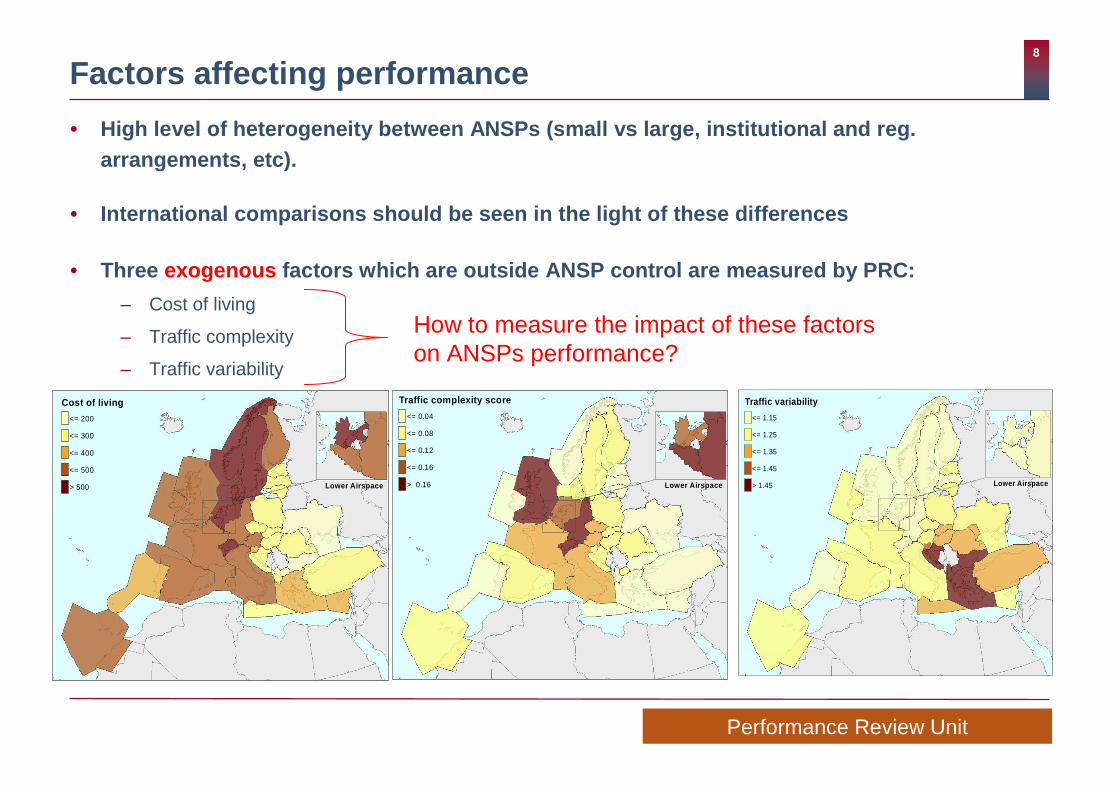
Factors affecting performance
• High level of heterogeneity between ANSPs (small vs large, institutional and reg. arrangements, etc).
• International comparisons should be seen in the lig ht of these differences
• Three exogenous factors which are outside ANSP control are measured by PRC:
– Cost of living
– Traffic complexity
– Traffic variability
How to measure the impact of these factors on ANSPs performance?
Lower Airspace
Cost of living
<= 200
<= 300
<= 400
<= 500
> 500 Lower Airspace
Traffic complexity score
<= 0.04
<= 0.08
<= 0.12
<= 0.16
> 0.16 Lower Airspace
Traffic variability
<= 1.15
<= 1.25
<= 1.35
<= 1.45
> 1.45
9
Performance Review Unit
Econometric cost benchmarking of ANSPs
• Moving form a factual analysis to a normative analysi s of cost-effectiveness
• PRU in collaboration with economic consultants (NERA ) carried out a comprehensive econometric analysis of ANSPs costs
• ACE data set comprises both cross-sectional and time series data (panel data)
– 32 ANSPs
– 4 years of observations
• Several technical and methodological challenges to b e resolved
– High level of heterogeneity (observed and unobserved) in ACE data set

10
Performance Review Unit
Econometric cost benchmarking: cost function specif ication
• Specification of a classical cost function
– C = function of (output(s), input prices, operational characteristics, complexity, cost of living, etc…)
– Impact of measured exogenous factors can be directly estimated
• Panel data estimation methodology
– Allow to control for unobserved differences between ANSPs
• Need robust and well suited econometric techniques to assess inefficiencies
• To our knowledge: first application of econometric the ory to ANSperformance measurement
11
Performance Review Unit
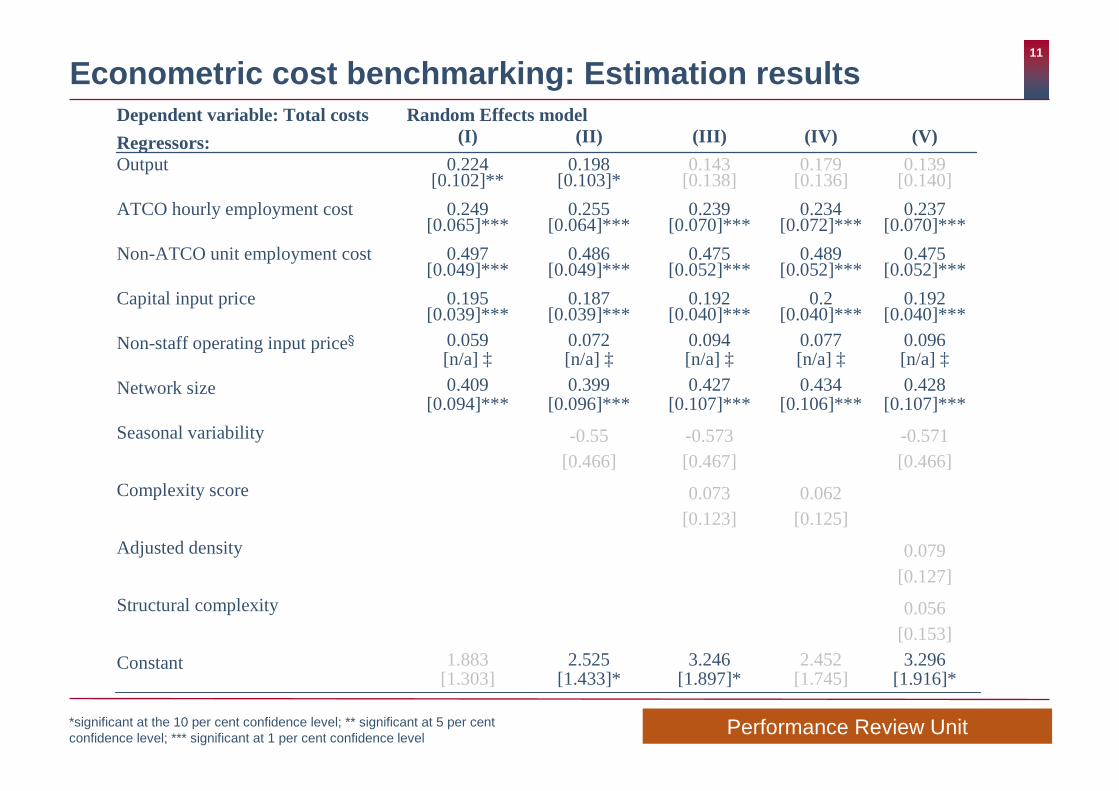
Econometric cost benchmarking: Estimation results
[1.916]*[1.745][1.897]*[1.433]*[1.303]3.2962.4523.2462.5251.883Constant
[0.153]0.056Structural complexity
[0.127]0.079Adjusted density
[0.125][0.123]0.0620.073Complexity score
[0.466][0.467][0.466]-0.571-0.573-0.55Seasonal variability
[0.107]***[0.106]***[0.107]***[0.096]***[0.094]***0.4280.4340.4270.3990.409Network size
[n/a] ‡[n/a] ‡[n/a] ‡[n/a] ‡[n/a] ‡0.0960.0770.0940.0720.059Non-staff operating input price§
[0.040]***[0.040]***[0.040]***[0.039]***[0.039]***0.1920.20.1920.1870.195Capital input price
[0.052]***[0.052]***[0.052]***[0.049]***[0.049]***0.4750.4890.4750.4860.497Non-ATCO unit employment cost
[0.070]***[0.072]***[0.070]***[0.064]***[0.065]***0.2370.2340.2390.2550.249ATCO hourly employment cost
[0.140][0.136][0.138][0.103]*[0.102]**0.1390.1790.1430.1980.224Output
(V)(IV)(III)(II)(I)Regressors:
Random Effects modelDependent variable: Total costs
*significant at the 10 per cent confidence level; ** significant at 5 per cent confidence level; *** significant at 1 per cent confidence level

12
Performance Review Unit
Econometric cost benchmarking: Conclusions and steps forward
• For time being the focus is on the methodology rather than on the results
– “State of the art” econometric modelling to examine ANSPs cost inefficiencies
– Difficult to draw clear conclusions from the results
– Sophisticated econometric techniques require larger data samples – typically several hundreds of observations !
• Work in progress as the data set expands
– Opportunity to test alternative assumptions with enhanced data disclosure