Performance Review 2010 Monhla Hlahla 21 October 2010
18
Performance Review 2010 Monhla Hlahla 21 October 2010
-
Upload
montana-bush -
Category
Documents
-
view
22 -
download
1
description
Performance Review 2010 Monhla Hlahla 21 October 2010. Table of Contents. 1. Introduction 2. Strategic Deliverables 3. Service Quality Standards 4. Financial Highlights 5. Traffic Performance 6. Capital Expenditure 7. Revenue 8. Financial Statement Overview 9. Key Ratios - PowerPoint PPT Presentation
Transcript of Performance Review 2010 Monhla Hlahla 21 October 2010

Performance Review 2010 Monhla Hlahla21 October 2010
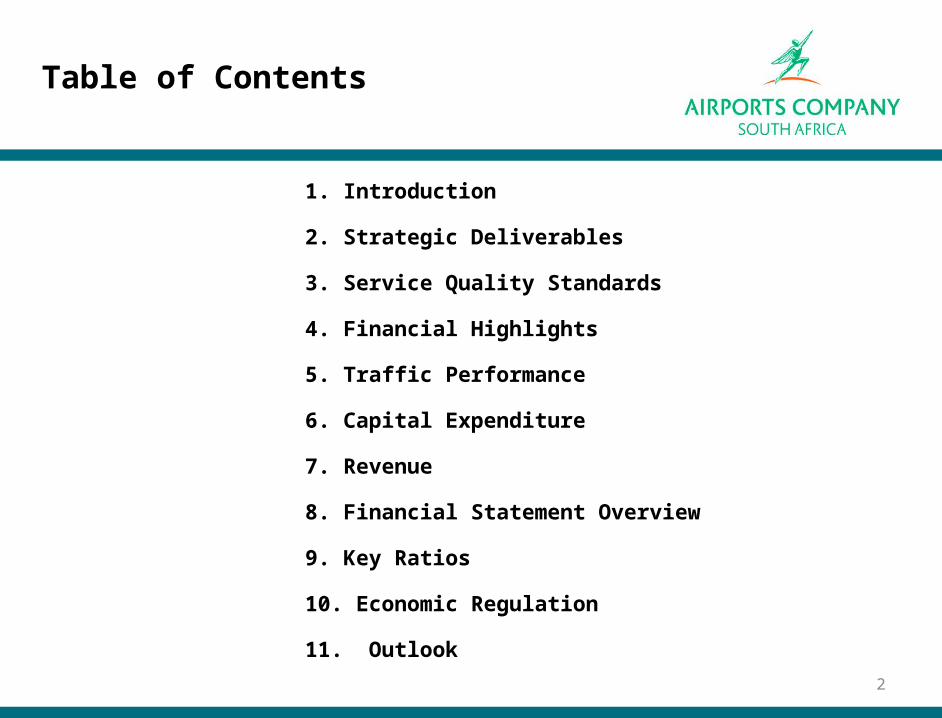
1. Introduction
2. Strategic Deliverables
3. Service Quality Standards
4. Financial Highlights
5. Traffic Performance
6. Capital Expenditure
7. Revenue
8. Financial Statement Overview
9. Key Ratios
10. Economic Regulation
11. Outlook
Table of Contents
2

Introduction
Infrastructure developments successfully delivered on time and forecasto Investment positioned ACSA for future demand and economic growth
o Optimisation of investments key to extracting value for all stakeholders
o Employee development - invaluable experience gained
Obtained the appropriate funding for the capital investment o Optimisation of capital structure
Global economic recovery, albeit uncertaino Positive traffic profile (excl. the FIFA World Cup)
o Strong growth in commercial revenues
o Softened capital markets – reduced interest costs and improved liquidity
Unfavourable economic regulatory outcome
Successful facilitation of the FIFA World Cup 2010
3

Strategic Deliverables
Seamless facilitation of the FIFA 2010 World Cup™
Ensure long term business sustainabilityo Permission Application 2011-2015
o Economic regulatory policy review and direction
o Optimisation of capital structure
Focus on airports operational efficiency o Baggage pilferage reduced
o On-time performance improved – Airport Management Centre (AMC)
Optimising business excellence BBBEE – R7.6 billion from total expenditure of R9.1 billion (11.5% to black women-owned
businesses)
CSI – R11 million direct expenditure
Revenue efficiency
Employee development, succession planning and retention
4
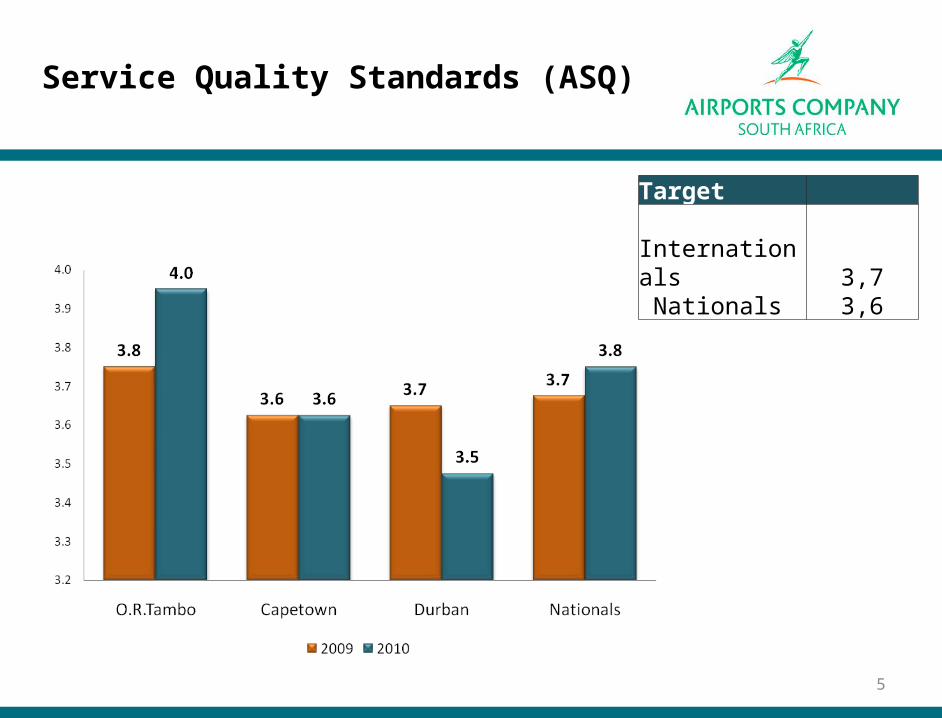
Target Internationals 3,7 Nationals 3,6
Year under review
Service Quality Standards (ASQ)
5

Annual Report and Budget Review Priscillah Mabelane21 October 2010
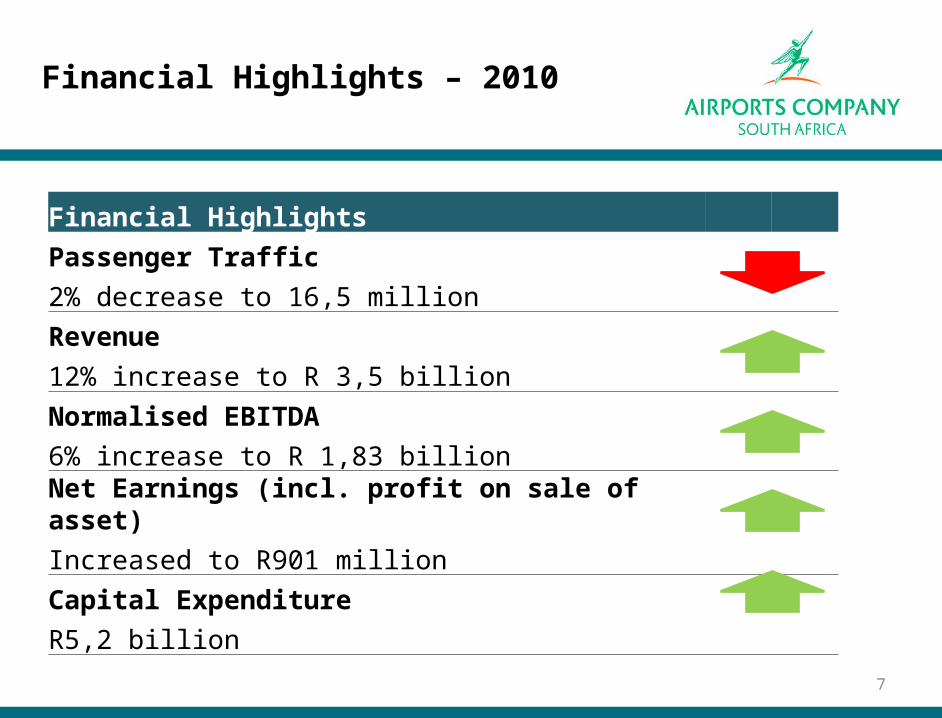
Financial Highlights Passenger Traffic2% decrease to 16,5 million
Revenue12% increase to R 3,5 billion
Normalised EBITDA6% increase to R 1,83 billion
Net Earnings (incl. profit on sale of asset)Increased to R901 million
Capital ExpenditureR5,2 billion
Financials 7
Financial Highlights – 2010

Financials
-1%
-2%
-2%
1% -12%
0,000
8
Departing Passengers

Financials
-2%
3%
-4%
7%
-2%
0,000
9
Aircraft Landings

Major capex spend over the investment cycle to date
King Shaka Intl. - R6,6 billionO.R. Tambo Intl. CTB - R2,3 billionCape Town Intl. CTB - R1,6 billion
Financials
Capital Expenditure
10
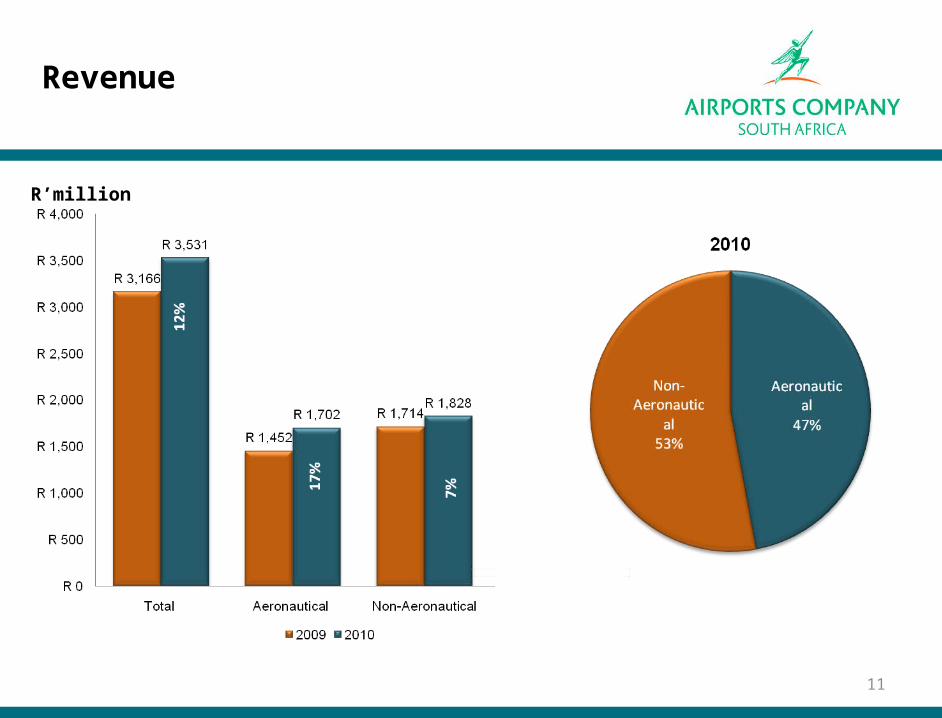
R’million
Financials11
Revenue
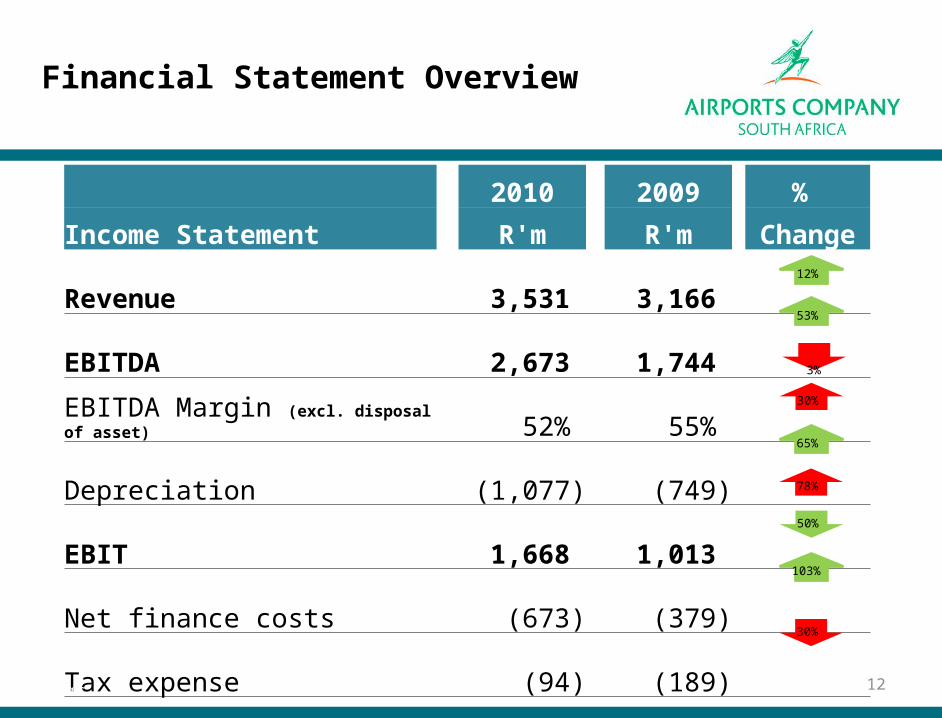
2010 2009 %
Income Statement R'm R'm Change
Revenue 3,531 3,166
EBITDA 2,673 1,744 EBITDA Margin (excl. disposal of asset) 52% 55%
Depreciation (1,077) (749)
EBIT 1,668 1,013
Net finance costs (673) (379)
Tax expense (94) (189)
Net earnings 901 444 Net earnings (excl Profit on disposal) 141 430
Financials
12%
53%
30%
78%
30%
65%
103%
50%
3%
12
Financial Statement Overview

2010 2009 %
Balance Sheet R'm R'm Change
Property, plant and equipment 23,268 18,694
Investment property 2,433 2,265
Other non-current assets 886 682
Current assets 1,303 1,957
Interest bearing borrowings (16,010) (11,948)
Other non-current liabilities (981) (865)
Current liabilities (1,926) (2,704)
Shareholders equity (8,974) (8,081)
24%
7%
30%
34%
13%
29%
33%
11%
Financials 13
Financial Statement Overview

% KEY RATIOS 2010 2009 Change
FINANCIAL
- ROCE 7% 4%
- ROCE (exc disposal of assets) 3% 4%
CREDIT
- EBITDA INTEREST COVER 1.9 1.8
- GEARING (Net debt/Capitalisation) 64% 58%
- NET DEBT/EBITDA 5.8 6.3
1%
7%
3%
3%
12%
Financials 14
Key Ratios

Remuneration of investments only allowed when assets are brought into use
The investment cycle now concluded - thus included in recent tariff application
Convergence of tariff application and outcome
Review of the economic regulatory framework
15
Predictability & consistency of the economic regulatory model is key to a sustainable aviation industry
Predictability & consistency of the economic regulatory model is key to a sustainable aviation industry
Financials 15
Economic Regulation

Outlook Monhla Hlahla21 October 2010

Business sustainability– Economic Regulations– Sale of DIA
Business excellence – Efficient asset utilisation – Leveraging IT– Sustainable environment management systems and design– Leveraging of technical and operational experience gained to support other airports
outside the ACSA network
Develop air traffic growth strategy
Continuous growth in socio-economic impact– Enterprise Development – Industrial Development– Sustainable Airport Communities
Outlook 17
Outlook
Outlook 18
Thank You